Redox-controlled reorganization and flavin strain within the ribonucleotide reductase R2b–NrdI complex monitored by serial femtosecond crystallography
- Department of Biochemistry and Biophysics, Arrhenius Laboratories for Natural Sciences, Stockholm University, Sweden
- MAX IV Laboratory, Lund University, Sweden
- Molecular Biophysics and Integrated Bioimaging Division, Lawrence Berkeley National Laboratory, United States
- Diamond Light Source Ltd, Harwell Science and Innovation Campus, United Kingdom
- Research Complex at Harwell, Harwell Science and Innovation Campus, United Kingdom
- Department of Chemistry - Ångström, Molecular Biomimetics, Uppsala University, Sweden
- Japan Synchrotron Radiation Research Institute, Japan
- RIKEN SPring-8 Center, Japan
- LCLS, SLAC National Accelerator Laboratory, United States
Figures
Figure 1

Activation of the di-manganese centre in ribonucleotide reductase class Ib R2.
Both hydroquinone (hq) and semiquinone (sq) flavin mononucleotide (FMN) of NrdI can reduce molecular oxygen to superoxide, which is shuttled to the metal site in R2b and activates the di-manganese cofactor. FMN is oxidized either to semiquinone or the fully oxidized form (ox) in the process.
Figure 2 with 2 supplements
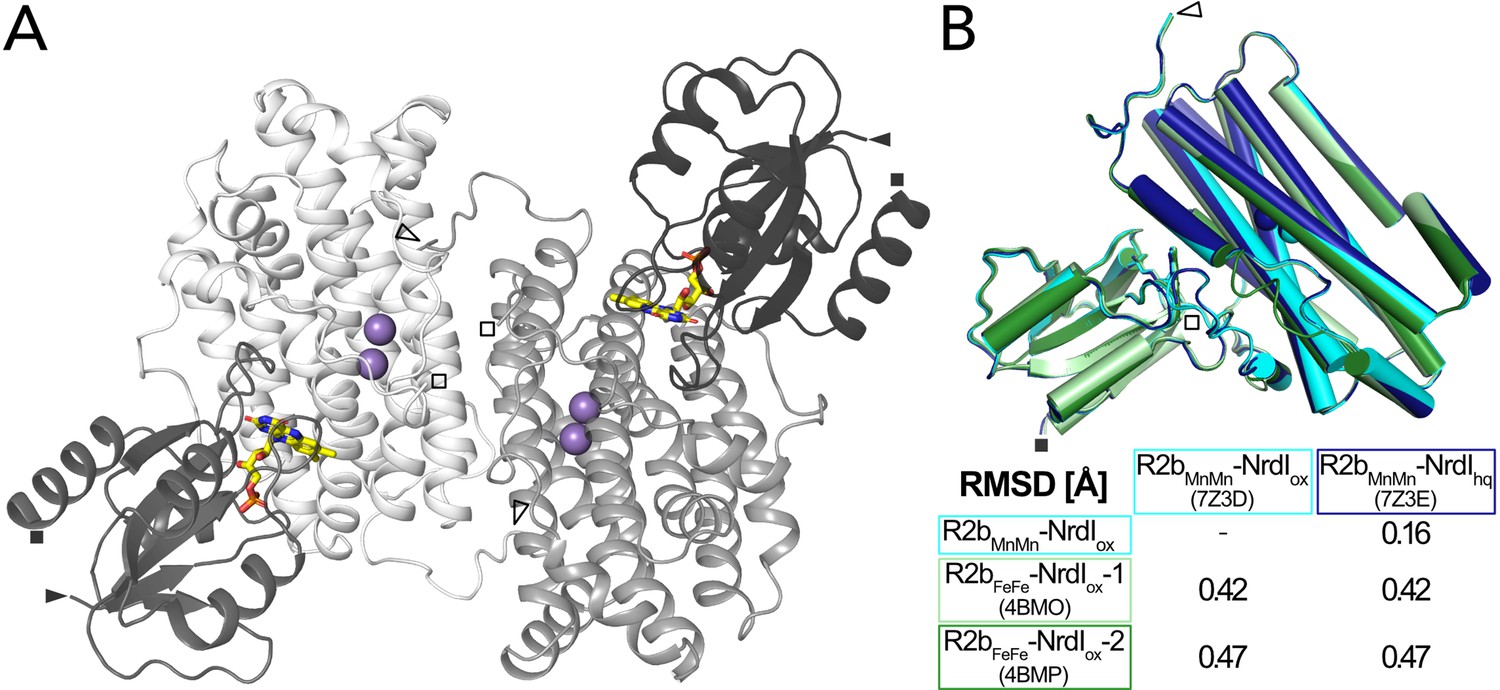
Structure of the BcR2b-NrdI complex.
(A) Structure of the BcR2bMnMn–NrdIox complex (PDB ID: 7Z3D). In each 1:1 R2b–NrdI dimer, R2b and NrdI are coloured in lighter and darker grey, respectively. The second dimer is generated by crystal symmetry. Manganese ions are represented as purple spheres and flavin mononucleotide as yellow sticks at the R2b–NrdI interface. (B) Superimposition of all structures of the BcR2b–NrdI dimer with their corresponding Cα-RMSD in the table. Individual structures are colour coded identically in the figure and the table. Visible N-termini are marked with an arrow (►) and C-termini with a square (◼).
Figure 2—figure supplement 1
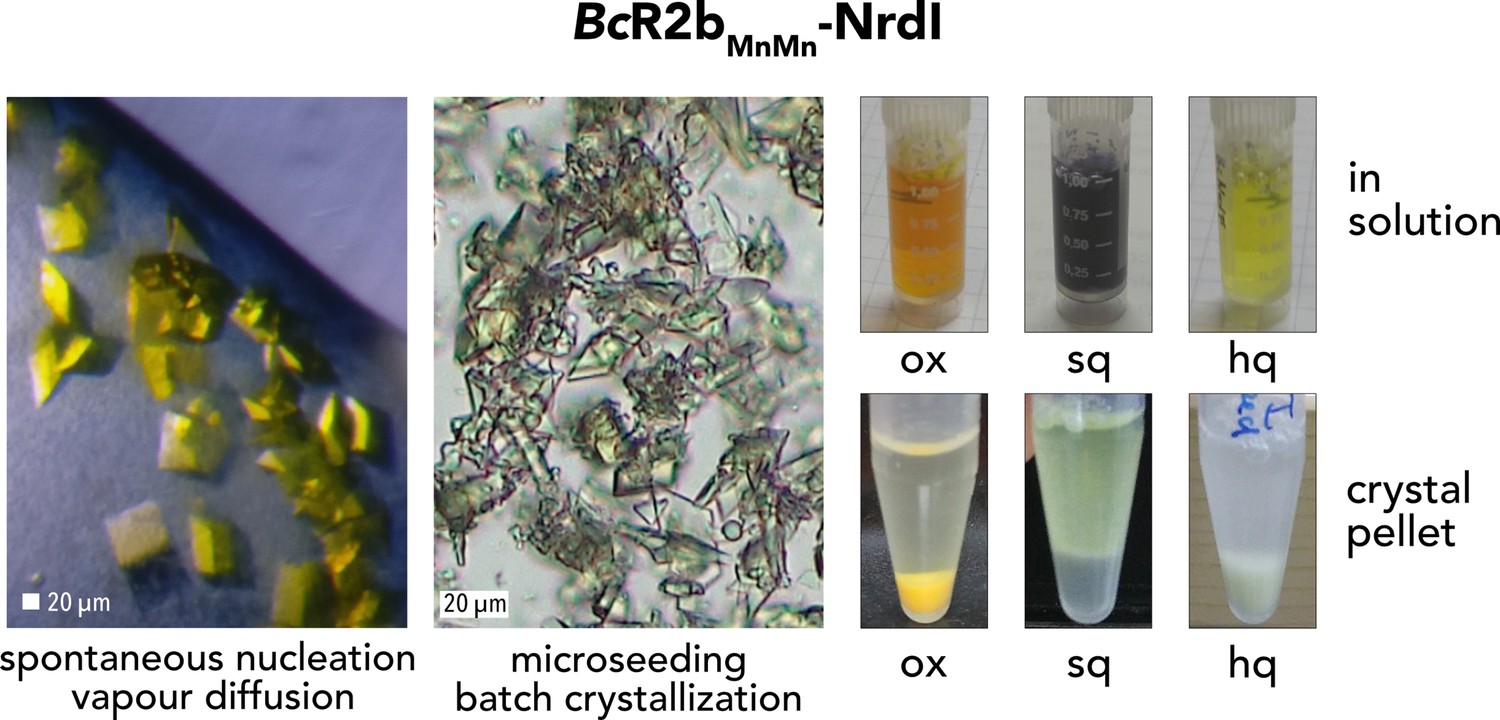
Crystallization of the di-manganese BcR2b–NrdI complex.
Spontaneous nucleation yields crystals of the length of 100 µm or longer. In the batch crystallization, crystals are significantly smaller with most crystals between 20 and 50 µm. For the two pictures on the left side, crystals of the complex with NrdI in the oxidized state are viewed under an optical microscope. On the right side, pictures are shown for the complex in solution (top row) and in crystals (bottom row) with NrdI in the oxidized, semiquinone and hydroquinone states. The oxidation state of flavin mononucleotide changes the colour of the complex in both solution and crystals. The semiquinone state is produced by adding sodium dithionite in increments to solutions or crystals.
Figure 2—figure supplement 2
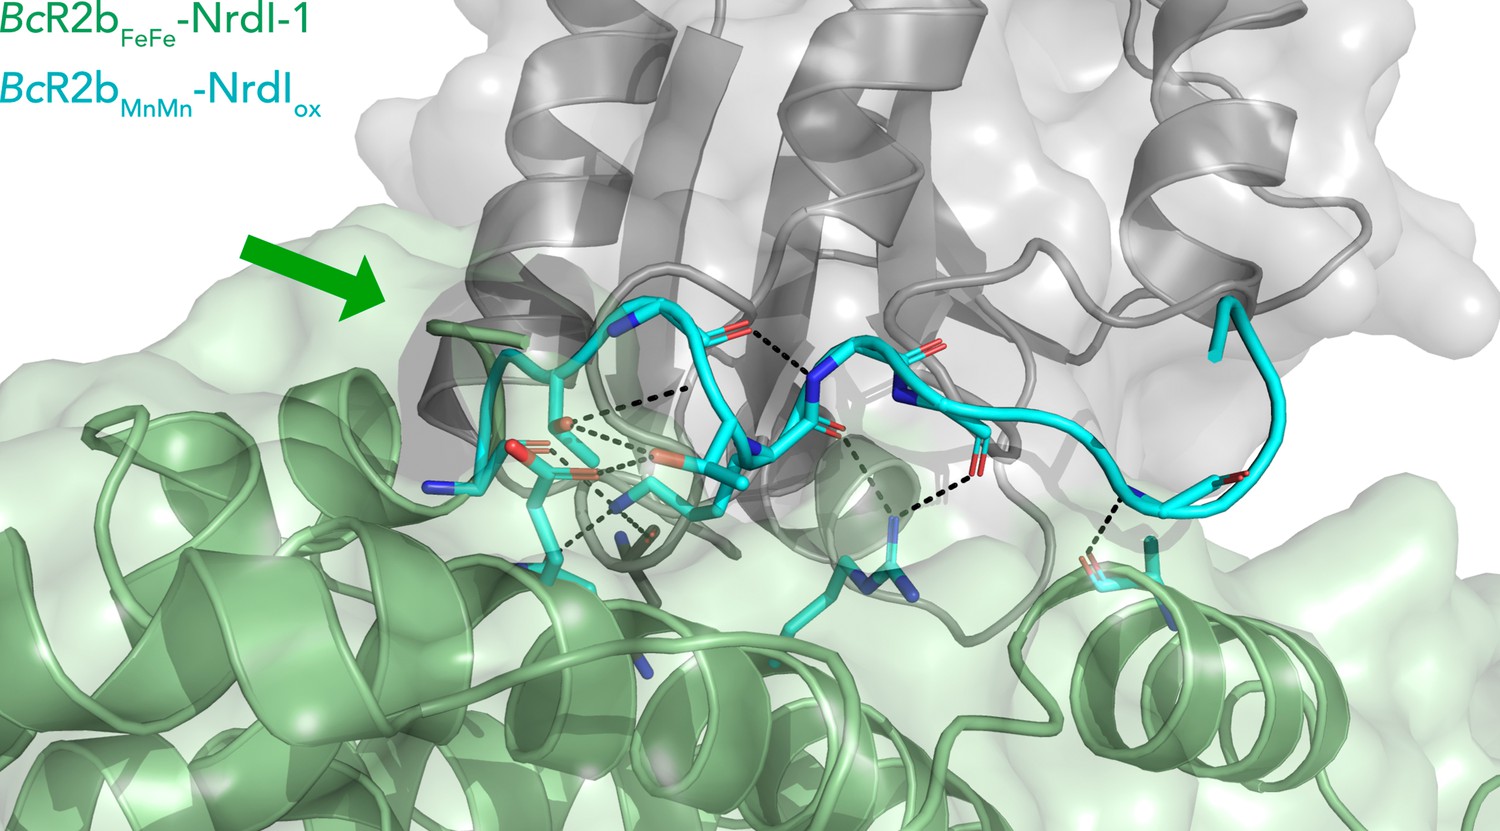
Extended C-terminus of R2b in BcR2bMnMn–NrdIox.
Superposition of BcR2bFeFe–NrdI-1 (PDB ID: 4BMO) (pale green for R2b and grey for NrdI) and BcR2bMnMn–NrdIox (in cyan) showing an extension of the ordered C-terminus of R2b by nine amino acids. The green arrow points towards the C-terminus of BcR2bFeFe–NrdI-1. The C-terminus is situated in a groove between R2b and NrdI; hydrogen bonds are shown with black dashed lines and bonded side chains are shown as sticks.
Figure 3

The physiologically relevant oxidation states of flavin mononucleotide (FMN) in NrdI.
The red dashed line marks the virtual axis between N5 and N10. The ribityl phosphate group is denoted as R.
Figure 4 with 2 supplements
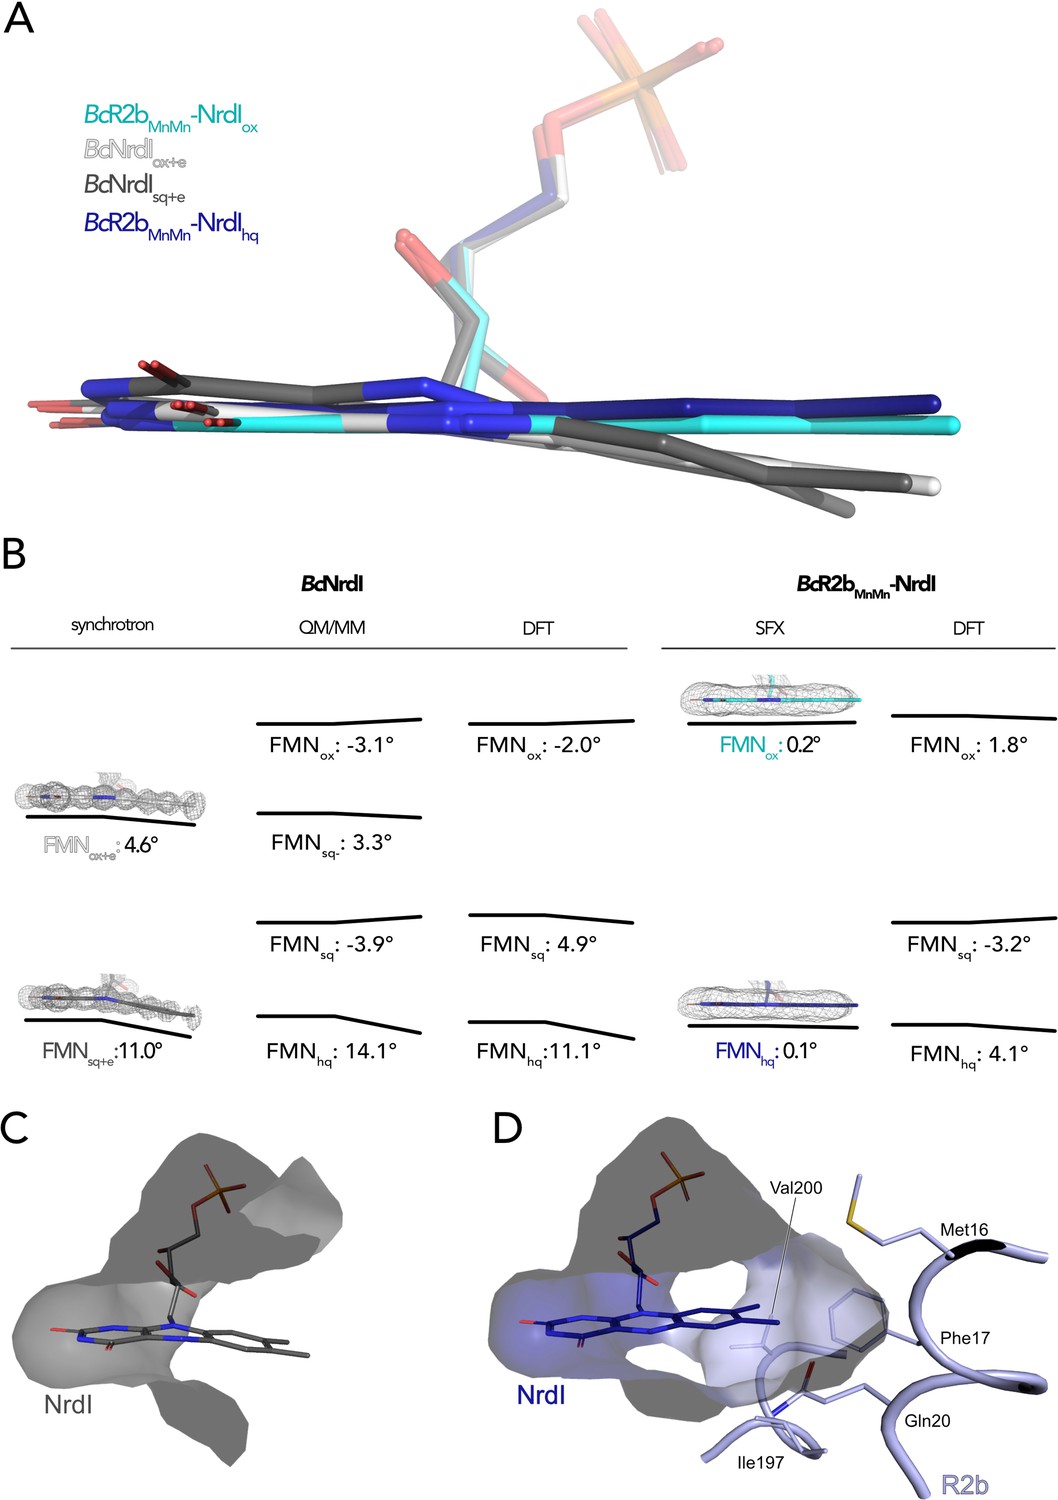
The butterfly bending conformations of flavin mononucleotide (FMN) in different redox states.
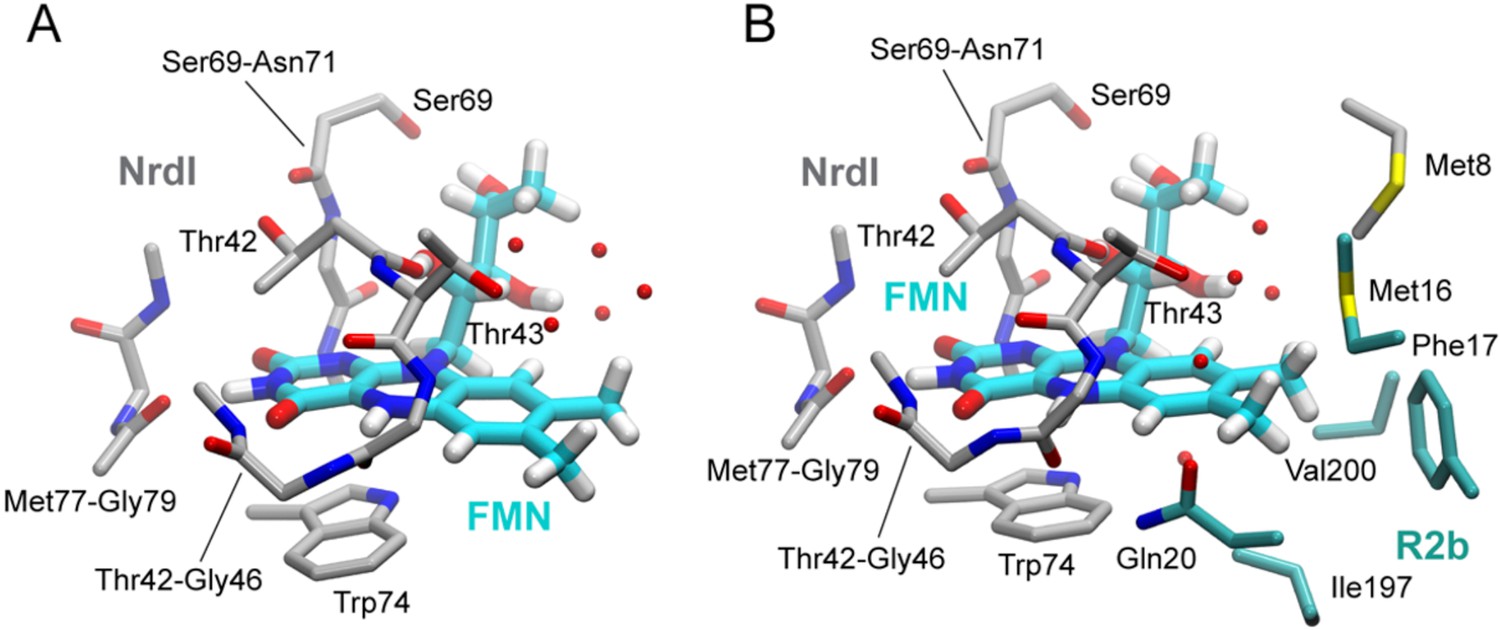
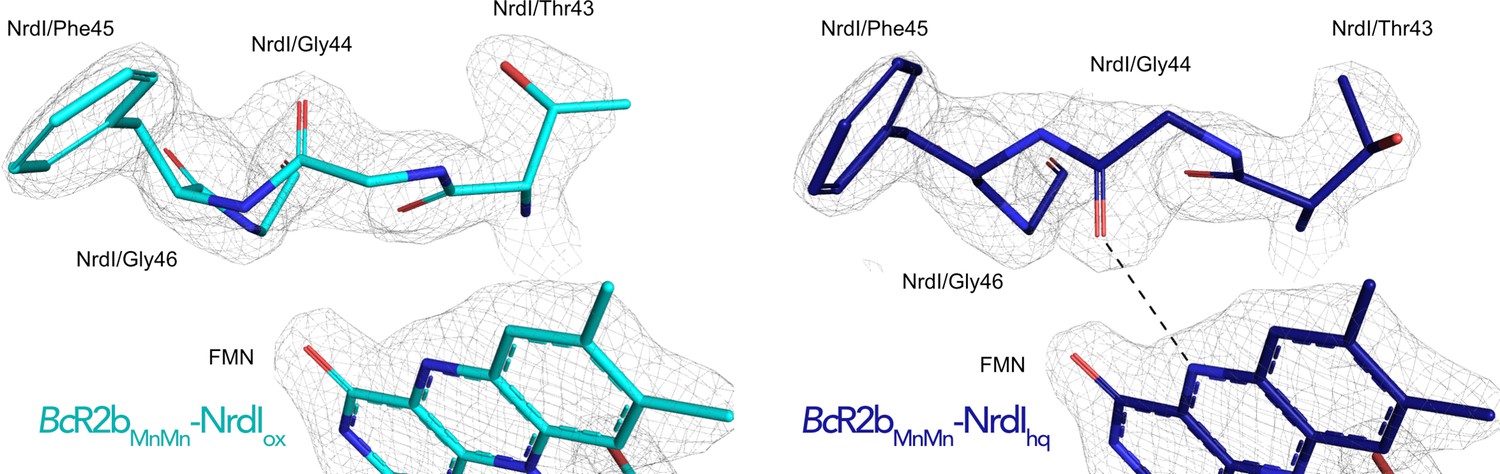
(A) Overlay of FMN cofactors of B. cereus NrdI in different crystal structures: BcR2bMnMn–NrdIhq (dark blue), BcR2bMnMn–NrdIox (cyan), BcNrdIsq+e (dark grey, PDB ID: 2X2P), BcNrdIox+e (white, PDB ID: 2X2O). (B) Comparison of experimentally measured and computationally calculated FMN bending angles for BcNrdI alone and in complex with BcR2b. 2Fo–Fc maps are contoured at 2 σ for synchrotron and serial femtosecond crystallography (SFX) structures, the models used are the same as in panel A and color-coded identically. Theoretical butterfly angles obtained by quantum mechanics/molecular mechanics (QM/MM) calculations by Røhr et al., 2010 and compared to angles obtained by density functional theory (DFT) calculations in this work. (C) The benzene ring of FMN in BcNrdIsq+e (PDB ID: 2X2P) is solvent exposed. (D) In BcR2bMnMn–NrdIhq, the FMN-binding pocket is closed by residues contributed by R2b. Relevant residues are shown in sticks. The surface of the FMN-binding pocket in NrdI in panels (C) and (D) is shown in grey.
Figure 4—figure supplement 1

Flavin mononucleotide (FMN) in Bacillus anthracis NrdIox+e.
FMN butterfly bend and electron density from BaNrdIox+e (PDB ID: 2XOD).
Figure 4—figure supplement 2
Density functional theory (DFT) calculations.
(A) DFT cluster model of the NrdI:FMN systems with 169–170 atoms. (B) DFT cluster model of R2b–NrdI:FMN systems with 245–246 atoms.
Figure 5 with 3 supplements
Flavin mononucleotide (FMN) environment in the oxidized and hydroquinone BcR2b–NrdI complex.
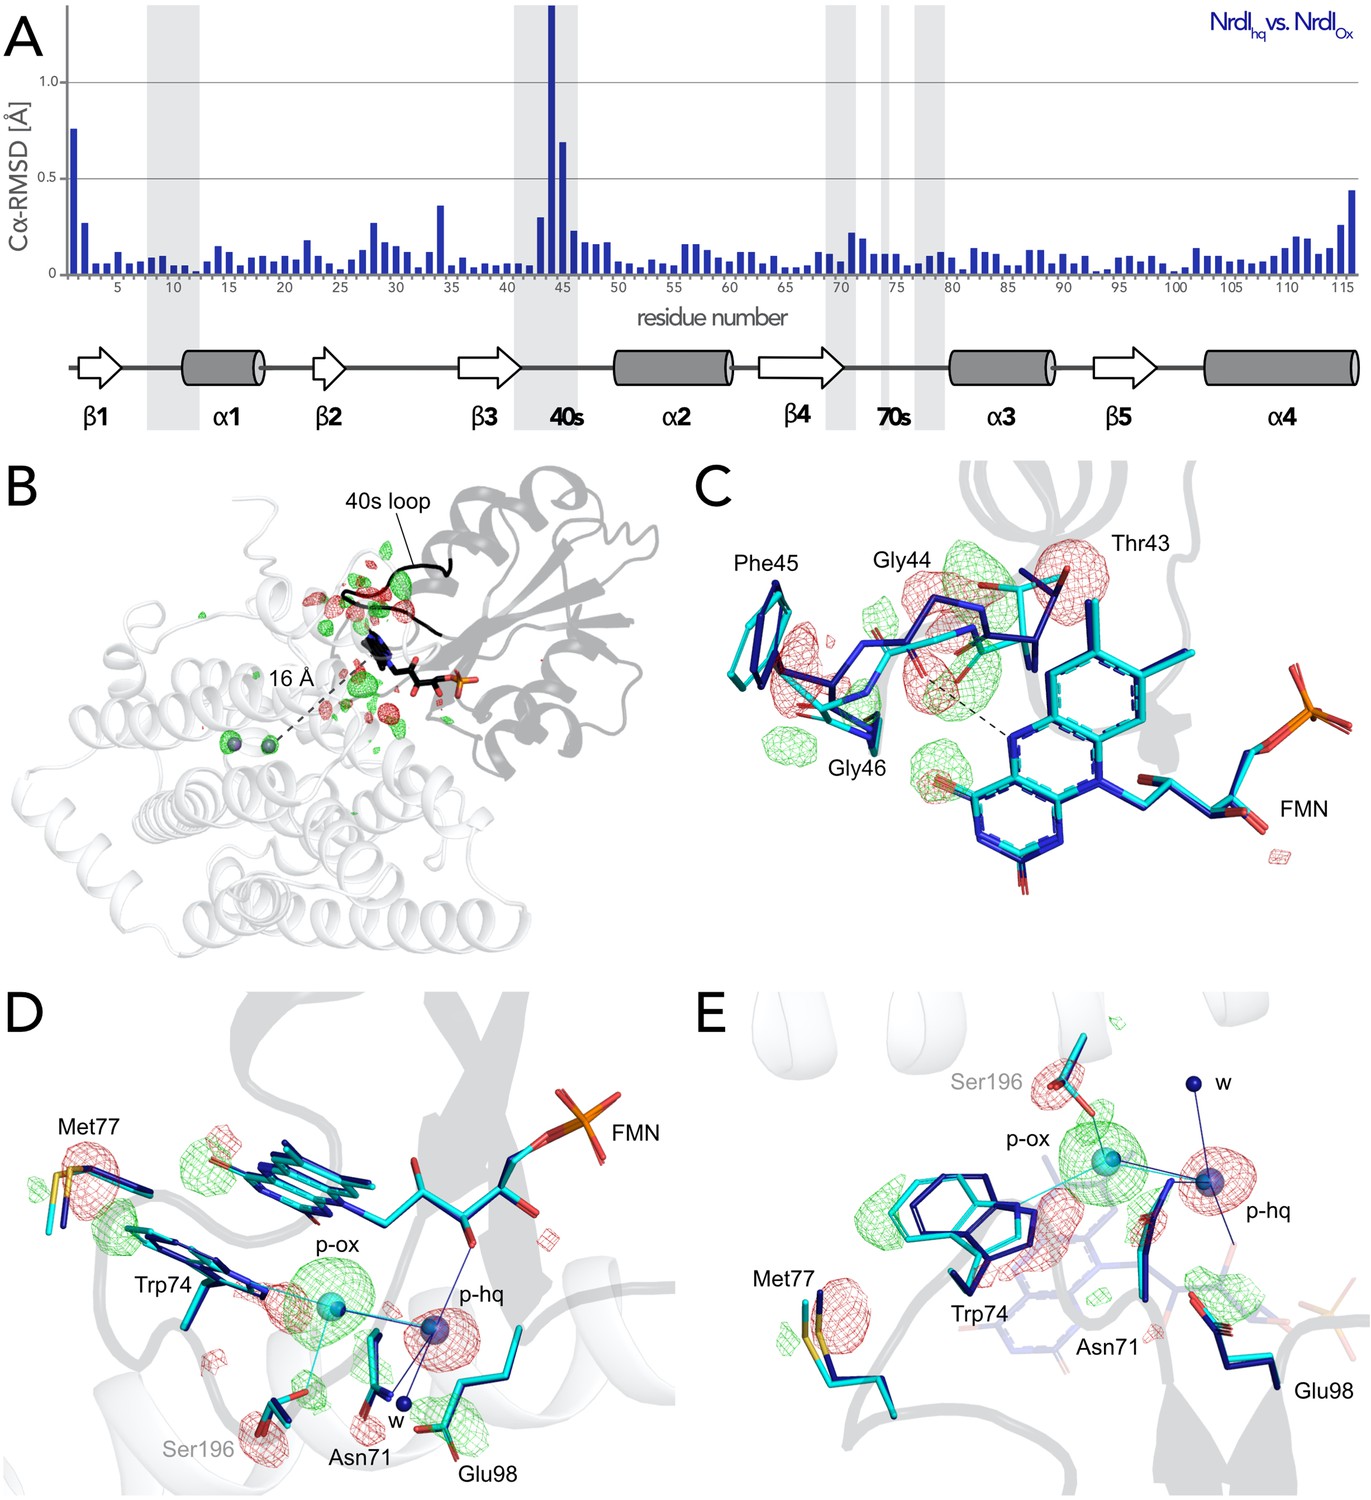
(A) Structural alignment of NrdI in BcR2bMnMn–NrdIox compared to BcR2bMnMn–NrdIhq. Cα-RMSD in Å are shown for each residue of NrdI between the two models. The secondary structure assignment corresponding to the residues of NrdI is represented in the cartoon below. NrdI interactions with FMN are marked with light grey background (B) Fo(ox)–Fo(hq) map contoured at 4.5 σ for the BcR2b–NrdI complex with positive density in green and negative density in red. FMNs are shown in sticks, manganese ions as purple spheres, R2b as transparent cartoon in white and NrdI in transparent black. Differences between both datasets cluster around the FMN at the R2b/NrdI interface. The distance between metal site and FMN is around 16 Å, marked with a dashed line. (C–E) Closeups of the difference density around the FMN from different angles including superposition of BcR2bMnMn–NrdIhq in dark blue and BcR2bMnMn–NrdIox in cyan. Fo(ox)–Fo(hq) map contoured at 4.5 σ for all panels. Adjacent secondary structure elements are shown as transparent cartoon in white for R2b and black for NrdI. (C) Rearrangement of the 40 s loop of NrdI. Gly44 flips 180° in the hydroquinone state and forms a hydrogen bond with N5 of FMN (shown as dashed line). (D) Rearrangements of side chains on the R2b facing side of FMN. Residues of NrdI are labelled in black, Ser196 from R2b in light grey. An unexplained density, larger than water, moves between the structures, named p-ox and p-hq and is marked as transparent big spheres; waters are represented as small opaque spheres. (E) Same side chains as in (D) are shown at a different angle facing the FMN. FMN is shown transparent in the background for clarity.
Figure 5—figure supplement 1
Electron density around the 40 s loop of NrdI in the oxidized and reduced complex structures.
2Fo–Fc maps contoured at 2 σ are shown in grey, and Fo–Fc maps contoured at 4 σ with positive and negative densities are shown in green and red, respectively (no difference density visible at this contour level). The hydrogen bond formed between Gly44 and N5 of FMNhq is shown as dashed line.
Figure 5—figure supplement 2
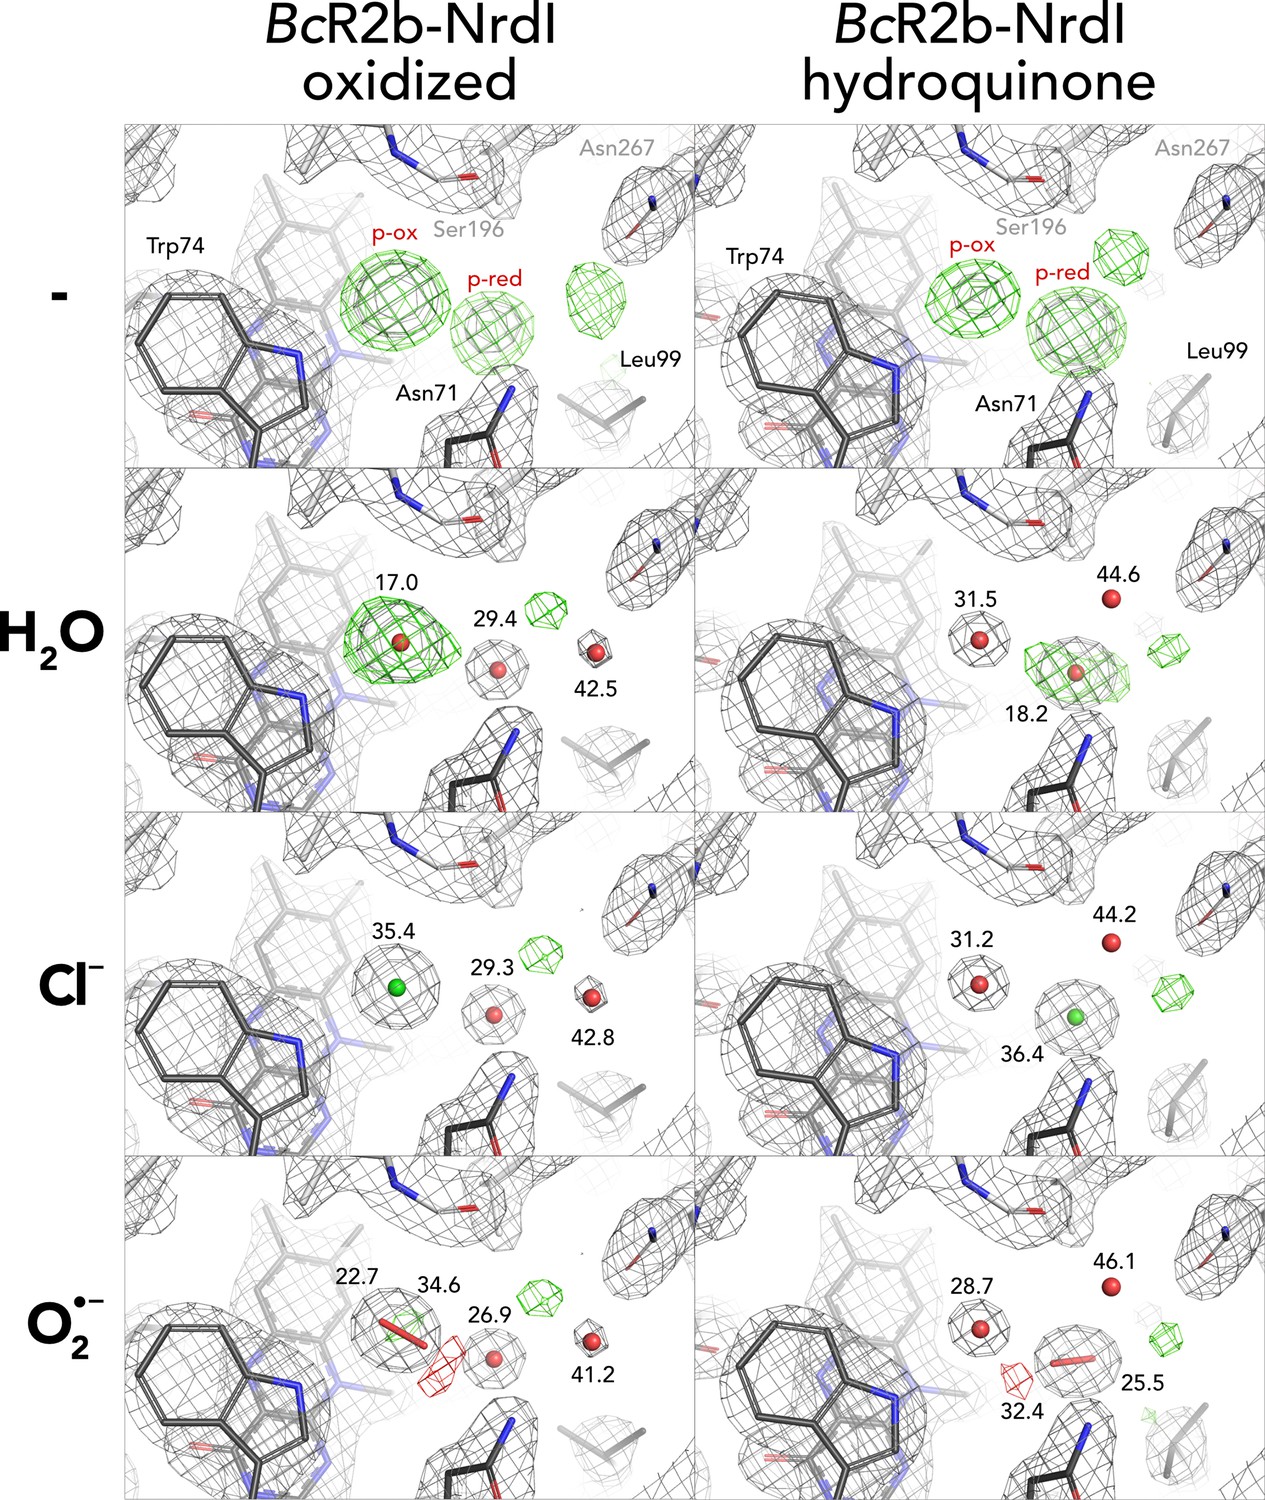
Different modelling results for unidentified density close to flavin mononucleotide (FMN).
Results for both oxidized and hydroquinone BcR2b–NrdI complex structures. 2Fo–Fc maps contoured at 2 σ are shown in grey, and Fo–Fc maps contoured at 4 σ with positive and negative densities are shown in green and red, respectively. Refined B-factor values in Å2 are indicated for the different atoms.
Figure 5—figure supplement 3
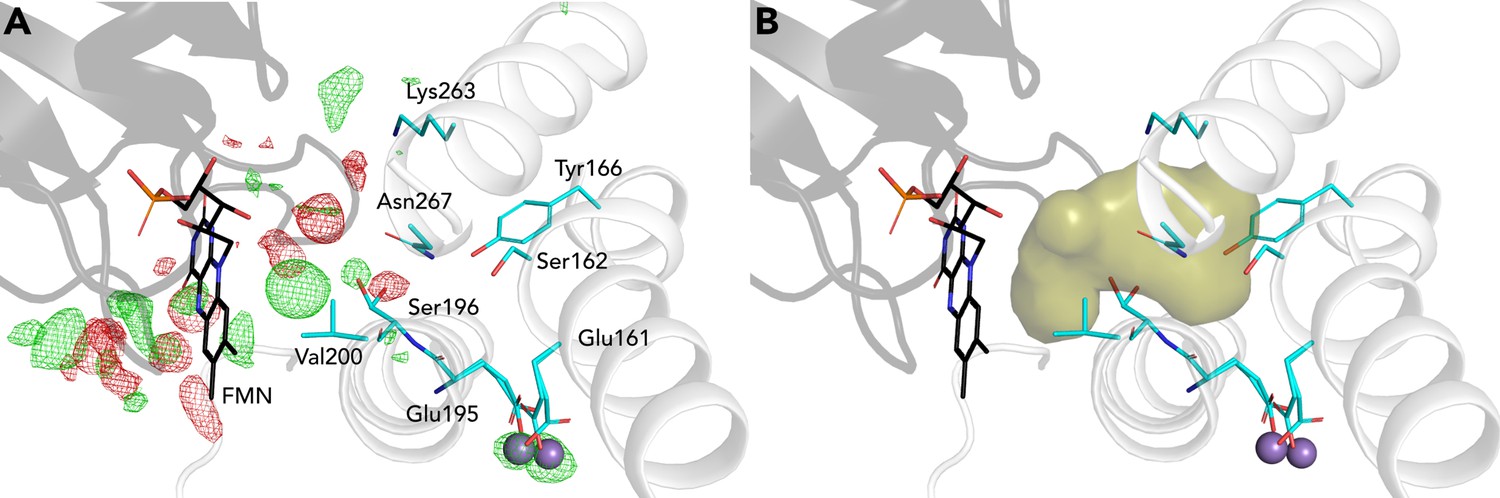
Channel between R2b and NrdI.
NrdI is represented in black and R2b in white. Residues lining the channel from flavin mononucleotide (FMN) (black sticks) towards the di-manganese site (purple spheres) are shown as sticks in cyan. (A) The Fo(ox)–Fo(hq) map is shown as mesh and contoured at 4.5 σ with green as positive density and red as negative density. The observed unknown molecule is in the vicinity of the channel. Changes around the FMN do not protrude towards the metal site in R2b. (B) Surface representation of the channel between the FMN and the di-manganese site in R2b.
Figure 6 with 1 supplement
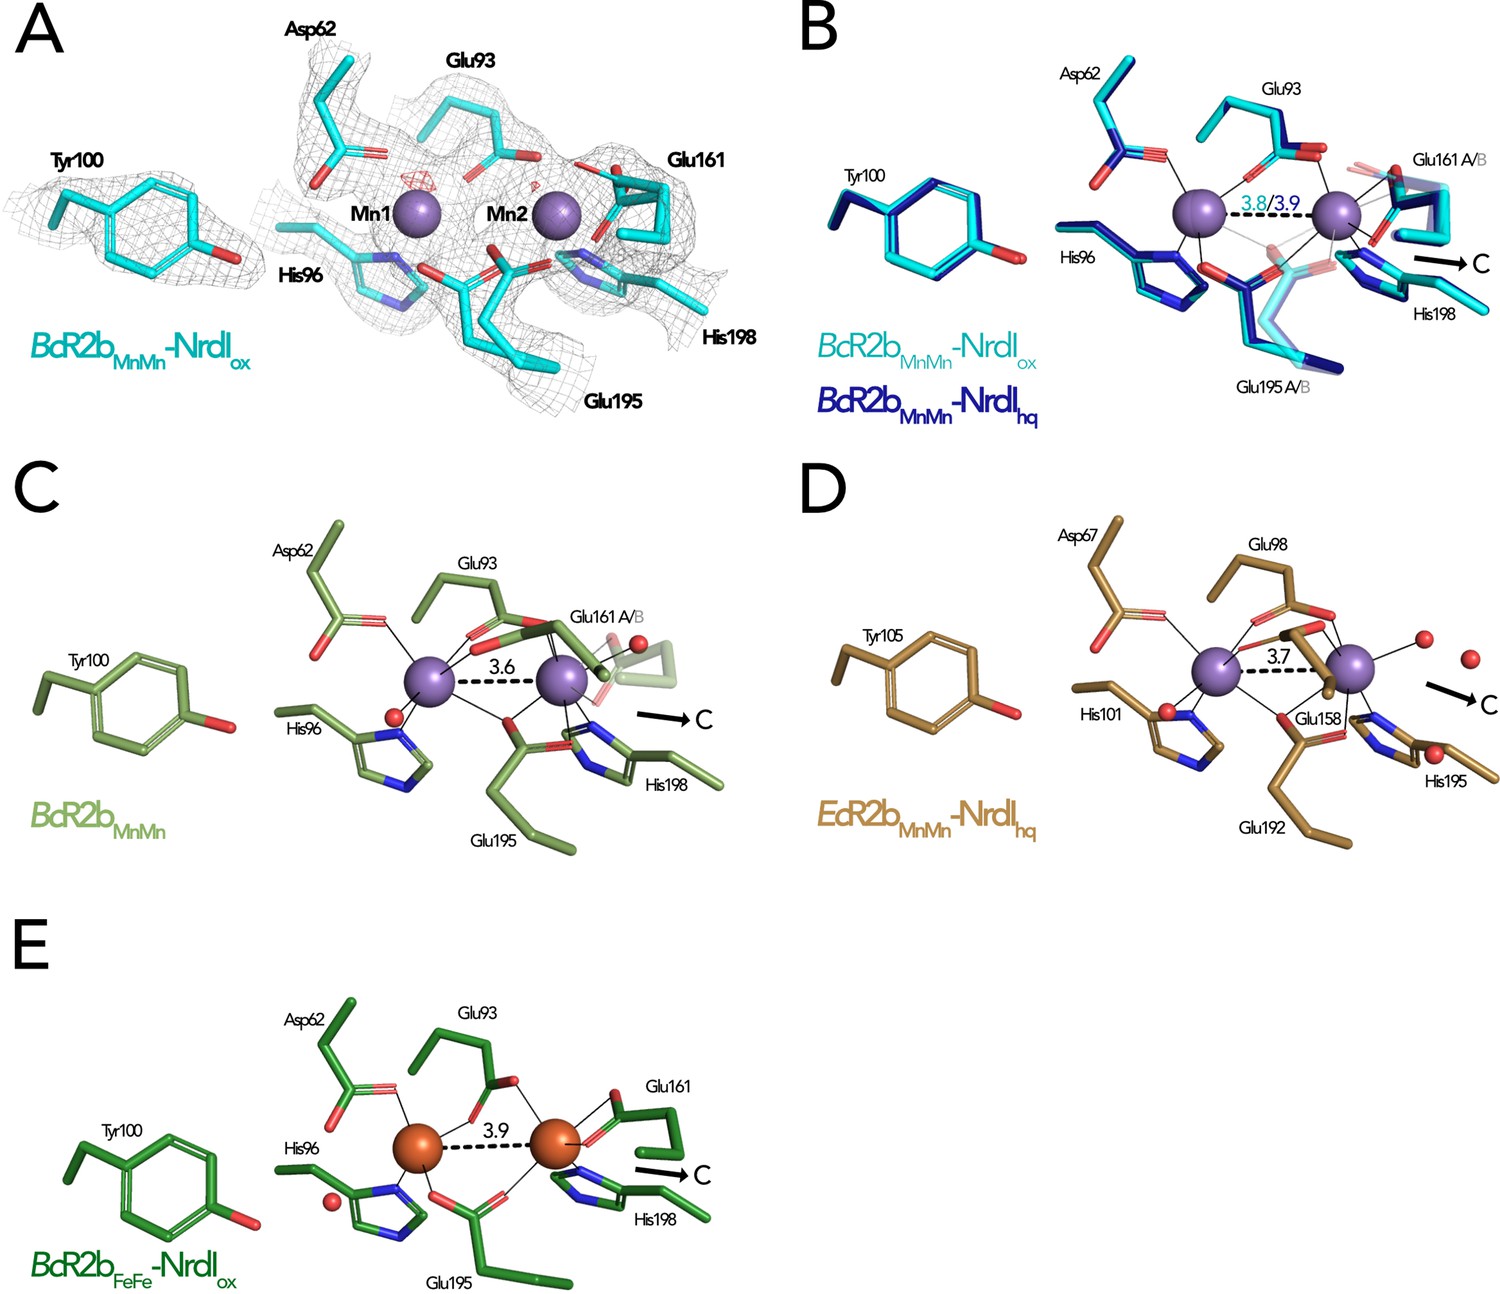
Comparison of active site architecture in different R2b structures including the radical harbouring tyrosine.
Manganese ions are shown as purple, iron ions as orange, and waters as red spheres. The direction of the connecting channel between R2b and NrdI is indicated by a black arrow and ‘C’. (A) BcR2bMnMn–NrdIox active site. The 2Fo–Fc map is contoured at 2 σ shown as grey mesh and Fo–Fc is contoured at 4 σ with negative density in red (no positive density is present). (B) Superposition of BcR2bMnMn–NrdIhq and BcR2bMnMn–NrdIox. The metal coordination is identical for both structures. (C) Active site of BcR2bMnMn (PDB ID: 4BMU). The metal site of chain A is shown with Glu161 in both the open (opaque) and closed (transparent) conformation. (D) Active site of EcR2bMnMn–NrdIhq (PDB ID: 3N3A). Glu158 is in the open conformation and two waters are in the position of the Glu161 of BcR2b. (E) Active site of the di-iron BcR2b–NrdI complex (PDB ID: 4BMP). The metal coordination is similar to the manganese containing structures with Glu161 in the closed conformation. An additional water is hydrogen bonded to Asp62 and Tyr100 but is not in interaction with iron. Metal–metal distances are shown as dashed and metal ligands as solid lines; residues in alternative conformations are shown transparent for panels (B)–(E).
Figure 6—figure supplement 1

Comparison of the active site in di-manganese BcR2bMnMn–NrdI structures.
The Fo(ox)–Fo(hq) map is shown as mesh and contoured at 4.5 σ. The only observable change between the structures is the metal occupancy.
Figure 7

Proposed mechanism for the assembly of the R2b–NrdI complex.
(A) Free NrdIhq and molecular oxygen react slowly to produce superoxide and NrdIsq. (B) R2b and NrdI form a complex which imposes strain on the flavin mononucleotide (FMN) bend and tunes its redox properties to favour oxygen reduction. The complex formation also generates a redox state-controlled potential superoxide-binding site close to the reactive carbon of FMN, indicated by the dashed and solid circles. Upon exposure to molecular oxygen, superoxide is generated in the complex and shuttled towards R2b.
Tables
Table 1
Data collection and refinement statistics.
Values in parenthesis are for the highest resolution shell.
| BcR2bMnMn–NrdIox | BcR2bMnMn–NrdIhq | |
|---|---|---|
| PDB ID | 7Z3D | 7Z3E |
| Data collection statistics | ||
| XFEL source | LCLS MFX | LCLS MFX |
| Wavelength (Å) | 1.30 | 1.30 |
| Space group | C2221 | C2221 |
| Unit cell dimensions a, b, c (Å) | 61.4, 125.6, 145.0 | 61.2, 125.8, 144.8 |
| Unit cell angles α, β, γ (°) | 90, 90, 90 | 90, 90, 90 |
| Resolution range (Å) | 51.59–2.0 (2.034–2.0) | 51.47–2.0 (2.034–2.0) |
| Unique reflections | 38,319 (1881) | 38,188 (1880) |
| Multiplicity | 66.94 (25.42) | 59.92 (26.46) |
| Merged lattices | 14,357 | 13,509 |
| Completeness (%) | 99.91 (100) | 99.91 (100) |
| Mean I/sigma (I) | 3.247 (0.654) | 3.28 (0.791) |
| Wilson B-factor (Å2) | 35.45 | 33.22 |
| Rsplit (%) | 11.1 (86.3) | 11.1 (76.5) |
| CC1/2 | 0.989 (0.32) | 0.988 (0.39) |
| Refinement statistics | ||
| Resolution range used in refinment (Å) | 24.17–2.0 (2.07–2.0) | 23.91–2.0 (2.07–2.0) |
| Reflections used in refinement | 38,253 (3745) | 38,119 (3729) |
| Reflections used for Rfree | 1909 (206) | 1897 (203) |
| Rwork (%) | 15.91 (30.40) | 15.16 (28.44) |
| Rfree (%) | 19.56 (32.27) | 18.37 (31.18) |
| RMSD, bond distances (Å) | 0.007 | 0.007 |
| RMSD, bond angles (°) | 0.79 | 0.81 |
| Ramachandran favoured (%) | 99.27 | 98.79 |
| Ramachandran allowed (%) | 0.73 | 1.21 |
| Ramachandran outliers (%) | 0 | 0 |
| Rotamer outliers (%) | 0.79 | 1.05 |
| Clashscore | 1.86 | 2.58 |
| Protein residues (R2b + NrdI) | 415 (299 + 116) | 416 (298 + 118) |
| Average B-factor (Å2) | 47.27 | 43.66 |
| Macromolecules | 47.24 | 43.64 |
| Ligands | 34.66 | 30.38 |
| Solvent | 50.57 | 47.09 |
| Number of non-H atoms | 3655 | 3652 |
| Macromolecules | 3462 | 3477 |
| Ligands | 33 | 33 |
| Solvent | 160 | 142 |
Additional files
-
Supplementary file 1
List of contacts that prevent flavin mononucleotide (FMN) from bending due to R2b–NrdI complex formation.
The contacts of FMN to NrdI are not listed since those are also formed in the absence of R2b. The only additional contacts formed with between FMN and R2b are with the side chains (sc) of Phe17 and Gln20. The contacts formed by those side chains are also given. Contacts in both the oxidized and reduced structures are listed.
- https://cdn.elifesciences.org/articles/79226/elife-79226-supp1-v1.docx
-
Supplementary file 2
Bending angle (in degrees) and strain energies (Estrain, in eV) of the isoalloxazine ring of flavin mononucleotide (FMN) in BcNrdI based on density functional theory (DFT) calculations.
The strain energies are computed relative to the same redox state of the flavin, optimized without the protein surroundings. See Materials and methods for definition of the bending angle.
- https://cdn.elifesciences.org/articles/79226/elife-79226-supp2-v1.docx
-
Supplementary file 3
Redox potential shifts of NrdI and R2b–NrdI.
The relative redox potentials, ΔEtot, are computed at the B3LYP-D3/def2-TZVP/ε = 4 level relative to the same redox transition of the isolated flavin in ε = 4. The shifts in strain energy (at ε = 4), ΔEstrain, refer to the same redox transition relative to the isolated flavin, optimized without surroundings. The protein electrostatic shift, ΔEel, are estimated based on the difference between ΔEtot and ΔEstrain (ΔEtot = ΔEstrain+ ΔEel). ΔΔEtot are the total shifts in redox potentials of R2b–NrdI relative to NrdI alone.
- https://cdn.elifesciences.org/articles/79226/elife-79226-supp3-v1.docx
-
MDAR checklist
- https://cdn.elifesciences.org/articles/79226/elife-79226-mdarchecklist1-v1.pdf
Download links
A two-part list of links to download the article, or parts of the article, in various formats.
Downloads (link to download the article as PDF)
Open citations (links to open the citations from this article in various online reference manager services)
Cite this article (links to download the citations from this article in formats compatible with various reference manager tools)
Redox-controlled reorganization and flavin strain within the ribonucleotide reductase R2b–NrdI complex monitored by serial femtosecond crystallography
eLife 11:e79226.
https://doi.org/10.7554/eLife.79226


