In situ single particle classification reveals distinct 60S maturation intermediates in cells
- RNA Therapeutics Institute, University of Massachusetts Chan Medical School, United States
- Howard Hughes Medical Institute, Janelia Research Campus, United States
Figures
Figure 1 with 3 supplements
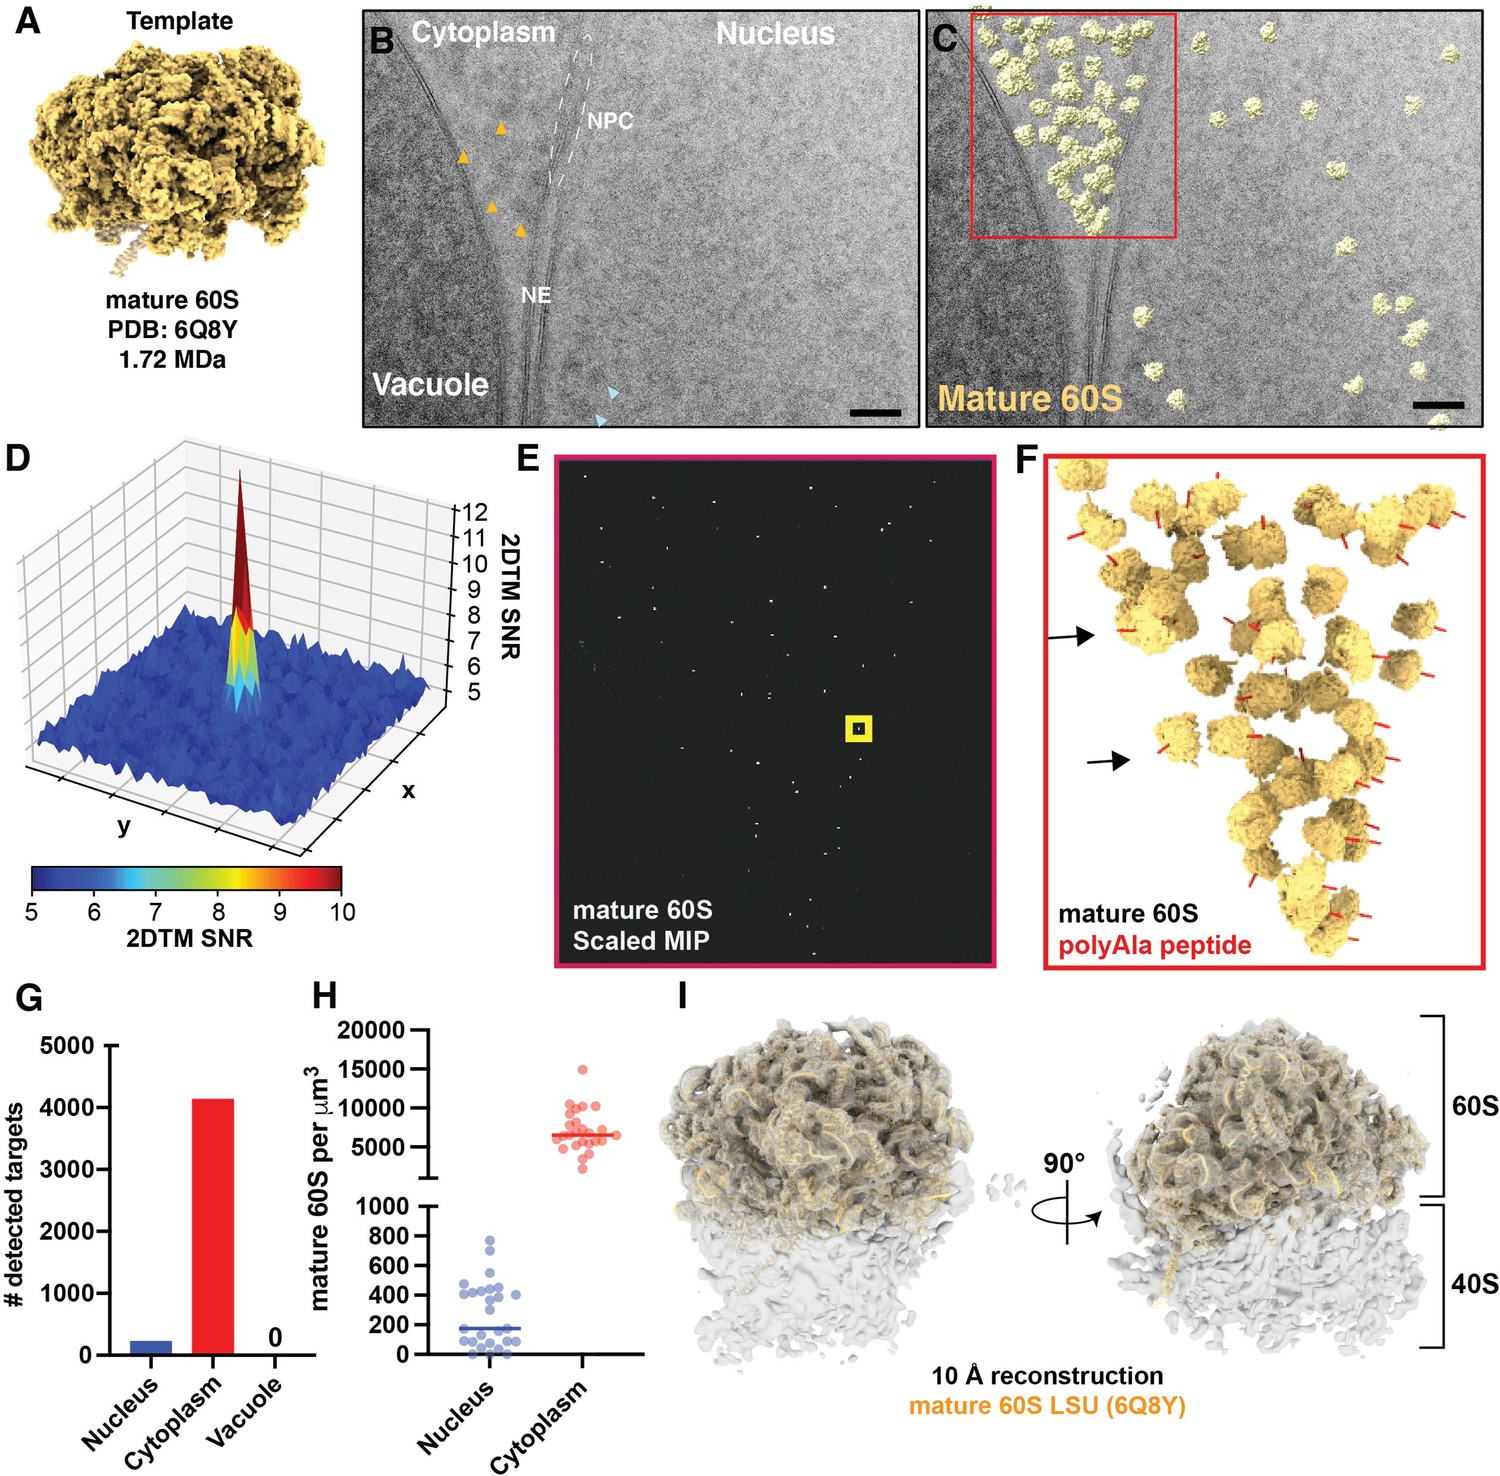
Detection of cytoplasmic mature 60S and mitochondrial ribosomes in 2D images of FIB-milled yeast lamella.
(A) Cryo-EM like density generated using the atomic coordinates of PDB: 6Q8Y that correspond with the mature 60S. (B) TEM image of the nuclear periphery from a FIB-milled yeast lamella. Yellow arrows indicate low-resolution features in the cytoplasm that may indicate the presence of ribosomes. Blue arrows indicate regions of similar size and contrast in the nucleoplasm. NE: nuclear envelope; NPC: nuclear pore complex. (C) Cryo-EM micrograph of yeast nuclear periphery from FIB-milled lamella with the results from a 2DTM search using the mature 60S template. Significant targets are indicated by mapping the template in the best matching locations and orientations (shown in yellow). The red box indicates the regions highlighted in (E) and (F). Scale bar = 50 nm. (D) 3D surface representation showing the pixel-wise 2DTM SNRs in the 50x50 pixel region of the normalized maximum intensity projection (MIP) indicated by the yellow box in (E). Each square represents 10x10 pixels. Colors represent the SNR value of each pixel as indicated by the scale bar below. (E) Normalized MIP showing the results of 2DTM using the template in (A) in the region of (C) indicated in red. (F) 3D slab indicating the locations and orientations of mature 60S-detected targets in the indicated region of (C). The red polypeptide indicates the location of the polypeptide exit tunnel on each 60S. (G) Bar chart indicating the number of mature 60S-detected targets identified in the indicated subcellular compartments in 28 images of the nuclear periphery. (H) Plot showing the density of mature 60S in the regions of the images corresponding to the nucleus (blue) or cytoplasm (red). Each dot represents a different image. The solid bar indicates the median. (I) 10 Å filtered 3D reconstruction calculated from 3991 60S subunits at the locations and orientations detected in 28 images, showing clear density for the 40S small subunit. The molecular model of the 60S used to generate the template in (A) is shown in yellow.
Figure 1—figure supplement 1

FIB-milled yeast cells and detection statistics relative to a Gaussian noise model.
(A) FIB-image of two yeast cells frozen on a cryo-EM grid. (B) FIB image of the lamella after milling the cells shown in (A). (C) Survival histogram showing the number of search locations with 2DTM SNR values above a given threshold from a 2DTM search using the mature 60S template in Figure 1A.
Figure 1—figure supplement 2
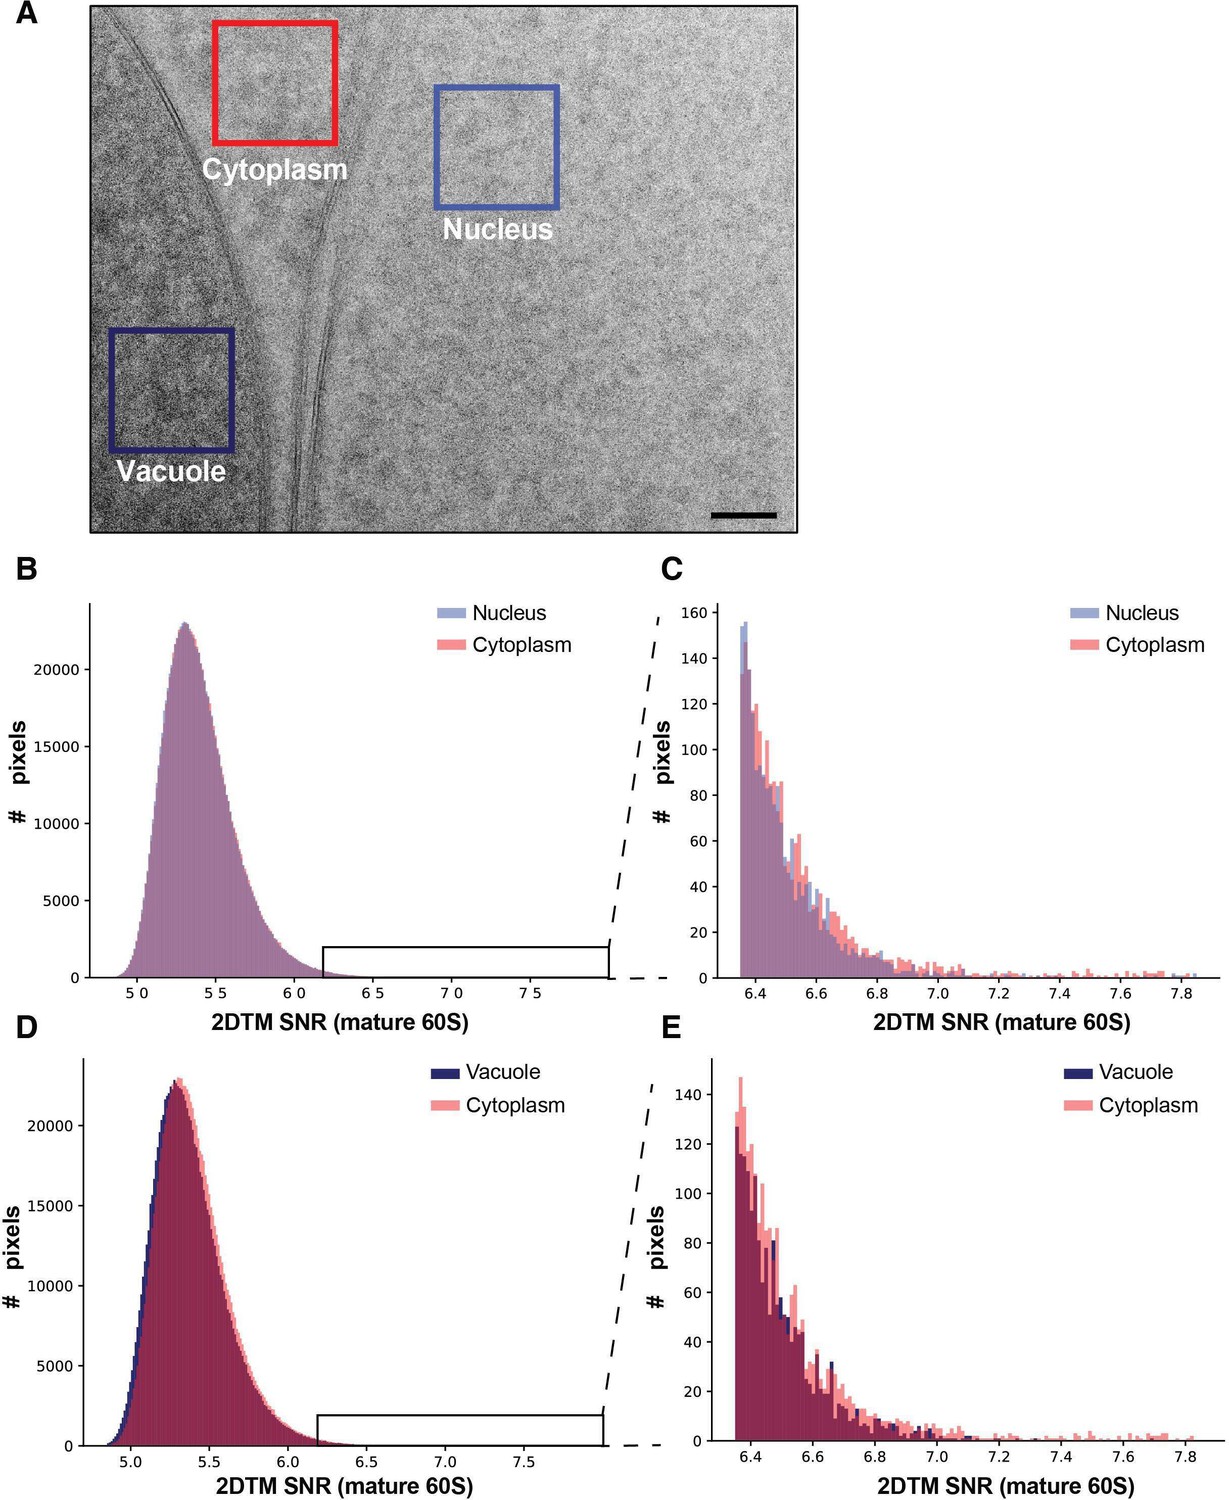
Background 2DTM SNRs in the nucleus and vacuole relative to the cytoplasm.
(A) Cryo-EM image from Figure 1B indicating the image subregions from the normalized MIP that were used to calculate the histograms in B-E. (B) Histogram showing the distribution of pixel-wise 2DTM SNRs in the normalized MIP resulting from 2DTM using the template in Figure 1A, corresponding to the cytoplasmic (red) or nuclear (blue) subregions of the image in (A). Only values below the threshold allowing a single false positive per image (2DTM SNR = 7.85) are shown. (C) As in (B), showing the indicated subset of the histogram. (D) As in (B) showing the 2DTM SNRs in the cytoplasmic (red) and vacuole (dark blue). (E) As in (D), showing the indicated subset of the histogram.
Figure 1—figure supplement 3
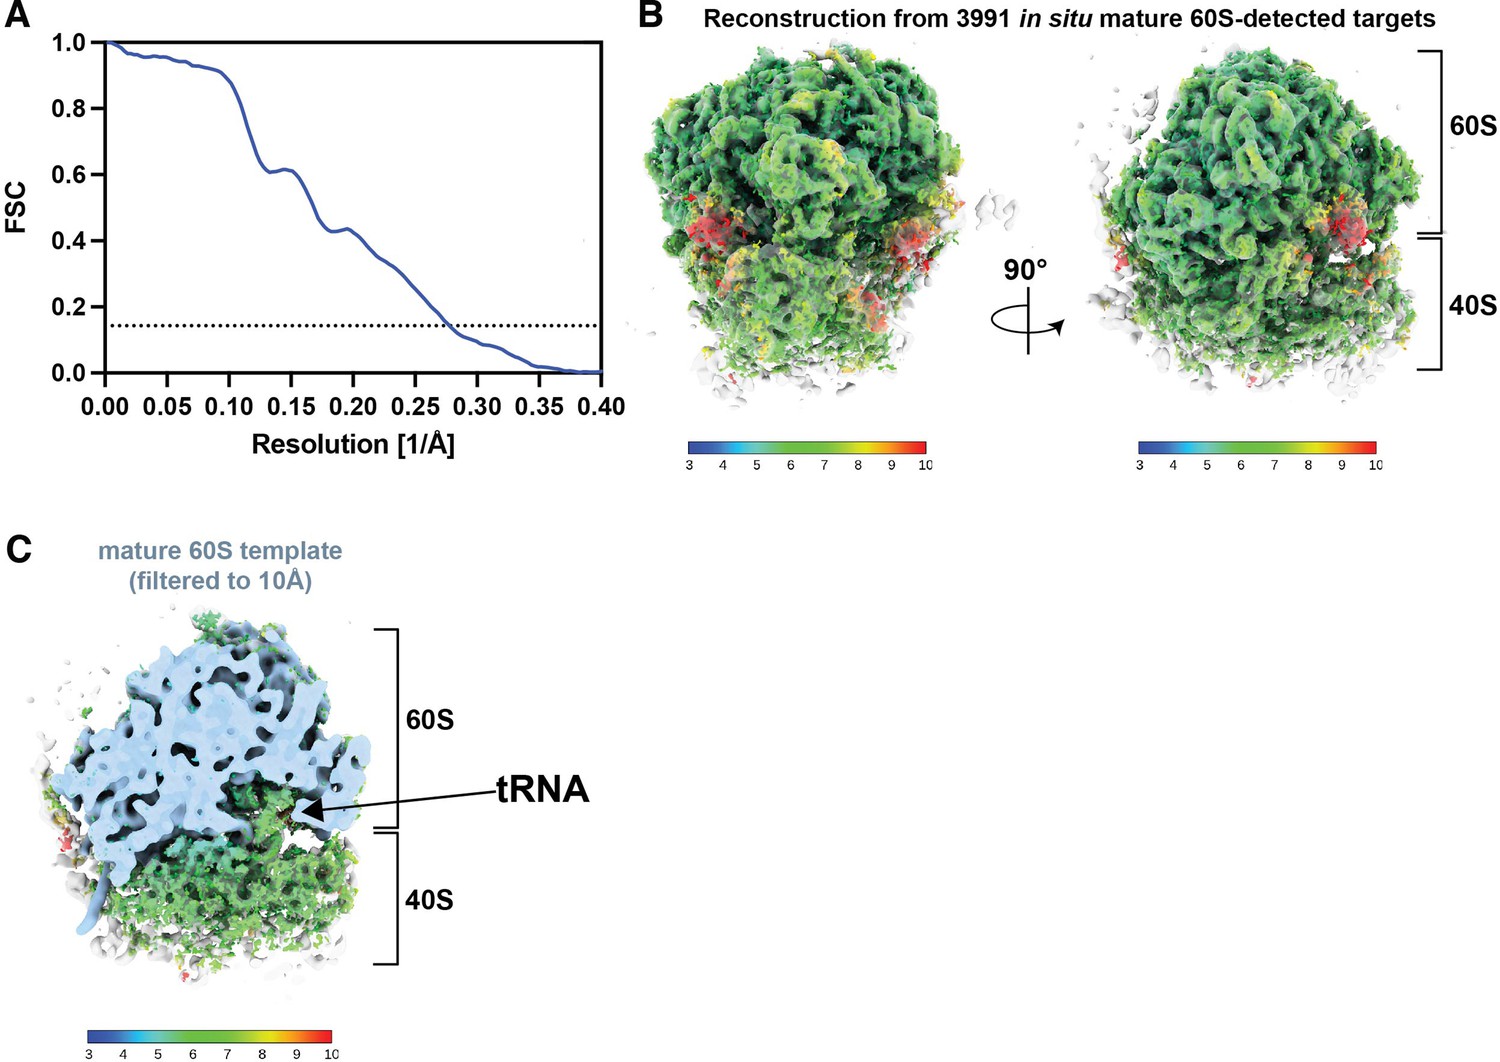
Reconstruction using 60S coordinates shows features consisitent with detection of 80S ribosomes.
(A) FSC from two half-maps using a 175 Å mask obtained for the 3D reconstruction shown in Figure 1I calculated using the mature 60S-detected targets identified by 2DTM. (B) Reconstruction from 3991 in situ mature 60S-detected targets from yeast lamellae. Colors show the estimated local resolution. The 10Å-filtered reconstruction in Figure 1I is shown in transparent grey. (C) As in (B), showing the comparison with the mature 60S template, filtered to 10 Å. The cut-away shows clear density for the 40S, which is outside of the template and a tRNA with an estimated local resolution of 4–7 Å.
Figure 2 with 1 supplement
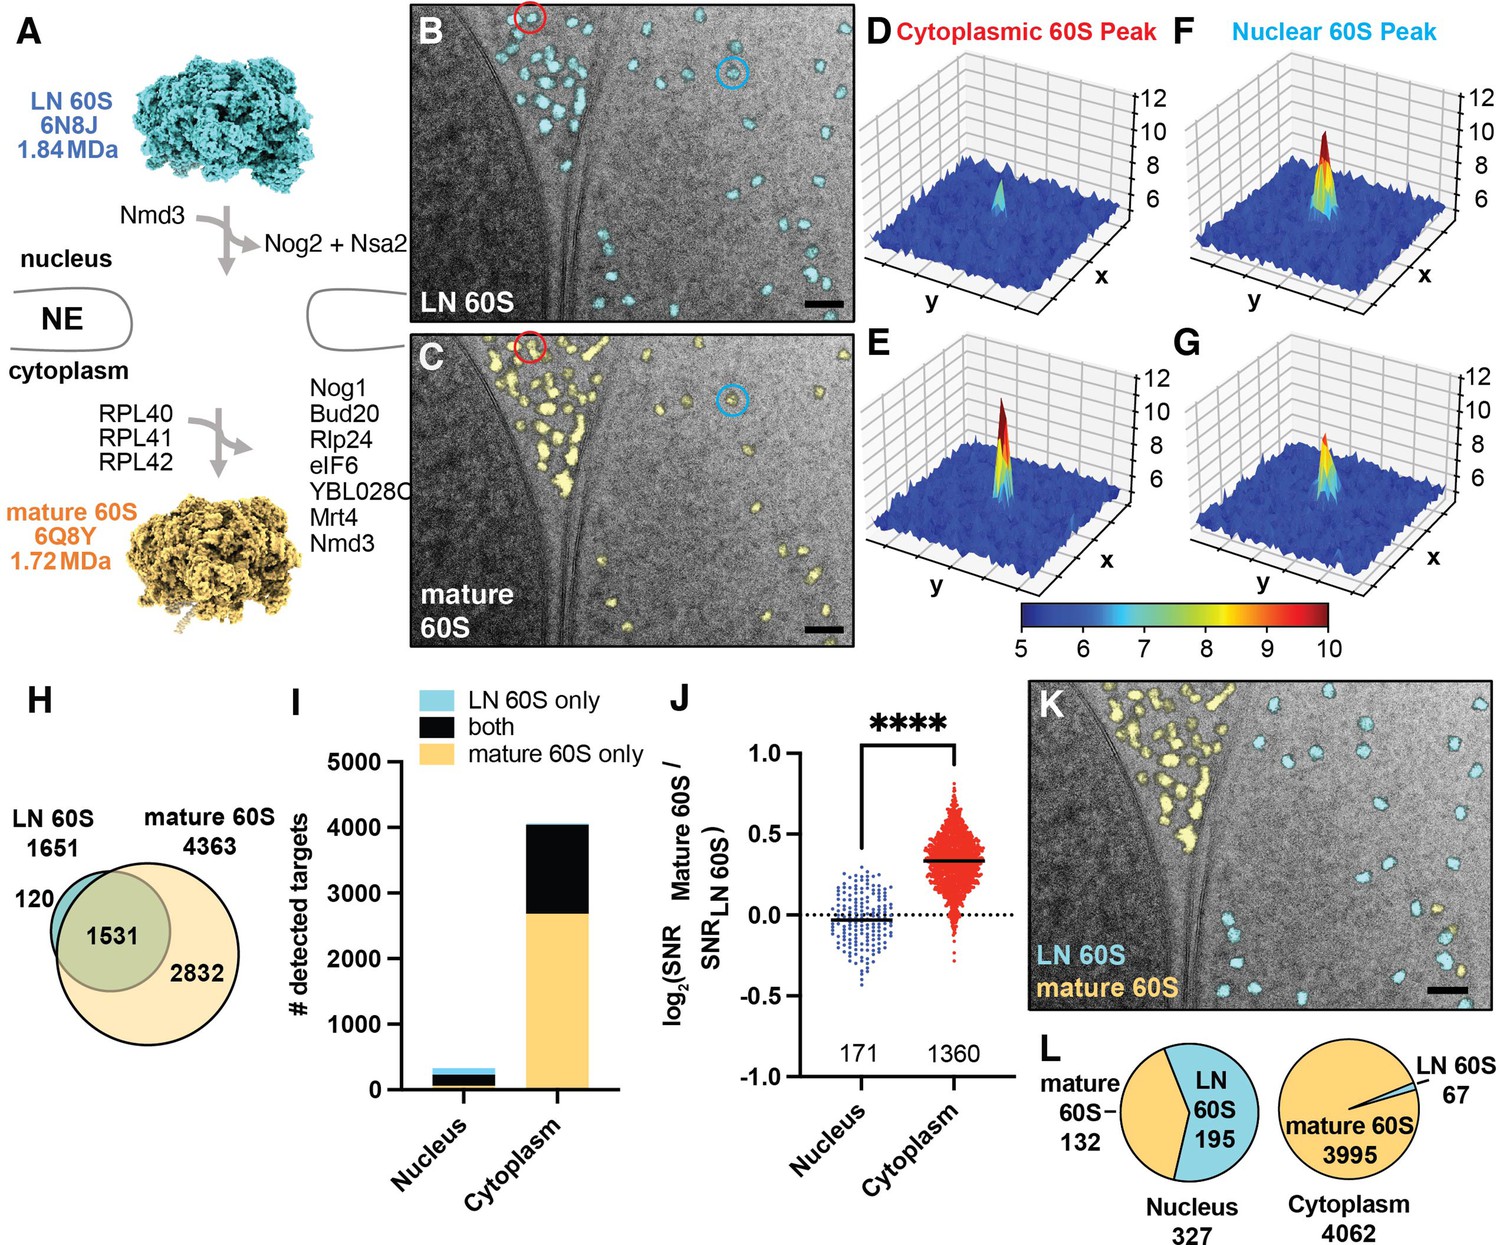
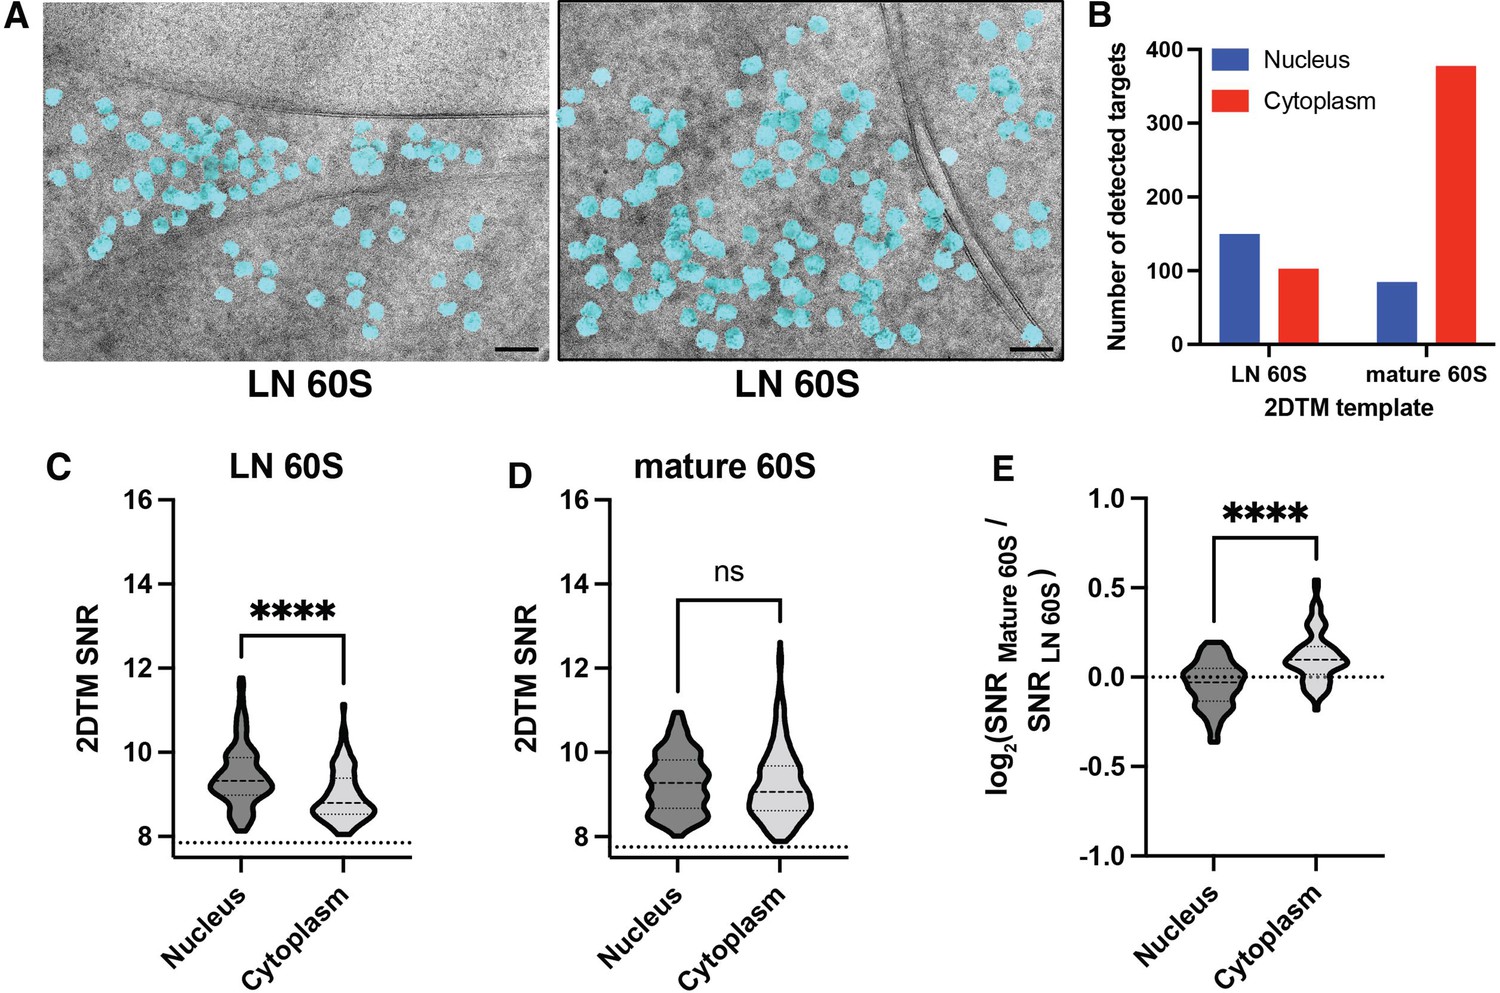
2DTM SNRs differentiate cytoplasmic mature 60S from nuclear pre-60S in 2D images of FIB-milled yeast lamella.
(A) Diagram showing the compositional changes that accompany the maturation from the late nuclear (LN) 60S (PDB: 6N8J), shown in blue, to the mature 60S (PDB: 6Q8Y), shown in yellow, in the cytoplasm. (B) Cryo-EM micrograph of yeast nuclear periphery from FIB-milled lamella with the results from a 2DTM search using the LN 60S template. Significant targets are indicated by mapping a projection of the template in the best matching locations and orientations (shown in blue). Scale bar = 50 nm. (C) As in (B), showing the results from a 2DTM search of the indicated image using the mature 60S as a template (yellow). (D) 3D surface representation showing the results of a 2DTM search with the LN 60S template in the 50x50 pixel region of the image in (B) highlighted in red. Each square represents 10x10 pixels. Colors represent the SNR value of each pixel as indicated by the scale bar below. (E) As in (D) showing the results of a 2DTM search with the mature 60S template in the corresponding region of the image in (C) highlighted in red. (F) As in (D) showing the results of a 2DTM search with the LN 60S template in the region of (B) highlighted in blue. (G) As in (D) showing the results of a 2DTM search with the mature 60S template in the corresponding region of the image in (C) highlighted in blue. (H) Diagram indicating the number of mature 60S (yellow) and LN 60S (blue)-detected targets identified in 2DTM searches of 28 images of the nuclear periphery. The overlap of the Venn diagram indicates the number of targets identified in both searches. (I) Bar chart indicating the number of targets detected by the mature 60S (yellow), the LN 60S (blue), and by both (black) in regions of the images corresponding to the nucleus or cytoplasm. (J) Plot showing the log2 2DTM SNR ratios for LN and mature 60S-detected targets grouped by subcellular compartment. Each dot indicates a 60S detected in both searches. ****: p<0.0001. (K) Image showing the identified targets color-coded by the best-matching template (blue: LN 60S, yellow: mature 60S) as determined by the higher 2DTM SNR at each overlapping location. Scale bar = 50 nm. (L) Pie chart indicating the proportion of all nuclear (left) and cytoplasmic (right) 60S targets that more closely resemble the mature 60S (yellow) or LN 60S (blue) template, respectively, as determined by the highest 2DTM SNR at each identified location and orientation.
Figure 2—figure supplement 1
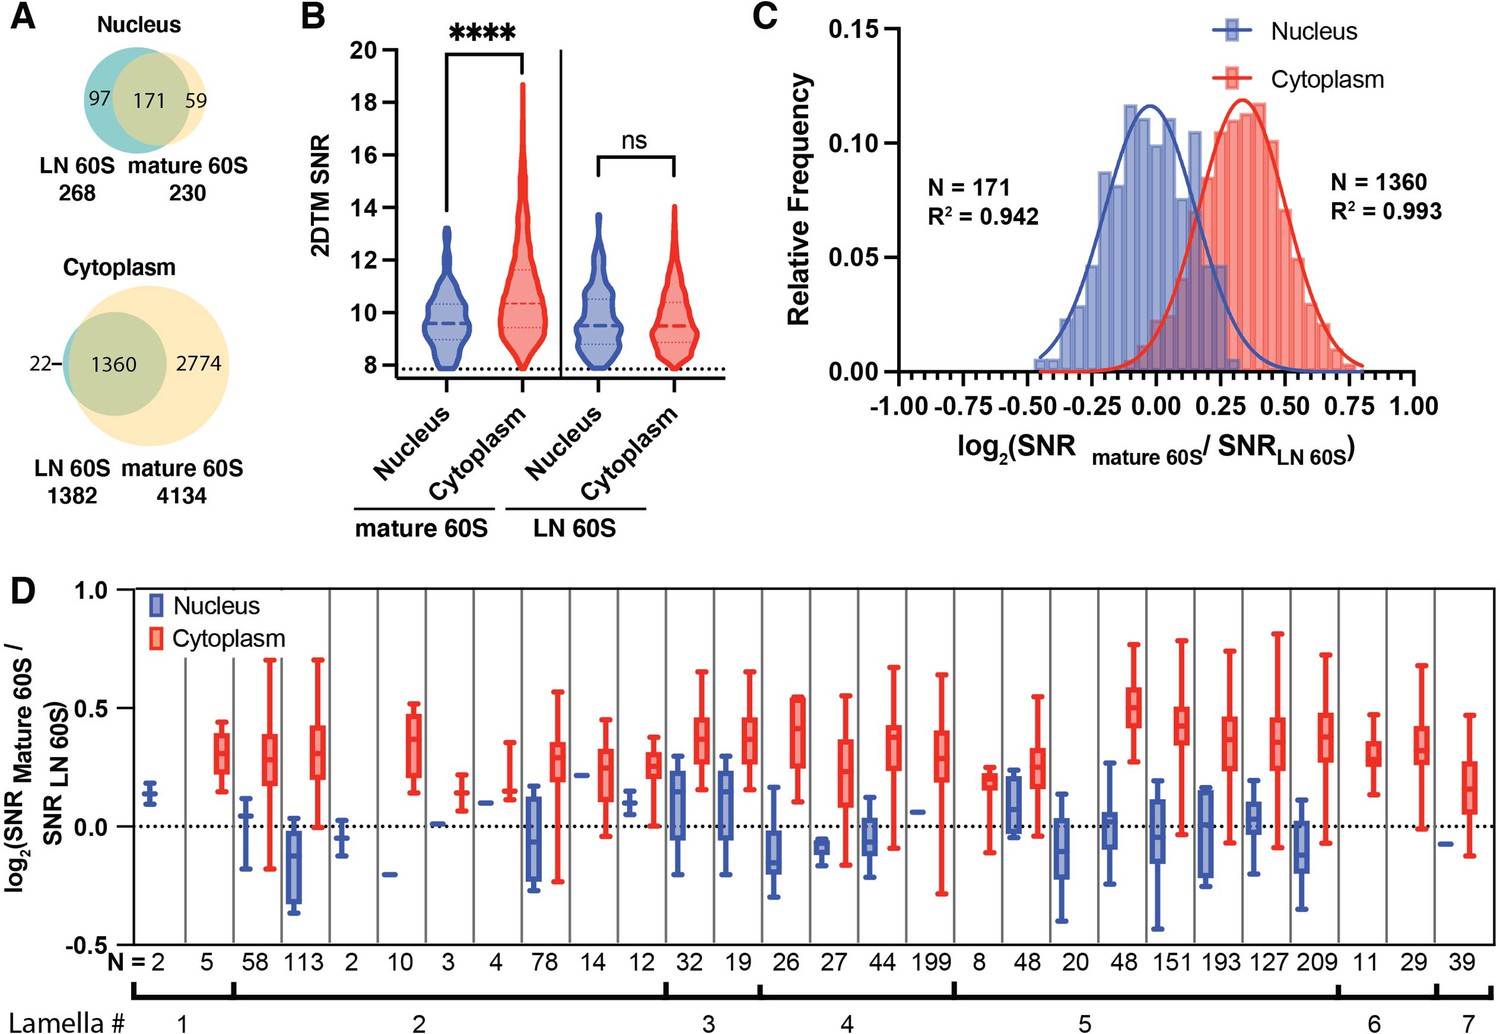
2DTM SNR ratios distinguish the nuclear from the cytoplasmic 60S population.
(A) Venn diagrams showing the number of mature (yellow) and LN 60S (blue) detected targets in the indicated subcellular compartments. The overlap indicates targets detected in searches with both templates. (B) Violin plot showing the kernelled distribution of 2DTM SNRs of mature 60S-detected targets (left) and LN 60S-detected targets (right) in the indicated subcellular compartments. ****: p<0.0001, ns: not significant, p>0.05. (C) Histogram showing the relative frequency of log2 (mature 60S / LN 60S SNR) values grouped by subcellular localization. Gaussian fits are indicated by a solid line. (D) Boxplot showing the mature 60S / LN 60S 2DTM SNR ratios of the nuclear (blue) and cytoplasmic (red) populations from each of the 28 images analyzed, indicating that the nuclear and cytoplasmic populations are distinct, even within single images. The number of significant LN and mature 60S-detected targets (N) is shown below for each image. The black brackets indicate images from the same lamella.
Figure 3 with 2 supplements
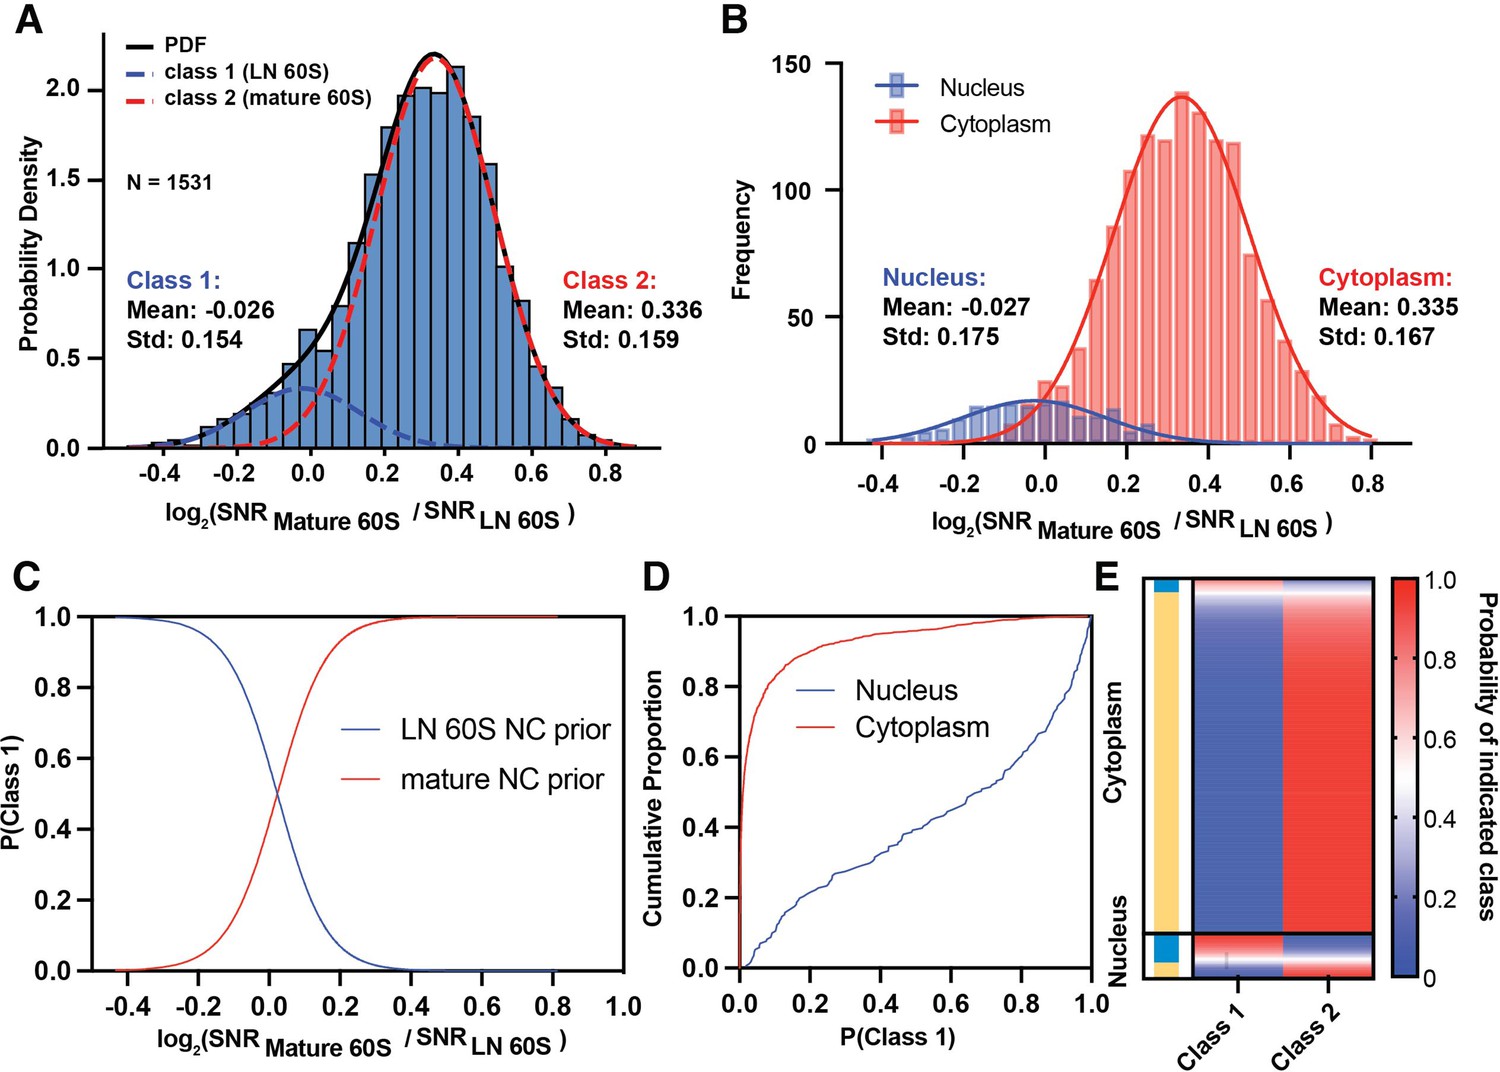
Relative probability of detecting mature or LN 60S.
(A) Histogram showing the distribution of the log2(mature 60S / LN 60S 2DTM SNR) values for each LN and mature 60S-detected target fit with two Gaussians indicating populations 1 (blue dashed line) and 2 (red dashed line). The black line indicates the sum of the two Gaussians, R2=0.993. (B) Histogram showing the log2(mature 60S / LN 60S 2DTM SNR) values for each nuclear (blue) or cytoplasmic (red) LN and mature 60S-detected target. The two subcellular populations are plotted independently. Solid lines indicate Gaussian fits. (C) Line graph showing the probability that a given target belongs to the LN 60S population (blue) line, or mature 60S population (red), as a function of log2 2DTM SNR ratio. (D) Line graph showing the fraction of nuclear (blue) and cytoplasmic (red) targets classified as LN 60S, at the indicated confidence intervals determined using Equation 6. (E) Heat map showing the probability of each LN and mature 60S-detected target belonging to either the LN or mature 60S populations. Each row indicates a detected target, and the rows are sorted by their subcellular distribution. The targets assigned to the mature 60S population are indicated in yellow and the targets assigned to the LN 60S population are indicated in blue.
Figure 3—figure supplement 1
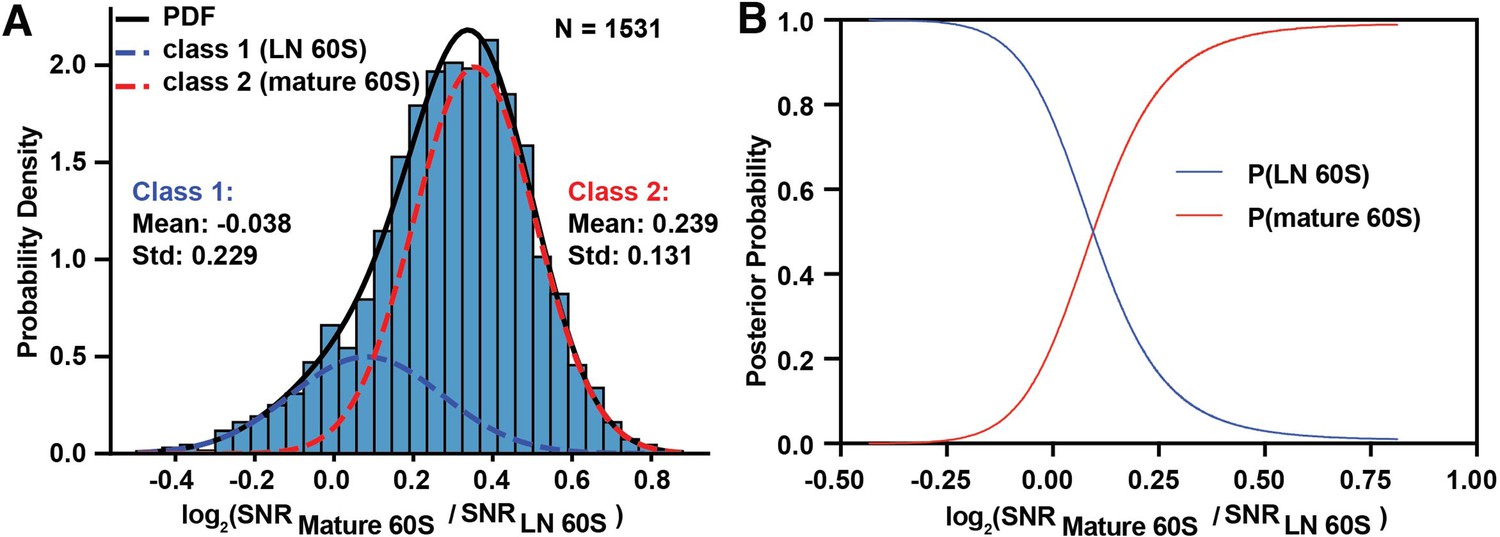
Maximum likelihood fit assuming no prior information.
(A) Histogram showing the distribution of log2(mature 60S / LN 60S 2DTM SNR) values for the 1531 LN and mature 60S-detected targets as shown in Figure 3A. The two Gaussians show the result of the maximum likelihood fit when assuming no prior information. (B) Line graph showing the probability that a given target belongs to the LN 60S population (blue) line, or mature 60S population (red), as a function of log2(mature 60S / LN 60S 2DTM SNR) values calculated using the fits in (A).
Figure 3—figure supplement 2
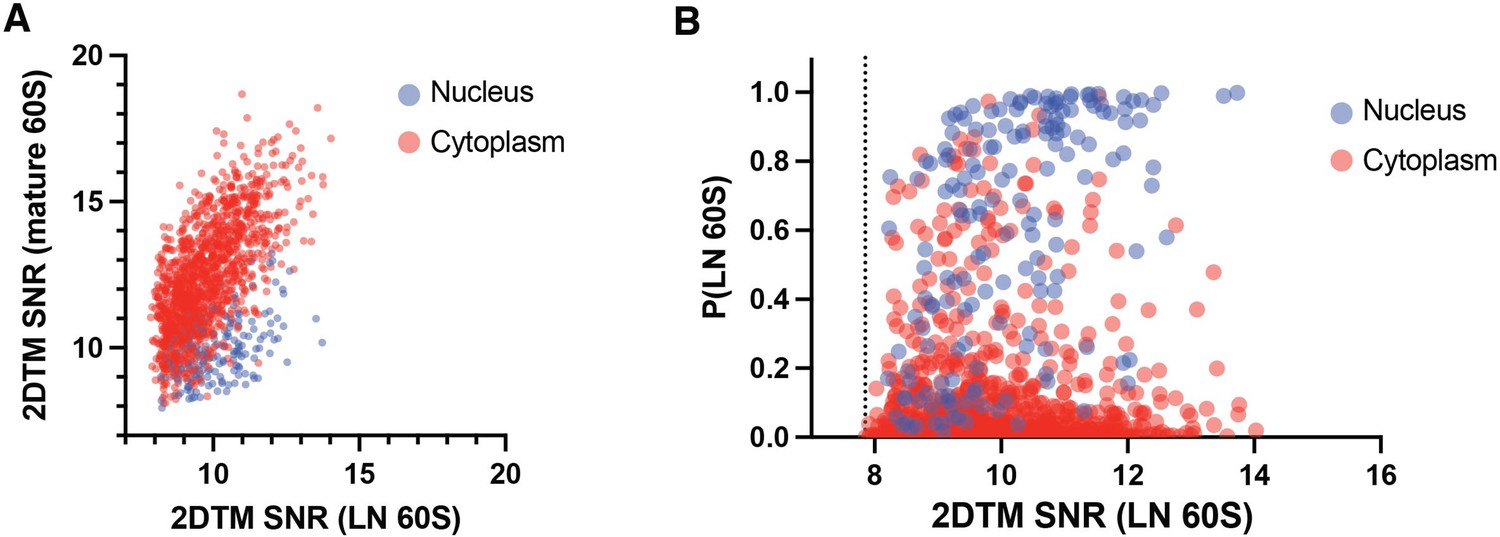
Higher 2DTM SNRs improve classification.
(A) Scatterplot showing the 2DTM SNRs for nuclear (blue) and cytoplasmic (red) targets detected in searches with the LN and mature 60S templates. (B) Scatterplot showing P(LN 60S) for nuclear (blue) or cytoplasmic (red) LN 60S-detected target as a function of the 2DTM SNR. Dotted line indicates the 2DTM threshold.
Figure 4
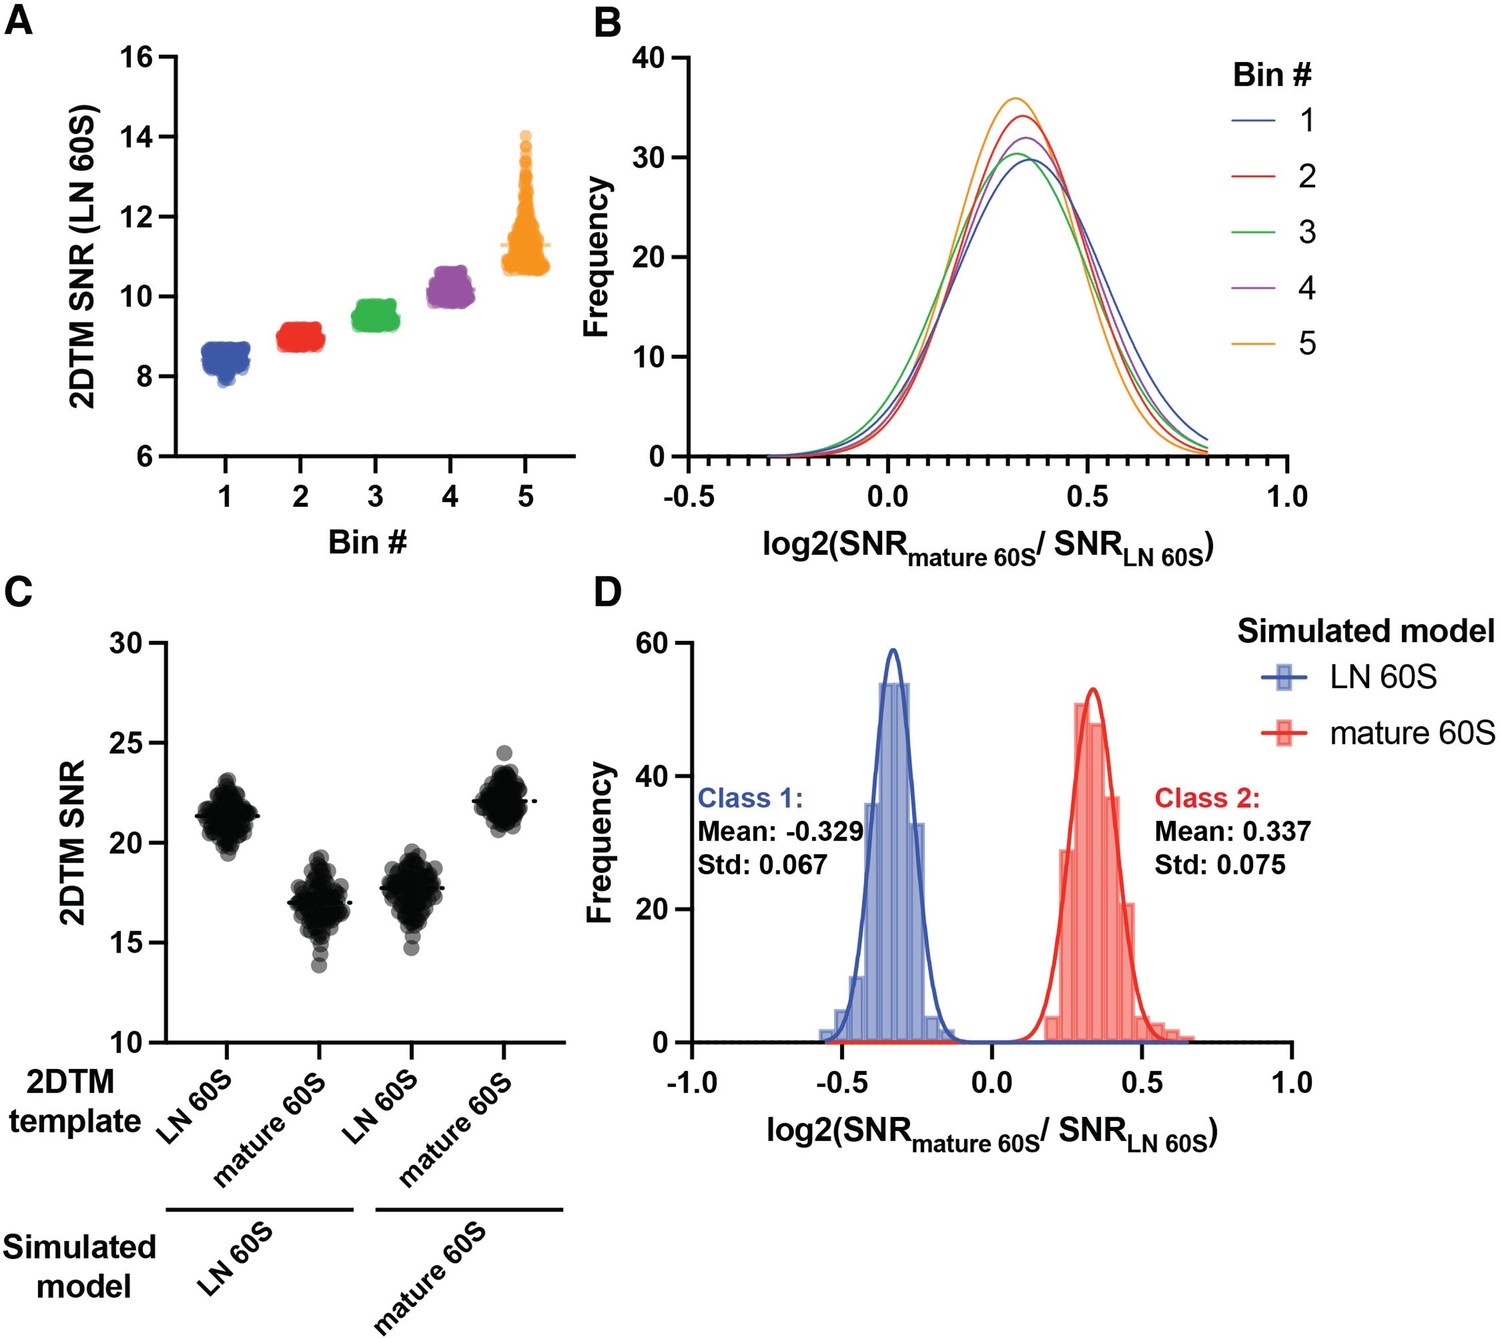
Simulations reveal identity of cytoplasmic 60S population.
(A) Scatter dot plot showing the 2DTM SNR of all cytoplasmic LN 60S and mature 60S-detected targets, grouped into five bins of 272 targets by the 2DTM SNR of the LN 60S-detected target, each representing 20% of the cytoplasmic targets. (B) Gaussian fits to histograms of the log2(mature 60S / LN 60S 2DTM SNR) representing the bins shown in (A), where bin 1 represents the bottom 20%, and bin 5 represents the top 20% of cytoplasmic targets by their LN 60S 2DTM SNR. (C) Scatterplot showing the 2DTM SNRs using the indicated templates to search simulated images of LN 60S (left) or mature 60S (right). (D) Histogram of the log2(mature 60S / LN 60S 2DTM SNR) values resulting from particle-wise comparison of the values in the simulation shown in (C). Solid lines indicate Gaussian fits for two distinct populations.
Figure 5 with 1 supplement
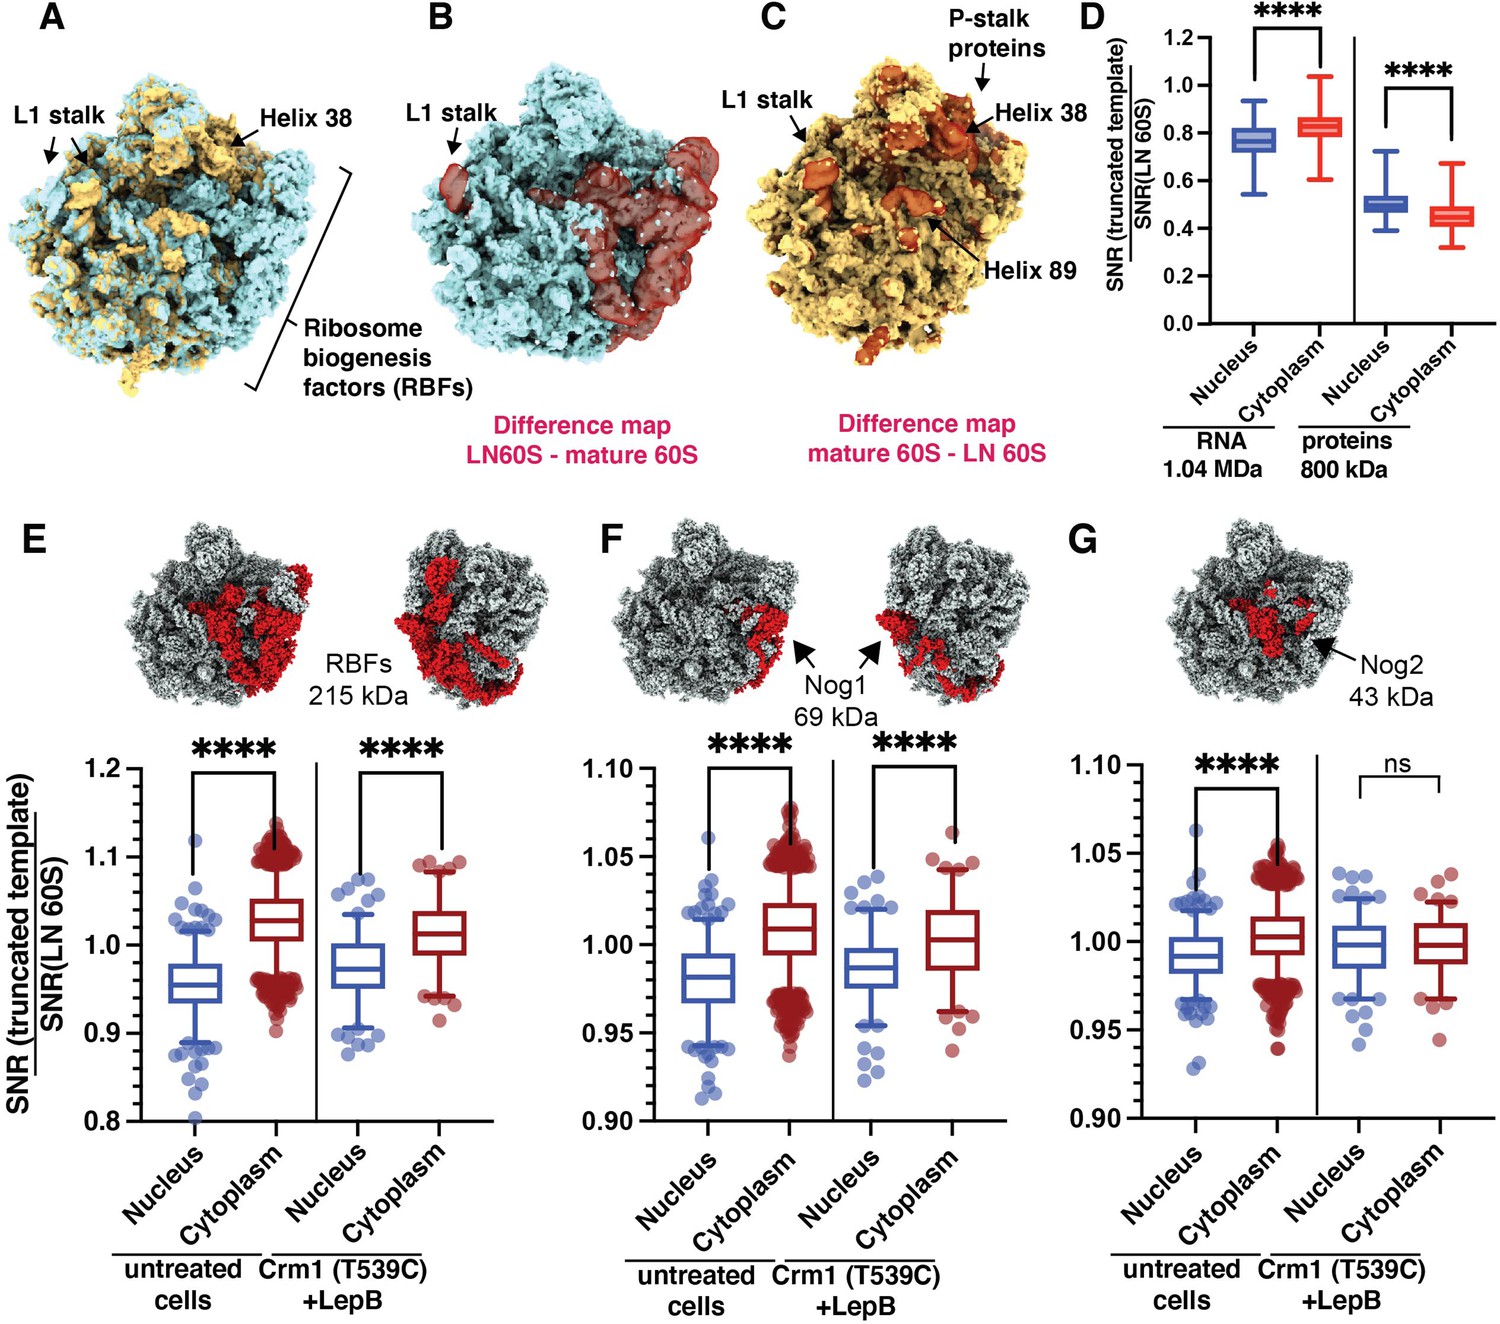
Classification of cytoplasmic mature 60S and nuclear pre-60S by 2DTM corresponds with biologically relevant differences in the templates.
(A) The LN 60S (blue) and mature 60S (yellow) 2DTM templates aligned in UCSF Chimera. (B) LN 60S with difference map calculated using UCSF Chimera showing the density in the LN 60S template that is not present in the mature 60S template (red, transparent). (C) As in (B), showing the mature 60S with density that is not in common with the LN 60S template (red, transparent). (D) Boxplots showing the change in 2DTM SNR when only RNA (left) or protein (right) components of the LN 60S template are included, relative to the full-length template for each significant target. The targets are grouped by their subcellular localization. (E) Upper: LN 60S template with all ribosome biogenesis factors (RBFs) indicated in red. Lower: Boxplot showing the change in the 2DTM SNR of the nuclear (blue) and cytoplasmic (red) targets when all RBFs are removed, relative to the full-length LN 60S template in untreated cells, and when Crm1-mediated nuclear export is inhibited by treating Crm1 (T539C) cells with Leptomycin B (LepB). Box width indicates the interquartile range, the central line indicates the median and the whiskers indicate the range of 95% of the targets. (F) As in (E), for RBF Nog1. (G) As in (E), for RBF Nog2. ****: p<0.0001, ns: not significant (p>0.05).
Figure 5—figure supplement 1
Detection of LN and mature 60S in the nuclear and cytoplasm in Crm1 (T539C) cells treated with Leptomycin B.
(A) TEM images of the nuclear periphery and vacuole in Crm1 (T539C) cells treated with Leptomycin B, overlaid with LN 60S-detected targets in blue.Scale bar: 50 nm. (B) Bar chart showing the number of LN and mature 60S-detected targets in the indicated subcellular compartments. (C) Violin plot showing the kernelled distribution of 2DTM SNRs for LN 60S-detected targets in the indicated subcellular compartment. ****: p<0.0001. (D) As in (C), showing mature 60S-detected targets. ns: not significant, p>0.05. (E) Violin plot showing the kernelled distribution of 2DTM SNR ratios of targets identified as both LN and mature 60S-detected targets in the indicated subcellular compartment. ****: p<0.0001.
Figure 6 with 2 supplements
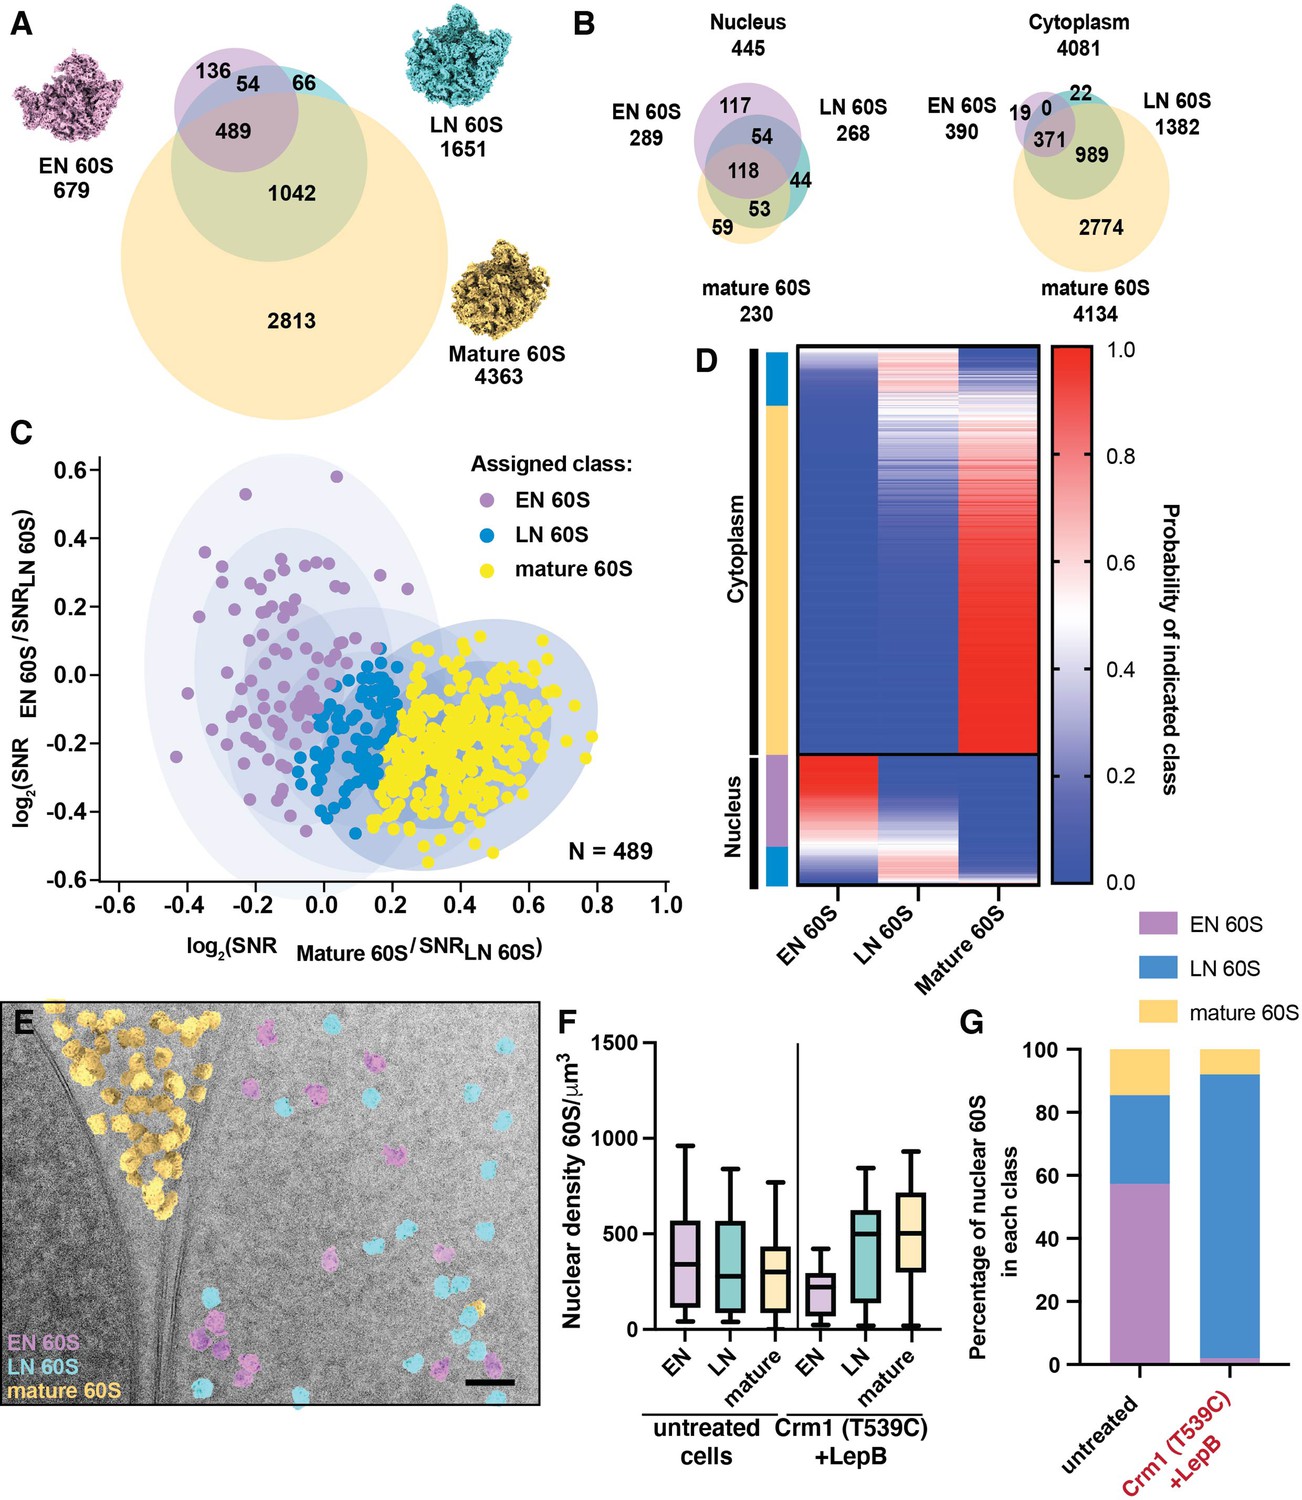
Classification of nuclear targets by relative similarity to early or late nuclear intermediates.
(A) Venn diagram showing the number of significant targets detected in 2DTM searches with the indicated templates. Overlap indicates targets identified in two or more searches. (B) Venn diagrams showing the number of significant targets detected in 2DTM searches with the indicated templates in the nucleus (left) and cytoplasm (right). (C) Scatterplot showing the log2(EN 60S / LN 60S 2DTM SNR) values relative to the log2(mature 60S / LN 60S 2DTM SNR) values for each EN, LN and mature 60S-detected target. Ellipses indicate the fits of three Gaussians and each concentric ellipse indicates one standard deviation from the mean. Each target is colored according to its most likely class membership. (D) Heat map showing the probability of each of the targets examined in (C) belonging to one of the populations, EN, LN or mature 60S. Targets are grouped by their subcellular localization, followed by their classification as EN 60S (purple), LN 60S (light blue), or mature 60S (yellow). (E) Cryo-EM micrograph of the yeast nuclear periphery from a FIB-milled lamella shown in in Figure 1, displaying the results of 2DTM searches, colored by their classification as mature 60S (yellow), LN 60S (blue) or EN 60S (purple) based on their relative 2DTM SNRs. (F) Boxplot showing the nuclear density of EN 60S (purple), LN 60S (light blue), and mature 60S (yellow) detected targets before classification in the indicated cells. (G) Bar chart showing the proportion of the LN 60S-detected targets in the indicated cells that are classified as LN 60S (blue), mature 60S (yellow), or EN 60S (purple).
Figure 6—figure supplement 1

Relative similarity to EN, LN and mature 60S distinguishes the nuclear and cytoplasmic 60S populations.
(A) TEM image of the nuclear periphery shown in Figure 1, overlaid with EN 60S detected targets in purple. (B) Violin plots showing the kernelled distribution of 2DTM SNRs for EN 60S-detected targets in the indicated subcellular compartment. ****: p<0.0001. (C) Histogram showing the distribution of log2(EN 60S / LN 60S SNR) values of EN and LN 60S-detected targets in untreated cells. Targets are grouped by their subcellular distribution. (D) As in (C), showing the distribution of log2(mature 60S / EN 60S SNR) values of mature 60S and EN 60S detected targets. (E) Bar chart showing the proportion of cytoplasmic 60S-detected targets in the indicated cells that are classified as LN 60S (blue), mature 60S (yellow), or EN 60S (purple).
Figure 6—figure supplement 2
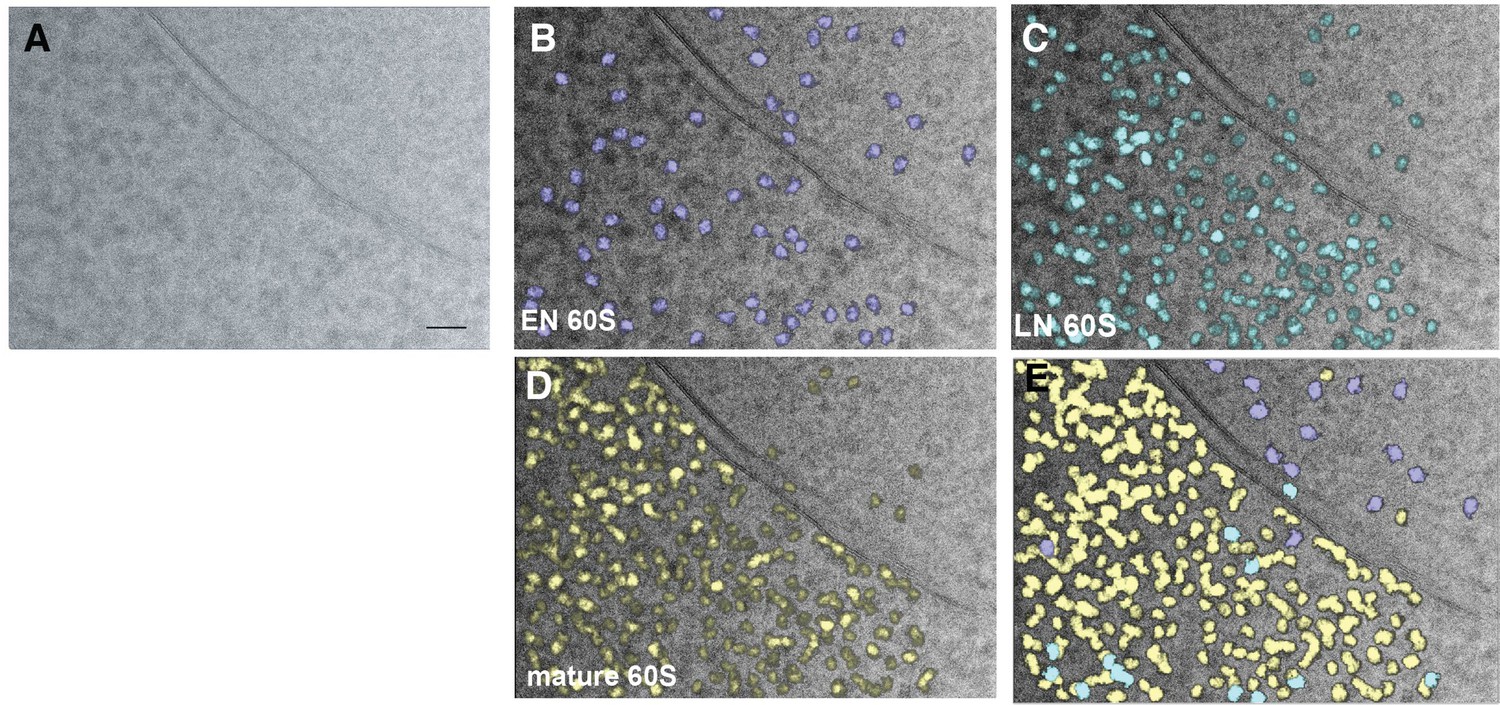
Additional image showing results of classification using EN, LN and mature 60S.
(A) TEM image of the nuclear periphery. Scale bar indicates 50 nm. (B) The image in (A) is shown overlaid with EN 60S-detected targets in purple, (C) LN 60S-detected targets in blue or (D) mature 60S-detected targets in yellow. (E) As in (B) showing the results of 2DTM searches, colored by their classification as mature 60S (yellow), LN 60S (blue) or EN 60S (purple) based on their relative 2DTM SNRs.
Tables
Table 1
Estimated thickness and calculated defocus per image.
| Lamella # | Image file | Est thickness (nm) | Defocus 1 (Å) | Defocus 2 (Å) | Angle |
|---|---|---|---|---|---|
| 1 | 24_Mar11_13.30.44_1_0.mrc | 179 | 5577 | 5434 | 7.9 |
| 1 | 25_Mar11_13.32.53_3_0.mrc | 170 | 5943 | 5636 | 53.07 |
| 2 | 50_Mar11_15.04.14_36_0.mrc | 132 | 3626 | 3298 | 23.33 |
| 2 | 51_Mar11_15.07.03_38_0.mrc | 109 | 3944 | 3863 | 16.91 |
| 2 | 52_Mar11_15.10.54_40_0.mrc | 117 | 6491 | 6192 | 10.89 |
| 2 | 53_Mar11_15.21.33_42_0.mrc | 205 | 4906 | 4610 | 5.32 |
| 2 | 54_Mar11_15.24.09_44_0.mrc | 205 | 7701 | 6828 | –76.32 |
| 2 | 55_Mar11_15.26.04_46_0.mrc | 212 | 5141 | 4794 | 23.45 |
| 2 | 56_Mar11_15.33.15_48_0.mrc | 170 | 7240 | 7093 | 82.03 |
| 2 | 57_Mar11_15.36.27_50_0.mrc | 178 | 5969 | 5807 | –7.87 |
| 2 | 58_Mar11_15.38.03_52_0.mrc | 186 | 6445 | 6182 | –75.84 |
| 3 | 115_Mar12_10.39.05_93_0.mrc | 136 | 3436 | 3230 | –22.72 |
| 3 | 118_Mar12_10.46.25_99_0.mrc | 141 | 3291 | 3200 | 39.71 |
| 4 | 131_Mar12_11.32.55_127_0.mrc | 114 | 4532 | 4377 | 15.85 |
| 4 | 133_Mar12_11.37.56_131_0.mrc | 130 | 3252 | 2979 | 7.24 |
| 4 | 135_Mar12_11.42.53_135_0.mrc | 93 | 3041 | 2977 | –76.83 |
| 4 | 138_Mar12_11.50.12_141_0.mrc | 106 | 3497 | 3404 | 79.97 |
| 5 | 141_Mar12_11.57.31_147_0.mrc | 161 | 6153 | 5600 | –33.24 |
| 5 | 143_Mar12_12.02.15_151_0.mrc | 152 | 4552 | 4457 | –36.2 |
| 5 | 146_Mar12_12.19.02_157_0.mrc | 98 | 3902 | 3868 | 61.58 |
| 5 | 147_Mar12_12.21.27_159_0.mrc | 103 | 4305 | 4066 | 16.81 |
| 5 | 148_Mar12_12.23.52_161_0.mrc | 73 | 3728 | 3604 | –36.33 |
| 5 | 149_Mar12_12.26.15_163_0.mrc | 78 | 3696 | 3573 | 0.37 |
| 5 | 150_Mar12_12.28.45_165_0.mrc | 98 | 3723 | 3607 | 1.6 |
| 5 | 151_Mar12_12.31.16_167_0.mrc | 114 | 3771 | 3648 | 54.64 |
| 6 | 168_Mar12_13.11.12_199_0.mrc | 147 | 3157 | 3040 | –57.66 |
| 6 | 171_Mar12_13.18.43_205_0.mrc | 90 | 2309 | 2102 | 31.47 |
| 7 | 6 A_Mar11_14.59.49_34_0.mrc | 126 | 5210 | 4391 | 2.1 |
Key resources table
| Reagent type (species) or resource | Designation | Source or reference | Identifiers | Additional information |
|---|---|---|---|---|
| Strain, strain background (Sacchromyces cerevisiae) | BY4741 | ATCC | S288C | |
| Strain (Sacchromyces cerevisiae) | Crm1 (T539C) | Neville and Rosbash, 1999 | MNY8 | |
| Software, algorithm | cisTEM | Grant et al., 2018; Lucas et al., 2021 | https://cistem.org/development |
Additional files
Download links
A two-part list of links to download the article, or parts of the article, in various formats.
Downloads (link to download the article as PDF)
Open citations (links to open the citations from this article in various online reference manager services)
Cite this article (links to download the citations from this article in formats compatible with various reference manager tools)
In situ single particle classification reveals distinct 60S maturation intermediates in cells
eLife 11:e79272.
https://doi.org/10.7554/eLife.79272


