Centriolar satellites expedite mother centriole remodeling to promote ciliogenesis
- MRC Human Genetics Unit, Institute of Genetics and Cancer, University of Edinburgh, United Kingdom
- Department of Biochemistry and Biophysics, Cardiovascular Research Institute, University of California, United States
- Lunenfeld-Tanenbaum Research Institute, Sinai Health System, Canada
- Cavanilles Institute of Biodiversity and Evolutionary Biology, University of Valencia, Spain
- Predepartamental Unit of Medicine, Jaume I University, Spain
- Institute of Genetics and Cancer, University of Edinburgh, United Kingdom
- Department of Molecular Genetics, University of Toronto, Canada
- Chan Zuckerberg Biohub, United States
Figures
Figure 1 with 3 supplements
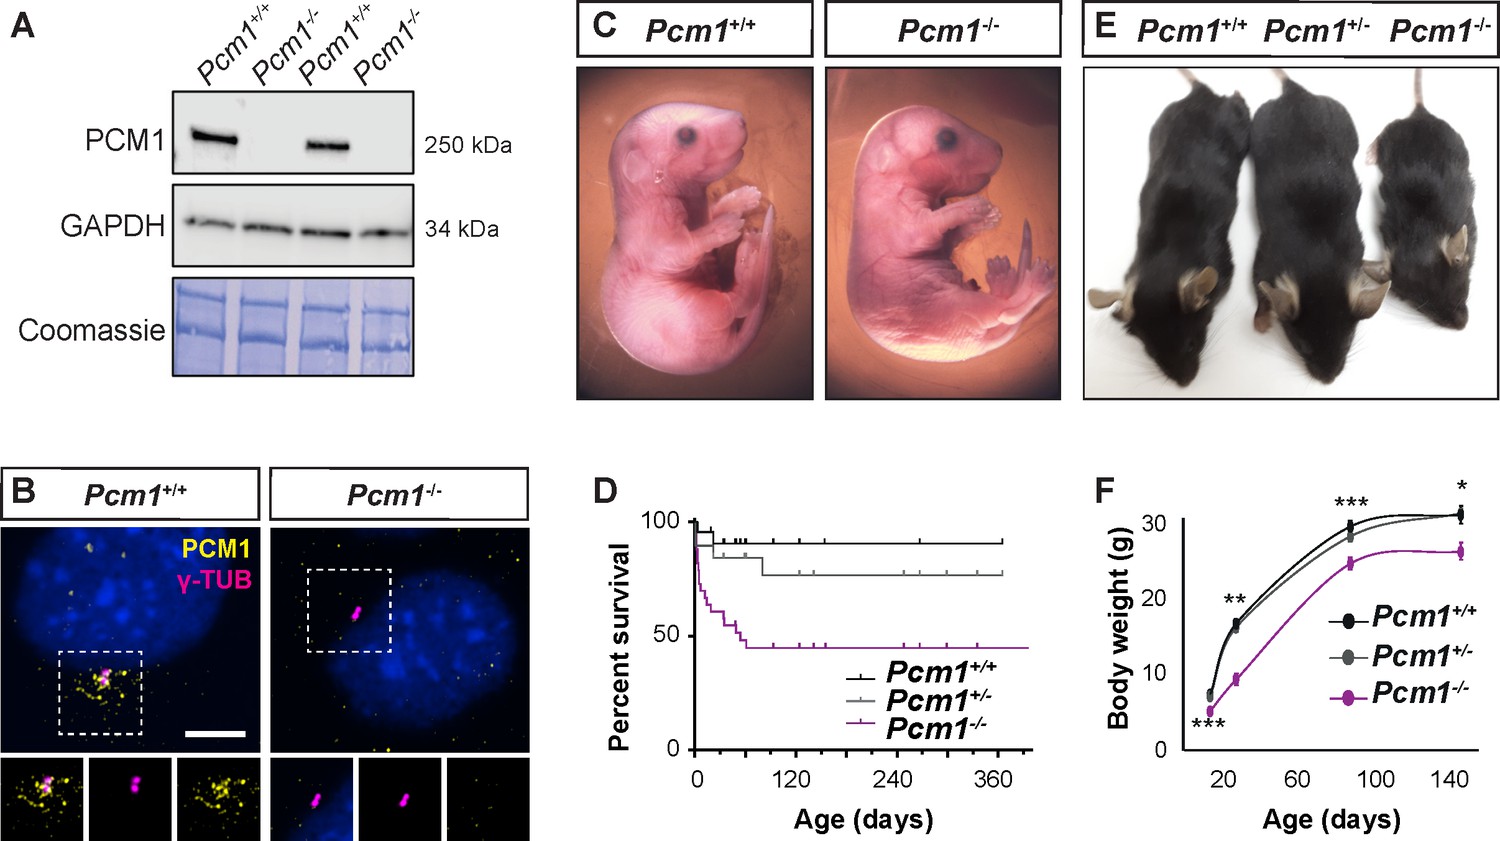
PCM1 is important for perinatal survival.
(A) Immunoblot of mouse embryonic fibroblast (MEF) lysates from wild-type and Pcm1−/− MEFs for PCM1 and GAPDH (loading control). Gel stained with Coomassie blue. (B) Immunostaining of PCM1 (yellow) and centrioles (γ-tubulin, γ-TUB, magenta) in wild-type and Pcm1−/− MEFs. (C) E18.5 wild-type and Pcm1−/− neonates. (D) Kaplan–Meier curve of wild-type, Pcm1+/- and Pcm1−/− mice. See also Figure 1—figure supplement 1D. (E) P28 wild-type, Pcm1+/− and Pcm1−/− mice. (F) Graph of body weights of wild-type, Pcm1+/− and Pcm1−/− mice by age. Student’s t-test *p < 0.05, **p < 0.01, ***p < 0.001. Error bars represent standard error of the mean (SEM), n > 7 per genotype at P14 and n > 3 per genotype at P150.
-
Figure 1—source data 1
Full uncropped immunoblots for Figure 1A and Figure 1—figure supplement 1C, labeled and unlabeled.
- https://cdn.elifesciences.org/articles/79299/elife-79299-fig1-data1-v2.pdf
Figure 1—figure supplement 1
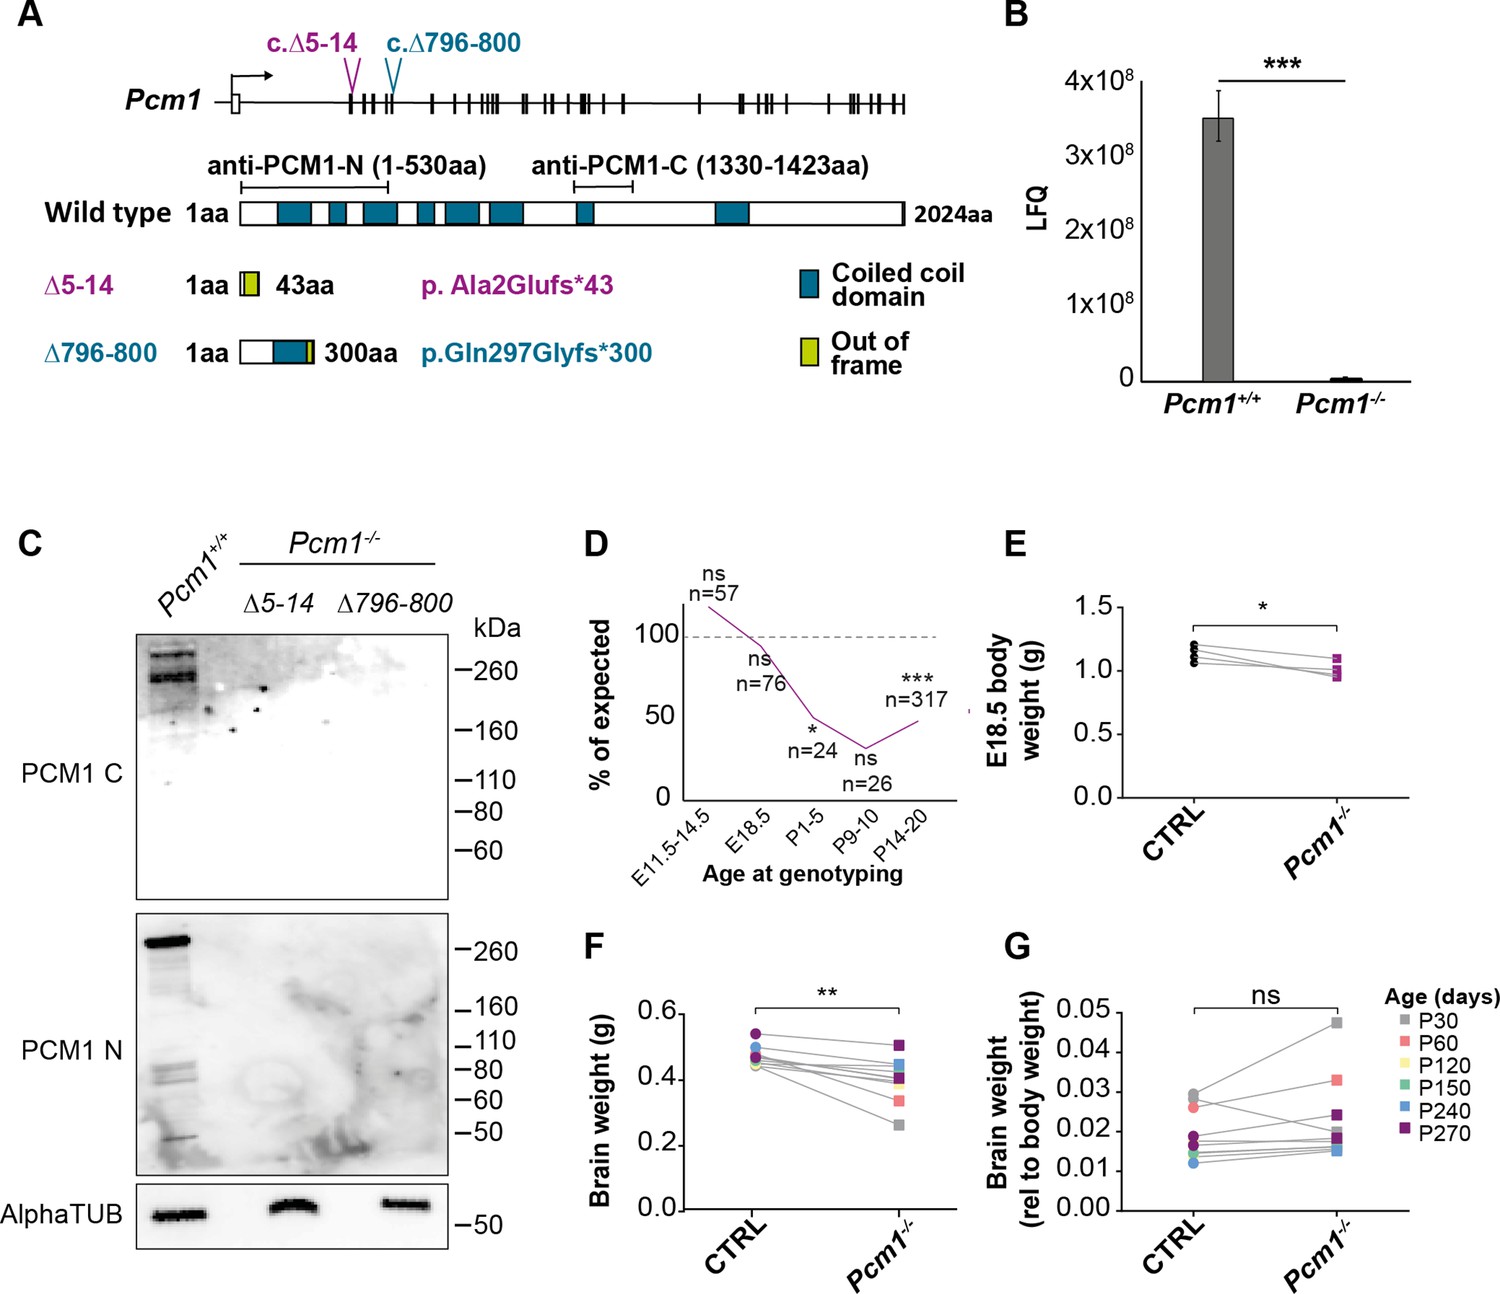
PCM1 promotes survival and growth.
(A) Schematics of two CRISPR/Cas9-generated indels in Pcm1, Pcm1Δ5-14 and Pcm1Δ796-800. Both Pcm1Δ5-14 and Pcm1Δ796-800 create frameshifts. Schematic of PCM1 protein, indicating predicted coiled-coil domains and epitopes used for generating anti-PCM1 antibodies. (B) Label-free quantitative (LFQ) mass spectrometry of PCM1 peptides in wild-type and Pcm1−/− mouse tracheal epithelium cells (mTECs) differentiated for 7 days at air–liquid interface. Student’s t-test ***p < 0.01. Error bars represent SEM, n = 3 wells from individual animals per genotype. (C) Immunoblot of Pcm1Δ5-14/Δ5-14 and Pcm1Δ796-800/Δ796-800 testis lysates for PCM1 using antibody directed against the PCM1 N-terminus (N), C-terminus (C), and α-tubulin (loading control). (D) Number of Pcm1−/− animals genotyped at each age as a percentage of the expected number, *p < 0.05, ***p < 0.001, Chi-squared. n represents number of animals genotyped at given age. (E) E18.5 wild-type and Pcm1−/− embryo weights. Each pair of points represents the average control or Pcm1−/− embryo weight in a given litter. Paired t-test. *p < 0.05, ***p < 0.001. (F) Wild-type and Pcm1−/− brain weights at various ages from P30 to P270. (G) Wild-type and Pcm1−/− brain weights relative to body weight at various ages from P30 to P270. ns: not significant. (F, G) Paired t-test, sex and litter matched. **p < 0.01, ns: not significant. CTRL: control,combined wild-type and Pcm1+/− mouse measurements.
Figure 1—figure supplement 2

Pcm1Δ5-14/Δ5-14 and Pcm1Δ796-800/Δ796-800 mice exhibit comparable phenotypes.
(A, B) Observed number of wild-type, Pcm1+/Δ5-14, Pcm1Δ5-14/Δ5-14, Pcm1+/Δ796-800, and Pcm1Δ796-800/Δ796-800 mice as a percentage of the expected number. Chi-squared: ***p < 0.01, *p < 0.05. (C, D) Body weights of wild-type, Pcm1+/Δ5-14, Pcm1Δ5-14/Δ5-14, Pcm1+/Δ796-800, and Pcm1Δ796-800/Δ796-800 mice. Student’s t-test: **p < 0.01, ***p < 0.001. Error bars represent SEM, n > 3 per genotype per age. (E, F) Percentage of control (heterozygote and wild-type), Pcm1Δ5-14/Δ5-14 and Pcm1Δ796-800/Δ796-800 mice displaying overt hydrocephaly. Chi-squared: **p < 0.01, ***p <0.001.
Figure 1—figure supplement 3

PCM1 is dispensable for ciliogenesis in some cell types.
(A, C, E) Sagittal sections of wild-type and Pcm1−/− E18.5 embryos immunostained for cilia (polyglutamylated tubulin: TUBPolyE, magenta and ARL13B, yellow). Nuclear stain (4′,6-diamidino-2-phenylindole (DAPI)) in blue. Insets depict higher magnification views of demarcated areas. Tissues shown are ribs (A), kidney (C), and trachea (E). Primary cilia are marked by white arrows. (B) Percentage of E18.5 rib wild-type and Pcm1−/− cells that are ciliated. (D) Length of cilia in E18.5 wild-type and Pcm1−/− cortical kidney epithelial cells. n = 2 animals/genotype represented by large symbols, small symbols represent individual field of view. Error bars represent SEM. Student’s t-test. ns: not significant. Scale bars represent 30 µm in main panels (A, C), 20 µm (E), and 10 µm insets.
Figure 2 with 4 supplements
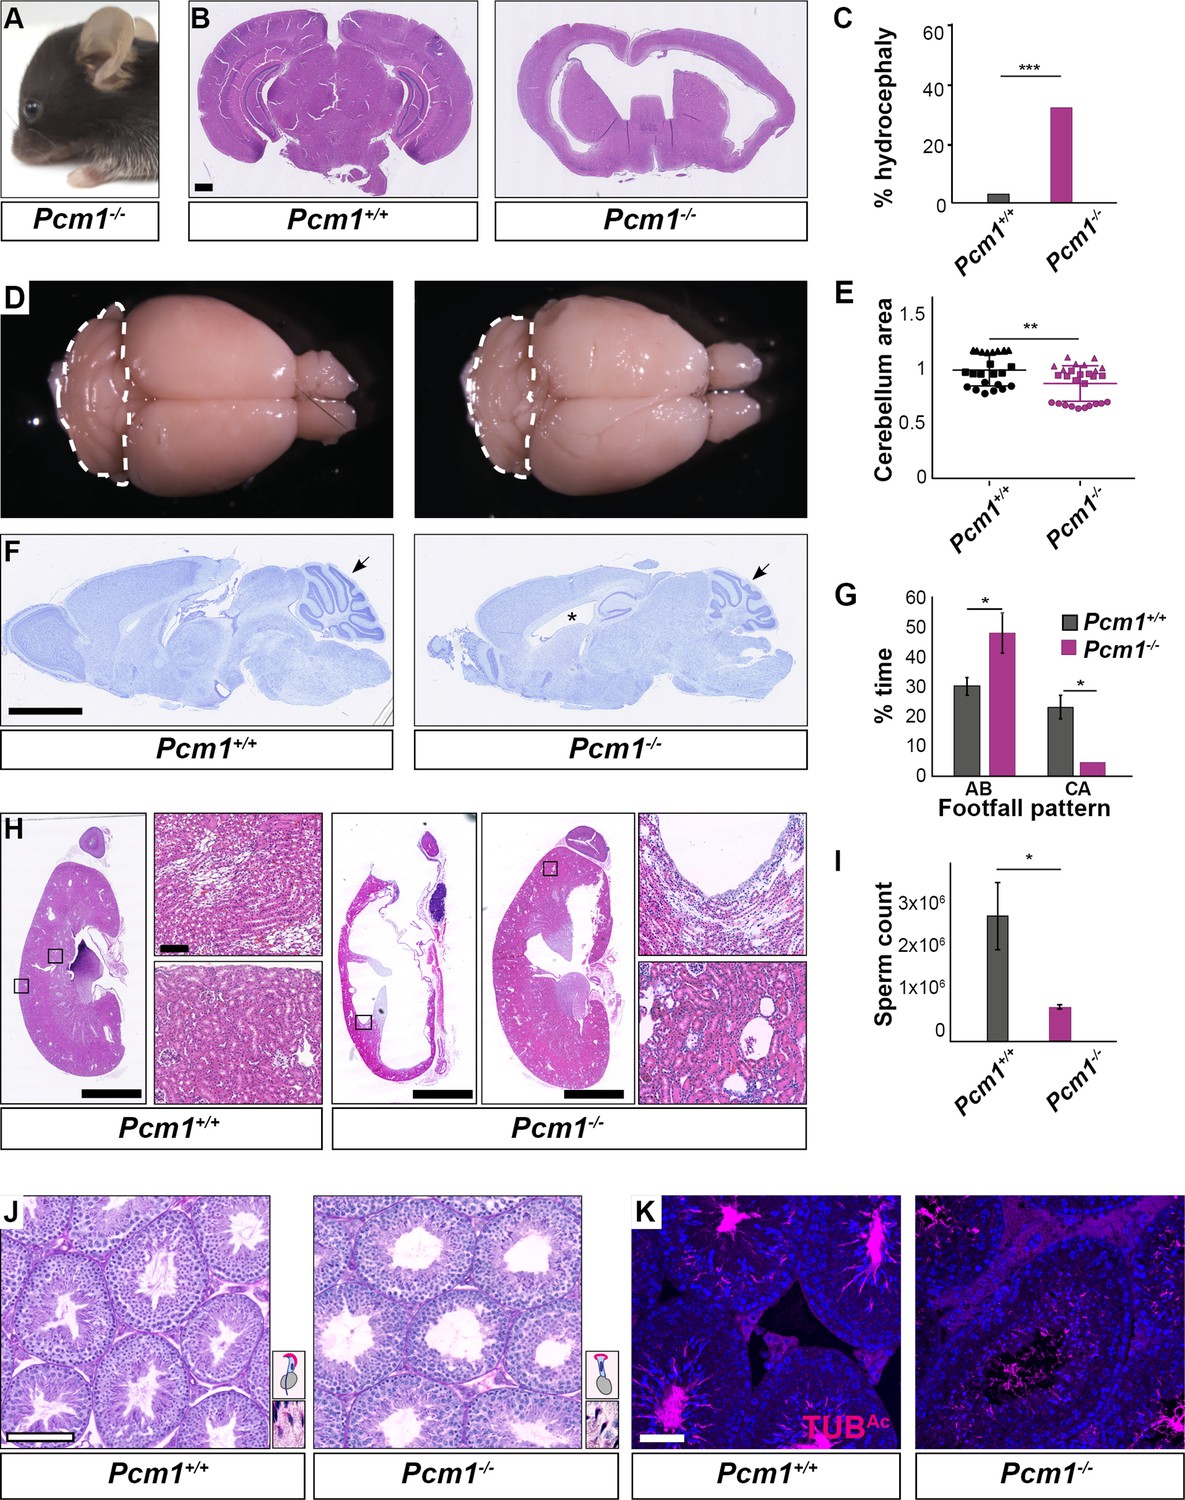
Pcm1−/− mice display ciliopathy-associated phenotypes.
(A) Pcm1−/− mouse displaying a domed skull indicative of hydrocephaly. (B) Coronal sections of 5-week-old wild-type and Pcm1−/− brains. (C) Percentages of wild-type and Pcm1−/− mice exhibiting hydrocephaly (n = 22 Pcm1−/− mice, age 19 days to 3 months (with hydrocephaly) and 6 weeks to 1 year (without overt hydrocephaly), n = 35 age-matched littermate controls). ***p < 0.001 (D) Gross morphology of 8-month-old wild-type and Pcm1−/− brains. Cerebella are delineated with dotted lines. (E) Quantification of cerebellar area measured from sagittal sections of 2- to 8-month-old brains from Pcm1−/− mice without frank hydrocephaly, normalized to the mean of wild-type cerebellar area. N = 3. Each shape represents a different animal. Error bars indicate standard deviations. Student’s t-test: **p < 0.01. (F) Cresyl violet-stained sagittal sections of 8-month-old brains. Cerebella are indicated with arrows. *Dilated ventricle. (G) Percentage of time spent by adult wild-type and Pcm1−/− mice in alternate (AB) gait and cruciate (CA) gait. Mean ± standard error of the mean (SEM). Pcm1+/+ n = 4, Pcm1−/− n = 5. Student’s t-test: *p < 0.05. (H) H&E-stained sections of kidneys and adrenals from 6-week-old wild-type and Pcm1−/− mice. (I) Sperm count per ml of wild-type and Pcm1−/− epididymal semen. n = 3 per genotype. Error bars represent SEM. Student’s t-test: *p < 0.05 (J) PAS-stained sections of 3-month-old wild-type and Pcm1−/− seminiferous tubules. Insets are higher magnification images of elongated spermatids (see Figure 2—figure supplement 1C for lower magnification images), with a cartoon of sperm head morphology. (K) Immunofluorescence staining of wild-type and Pcm1−/− seminiferous tubules for sperm flagella (acetylated tubulin, TUBAc, magenta) and nuclei (DAPI, blue). Scale bars represent 1 mm in B, 2.5 mm in F and H, 100 µm in J, and 50 µm in K.
Figure 2—figure supplement 1
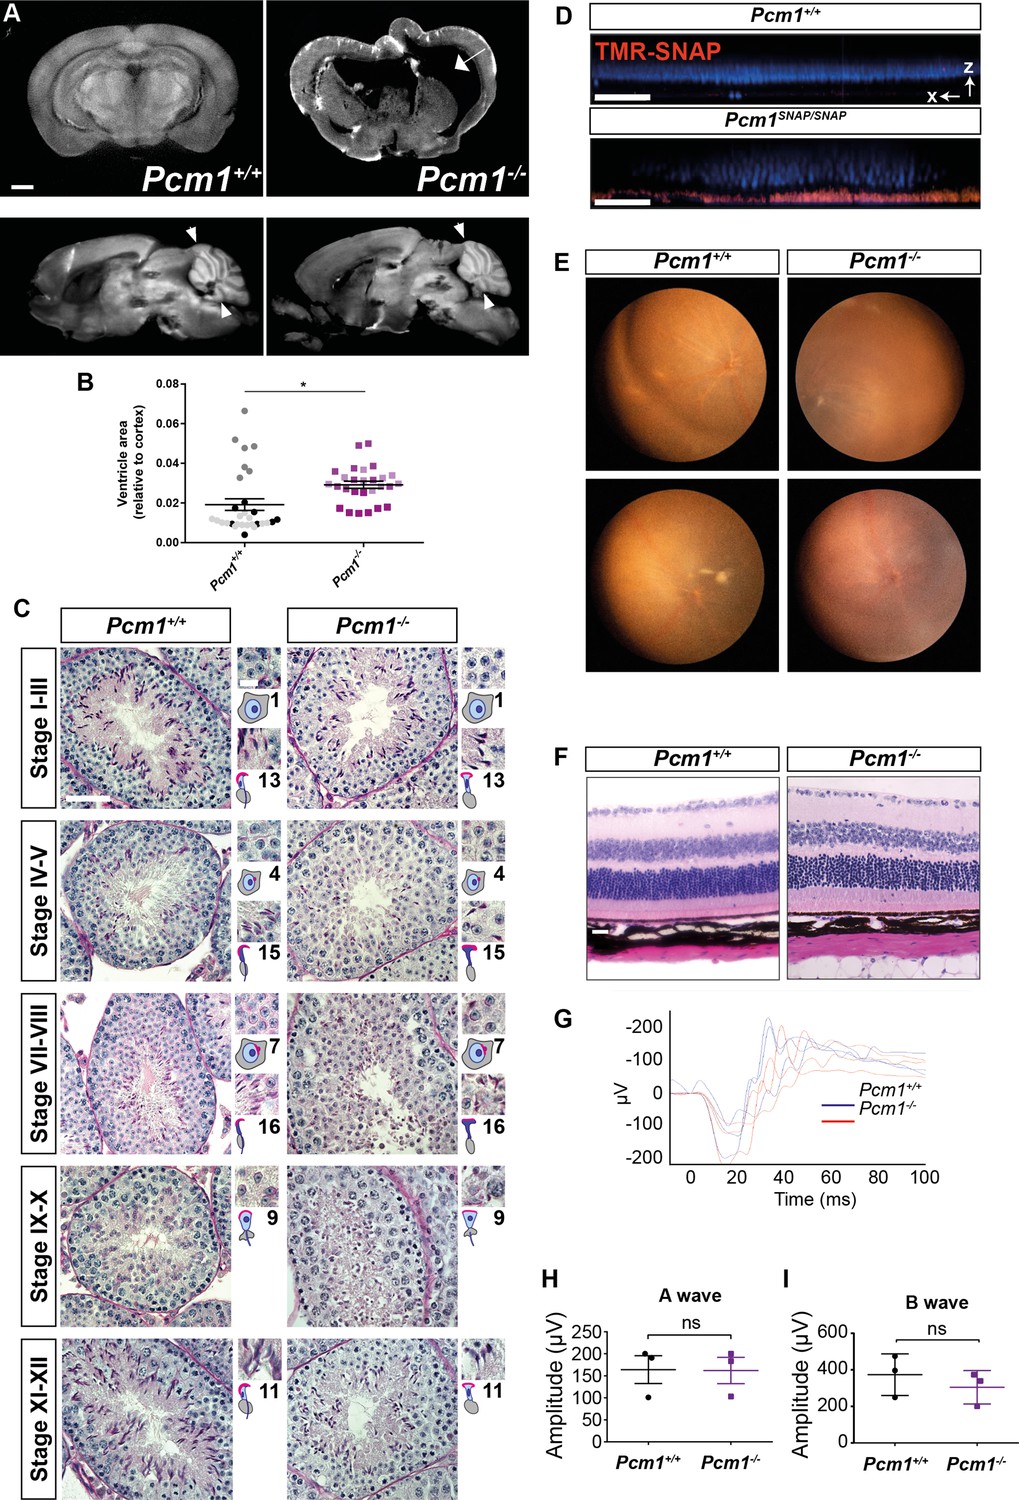
Pcm1−/− mice display a subset of ciliopathy-associated phenotypes.
(A) Coronal (6 weeks, top images) and sagittal (8 months, bottom images) optical projection tomography (OPT) images of brains of wild-type and Pcm1−/− mice. Dilated ventricle is marked by an arrow. Cerebellar limits are indicated by arrowheads. Scale bar represents 1 mm. (B) Ventricle size relative to cortex size of wild-type and Pcm1−/− mice without overt hydrocephaly. Each point depicts a measurement from an individual sagittal section. Each shade represents a separate animal. Student’s t-test: *p < 0.05. (C) PAS staining of stage-matched wild-type and Pcm1−/− testis seminiferous tubules. Insets show enlargements of developing spermatids, with cartoons depicting spermatid morphology and stage number. Scale bar represents 50 μm in main panels and 10 μm in insets. (D) Intravitreous injection of tetramethylrhodamine (TMR)-SNAP into wild-type and Pcm1SNAP/SNAP eyes labels PCM1-SNAP in the retinas. DAPI marks nuclei (blue). Displayed is a single X–Z slice from a confocal z stack. Scale bar represents 40 μm. (E) Fundal imaging of 1-year-old wild-type and Pcm1−/− eyes. (F) H&E-stained sections of 13-month-old wild-type and Pcm1−/− retinas. Scale bar represents 20 μm. (G) Electroretinograms (ERGs) of 9-month-old wild-type and Pcm1−/− mice. (H) Quantification of ERG A-waves, reflecting the rapid cornea negative potential. Student’s t-test. (I) Quantification of ERG B-waves, reflecting the slow cornea positive potential. Student’s t-test, error bars represent SEM. ns: not significant.
Figure 2—video 1
Wild-type sperm morphology and movement.
Sperm were isolated from wild-type testes and imaged in dilute methyl cellulose.
Figure 2—video 2
Pcm1−/− sperm are immotile and lack normal head structures.
Sperm were isolated from Pcm1−/− testes and imaged in dilute methyl cellulose.
Figure 2—video 3
Pcm1−/− sperm exhibit disrupted movement.
Sperm were isolated from Pcm1−/− testes and imaged in media without methyl cellulose.
Figure 3 with 10 supplements
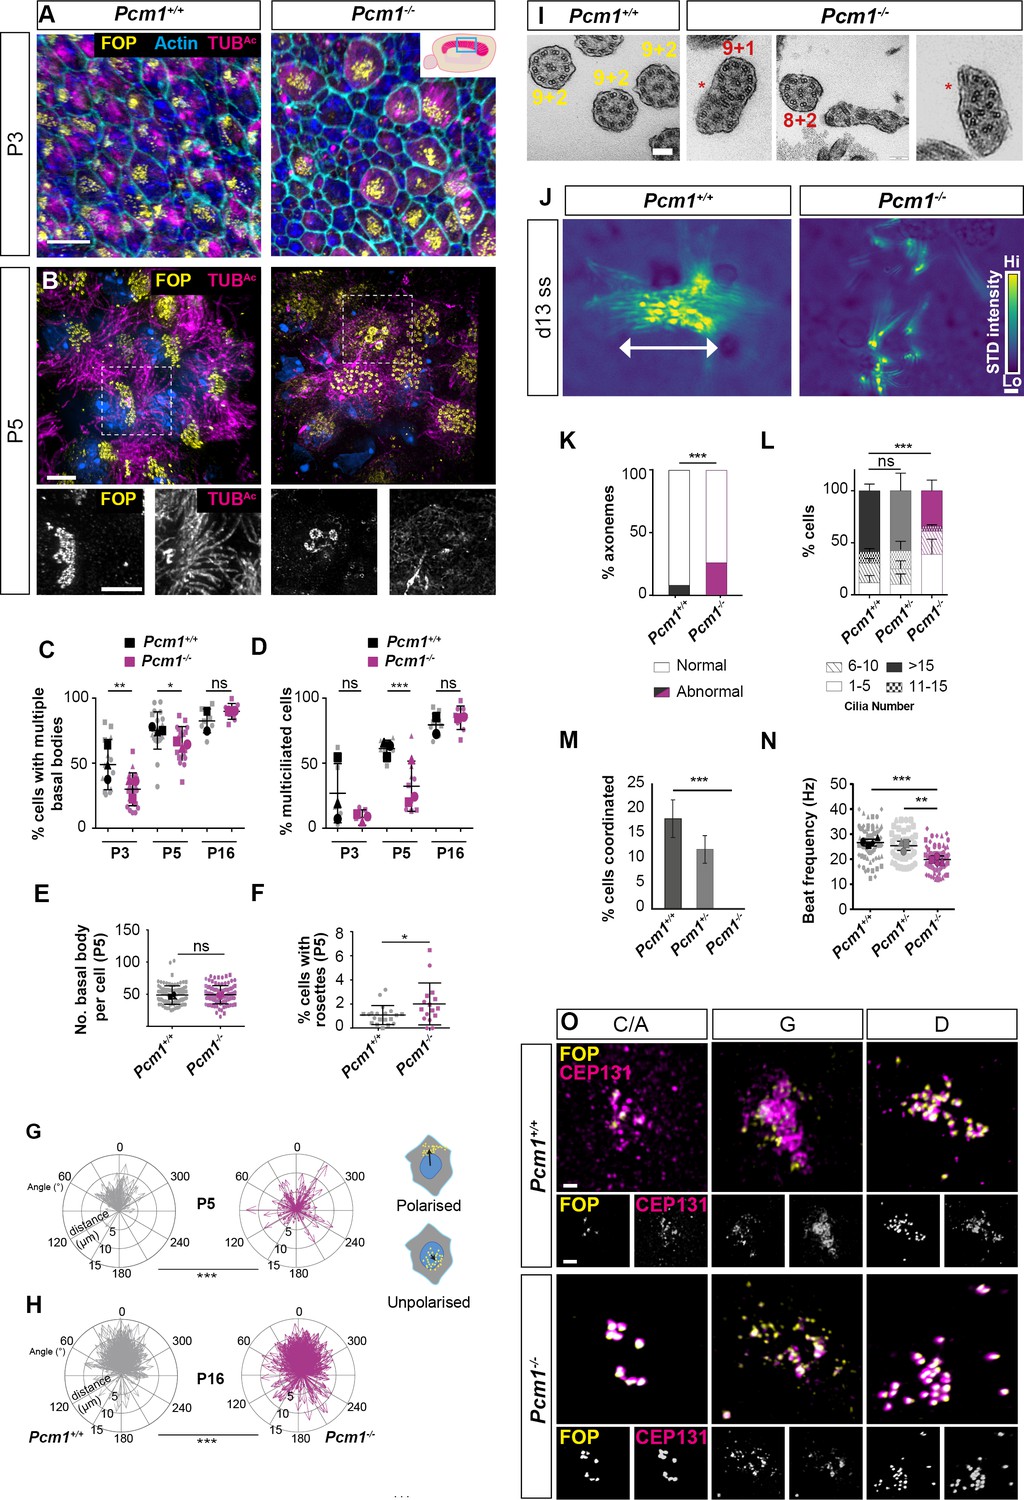
PCM1 is required for efficient basal body synthesis and multiciliogenesis.
(A) Wild-type and Pcm1−/− P3 wholemount brain ventricles immunostained for basal bodies (FOP, yellow), actin (phalloidin, cyan) and cilia (TUBAc, magenta). Inset depicts area of ventricle imaged (cyan box). (B) Wild-type and Pcm1−/− P5 wholemount ventricles immunostained for basal bodies (FOP, yellow), cilia (TUBAc, magenta), and nuclei (DAPI, blue). Below: single optical planes highlight the persistence of rosettes and disrupted ciliogenesis in Pcm1−/− ependymal cells. (C) Percentage of ependymal cells with >4 basal bodies in wild-type and Pcm1−/− P3, P5, and P16 ventricles. Each shape represents an animal; the smaller symbols represent individual images and the larger shape the mean for each animal. Student’s t-test: *p < 0.05, **p < 0.01, ns: not significant. (D) Percentage of ependymal cells with multiple cilia in wild-type and Pcm1−/− P3, P5, and P16 ventricles. Student’s t-test: ***p < 0.001, ns, not significant. (E) The number of basal bodies per wild-type and Pcm1−/− P5 ependymal cell. (F) Percentage of P3 wild-type and Pcm1−/− ependymal cells with centriolar rosette structures. Student’s t-test: *p < 0.05. (G, H) Rose plots of the translational polarity of basal bodies in wild-type and Pcm1−/− P5 and P16 ependymal cells, as assessed from immunofluorescent images as in Figure 3—figure supplement 1A, B. Schematic insets represent individual ependymal cells with polarized or unpolarized basal bodies (yellow). An arrow was drawn from the center of the nucleus (blue) to the center of the basal bodies (yellow) and the distance and angle is plotted relative to the average angle for that field of view, which was set to 0ᵒ. At both P5 and P16, the standard deviations between wild-type and Pcm1−/− ependymal cells are different (F-test: ***p < 0.0001). (I) Transmission electron microscopy (TEM) of ependymal cell cilia from P3 wild-type and Pcm1−/− ventricles. Wild-type cilia display 9 + 2 microtubule arrangement. Pcm1−/− cilia display axonemal defects, including missing microtubule doublets and axoneme fusion (indicated by *). (J) Colorized heat map (scale: yellow – high, blue – low) of maximum projection of the standard deviation of pixel intensity in Figure 3—videos 1 and 2, depicting wild-type and Pcm1−/− cultured ependymal cell cilia beat coordination. Areas of high pixel intensity variation reflect areas of increased movement. (K) Percentage of P3 wild-type and Pcm1−/− ependymal cilia structural anomalies. Chi-squared test: ***p < 0.001. n = 121 cilia from 3 wild-type mice and 61 cilia from 3 Pcm1−/− mice. (L) Percentage of cultured wild-type and Pcm1−/− ependymal cells with ranges of cilia number 14–16 days after serum withdrawal. Chi-squared test: ***p < 0.001. ns: not significant. (M) Percentage of cultured wild-type and Pcm1−/− ependymal cells with coordinated ciliary beating 14–16 days after serum withdrawal. Chi-squared test: ***p < 0.01. (N) Cilia beat frequency of cultured wild-type and Pcm1−/− ependymal cells 14–16 days after serum withdrawal. Small symbols represent individual cells, large symbols represent average for each cell lines from an individual animal. Student’s t-test: ***p < 0.001, **p < 0.01. (O) Representative images of wild-type and Pcm1−/− mouse tracheal epithelium cells (mTECs) cultured at air–liquid interface for 3 days and immunostained for basal bodies (FOP, yellow) and CEP131 (magenta). Representative cells cultured from n = 3 wild-type and 3 Pcm1−/− animals, at the ‘centriolar amplification’ (C/A), ‘growth’ (G), and ‘disengagement’ (D) stages of centriolar amplification are shown (see also Figure 3—figure supplement 1G). Scale bars: 15 µm (A), 5 µm (B), 100 nm (I), and 1 μm main panel, 2 μm inset (O). Error bars represent SEM.
Figure 3—figure supplement 1
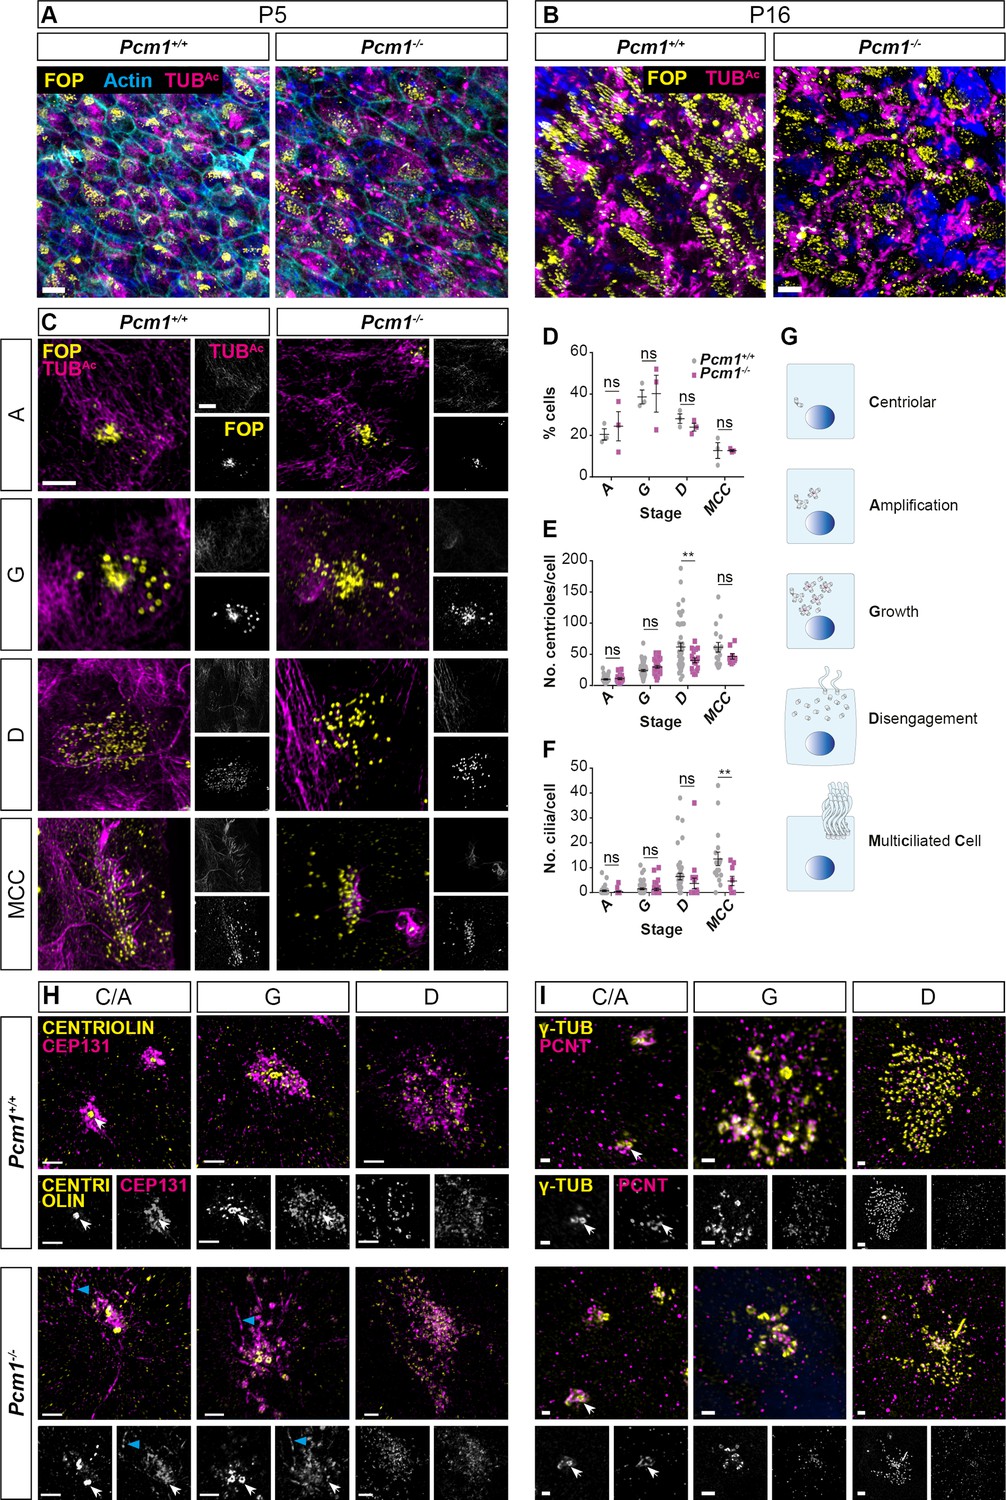
Centriole amplification is delayed and fibrogranular material is disrupted in Pcm1−/− ependymal cells.
Ependymal cells from P5 (A) and P16 (B) wild-type and Pcm1−/− ventricles immunostained for basal bodies (FOP, yellow), cilia (TUBAc, magenta) and, at P5, actin (phalloidin, cyan). (C) Cultured wild-type and Pcm1−/− ependymal cells 3 days after serum withdrawal and immunostained for basal bodies (FOP, yellow) and cilia (TUBAc, magenta), at the ‘amplification’ (A), ‘growth’ (G), ‘disengagement’ (D), and multicilated cell (MCC) stages of centriolar amplification. (D) Percentage of wild-type and Pcm1−/− cultured ependymal cells at each stage of centriole amplification after 3 days of serum starvation. (E) The number of centrioles per ependymal cell at each stage of centriole amplification after 3 days of serum starvation. (F) The number of cilia per ependymal cell at each stage of centriole amplification after 3 days of serum starvation. For (D–F), each point represents a cell, n = 3 cultures/genotype, each from a different mouse. Two-way analysis of variance (ANOVA), Sidak corrected for multiple testing: ns, not significant, **p < 0.01. (G) Schematic depicting the stages of centriolar amplification and multiciliogenesis in cultured ependymal cells. Representative images of cultured wild-type and Pcm1−/− ependymal cells after 3 days of serum starvation and immunostained for basal bodies (FOP, yellow) and CEP131 magenta (H) or PCNT magenta, (I), at the ‘centriolar/amplification’ (C/A), ‘growth’ (G) and ‘disengagement’ (D) stages of centriolar amplification. White arrows indicate basal bodies. Blue arrowheads indicate elongated fibrous deposition of CEP131. Scale bars: 10 µm (A), 5 µm (B), 5 µm (C), 2 µm (H), and 1 µm (I). Error bars represent SEM.
Figure 3—figure supplement 2
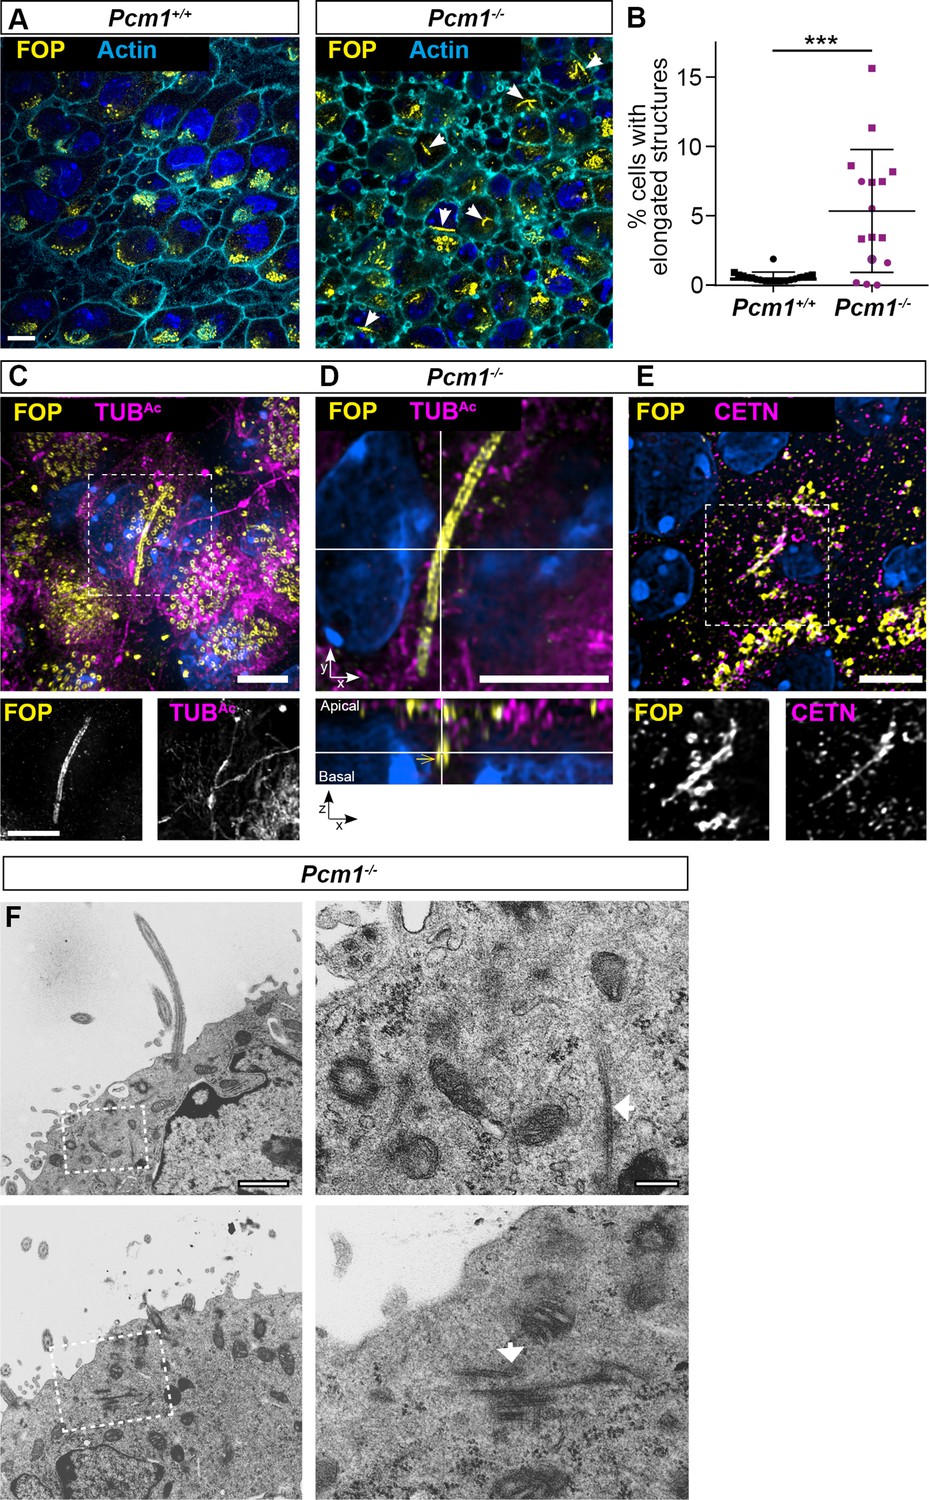
Pcm1−/− ependymal cells form elongated centriole-like structures.
(A) Ependymal cells from P3 wild-type and Pcm1−/− ventricles immunostained for FOP (yellow), actin (phalloidin, cyan), and nuclei (DAPI, blue). A single optical section basal to most basal bodies is shown. Arrows indicate elongated structures to which FOP localizes with a mean length of 5.0 µm (standard deviation ±1.9 µm). (B) Percentage of wild-type and Pcm1−/− ependymal cells with elongated FOP-localized centriole-like structures. n = 2 wild-type and 3 Pcm1−/− mice. Student’s t-test: ***p < 0.001. Error bars represent SEM. (C) Pcm1−/− ependymal cells from P3 ventricle immunostained for FOP (yellow), TUBAc (magenta), and nuclei (DAPI, blue). Single channel images shown below. (D) Apical and lateral views of a Pcm1−/− ependymal cells from P3 ventricle immunostained for FOP (yellow), TUBAc (magenta), and nuclei (DAPI, blue). (E) Pcm1−/− ependymal cell from P3 ventricle immunostained for FOP (yellow), Centrin (CETN, magenta), and nuclei (DAPI, blue). Single channel images are below. (F) Transmission electron microscopy (TEM) of Pcm1−/− ependymal cells from P3 ventricle. Outlined areas are shown in magnified views (right). Arrows indicate elongated fibrillar structures specific to Pcm1−/− cells. Scale bars: 10 µm (A), 5 µm (C–E), 1 µm (F, left), and 200 nm (F, right).
Figure 3—figure supplement 3
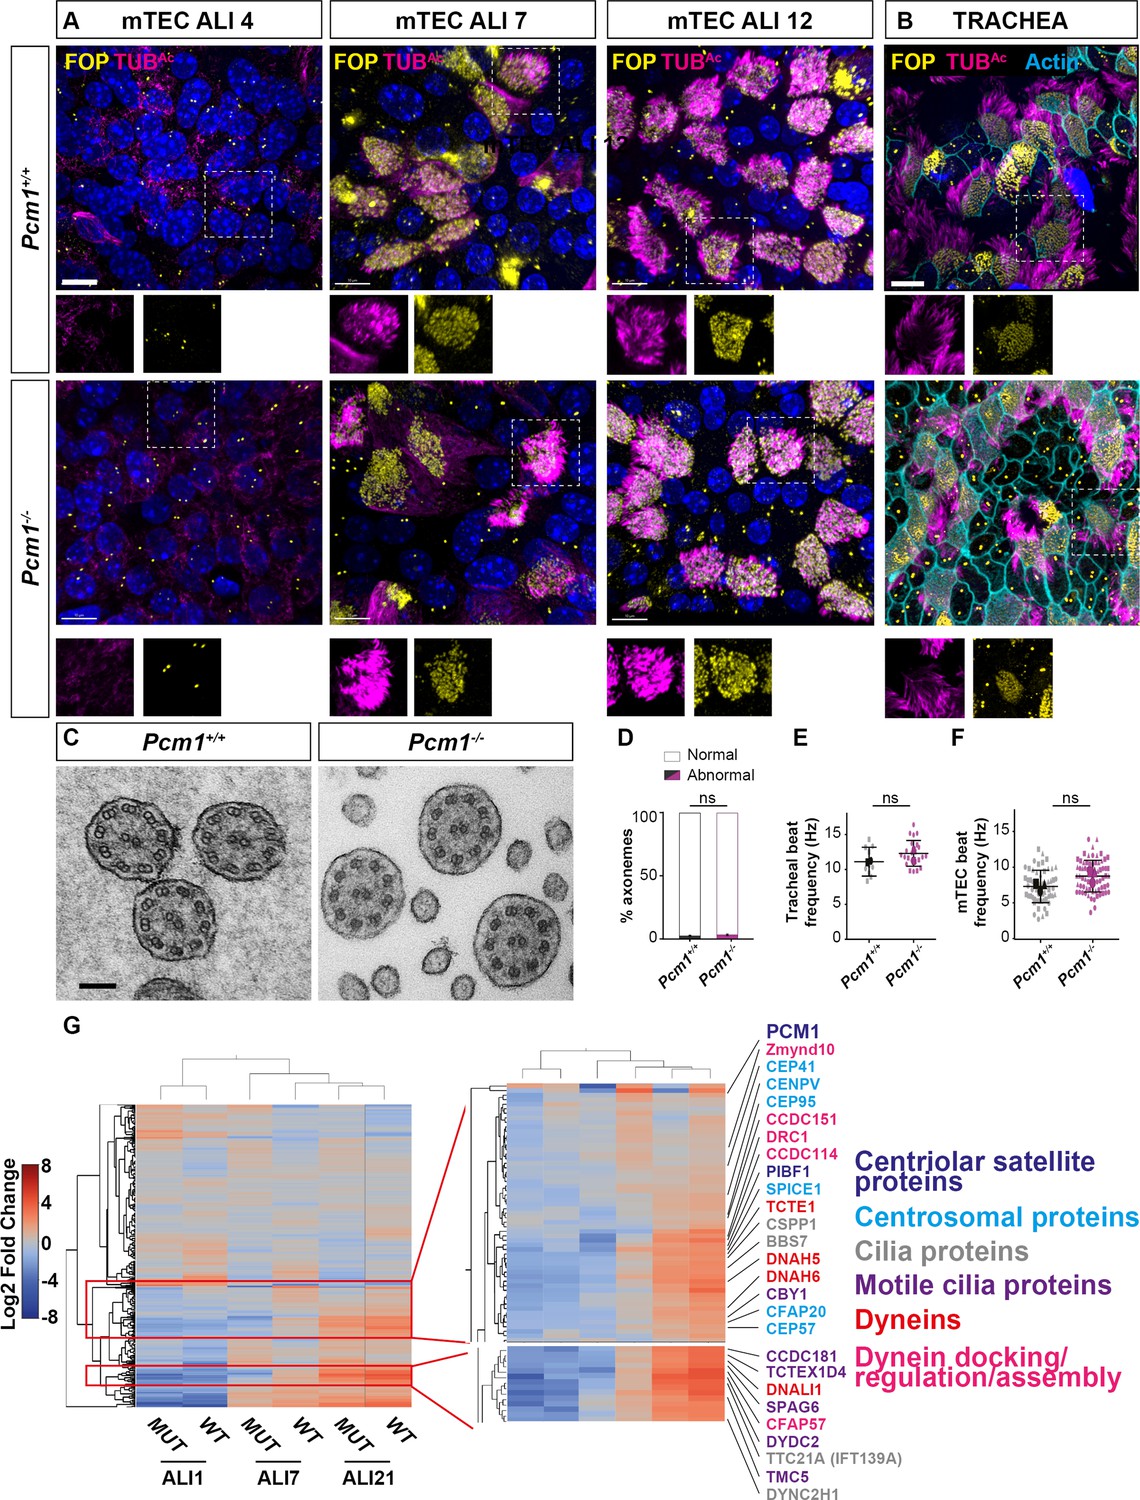
Delayed expression of ciliary proteins in Pcm1−/− mouse tracheal epithelium cells (mTECs).
(A) Wild-type and Pcm1−/− mTECs immunostained for basal bodies (FOP, yellow), cilia (TUBAc, magenta), and nuclei (DAPI, blue) 4, 7, or 12 days after placement at air–liquid interface (ALI). Below: single channel images from boxed areas. (B) Wild-type and Pcm1−/− P5 tracheas immunostained for basal bodies (FOP, yellow), cilia (TUBAc, magenta), and actin (phalloidin, cyan). Scale bar: 10 µm. (C) Transmission electron microscopy (TEM) of axonemes of cilia from 6-month-old wild-type and Pcm1−/− tracheas. Scale bar: 100 nm. (D) Percentage of axonemal abnormalities in ciliary axonemes of wild-type and Pcm1−/− tracheal multiciliated cells (n = 120 wild-type axonemes from 3 animals, 82 Pcm1−/− axonemes from 3 animals). (E) Wild-type and Pcm1−/− tracheal cilia beat frequencies, n = 2 per genotype, large symbol represents average for that animal, small symbols represent individual cells. (F) Wild-type and Pcm1−/− mTEC cilia beat frequencies. N = 3 per genotype, large symbol represents average for that animal, small symbols represent individual cells, Student’s t-test: ns, not significant. (G) Heatmap of label-free quantitative (LFQ) mass spectrometry analysis of wild-type and Pcm1−/− mTECs, depicting all changed proteins between timepoints or genotypes at ALI D0 (unciliated), D7 (ciliating), and D21 (ciliated). Right: expansion of two clusters of proteins reduced in Pcm1−/− mTECs at ALI D7. Font color indicates ontology: centriolar satellite proteins are in dark blue, centrosomal proteins are in light blue, ciliary proteins are in gray, and ciliary motility proteins are in purple, and include dyneins (red) and dynein axonemal assembly factors (pink). See also Supplementary file 5. Error bars represent SEM.
Figure 3—video 1
Wild-type cultured ependymal cilia beat in a coordinated way 14 days after serum withdrawal.
Figure 3—video 2
Pcm1−/− ependymal cilia show uncoordinated, slow ciliary beat 16 days after serum withdrawal.
Figure 3—video 3
Pcm1−/− ependymal cilia show uncoordinated, slow ciliary beat 14 days after serum withdrawal.
Figure 3—video 4
Cilia of a tracheal wholemount preparation from a 3-month-old wild-type mouse beating.
Figure 3—video 5
Cilia of a tracheal wholemount preparation from a 2-month-old Pcm1−/− mouse beating.
Figure 3—video 6
Wild-type ALI12 mouse tracheal epithelium cell (mTEC) cilia beating.
Figure 3—video 7
Pcm1−/− ALI12 mouse tracheal epithelium cell (mTEC) cilia beating.
Figure 4 with 2 supplements
PCM1 is essential for centriolar satellite integrity and, in some cell types, ciliogenesis.
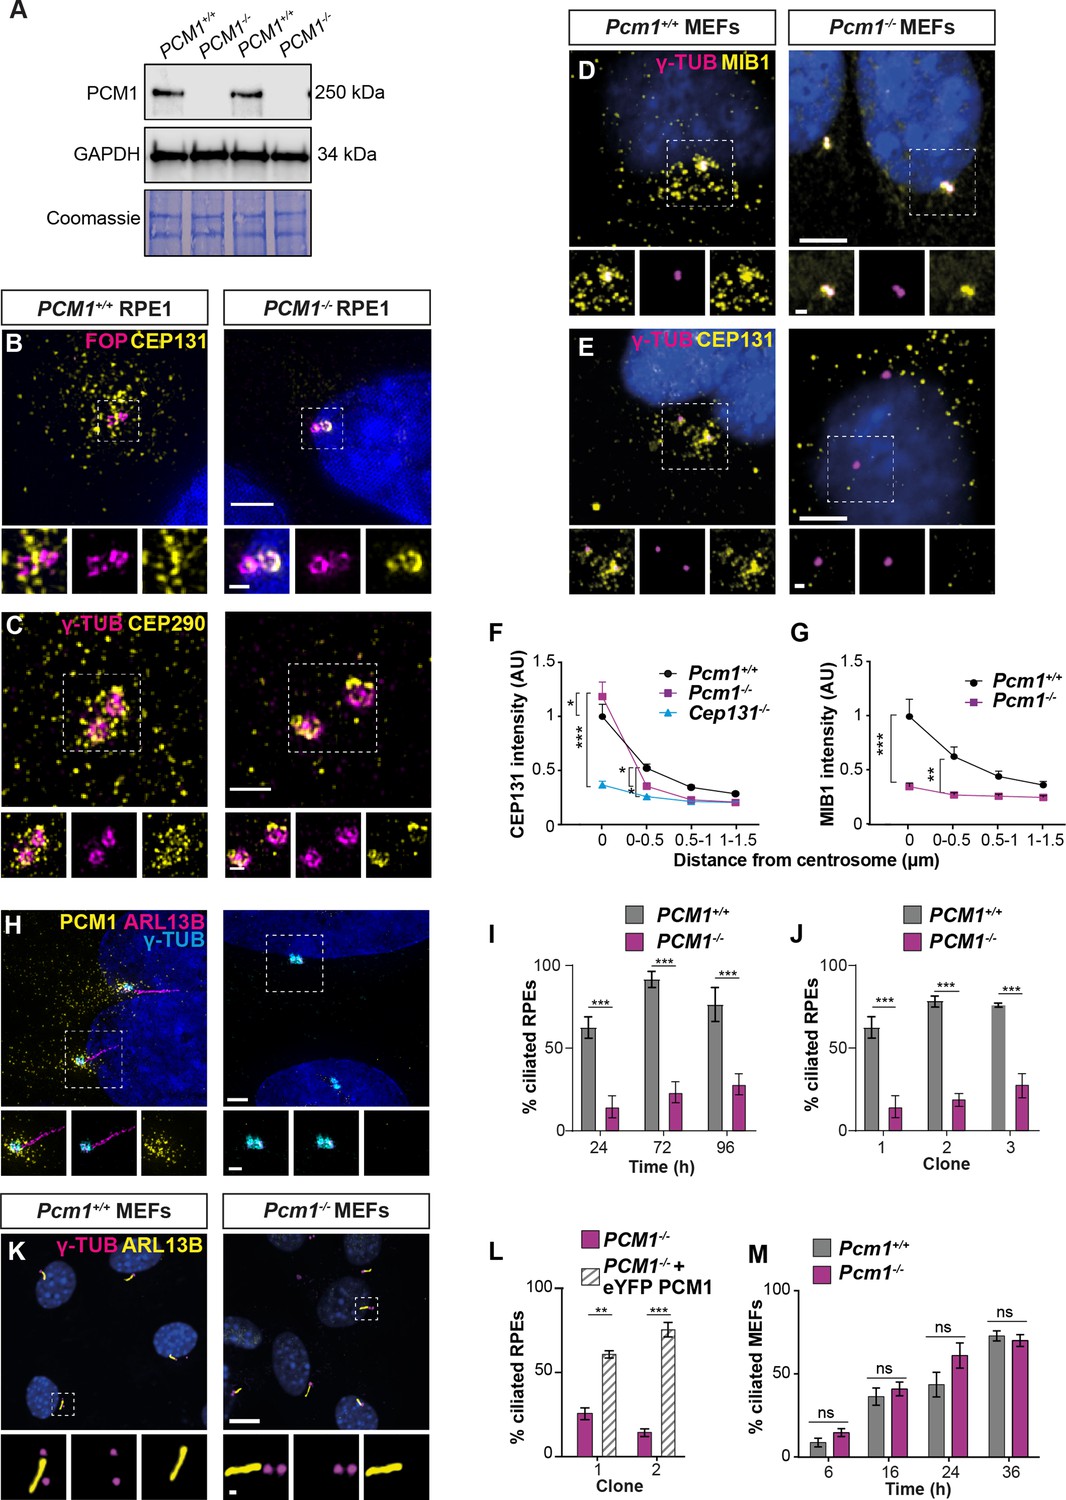
(A) Immunoblot of wild-type and PCM1−/− retinal pigmented epithelial 1 (RPE1) cell lysates for PCM1 and GAPDH (loading control). Gel stained with Coomassie blue. (B) Wild-type and PCM1−/− RPE1 cells immunostained for CEP131 (yellow), centrioles (FOP, magenta), and nuclei (DAPI, blue). (C) Wild-type and PCM1−/− RPE1 cells immunostained for CEP290 (yellow), centrioles (γ-TUB, magenta), and nuclei (DAPI, blue). (D, E) Wild-type and Pcm1−/− mouse embryonic fibroblasts (MEFs) immunostained for centrioles (γ-TUB, magenta), and nuclei (DAPI, blue) with CEP131 (D) or MIB1 (E) (yellow). (F) CEP131 intensity as a function of distance from the centrosome. Cep131−/− MEFs are included as a control (Hall et al., 2013). Two-way analysis of variance (ANOVA), comparing wild-type to mutants, with Dunnett correction for multiple testing: *p < 0.05, **p < 0.01, ***p < 0.001. Error bars represent standard error of the mean (SEM). (G) MIB1 intensity as a function of distance from the centrosome. (H) Wild-type and PCM1−/− RPE1 cells immunostained for PCM1 (yellow), cilia (ARL13B, magenta), centrioles (γ-TUB, cyan), and nuclei (DAPI, blue). (I) Percentage of wild-type and PCM1−/− RPE1 cells serum starved for 24, 72, or 96 hr that are ciliated. Bar graphs show means ± standard deviation (SD). Unpaired Student’s t-test: ***p < 0.001. n > 100 cells from 3 replicates. (J) Percentage of three control (treated with non-targeting sgRNA) and PCM1−/− RPE1 clonal lines, serum starved for 24 hr that are ciliated. Bar graphs show means ± SEM. Unpaired Student’s t-test: ***p < 0.001. n > 100 cells from 2 replicates. (K) Wild-type and Pcm1−/− MEFs immunostained for cilia (ARL13B, yellow), centrioles (γ-TUB, magenta), and nuclei (DAPI, blue). (L) Percentage of two PCM1−/− RPE1 clonal lines with and without eYFP-PCM1 expression serum starved for 24 hr. Bar graphs show means ± SEM. Unpaired Student’s t-test: **p < 0.01, ***p < 0.001. n > 100 cells from 2 replicates. (M) Percentage of wild-type and Pcm1−/− MEFs serum starved for 6–36 hr that are ciliated. Bar graphs show means ± SEM. n = 3 MEF lines from different embryos per genotype. Student’s t-test, ns: not significant. Scale bars: 2 µm (B), 1 µm (C), 0.5 µm (B, C insets), 5 µm (D, E), 1 µm (D, E insets), 10 µm (H, K), and 1 µm (H, K insets).
-
Figure 4—source data 1
Full uncropped immunoblots for Figure 4G, labeled and unlabeled.
- https://cdn.elifesciences.org/articles/79299/elife-79299-fig4-data1-v2.pdf
Figure 4—figure supplement 1
PCM1 is dispensable for ciliogenesis in mouse embryonic fibroblasts (MEFs).
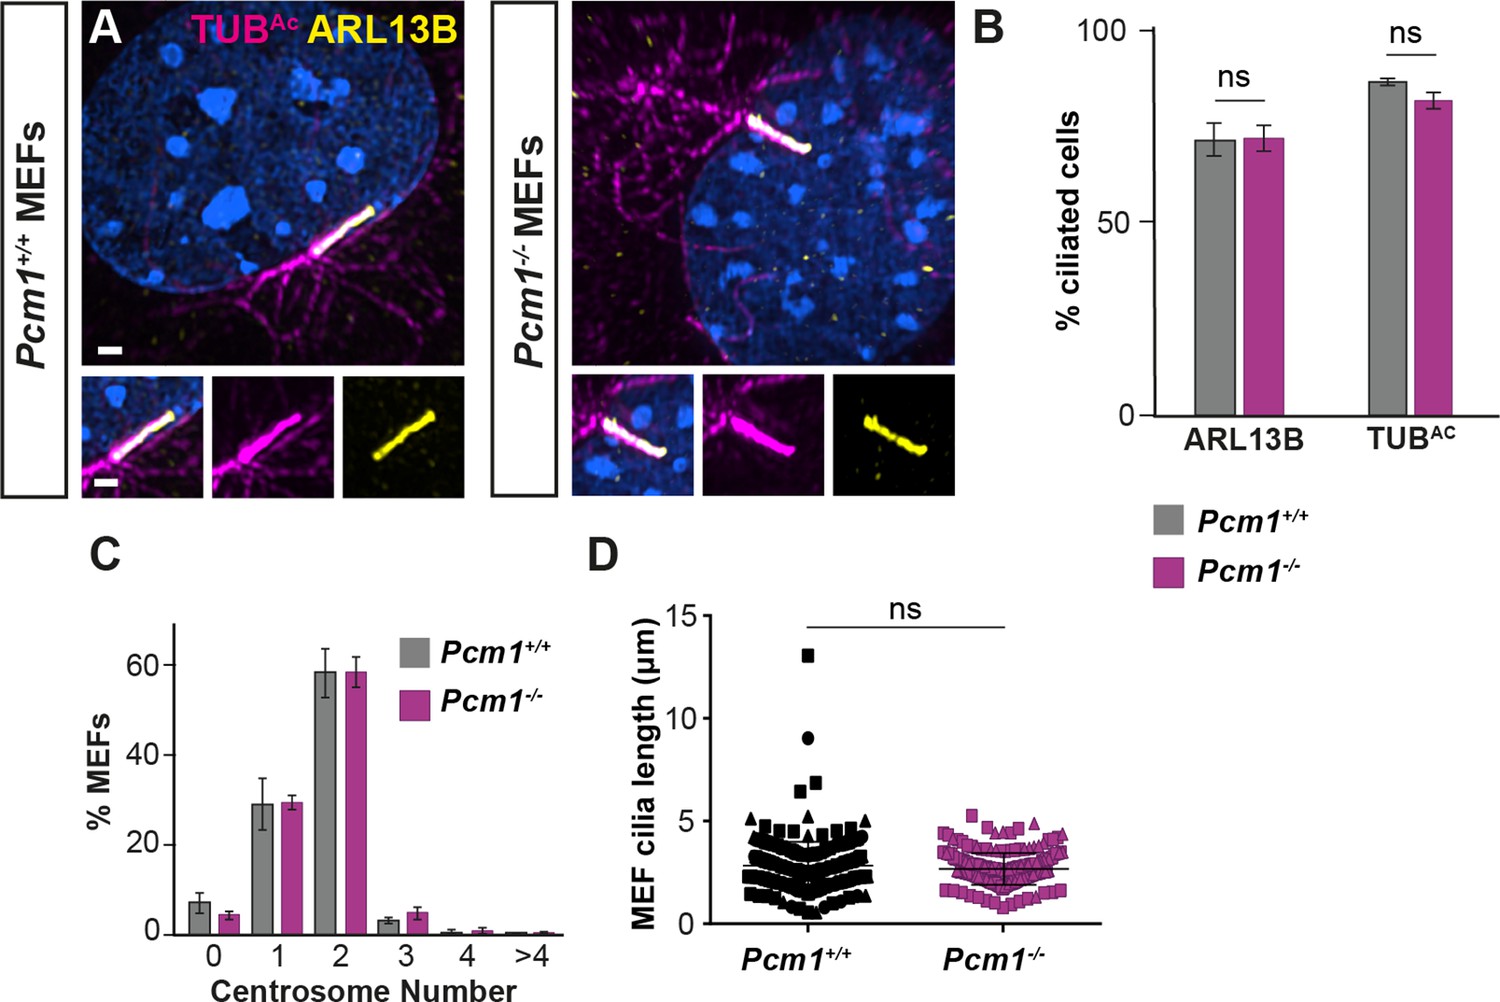
(A) Wild-type and Pcm1−/− MEFs serum starved for 36 hr and immunostained for ARL13B (yellow), TUBAc (magenta), and nuclei (DAPI, blue). Scale bar: 10 µm. (B) Percentage of wild-type and Pcm1−/− MEFs immunostained as in (A) that were ciliated. Error bars represent standard error of the mean (SEM). n = 3 MEF lines. Student’s t-test: ns, not significant. (C) Percentage of wild-type and Pcm1−/− MEFs serum starved and immunostained as in Figure 4I possessing the denoted centrosome number. Error bars represent SEM. n = 3 MEF lines. One-way analysis of variance (ANOVA), not significant. (D) Quantification of ciliary length in wild-type and Pcm1−/− MEFs serum immunostained for ARL13B. Student’s t-test: ns, not significant.
Figure 4—video 1
Centriolar satellites frequently fuse and divide near the basal body.
Endogenous PCM1-SNAP labeled with tetramethylrhodamine (TMR)-SNAP (yellow) in Pcm1SNAP mouse embryonic fibroblasts (MEFs) reveals that centriolar satellites show saltatory movement, coalescing and fragmenting around the base of cilia (SiR-tubulin, magenta). Scale bar: 3 µm.
Figure 5 with 2 supplements
PCM1 promotes mother centriole docking to preciliary vesicles.
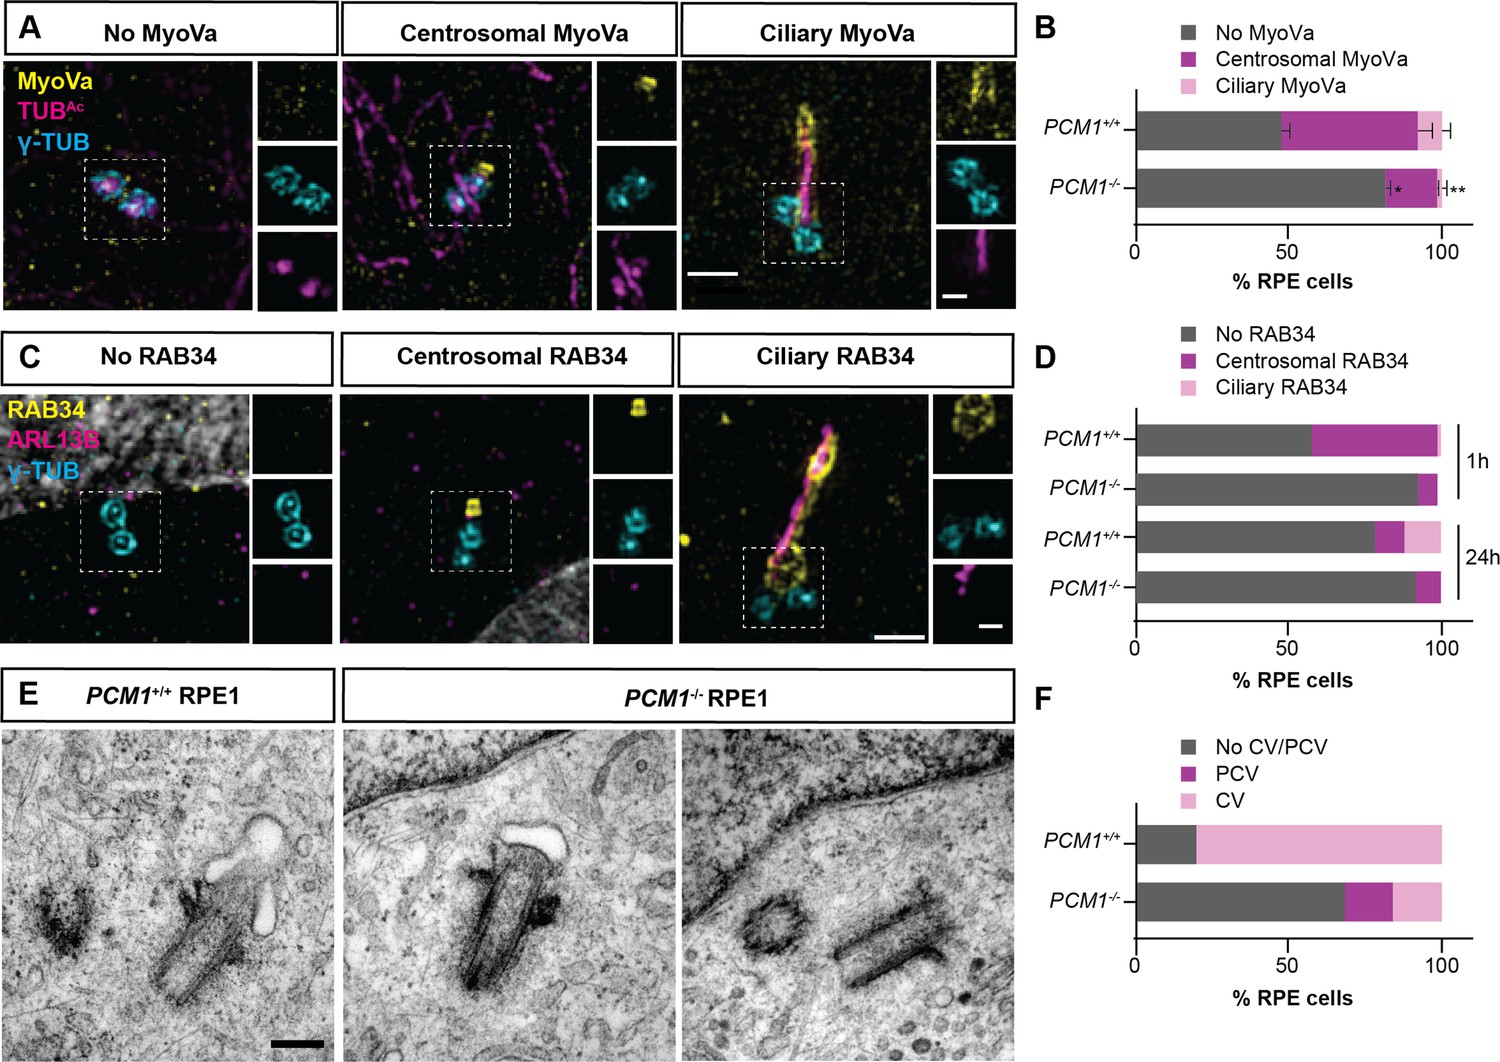
(A) 3D-SIM images of Myosin-Va (MyoVa, yellow), centrioles (γ-TUB, cyan) and cilia (TUBAc, magenta) in wild-type and PCM1−/− RPE cells 1 hr after serum starvation. Scale bars: 1 and 0.5 μm for main panels and insets, respectively. (B) Percentage of wild-type and PCM1−/− retinal pigmented epithelial 1 (RPE1) cells with no MyoVa at centrosomes, MyoVa at centrosomes, and MyoVa at cilia. Bar graphs show means ± standard error of the mean (SEM). Unpaired Student’s t-test compared with wild-type: *p < 0.05, **p < 0.005. n > 50 cells from 2 replicates. (C) 3D-SIM images of RPE1 cells immunostained with RAB34 (yellow), centrioles (γ-TUB, cyan), and cilia (ARL13B, magenta). Scale bars: 1 and 0.5 μm for main panels and insets, respectively. (D) Percentage of wild-type and PCM1−/− RPE cells 1 and 24 hr after serum starvation exhibiting no centrosomal RAB34, RAB34 at centrosomes, and RAB34 at cilia. n > 100 cells. (E) Serial-section transmission electron microscopy (TEM) of RPE1 cells during early ciliogenesis (1 hr after serum starvation). Scale bar: 200 nm. (F) Percentage of wild-type and PCM1−/− RPE1 cells in which TEM images demonstrate basal body association with preciliary vesicles (PCV) or ciliary vesicles (CV). n = 5–20 cells.
Figure 5—figure supplement 1
PCM1 is dispensable for mother centriole maturation.
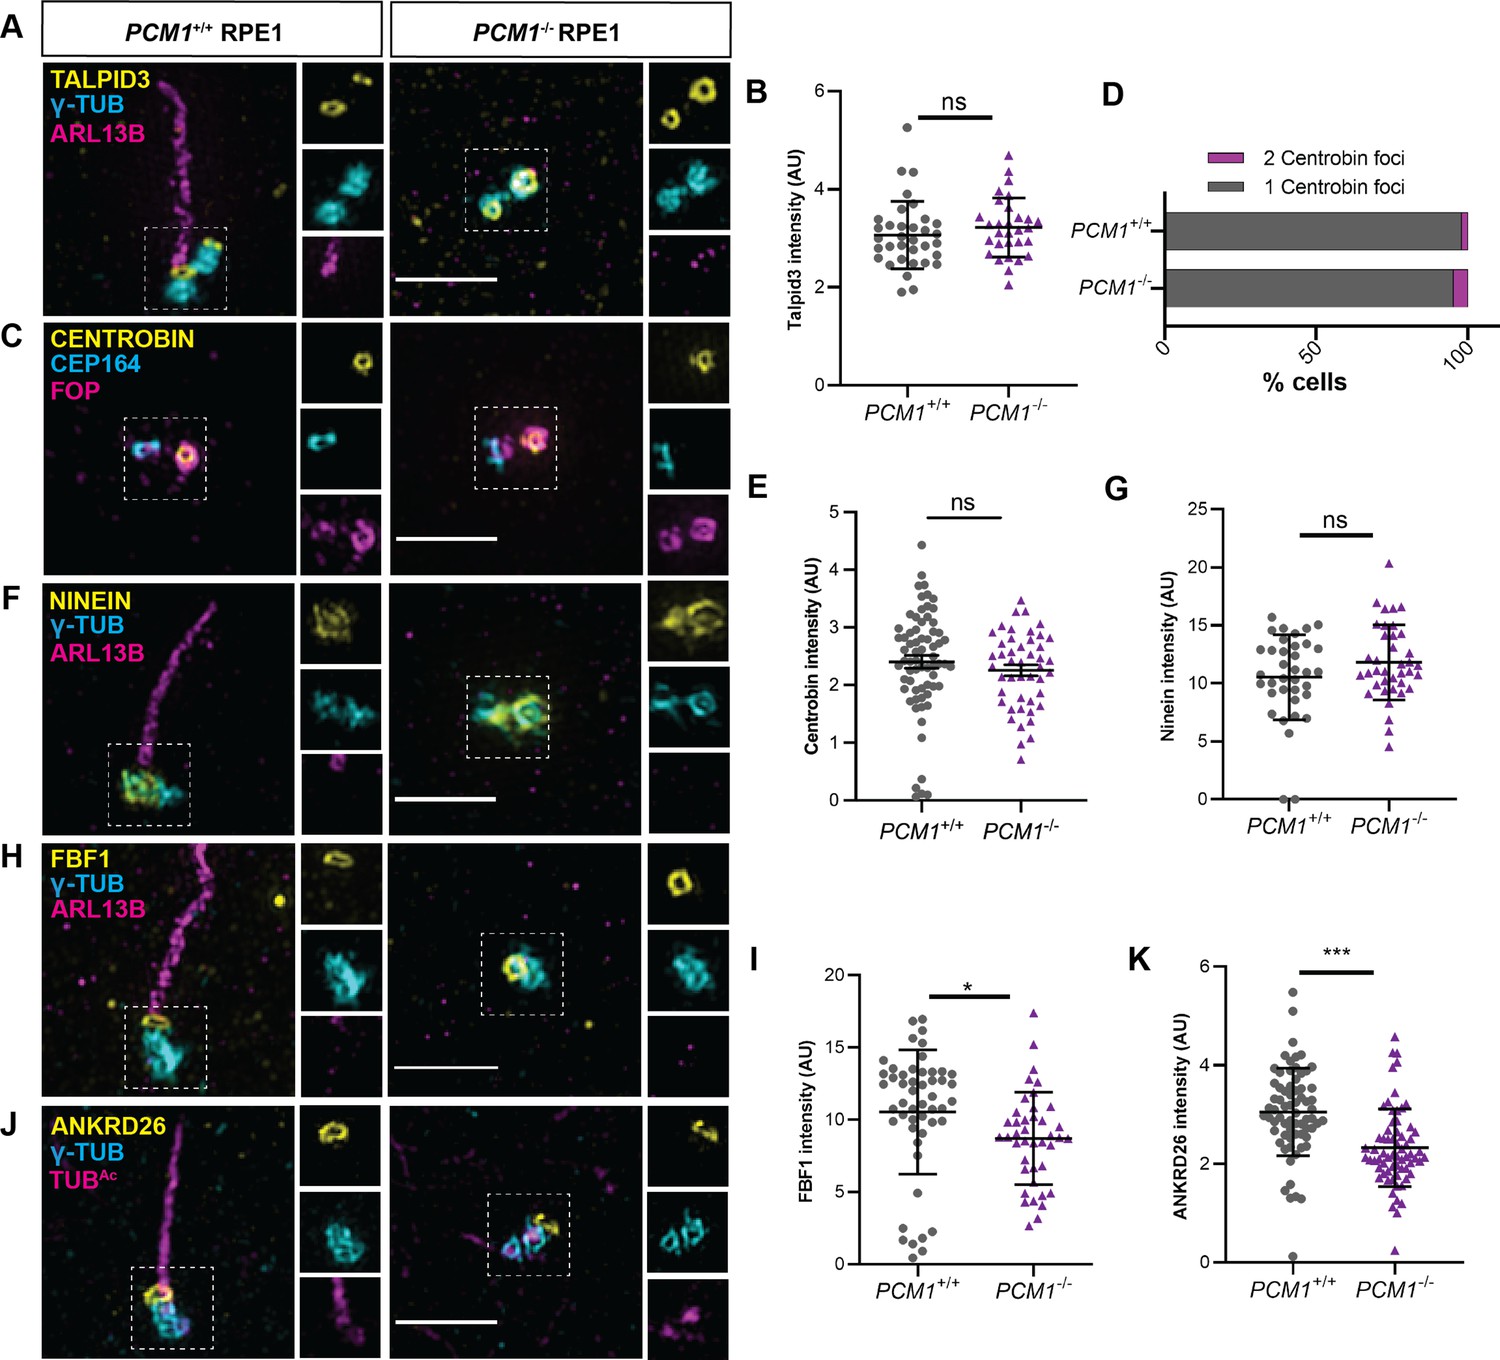
(A) Wild-type and PCM1−/− retinal pigmented epithelial 1 (RPE1) cells immunostained for TALPID3 (yellow), centrioles (γ-TUB, cyan), and cilia (ARL13B, magenta). (B) Quantification of TALPID3 levels at centrioles. (C) Wild-type and PCM1−/− RPE1 cells immunostained for Centrobin (yellow), distal appendages (CEP164, cyan), and centrioles (FOP, magenta). (D) Percentage of wild-type and PCM1−/− RPE1 cells with 24 hr after serum starvation with the designated number of Centrobin foci at centrioles. (E) Quantification of Centrobin levels at centrioles 24 hr after serum starvation. (F) Wild-type and PCM1−/− RPE1 cells immunostained for subdistal appendage protein Ninein (yellow), centrioles (γ-TUB, cyan), and cilia (ARL13B, magenta). (G) Quantification of Ninein levels at centrioles. (H) Wild-type and PCM1−/− RPE1 cells immunostained for distal appendage protein FBF1 (yellow), centrioles (γ-TUB, cyan), and cilia (ARL13B, magenta). (I) Quantification of FBF1 levels at mother centrioles. (J) Wild-type and PCM1−/− RPE1 cells immunostained for distal appendage protein ANKRD26 (yellow), centrioles (γ-TUB, cyan), and cilia (TUBAc, magenta). (K) Quantification of ANKRD26 levels at mother centrioles. Scale bars: 2 µm in main panels and 0.5 µm in insets. Bar graphs show means ± standard deviation (SD) and n>30 cells from 2 experiments. Student’s t-test: *p < 0.05, ***p < 0.001, ns, not significant.
Figure 5—figure supplement 2
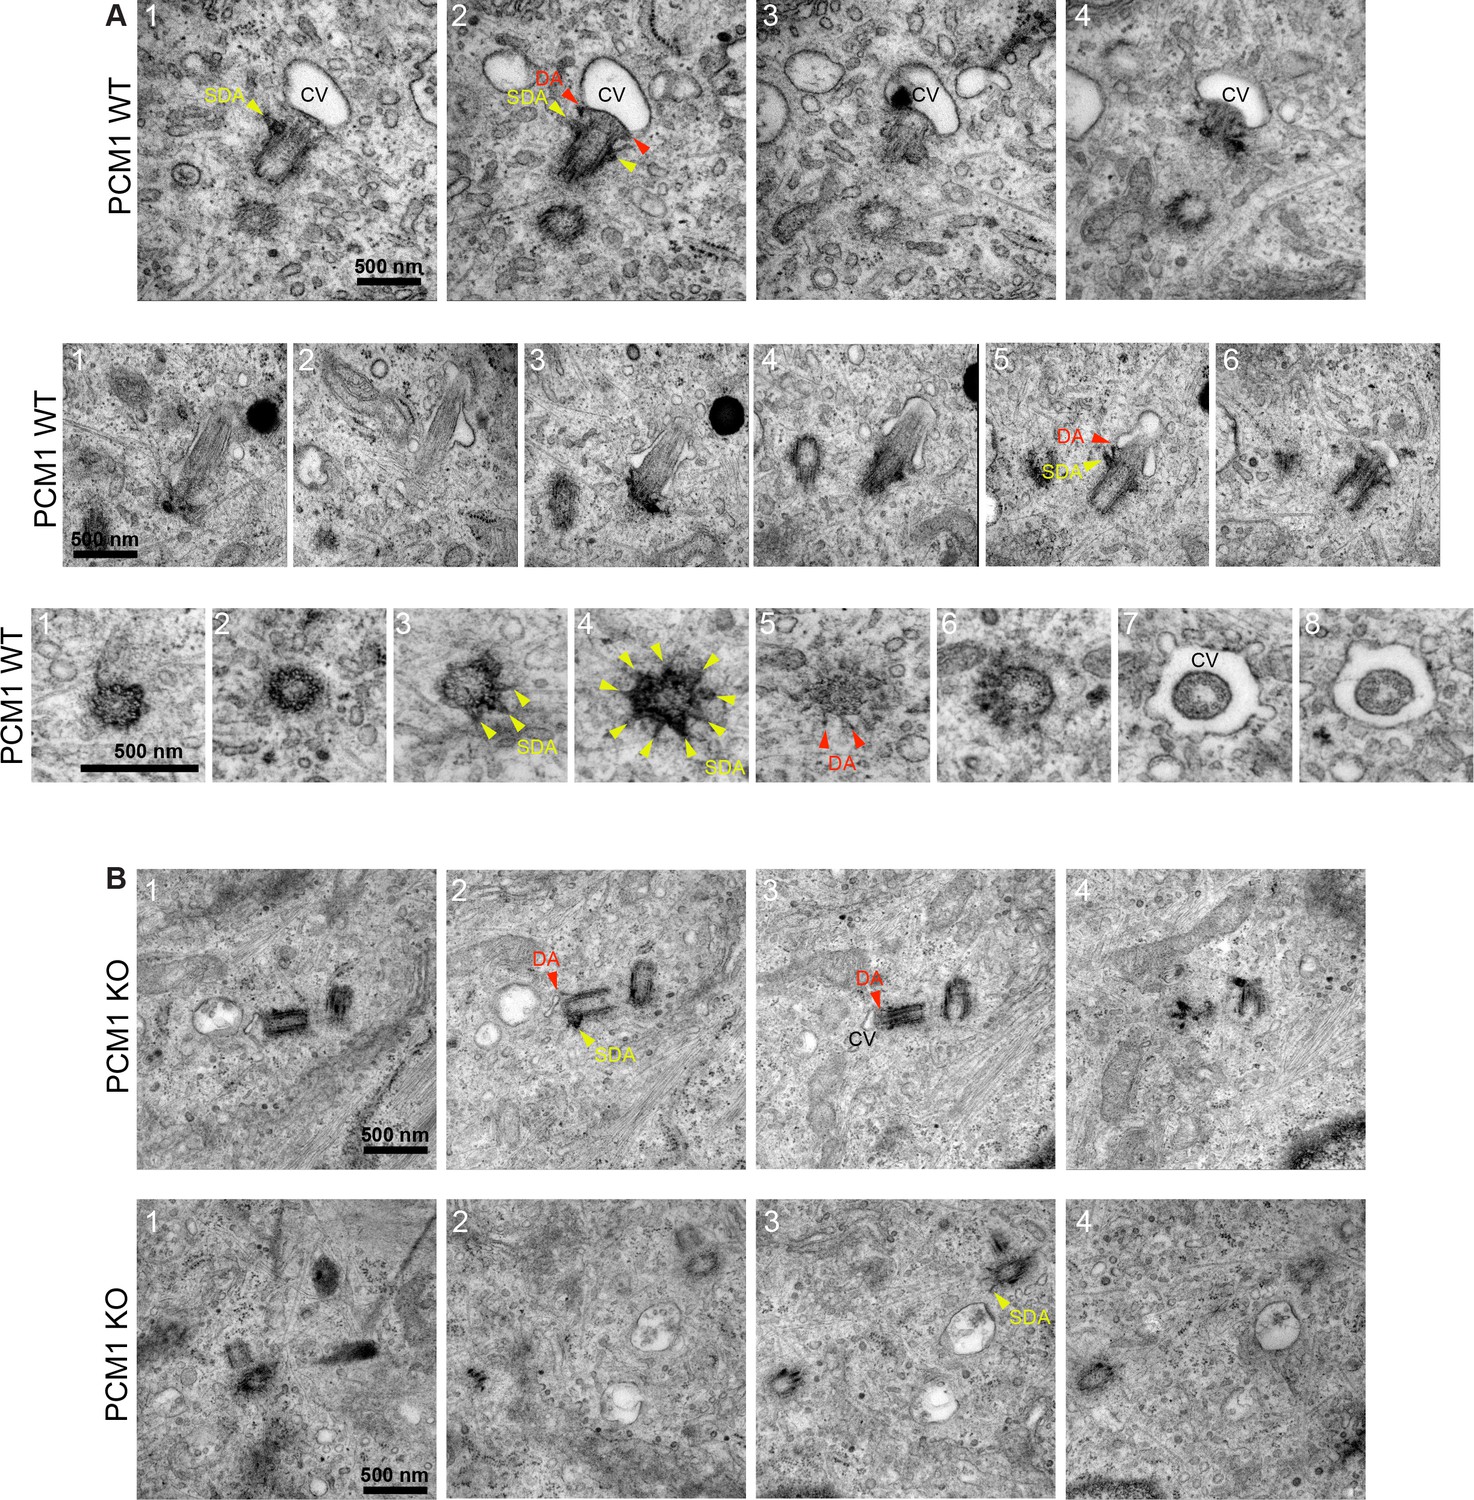
PCM1 promotes mother centriole association with vesicles.
Serial-section transmission electron microscopy (TEM) images of wild-type (A) and PCM1−/− (B) retinal pigmented epithelial 1 (RPE1) cells 1 hr after serum starvation. Subdistal appendages (SDA) are denoted with yellow arrowheads and distal appendages (DA) are denoted with red arrowheads. In PCM1−/− RPE1 cells, the mother centrioles were less frequently associated with a ciliary vesicle (CV). Scale bar: 500 nm.
Figure 6 with 1 supplement

PCM1 promotes removal of CP110 and CEP97 from the mother centriole.
(A) Wild-type and PCM1−/− RPE1 cells serum starved for 24 hr immunostained for CP110 (yellow), centrioles (FOP, cyan), and distal appendages (CEP164, magenta). (B) Wild-type and PCM1−/− RPE1 cells serum starved for 24 hr immunostained for CEP97 (yellow), centrioles (γ-TUB, cyan), and cilia (TUBAc, magenta). (C) Percentage of wild-type and PCM1−/− RPE1 cells with CP110 levels at one or two centrioles. Bar graphs show means ± standard error of the mean (SEM). Unpaired Student’s t-test compared with wild-type: ***p < 0.0005. n > 50 cells from 2 replicates. (D) Percentage of wild-type and PCM1−/− RPE1 cells with CEP97 levels at one or two centrioles. Bar graphs show means ± SEM. Unpaired Student’s t-test compared with wild-type: ***p < 0.0005. n > 50 cells from 2 replicates. (E) Wild-type and Pcm1−/− MEFs serum starved for 24 hr and immunostained for CP110 (yellow) and cilia (TUBAc, magenta). (F) Wild-type and Pcm1−/− lateral ventricular wall immunostained for CP110 (yellow), basal bodies (FOP, cyan), and nuclei (DAPI, blue). (G) Percentage of wild-type and Pcm1−/− MEFs serum starved for 24 hr with CP110 levels at none, one or two centrioles. Chi squared test ***p < 0.001. (H) The ratio of CP110 intensity on daughter and mother centrioles in wild-type and Pcm1−/− MEFs serum starved for 24 hr. (I) Intensity of CP110 in wild-type and Pcm1−/− ependymal cells. n = 3 per genotype. Large symbols represent individual animals, small symbols represent individual cells. Student’s t-test, *p < 0.05, **p < 0.01, ***p < 0.001. Scale bars represent 1 µm (main panel) and 0.5 µm (inset) (A, B), represent 5 µm (main panel) and 1 µm (inset) (E), and 2 µm (F).
Figure 6—figure supplement 1
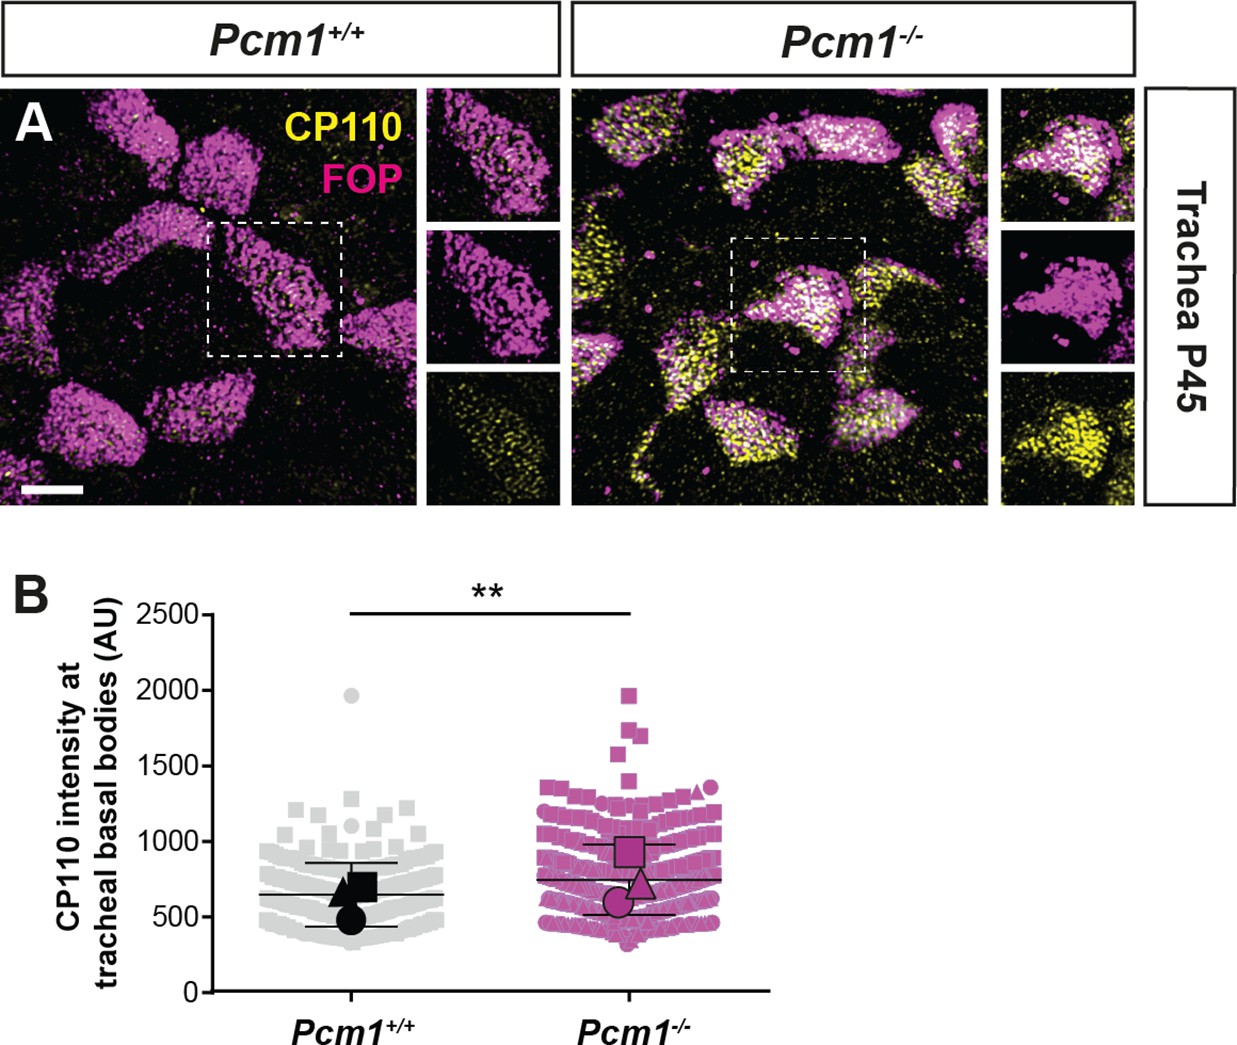
PCM1 promotes removal of CP110 from basal bodies of airway multiciliated cells.
(A) Wild-type and Pcm1−/− wholemount trachea from P45 mice immunostained for basal bodies (FOP, magenta) and CP110 (yellow). (B) Quantification of CP110 intensity at basal bodies of wild-type and Pcm1−/− tracheal multiciliated cells. n = 3 per genotype. Large symbols represent individual animals, small symbols represent individual cells. Student’s t-test: **p < 0.01. Scale bar: 3 µm. Error bars represent SEM.
Figure 7 with 1 supplement
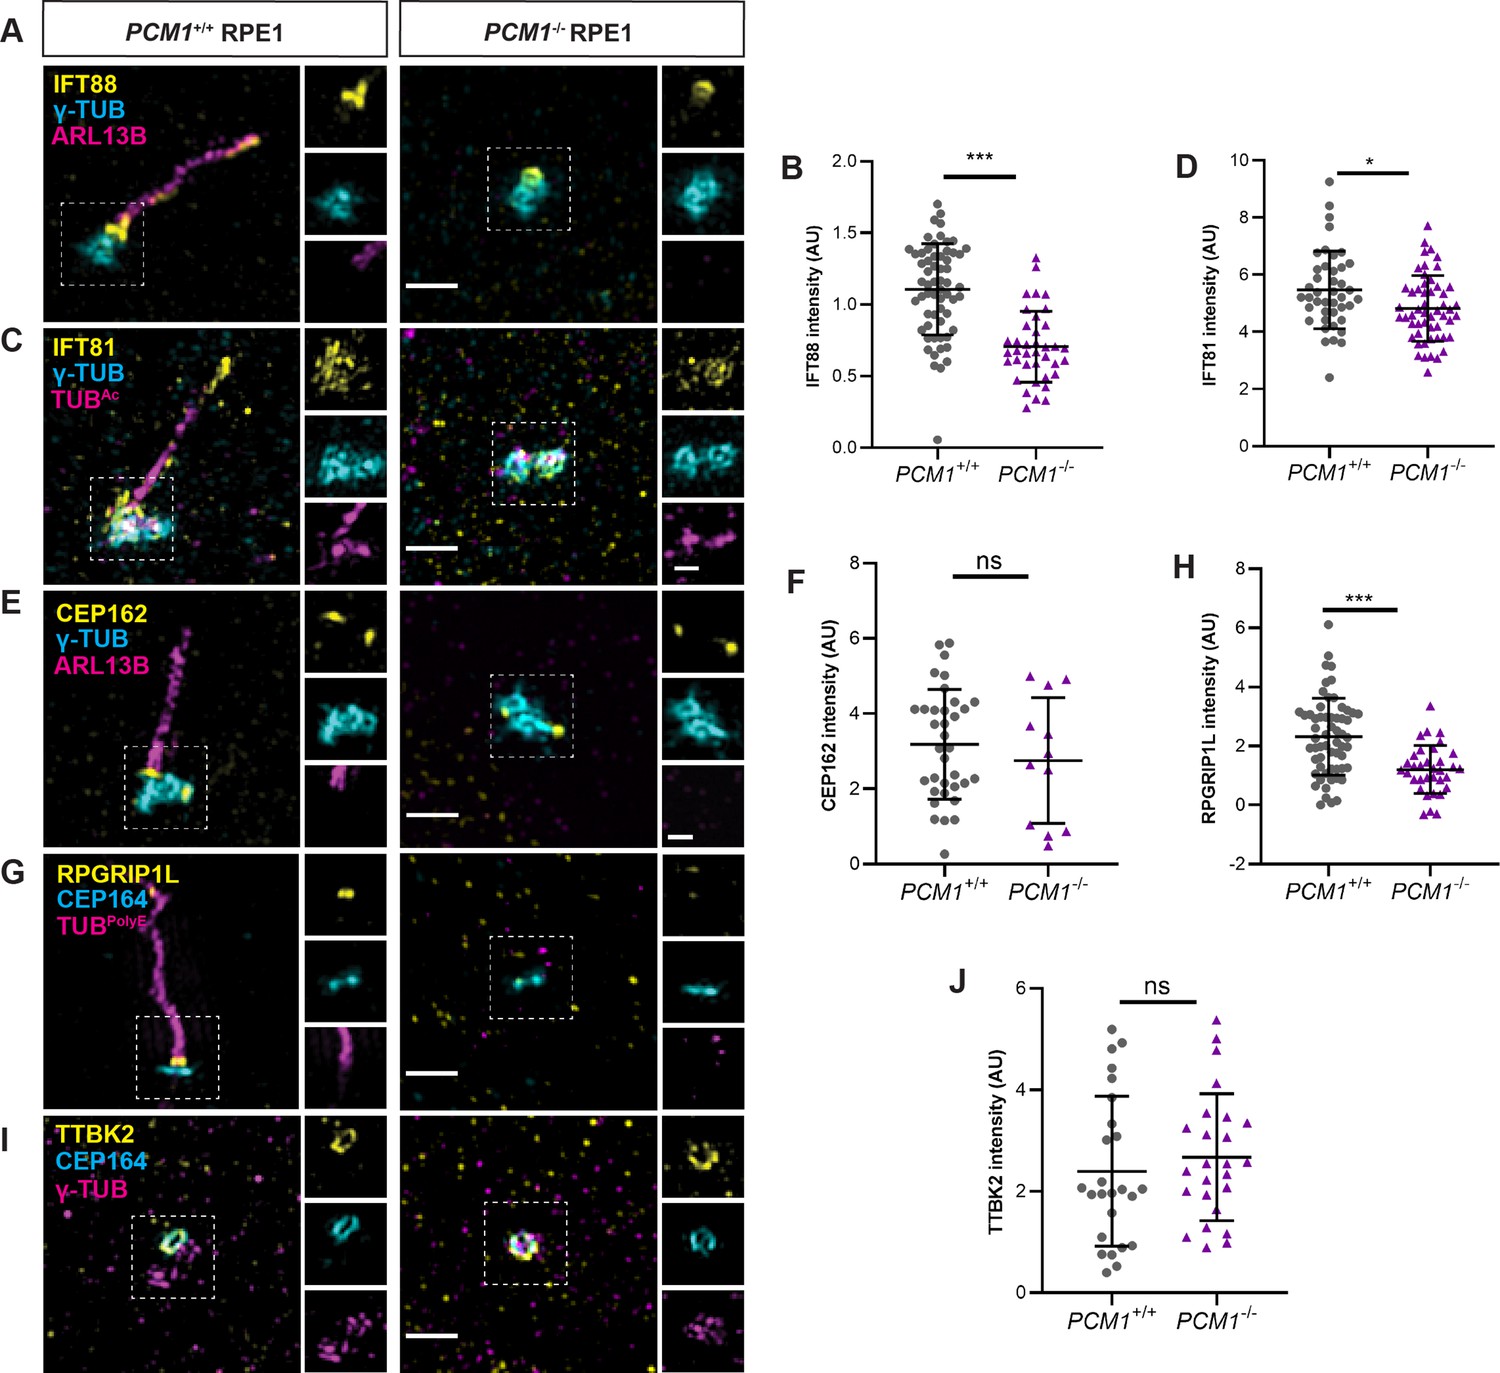
PCM1 promotes IFT recruitment and transition zone formation.
(A) Wild-type and PCM1−/− RPE1 cells immunostained for IFT88 (yellow), centrioles (γ-TUB, cyan), and cilia (ARL13B, magenta). (B) Quantification of IFT88 intensity at basal bodies. (C) Immunostaining for IFT81 (yellow), centrioles (γ-TUB, cyan), and cilia (TUBAc, magenta). (D) Quantification of IFT81 intensity at basal bodies. (E) Immunostaining for CEP162 (yellow), centrioles (γ-TUB, cyan), and cilia (ARL13B, magenta). (F) Quantification of CEP162 intensity at basal bodies. (G) Immunostaining for transition zone component RPGRIP1L (yellow), distal appendages (CEP164, cyan), and cilia (TUBpolyE, magenta). (H) Quantification of RPGRIP1L intensity at transition zones. (I) Immunostaining for TTBK2 (yellow), distal appendages (CEP164, cyan), and centrioles (γ-TUB, magenta). (J) Quantification of TTBK2 intensity at basal bodies. Scale bars in main figures represent 1 µm and in insets represent 0.5 µm. Bar graphs show means ± standard deviation (SD) from 2 experiments. Student’s t-test: *p < 0.05, ***p < 0.001, ns, not significant.
Figure 7—figure supplement 1
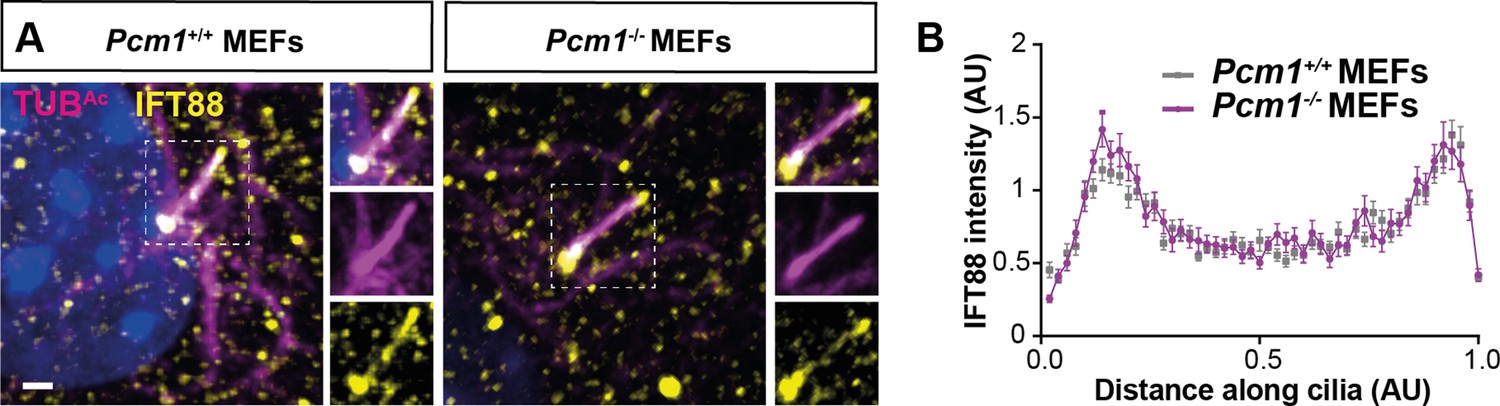
PCM1 does not control IFT88 levels in MEF cilia.
(A) Wild-type and Pcm1−/− MEFs immunostained for IFT88 (yellow), cilia (TUBAc, magenta), and nuclei (DAPI, blue). (B) Quantification of IFT88 intensity along the cilia, calculated from line plots of n > 120 wild-type and Pcm1−/− cilia from 3 primary cell lines per genotype.
Figure 8 with 1 supplement
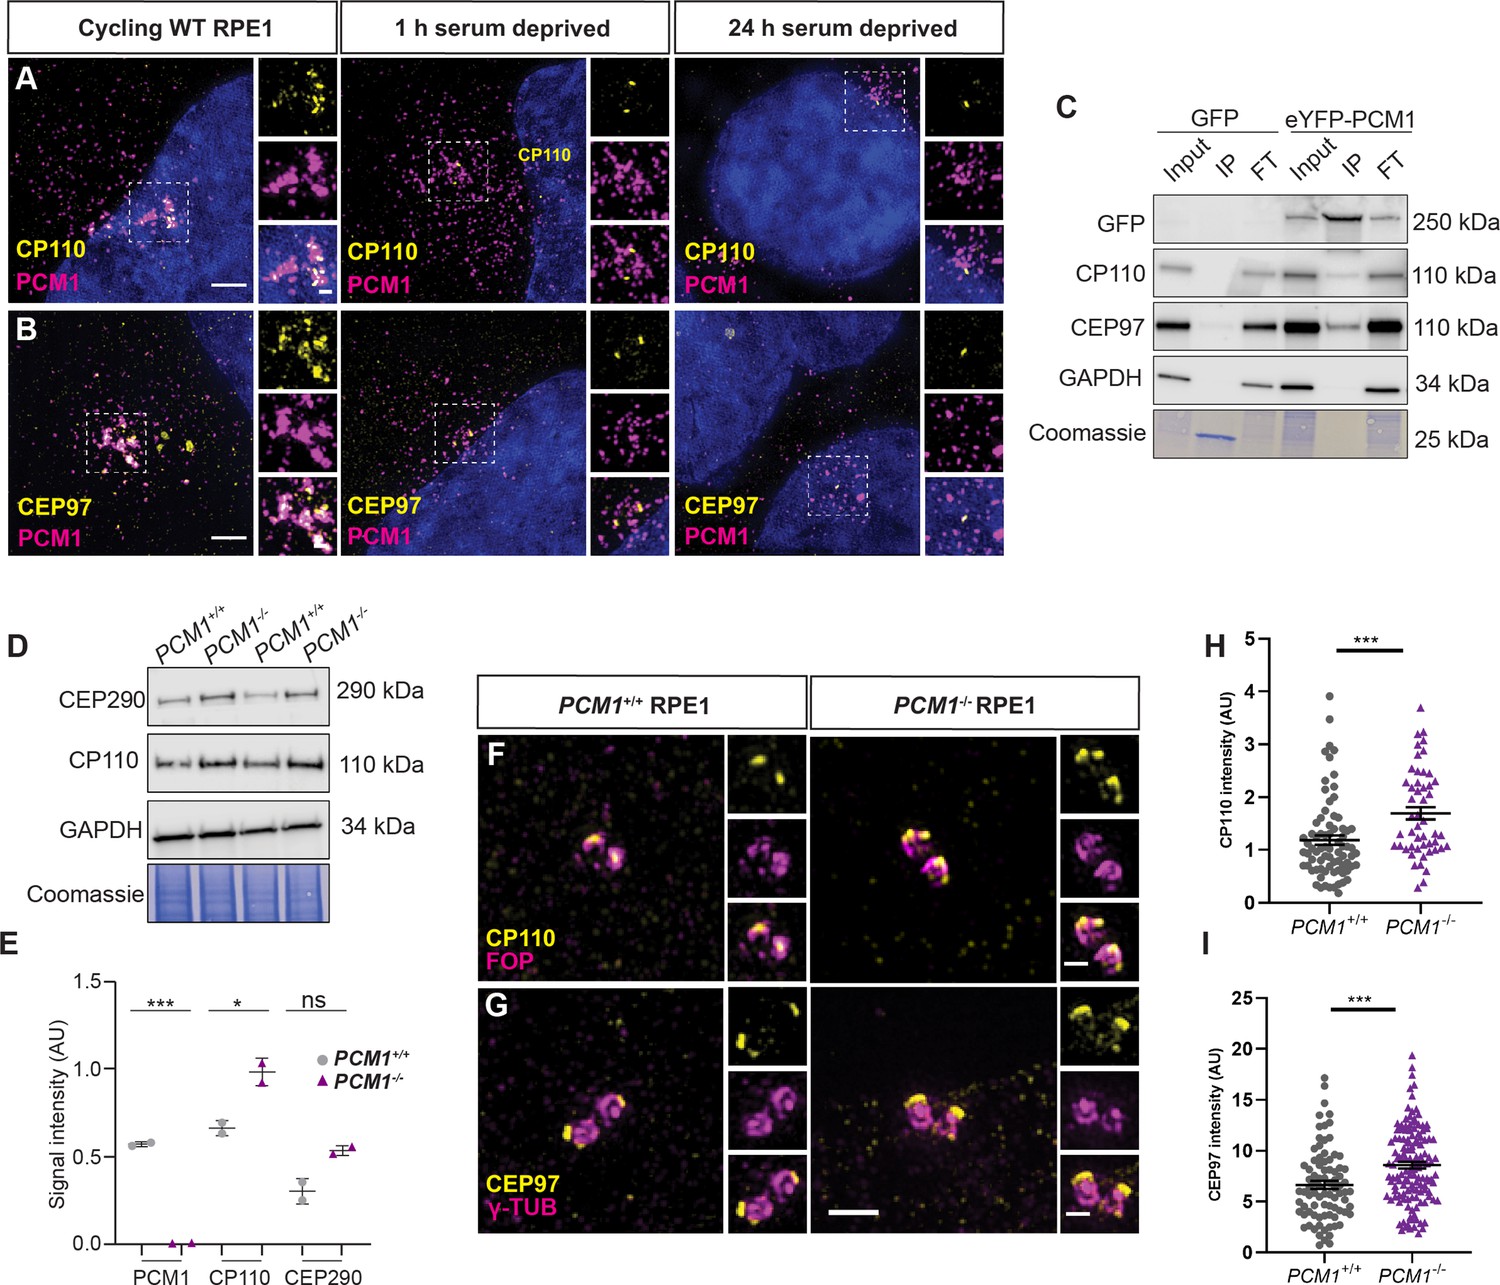
PCM1 restricts CP110 and CEP97 localization to distal mother centrioles.
(A) Wild-type and PCM1−/− RPE1 cells immunostained for CP110 (yellow), centriolar satellites (PCM1, magenta), and nuclei (DAPI, blue) in cells with serum (cycling) or 1 or 24 hr after withdrawing serum. (B) Immunostaining for CEP97 (yellow), centriolar satellites (PCM1, magenta), and nuclei (DAPI, blue). (C) Total cell lysates of PCM1−/− RPE1 cell lines stably expressing eGFP or eYFP-PCM1 subjected to immunoprecipitation with anti-GFP. Precipitating proteins were immunoblotted for GFP, CP110, CEP97, and GAPDH. IP: eluate. FT: flow through. (D) Immunoblot of wild-type and PCM1−/− RPE1 cell lines lysates for CP110 and GAPDH, as well as Coomassie stain of gels. Cells were deprived of serum for 24 hr prior to lysis. (E) Quantification of PCM1 and CP110 levels from immunoblots. Bar graphs show means ± SEM from 2 experiments. (F) Wild-type and PCM1−/− RPE1 cells immunostained for CP110 (yellow) and centrioles (FOP, magenta). Cycling cells were treated with nocodazole to disperse the centriolar satellite pool of CP110, leaving the centriolar pool. (G) Immunostaining for CEP97 (yellow) and centrioles (γ-TUB, magenta) in cycling cells treated with nocodazole. (H) Quantification of CP110 levels at centrioles stained as in F. (I) Quantification of CEP97 levels at centrioles stained as in G. Scale bars: 1 and 0.5 μm in main panels and insets, respectively. Bar graphs show means ± SEM and n>30 cells from 2 experiments. Student’s t-test: *p < 0.05, ***p < 0.001, ns, not significant.
-
Figure 8—source data 1
Full uncropped immunoblots for Figure 8C, I and Figure 8—figure supplement 1E, labeled and unlabeled.
- https://cdn.elifesciences.org/articles/79299/elife-79299-fig8-data1-v2.pdf
Figure 8—figure supplement 1
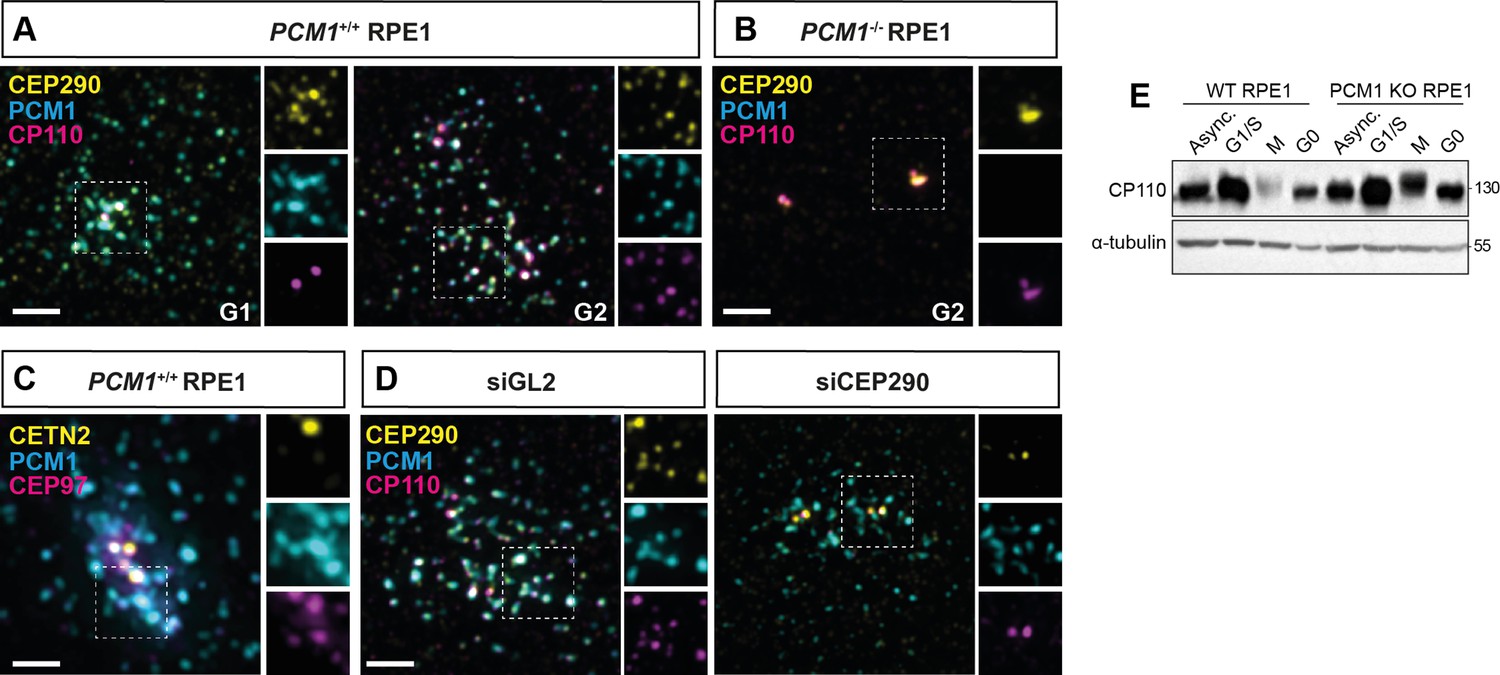
CP110 localizes to satellites in a CEP290-dependent manner.
(A, B) Cycling wild-type and PCM1−/− RPE1 cells immunostained for CEP290 (yellow), PCM1 (cyan), and CP110 (magenta). (C) Cycling wild-type RPE1 cell stained for Centrin2 (centrioles, CETN2, yellow), PCM1 (cyan), and CEP97 (magenta). (D) Wild-type RPE1 cells transfected with control (siGL2) or CEP290 siRNA immunostained for CEP290 (yellow), PCM1 (cyan), and CP110 (magenta). (E) Immunoblot of lysates from asynchronous and synchronized wild-type and PCM1−/− RPE1 cells blotted for CP110 and α-tubulin loading control. Scale bars: 2 μm.
Figure 9
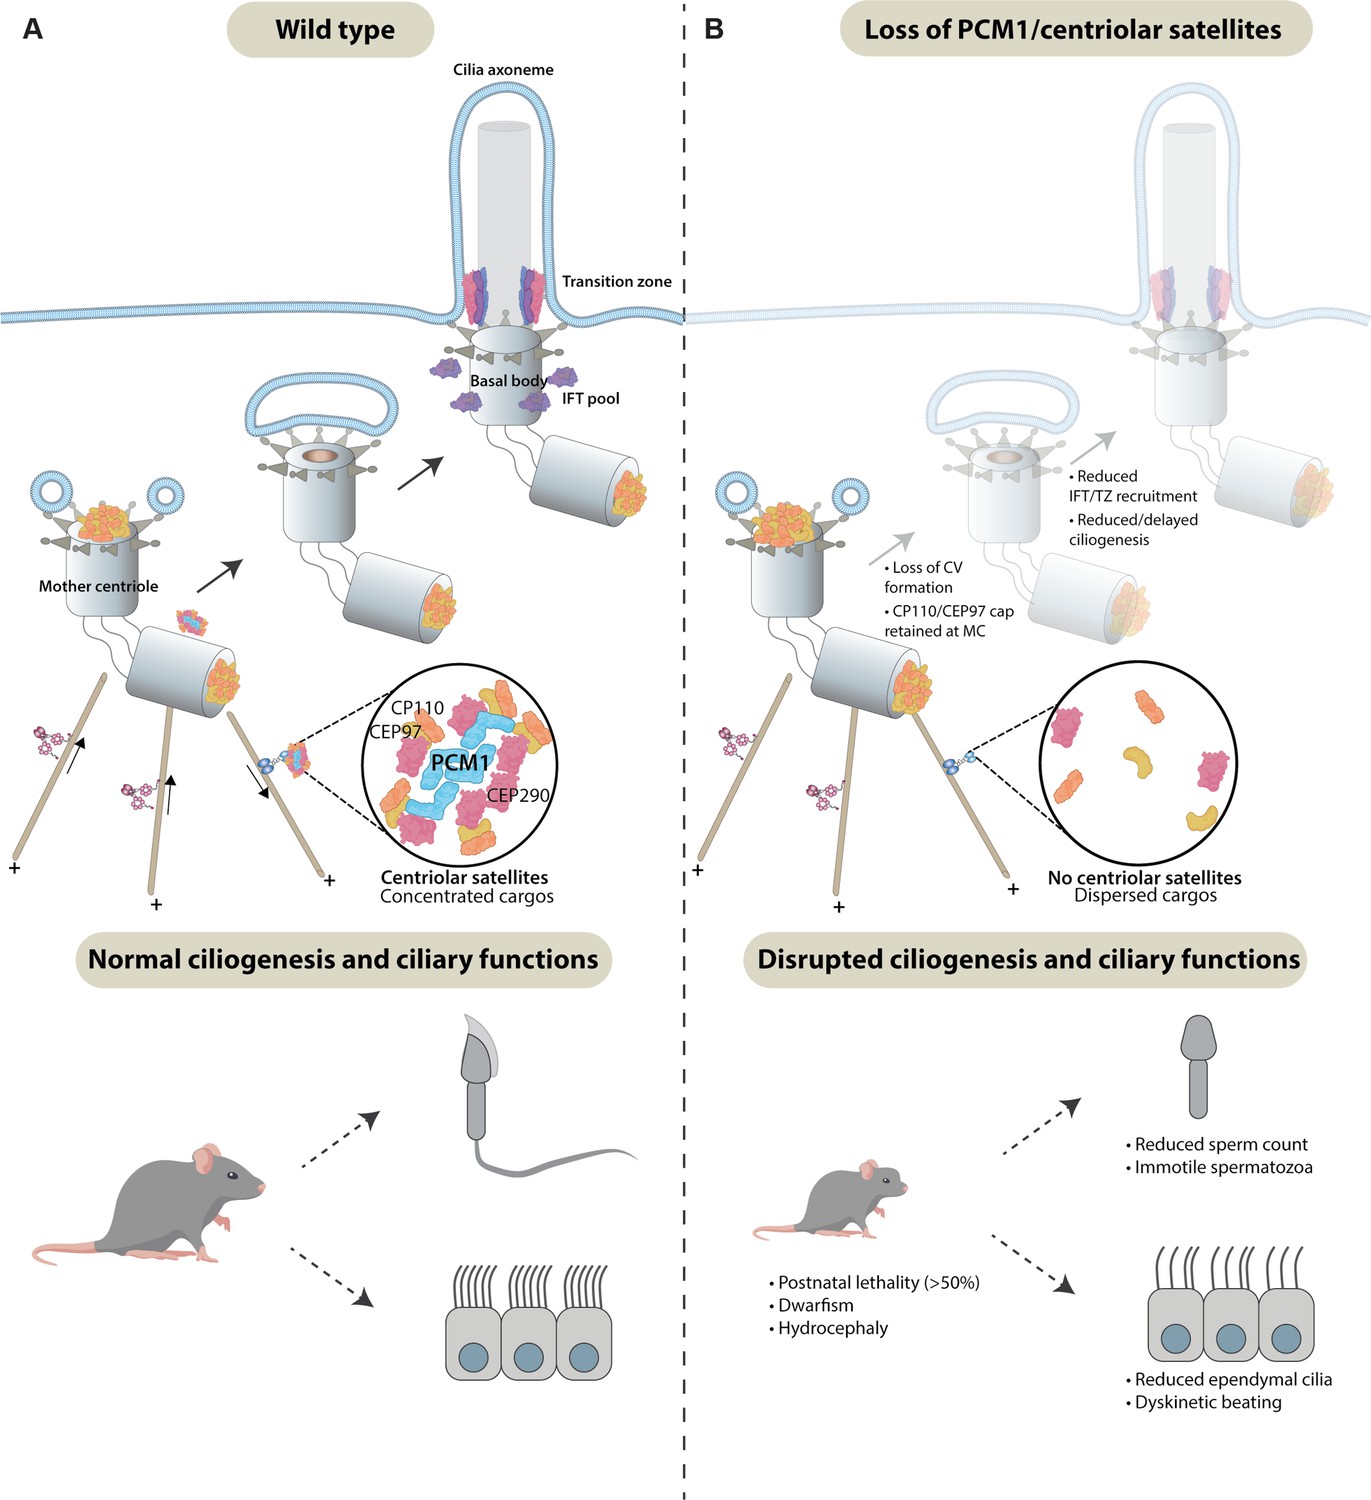
Centriolar satellites remodel centrioles to promote ciliogenesis.
(A) PCM1 (cyan) scaffolds centriolar satellites, dynamic and heterogeneous condensates of centriolar proteins. During ciliogenesis, we propose that centriolar satellites remove, or wick away, CP110 and CEP97 from the mother centriole. Departure of CP110 and CEP97 is important for subsequent steps in ciliogenesis, including centriolar vesicle formation, transition zone formation, and IFT recruitment. (B) In the absence of PCM1 and centriolar satellites, CP110 and CEP97 are not efficiently removed during ciliogenesis, disrupting subsequent steps, impeding ciliogenesis in a cell-type-specific way and leading to hydrocephaly and other ciliopathy-associated phenotypes.
Author response image 1
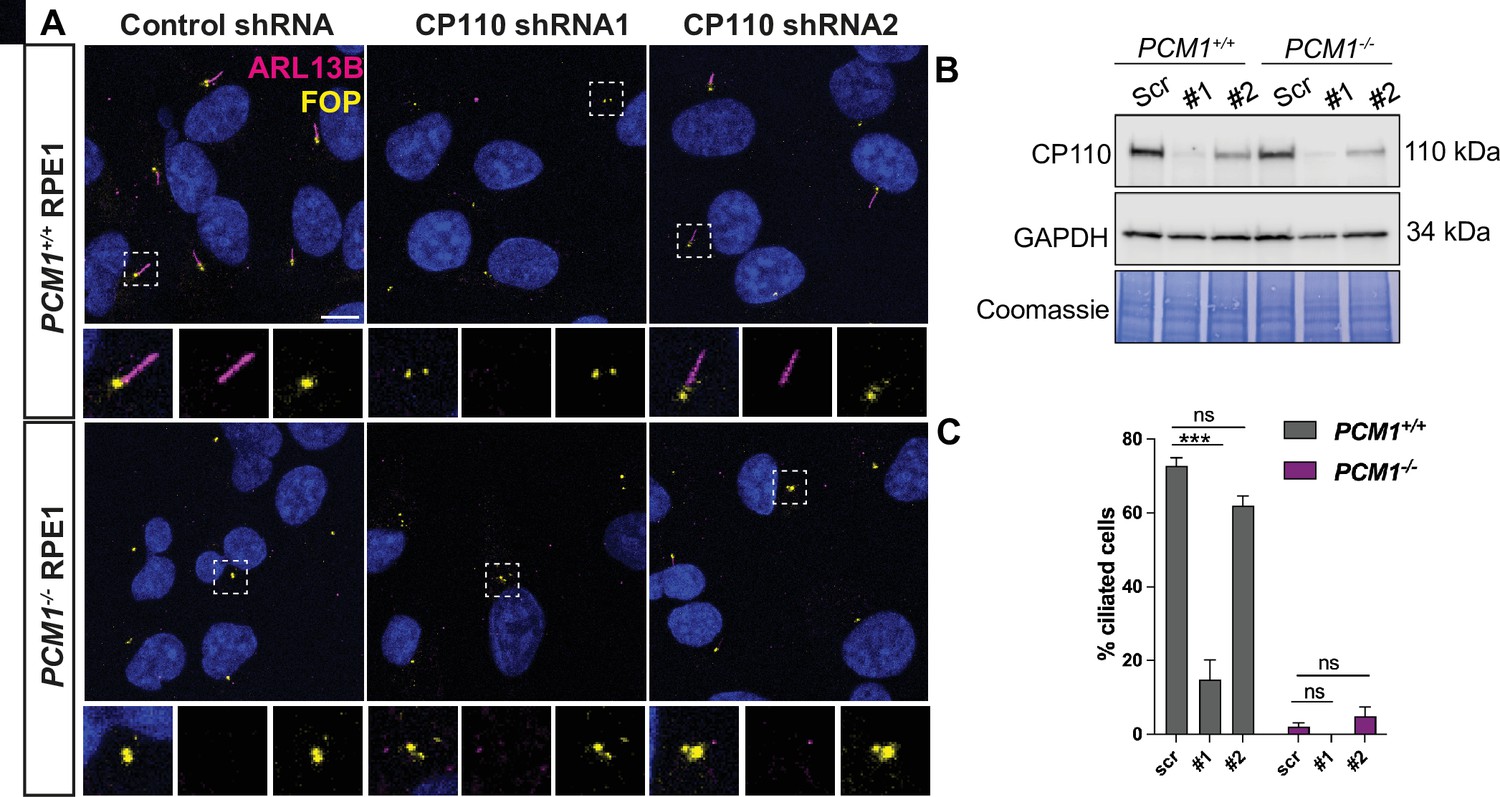
(A) Wild-type and PCM1-/- RPE1 cells were transduced with scrambled (Scr) control or CP110 shRNAs (#1 and #2). Cells were serum starved for 24 h and immunostained with ARL13B (magenta) and FOP (yellow). (B) Immunoblotting showed that the two CP110 shRNAs reduced CP110 protein levels. (C) Quantification of ciliation frequency 24 h post serum deprivation after depletion of CP110. Bar graphs show means ± SEM. Two-way Anova: *** p < 0.001 and ns is not significant. n>100 cells from 2 replicates.
Tables
Appendix 1—key resources table
| Reagent type (species) or resource | Designation | Source or reference | Identifiers | Additional information |
|---|---|---|---|---|
| Genetic reagent (M. musculus) | Pcm1∆5-14Pcm1em1Pmi MGI:6865681 | This paper | Allele symbol: Pcm1em1Pmi Allele synonym: Pcm1∆5-14; Accession ID: MGI:6865681 | |
| Genetic reagent (M. musculus) | Pcm1∆796-800Pcm1em2Pmi MGI:6865682 | This paper | Allele symbol: Pcm1em2Pmi Allele synonym: Pcm1∆796-800; Accession ID: MGI:6865681 | |
| Genetic reagent (M. musculus) | Pcm1SNAPPcm1em3Pmi MGI:6865681 | This paper | Allele symbol: Pcm1em3Pmi Allele synonym: Pcm1SNAP; Accession ID: MGI:6865681 | |
| Biological sample (M. musculus) | Mouse embryonic fibroblasts (MEFs) | This paper | N/A | |
| Biological sample (M. musculus) | Mouse tracheal epithelial cells (mTECs) | This paper | N/A | See Vladar and Brody, 2013 for protocol. |
| Biological sample (M. musculus) | PCM1−/− RPE 1 | Kumar et al., 2021 | All Figures except Figure 8—figure supplement 1 | |
| Biological sample (M. musculus) | PCM1−/− RPE 1 | Gheiratmand et al., 2019 | In Figure 8—figure supplement 1 | |
| Sequence-based reagent | Pcm1 Exon 2 | Dharmacon | 5′-ATTAAAGGCAACATGGCCAC-3′ | RISPR guide for generation of Pcm15-14 and Pcm1SNAP mouse |
| Sequence-based reagent | Pcm1 Exon 6 | Dharmacon | 5′-TCAGGCCAGAGATCCTCAGC-3′ | CRISPR guide for generation of Pcm1 796–800 mouse |
| Sequence-based reagent | SNAP repair | IDT | 5′- aaaaataattctgaagccaaaaaccgctgcaaggaggatttatgagtttggcagacttcagggagattgacacaacactatgagagacagtaagcactcattgaaatgtgtttagtgcatttgttctgttttatttggaacaaactttattttaaatagcttactataagctcaggctggtctagaacacctgattctcatacttacctcctagtactgcgattataagcatgtgctaccatctccattatataatgtgtatatcatgtagatcaatttatctgtgatacgtgtttgatagtgtattcttttatatttttggttgtgagcctagcctttaacagctgagccatctctccagctcgatagtgtattctttaagataagtgtttgaaagattcctttatattaataagtttgatagaatgctttaaaatctgaagatggttcagcatatgaaagtgcttgccatacaaacctgatgacctcagatcacacagtggcaggagagaactgactccagatagttgctctgacctctgcacacatgctatggtacatacatgtctgcacttacatacaaaaacatgcatatacacaatataattattagtacattttataataaaataaagtttgtctttctgtgttaaaaattaatttttacttattttgcagAGAATTAATTAAAGGCAACATGGACAAAGACTGCGAAATGAAGCGCACCACCCTGGATAGCCCTCTGGGCAAGCTGGAACTGTCTGGGTGCGAACAGGGCCTGCACCGTATCATCTTCCTGGGCAAAGGAACATCTGCCGCCGACGCCGTGGAAGTGCCTGCCCCAGCCGCCGTGCTGGGCGGACCAGAGCCACTGATGCAGGCCACCGCCTGGCTCAACGCCTACTTTCACCAGCCTGAGGCCATCGAGGAGTTCCCTGTGCCAGCCCTGCACCACCCAGTGTTCCAGCAGGAGAGCTTTACCCGCCAGGTGCTGTGGAAACTGCTGAAAGTGGTGAAGTTCGGAGAGGTCATCAGCTACAGCCACCTGGCCGCCCTGGCCGGCAATCCCGCCGCCACCGCCGCCGTGAAAACCGCCCTGAGCGGAAATCCCGTGCCCATTCTGATCCCCTGCCACCGGGTGGTGCAGGGCGACCTGGACGTGGGGGGCTACGAGGGCGGGCTCGCCGTGAAAGAGTGGCTGCTGGCCCACGAGGGCCACAGACTGGGCAAGCCTGGGCTGGGTGGCGGAAGCGGAGCCACAGGAGGAGGTCCTTTTGAAGAAGTCATGCATGATCAGGACTTACCAAACTGGAGCAATGACAGTGTGGATGACCGACTCAACAATATGGTATGATGTTttactctgggtggtatattgttgaccactaatgttcagtgaggctctcccatcgattgtatttactgaaactctgtaaaaactgtaggcagatagactaagggactcttggttgaagacactttagctgtagttaatagaaagcatgaattagcttaaacaaaaaatgatttattaaaaggaggtgaaagtgctttatggaagccatgttaaagagtatagctcagttttaggaaaggaaaaagaaacagcagagttgttcgaaattgcttttcacctctgtgcctgtgcttctaagaccttttccctaaccgagctttcccttctagatctgccttctttctctctctgctttgtgtcatatattgagatggcctttttaaagatttgcagccatggaggaacttatataatgactaatttaacattatgattatctagctaaatttgtttagatctccttttttcacttatcaggatcatgaaagggatgaattaaataatataaaaggttcacaggactacccatacatggaacagttcctcgaggggcaaaatttcctagaagtgatgacagtactaagcagttttattatag- 3′ | Repair template for generation of Pcm1SNAP mouse |
| Sequence-based reagent | PCM1 Exon 3 | Synthego | 5′-GAAAAGAAUAAGAAAAAGUU-3′ | CRISPR guide for generation of PCM1−/− RPE cells |
| Sequence-based reagent | PCM1 Exon 3 | Synthego | 5′-CGACUCCGGAGAAAUAUCA-3′ | CRISPR guide for generation of PCM1−/− RPE cells |
| Sequence-based reagent | Luciferase GL2 Duplex siRNA | Dharmacon | 5′-CGUACGCGGAAUACUUCGA-3′ | Control siRNA |
| Sequence-based reagent | CEP290 ID: s37024 Silencer Select siRNA | Ambion/Thermo Fisher | 5′-GAUACUCGGUUUUUACGUA-3′ | CEP290 siRNA |
| Sequence-based reagent | CEP290 ID: s37025 Silencer Select siRNA | Ambion/Thermo Fisher | 5′-CACUUACGGACUUCGUUAA-3′ | CEP290 siRNA |
| Sequence-based reagent | Pcm1 2F | Sigma | 5′ CTCTGACCTCTGCACACATG 3′ | Genotyping Pcm1∆5-14 mouse. PCR followed by Sanger sequencing. Product size: 332 bp |
| Sequence-based reagent | Pcm1 2R | Sigma | 5′ ACAATCGATGGGAGAGCCTC 3′ | Genotyping Pcm1∆5-14 mouse. PCR followed by Sanger sequencing. Product size: 332 bp |
| Sequence-based reagent | Pcm1 6F | Sigma | 5′ AGTATCGCTGTACTTTGCCA 3′ | Genotyping Pcm1∆796-800 mouse. PCR followed by Dde1 digestion. Product size: 266 bp |
| Sequence-based reagent | Pcm1 6R | Sigma | 5′ CAGAGTCATCCATCACAGCTAT 3′ | Genotyping Pcm1∆796-800 mouse. PCR followed by Dde1 digestion. Product size: 266 bp |
| Sequence-based reagent | Pcm1 2F | Sigma | 5′ CTCTGACCTCTGCACACATG 3′ | Genotyping Pcm1SNAP mouse. PCR. Product size: 332 bp, only amplifies in WT |
| Sequence-based reagent | Pcm1 2R | Sigma | 5′ ACAATCGATGGGAGAGCCTC 3′ | Genotyping Pcm1SNAP mouse. PCR. Product size: 332 bp, only amplifies in WT |
| Sequence-based reagent | SNAP F | Sigma | 5′ GGCCTGCACCGTATCATCTT 3′ | Genotyping Pcm1SNAP mouse. PCR. Product size: 132 bp, only amplifies in mutant |
| Sequence-based reagent | SNAP R | Sigma | 5′ AAAGTAGGCGTTGAGCCAGG 3′ | Genotyping Pcm1SNAP mouse. PCR. Product size: 132 bp, only amplifies in mutant |
| Chemical compound, drug | SNAP-Cell 647-SiR | New England Biolabs | ||
| Chemical compound, drug | nocodozole | Sigma | SML1665 | 20 μM |
| Antibody | Acetylated Alpha Tubulin | Sigma | 6-11B-1 T6793 | IF (1:1000–1:2000) |
| Antibody | ANKRD26 | GeneTex | GTX128255 | IF(1:100 MeOH) |
| Antibody | ARL13B | Proteintech Group | 17711-1-AP | IF (1:1000, PFA) |
| Antibody | α-tubulin | Sigma | DM1A | WB (1:1000) |
| Antibody | α-tubulin | Abcam | ab4074 | WB (1:1000) |
| Antibody | CENTRIN | Merck | 20 H5 04-1624 | IF (1:300 MeOH w. PE) |
| Antibody | CENTRIOLIN | Santa Cruz | sc-365521 | IF (1:100 MeOH w PE) |
| Antibody | CENTROBIN | Abcam | Ab70448 | IF (1:100 MeOH) |
| Antibody | CEP131 | Proteintech Group | 25735-1-AP | IF (1:75 MeOH w PE) |
| Antibody | CEP162 | Sigma Prestige | HPA030170 | IF(1:100 MeOH) |
| Antibody | CEP164 | Santa Cruz | sc-240226 | IF(1:100 MeOH) |
| Antibody | CEP290 | Santa Cruz | B-7 sc-390462 | IF (1:500 MeOH) |
| Antibody | CEP97 | Proteintech Group | 22050-1-AP | IF(1:100 MeOH) |
| Antibody | CP110 | Proteintech Group | 12780-1-AP | IF/WB (1:1000) |
| Antibody | CP110 | Millipore | MABT1354 | IF (1:100 MeOH w. PE) |
| Antibody | FBF1 | Proteintech Group | 11531-1-AP | IF(1:100 MeOH) |
| Antibody | FOP | Proteintech Group | 11343-1-AP | IF (1:100 PFA or MeOH) |
| Antibody | Gamma Tubulin | Sigma | GTU88 T6557 | IF (1:500, MeOH w PE) |
| Antibody | GAPDH | Proteintech Group | 6008-1-Ig | WB (1:100,000) |
| Antibody | IFT81 | Proteintech Group | 11744-1-AP | IF (1:100 PFA) |
| Antibody | IFT88 | Proteintech Group | 13967-1-AP | IF (1:100 PFA) |
| Antibody | MIB1 | Sigma | M5948 | IF (1:1000 MeOH w. PE) |
| Antibody | MYOVA | Cell Signaling Technology | 3402S | IF(1:100 MeOH) |
| Antibody | NINEIN | Michel Bornens | L79 | IF(1:200 MeOH) |
| Antibody | PCM1 | Proteintech Group | 19856-1-AP | IF (1:100, MeOH w PE) |
| Antibody | PCM1 C | Novus Biologicals | NBP1-87196 | WB (1:1000) |
| Antibody | PCM1 N | Novus Biologicals | H0005108-B01P | WB (1:1000) |
| Antibody | PCM1 | Santa Cruz | D-19 sc-50164 | (Figure 7—figure supplement 1) IF (1:1000 MeOH) |
| Antibody | PCNT | Abcam | ab4448 | IF (1:1000, MeOH) |
| Antibody | Polyglutamylated tubulin | Adipogen HPA030170 | AG-20B-0020-C100/GT335 | IF (1:500) |
| Antibody | RAB34 | Proteintech Group | 27435-1-AP | IF (1:500) |
| Antibody | RPGRIP1L | Proteintech Group | 29778-1-AP | IF (1:100 PFA w 1% SDS) |
| Antibody | TALPID3 | Proteintech Group | 24421-1-AP | IF(1:100 MeOH) |
| Antibody | TTBK2 | Sigma | HPA018113 | IF(I:100) |
| Antibody | ECL -Mouse IgG, HRP-conjugated Host: Sheep | GE Healthcare UK Ltd | WB (1:7500) | |
| Antibody | ECL -Rabbit IgG, HRP-conjugated Host: Sheep | GE Healthcare UK Ltd | WB (1:7500) | |
| Antibody | HRP-conjugated –Rabbit IgG H+L Host: Goat | Bio-Rad | WB (1:5000) | |
| Antibody | HRP-conjugated –Mouse IgG H+L Host: Goat | Bio-Rad | WB (1:5000) | |
| Antibody | Alexa 488-conjugated – Mouse Host: Donkey | Invitrogen Molecular Probes | IF (1:500) | |
| Antibody | Alexa 594-conjugated – Rabbit Host: Donkey | Invitrogen Molecular Probes | IF (1:500) | |
| Antibody | Alexa 488-conjugated – Rabbit Host: Donkey | Invitrogen Molecular Probes | IF (1:500) | |
| Antibody | Alexa 594-conjugated – Mouse Host: Donkey | Invitrogen Molecular Probes | IF (1:500) | |
| Antibody | Alexa 647-conjugated – Rabbit Host: Donkey | Invitrogen Molecular Probes | IF (1:500) | |
| Antibody | Alexa 647-conjugated – Mouse Host: Donkey | Invitrogen Molecular Probes | IF (1:500) | |
| Antibody | Alexa 647-conjugated – Goat Host: Donkey | Invitrogen Molecular Probes | IF (1:500) | |
| Software algorithm | QuPath | PMID:29203879 | https://github.com/IGC-Advanced-Imaging-Resource/Hall2022_Paper | |
| Software algorithm | Nis-Elements AR V4.6 | Nikon Instruments | ||
| Software algorithm | FIJI | Schindelin et al., 2012 | https://github.com/IGC-Advanced-Imaging-Resource/Hall2022_Paper | |
| Software algorithm | CellProfiler | Stirling et al., 2021 | https://github.com/IGC-Advanced-Imaging-Resource/Hall2022_Paper | |
| Software algorithm | Imaris | Oxford Instruments |
Additional files
-
Supplementary file 1
gRNAs, repair template and siRNA sequences.
- https://cdn.elifesciences.org/articles/79299/elife-79299-supp1-v2.xlsx
-
Supplementary file 2
Genotyping primer sequences.
- https://cdn.elifesciences.org/articles/79299/elife-79299-supp2-v2.xlsx
-
Supplementary file 3
Primary antibodies.
- https://cdn.elifesciences.org/articles/79299/elife-79299-supp3-v2.xlsx
-
Supplementary file 4
Secondary antibodies.
- https://cdn.elifesciences.org/articles/79299/elife-79299-supp4-v2.xlsx
-
Supplementary file 5
Differentially expressed proteins between wild-type and Pcm1−/− mouse tracheal epithelial cells (mTECs) on at least one timepoint (ALI1, ALI7, and/or ALI21).
Expression is given as label-free quantitative (LFQ) normalized by variance stabilizing transformation as described in Materials and Methods, significantly differentially expressed proteins were defined by a false discovery rate (FDR) cutoff of 0.05.
- https://cdn.elifesciences.org/articles/79299/elife-79299-supp5-v2.xlsx
-
Transparent reporting form
- https://cdn.elifesciences.org/articles/79299/elife-79299-transrepform1-v2.docx
Download links
A two-part list of links to download the article, or parts of the article, in various formats.
Downloads (link to download the article as PDF)
Open citations (links to open the citations from this article in various online reference manager services)
Cite this article (links to download the citations from this article in formats compatible with various reference manager tools)
Centriolar satellites expedite mother centriole remodeling to promote ciliogenesis
eLife 12:e79299.
https://doi.org/10.7554/eLife.79299


