Centriolar satellites expedite mother centriole remodeling to promote ciliogenesis
- MRC Human Genetics Unit, Institute of Genetics and Cancer, University of Edinburgh, United Kingdom
- Department of Biochemistry and Biophysics, Cardiovascular Research Institute, University of California, United States
- Lunenfeld-Tanenbaum Research Institute, Sinai Health System, Canada
- Cavanilles Institute of Biodiversity and Evolutionary Biology, University of Valencia, Spain
- Predepartamental Unit of Medicine, Jaume I University, Spain
- Institute of Genetics and Cancer, University of Edinburgh, United Kingdom
- Department of Molecular Genetics, University of Toronto, Canada
- Chan Zuckerberg Biohub, United States
Abstract
Centrosomes are orbited by centriolar satellites, dynamic multiprotein assemblies nucleated by Pericentriolar material 1 (PCM1). To study the requirement for centriolar satellites, we generated mice lacking PCM1, a crucial component of satellites. Pcm1−/− mice display partially penetrant perinatal lethality with survivors exhibiting hydrocephalus, oligospermia, and cerebellar hypoplasia, and variably expressive phenotypes such as hydronephrosis. As many of these phenotypes have been observed in human ciliopathies and satellites are implicated in cilia biology, we investigated whether cilia were affected. PCM1 was dispensable for ciliogenesis in many cell types, whereas Pcm1−/− multiciliated ependymal cells and human PCM1−/− retinal pigmented epithelial 1 (RPE1) cells showed reduced ciliogenesis. PCM1−/− RPE1 cells displayed reduced docking of the mother centriole to the ciliary vesicle and removal of CP110 and CEP97 from the distal mother centriole, indicating compromised early ciliogenesis. Similarly, Pcm1−/− ependymal cells exhibited reduced removal of CP110 from basal bodies in vivo. We propose that PCM1 and centriolar satellites facilitate efficient trafficking of proteins to and from centrioles, including the departure of CP110 and CEP97 to initiate ciliogenesis, and that the threshold to trigger ciliogenesis differs between cell types.
Editor's evaluation
This manuscript will be of interest to centrosome and cilia cell biologists and evaluates the in vivo and in vitro role of PCM1, and by extension, centriole satellites in ciliogenesis. The major strength of this study is the detailed characterization of Pcm1−/− mutant mice, which reveals a role for PCM1 in the biogenesis of specific types of cilia, such as motile cilia on ependymal cells, by a mechanism involving CP110 and CEP97. The claims are generally well supported by the data.
https://doi.org/10.7554/eLife.79299.sa0Introduction
A pair of microtubule-based centrioles form the heart of the centrosome. In addition to roles in spindle formation during mitosis, centrioles are critical to ciliogenesis, the process of building a cilium during interphase (Nigg and Holland, 2018). In most cells, the older mother centriole uniquely matures into the basal body, which serves as the foundation for the primary cilium, a single signaling antenna. In contrast, multiciliated cells lining the trachea, oviduct, and brain ventricles generate many basal bodies that then nucleate many motile cilia per cell.
In all cells, dynamic remodeling of centrioles is required for ciliogenesis. Key early steps in ciliogenesis include basal body acquisition of distal appendages and the removal of CP110 and CEP97 from the distal end of the mother centriole, two proteins that inhibit assembly of the ciliary axoneme (Čajánek and Nigg, 2014; Goetz et al., 2012; Schmidt et al., 2012; Schmidt et al., 2009; Sillibourne et al., 2013; Spektor et al., 2007; Tanos et al., 2013; Tsang et al., 2008). How the cell controls centriole remodeling remains unclear.
Surrounding the centrosome and ciliary base are centriolar satellites, small membrane-less granules which move along cytoplasmic microtubules (Bärenz et al., 2011; Kubo et al., 1999; Kubo and Tsukita, 2003; Odabasi et al., 2020). PCM1 is both a component of centriolar satellites and necessary for centriolar satellite formation (Dammermann and Merdes, 2002; Kubo and Tsukita, 2003; Odabasi et al., 2019; Wang et al., 2016). With PCM1, a diverse array of proteins co-localize at centriolar satellites (Gheiratmand et al., 2019; Gupta et al., 2015; Odabasi et al., 2019; Quarantotti et al., 2019), and many of these components also localize at centrioles themselves (Kodani et al., 2015; Lopes et al., 2011). Centriolar satellites are dynamic, change in response to cell stresses, and have been implicated in diverse processes including Hedgehog signaling, autophagy, proteasome activity, and aggresome formation (Holdgaard et al., 2019; Hori and Toda, 2017; Joachim et al., 2017; Kubo and Tsukita, 2003; Lecland and Merdes, 2018; Odabasi et al., 2019; Prosser et al., 2022; Prosser and Pelletier, 2020; Tang et al., 2013; Tollenaere et al., 2015; Villumsen et al., 2013; Wang et al., 2013a). Possibly reflecting involvement in these diverse biological processes, genetic perturbation of centriolar satellite components can compromise cilia formation and contribute to human ciliopathies and microcephaly (Conkar et al., 2017; Kim et al., 2008; Klinger et al., 2014; Kurtulmus et al., 2016; Lee and Stearns, 2013; Mikule et al., 2007; Staples et al., 2014), perhaps in a cell-type-specific way (Monroe et al., 2020; Odabasi et al., 2019; Wang et al., 2016). Thus, understanding of the function of PCM1 and centriolar satellites is emerging.
To investigate the functions of centriolar satellites in vivo, we generated Pcm1 null mice. We found that PCM1 is important for perinatal survival. Pcm1−/− mice surviving the perinatal period displayed dwarfism, male infertility, hydrocephaly, cerebellar hypoplasia, and variably expressive ciliopathy-associated phenotypes such as hydronephrosis, reflecting important roles for centriolar satellites in promoting both primary and motile ciliogenesis. In assessing how centriolar satellites enable ciliogenesis, we found that cells lacking PCM1 display compromised docking of the mother centriole to the ciliary vesicle and attenuated removal of CP110 and CEP97. Thus, we propose that centriolar satellites shape the mother centriole to promote critical early steps in ciliogenesis.
Results
Pcm1−/− mice exhibit perinatal lethality and ciliopathy-associated phenotypes
To investigate the in vivo function of centriolar satellites in mammals, we used CRISPR/Cas9 to create deletions in mouse Pcm1. Among the mutations generated, Pcm1∆5-14 introduced a frameshift after the first amino acid leading to a premature stop and Pcm1∆796-800 caused a frameshift and premature stop in exon 6 (Figure 1—figure supplement 1A). Immunoblotting with antibodies to two regions of PCM1, PCM1 immunofluorescence of mouse embryonic fibroblasts (MEFs) derived from Pcm1 mutant mice, and mass spectrometry-based proteomic analysis indicated that both mutations prevented formation of detectable PCM1 protein (Figure 1A, B, Figure 1—figure supplement 1B, C). Mice homozygous for either Pcm1 mutation exhibited indistinguishable phenotypes (Figure 1—figure supplement 2). Thus, we surmise that both mutations are likely to be null and henceforth we refer to both alleles as Pcm1−.
Figure 1 with 3 supplements see all
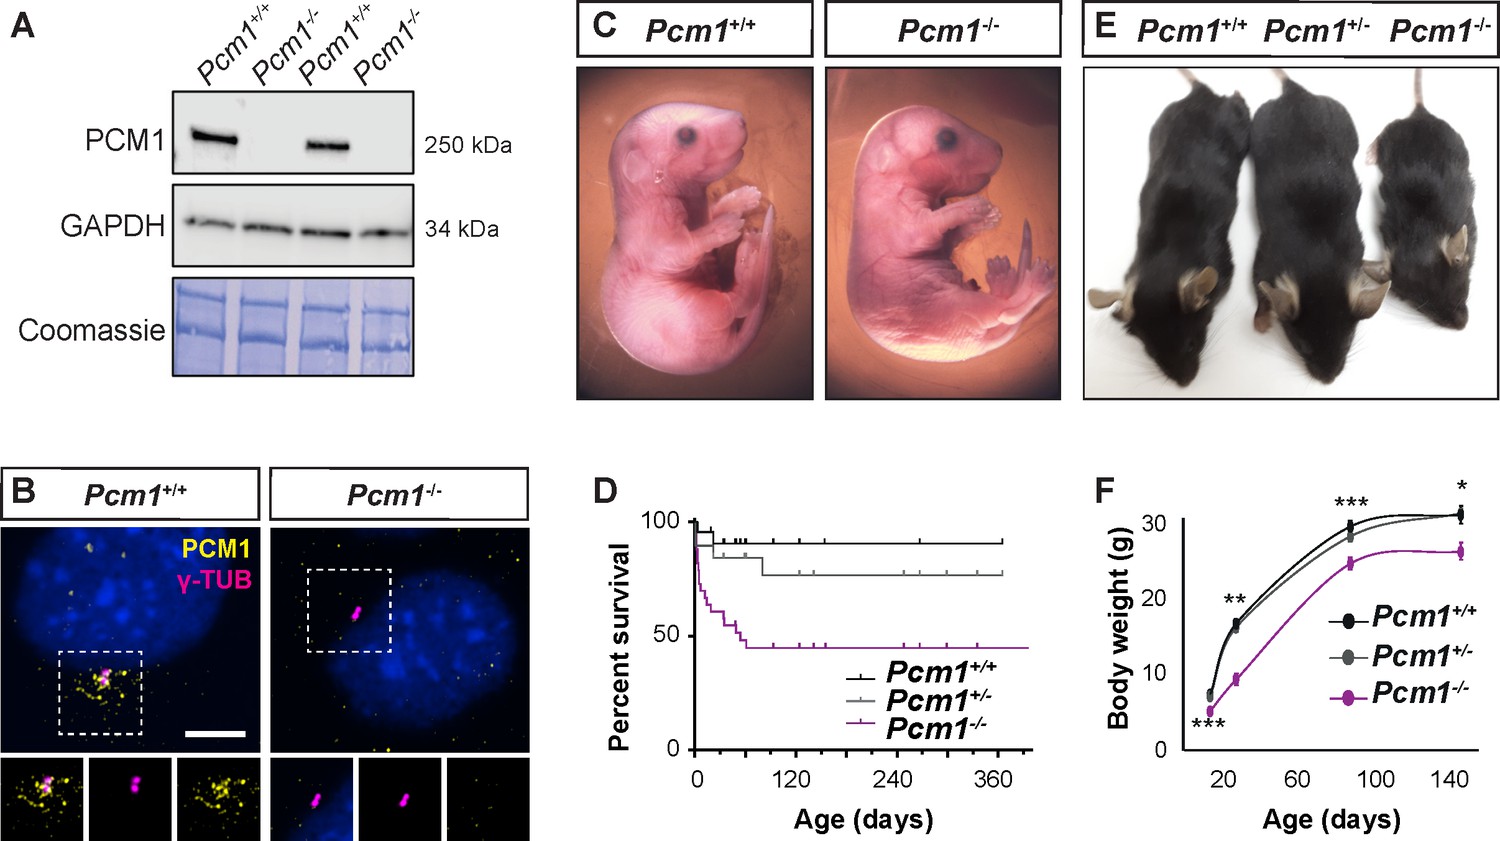
PCM1 is important for perinatal survival.
(A) Immunoblot of mouse embryonic fibroblast (MEF) lysates from wild-type and Pcm1−/− MEFs for PCM1 and GAPDH (loading control). Gel stained with Coomassie blue. (B) Immunostaining of PCM1 (yellow) and centrioles (γ-tubulin, γ-TUB, magenta) in wild-type and Pcm1−/− MEFs. (C) E18.5 wild-type and Pcm1−/− neonates. (D) Kaplan–Meier curve of wild-type, Pcm1+/- and Pcm1−/− mice. See also Figure 1—figure supplement 1D. (E) P28 wild-type, Pcm1+/− and Pcm1−/− mice. (F) Graph of body weights of wild-type, Pcm1+/− and Pcm1−/− mice by age. Student’s t-test *p < 0.05, **p < 0.01, ***p < 0.001. Error bars represent standard error of the mean (SEM), n > 7 per genotype at P14 and n > 3 per genotype at P150.
-
Figure 1—source data 1
Full uncropped immunoblots for Figure 1A and Figure 1—figure supplement 1C, labeled and unlabeled.
- https://cdn.elifesciences.org/articles/79299/elife-79299-fig1-data1-v2.pdf
Pcm1−/− mice were present at normal Mendelian ratios at late gestation (embryonic day [E] 18.5) (Figure 1C, D, Figure 1—figure supplement 1D). As abrogation of cilia themselves results in midgestation lethality (Huangfu et al., 2003), the presence of Pcm1−/− embryos late in gestation suggests that PCM1 is not essential for all ciliogenesis. Indeed, cilia in several Pcm1−/− tissues were morphologically normal at E18.5 (Figure 1—figure supplement 3A–E). However, by postnatal day (P) 5, half of Pcm1−/− mice had died (Figure 1D, Figure 1—figure supplement 1D), revealing that PCM1 is important for perinatal survival.
Surviving Pcm1−/− mice were smaller than littermate controls, weighing less than half of controls at P28 (Figure 1E, F). This dwarfism was detectable before birth, indicating intrauterine growth retardation (Figure 1—figure supplement 1E). The brains of surviving Pcm1−/− mice were proportionally smaller than those of littermates (Figure 1—figure supplement 1F, G), and displayed marked hydrocephaly (Figure 2A–C, Figure 2—figure supplement 1A, B). Hydrocephaly can result from motile cilia dysfunction, raising the possibility that centriolar satellites are required for cilia formation and/or function in ependymal cells.
Figure 2 with 4 supplements see all
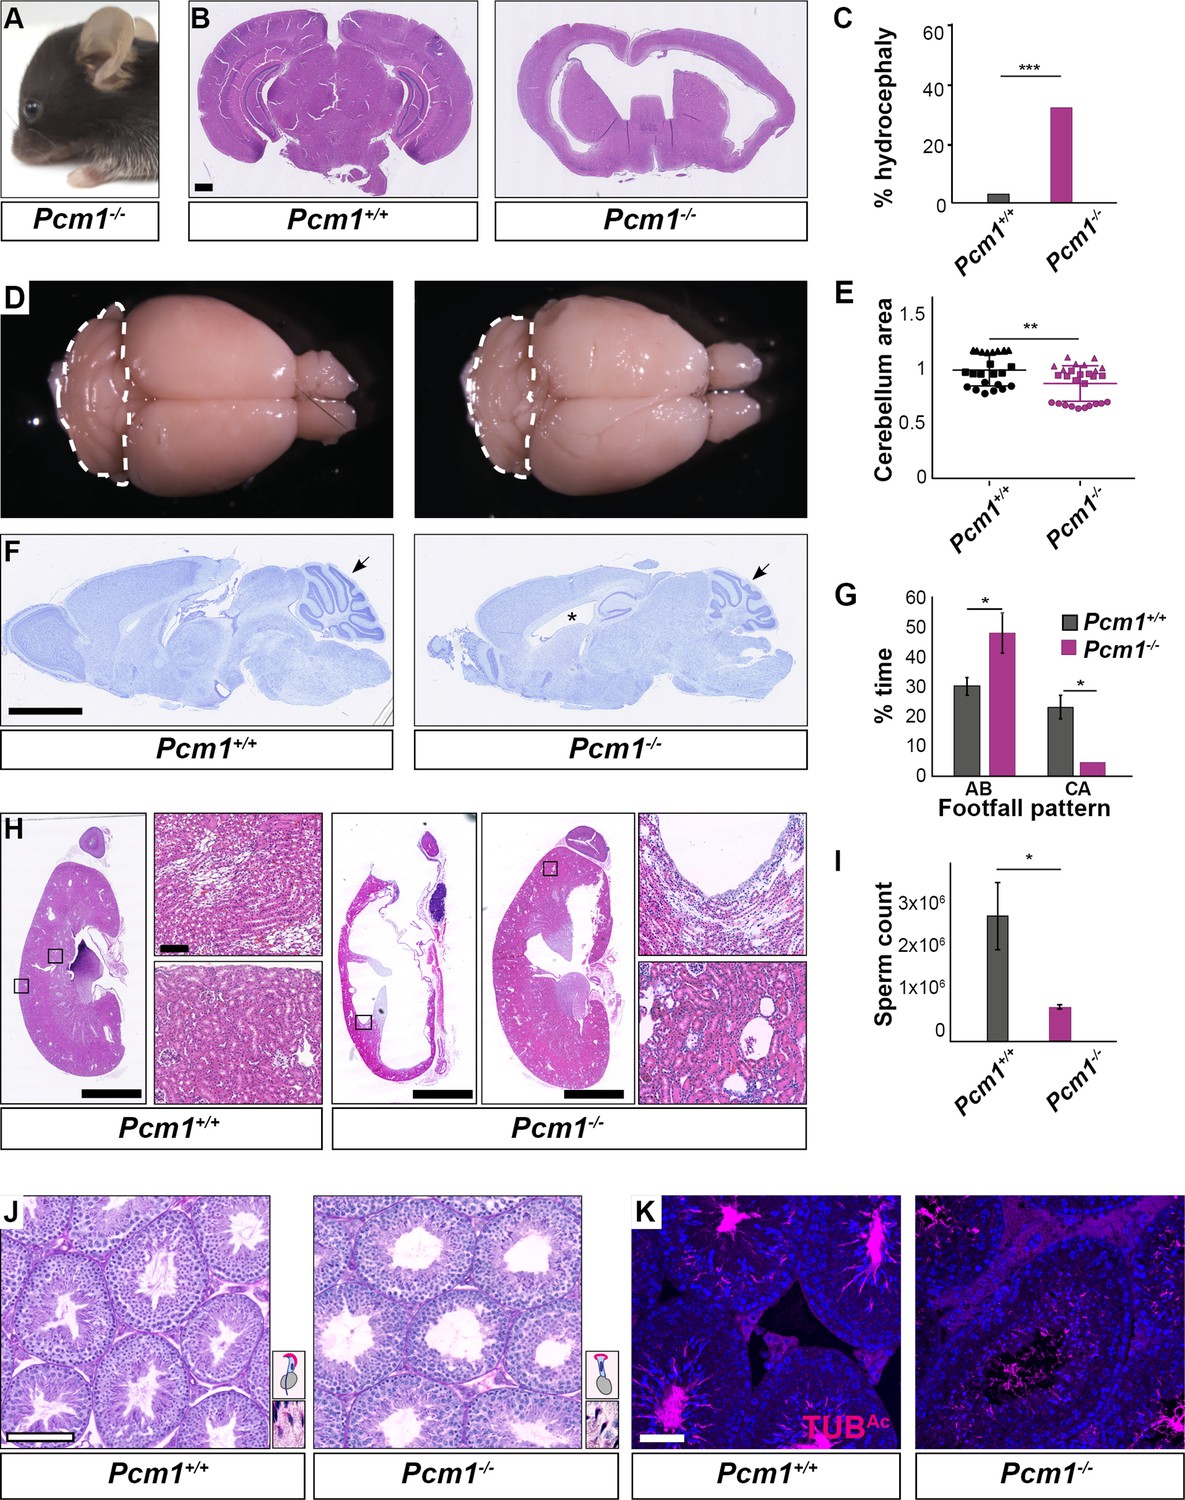
Pcm1−/− mice display ciliopathy-associated phenotypes.
(A) Pcm1−/− mouse displaying a domed skull indicative of hydrocephaly. (B) Coronal sections of 5-week-old wild-type and Pcm1−/− brains. (C) Percentages of wild-type and Pcm1−/− mice exhibiting hydrocephaly (n = 22 Pcm1−/− mice, age 19 days to 3 months (with hydrocephaly) and 6 weeks to 1 year (without overt hydrocephaly), n = 35 age-matched littermate controls). ***p < 0.001 (D) Gross morphology of 8-month-old wild-type and Pcm1−/− brains. Cerebella are delineated with dotted lines. (E) Quantification of cerebellar area measured from sagittal sections of 2- to 8-month-old brains from Pcm1−/− mice without frank hydrocephaly, normalized to the mean of wild-type cerebellar area. N = 3. Each shape represents a different animal. Error bars indicate standard deviations. Student’s t-test: **p < 0.01. (F) Cresyl violet-stained sagittal sections of 8-month-old brains. Cerebella are indicated with arrows. *Dilated ventricle. (G) Percentage of time spent by adult wild-type and Pcm1−/− mice in alternate (AB) gait and cruciate (CA) gait. Mean ± standard error of the mean (SEM). Pcm1+/+ n = 4, Pcm1−/− n = 5. Student’s t-test: *p < 0.05. (H) H&E-stained sections of kidneys and adrenals from 6-week-old wild-type and Pcm1−/− mice. (I) Sperm count per ml of wild-type and Pcm1−/− epididymal semen. n = 3 per genotype. Error bars represent SEM. Student’s t-test: *p < 0.05 (J) PAS-stained sections of 3-month-old wild-type and Pcm1−/− seminiferous tubules. Insets are higher magnification images of elongated spermatids (see Figure 2—figure supplement 1C for lower magnification images), with a cartoon of sperm head morphology. (K) Immunofluorescence staining of wild-type and Pcm1−/− seminiferous tubules for sperm flagella (acetylated tubulin, TUBAc, magenta) and nuclei (DAPI, blue). Scale bars represent 1 mm in B, 2.5 mm in F and H, 100 µm in J, and 50 µm in K.
In the postnatal brain, primary cilia are critical for Hedgehog signaling in cerebellar granule cell precursors. Decreased cerebellar Hedgehog signaling attenuates expansion of the granule cell precursors (Dahmane and Ruiz i Altaba, 1999; Spassky et al., 2008; Wallace, 1999; Wechsler-Reya and Scott, 1999). The cerebella of Pcm1−/− mice were smaller than those of littermate controls (Figure 2D–F, Figure 2—figure supplement 1A). As the cerebellum is important for motor coordination, we analyzed the gait of surviving Pcm1−/− mice. Consistent with altered cerebellar function, Pcm1−/− mice displayed ataxia (Figure 2G).
We investigated whether Pcm1−/− mice exhibit other Hedgehog-associated phenotypes. A proportion of viable Pcm1−/− mice (n = 2/15) developed hydronephrosis (Figure 2H), which can also result from attenuated Hedgehog signaling (Yu et al., 2002).
Because retinal degeneration is characteristic of several ciliopathies and PCM1 was strongly expressed in the retina (Figure 2—figure supplement 1D), we examined the retinas of Pcm1−/− mice using fundal imaging and histological analysis at 1 year of age. Pcm1−/− mice did not display characteristic features of photoreceptor death, such as changes to retinal pigmentation on fundoscopy or reduction of the outer nuclear layer on histology (Figure 2—figure supplement 1E, F). Electroretinogram (ERG) testing at 9 months of age revealed no visual functional deficits in Pcm1−/− mice (Figure 2—figure supplement 1G–I). Therefore, PCM1 is not essential for photoreceptor survival, suggesting it is dispensable for photoreceptor ciliogenesis and ciliary trafficking.
Surviving Pcm1−/− male mice were infertile with reduced sperm in seminiferous tubules (Figure 2I–K, Figure 2—figure supplement 1C). The few Pcm1−/− sperm identified exhibited disrupted head-to-tail coupling, abnormal head morphology indicative of defective intramanchette trafficking, and immotility (Figure 2—figure supplement 1C, Figure 2—videos 1–3). We previously discovered similar defects in male mice lacking centriolar satellite component CEP131 (also known as AZI1) (Hall et al., 2013), consistent with the idea that centriolar satellites are essential for mammalian spermatogenesis and male fertility. Thus, PCM1 supports postnatal survival and is required for the function of multiple ciliated cell types.
PCM1 promotes ciliogenesis in multiciliated cells
During the perinatal period, ependymal cells lining the brain ventricles generate many motile cilia. Shortly after birth (P1), immature ependymal cells possess non-polarized, short cilia. Beginning at P3, ependymal cells form multiple long, polarized cilia; this ciliogenesis occurs in a wave across the ventricle from caudal to rostral. By P15, ependymal cilia mature to generate metachronal rhythm (Spassky et al., 2008). Recent work showed that knockdown of Pcm1 in cultured ependymal cells led to disrupted cilia ultrastructure and motility (Zhao et al., 2021).
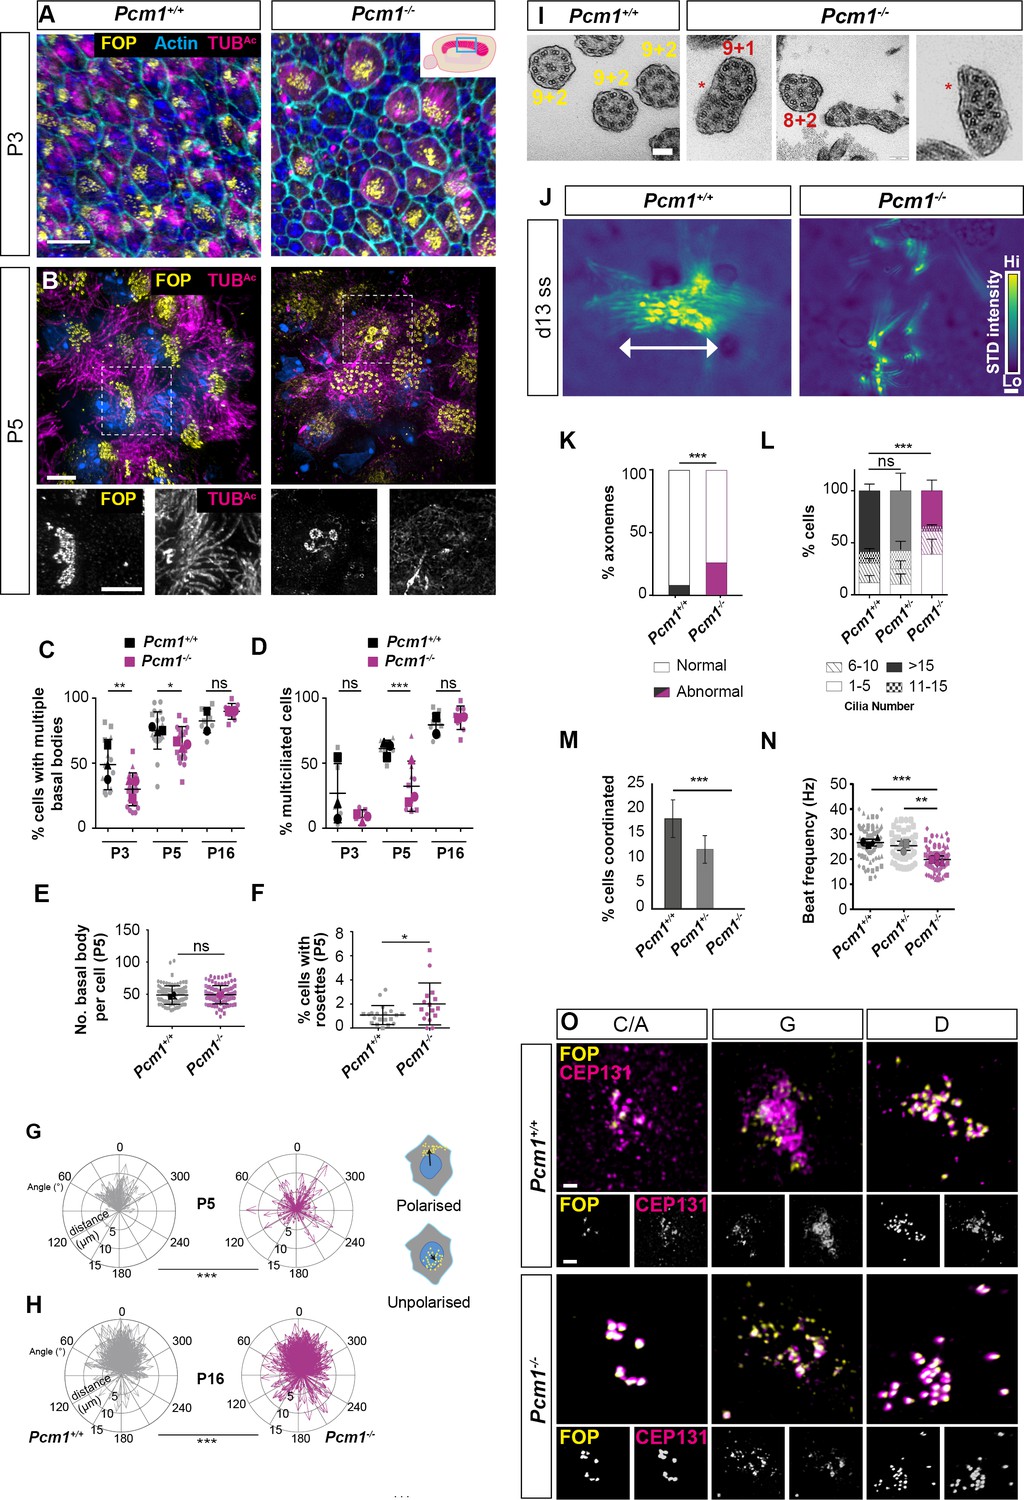
To explore whether defects in ependymal cilia could be the cause of hydrocephaly in Pcm1−/− mice, we imaged ependymal cilia in lateral ventricle walls. Pcm1−/− mice exhibited numerous ependymal cell abnormalities, including fewer ependymal cells with multiple basal bodies at P3 and P5 (Figure 3A-C, Figure 3—figure supplement 1A). However, by P16, Pcm1−/− mice had caught up and displayed normal numbers of ependymal cells with multiple basal bodies (Figure 3C, Figure 3—figure supplement 1B). These results suggest a delay in centriole biogenesis in the absence of PCM1.
Figure 3 with 10 supplements see all
PCM1 is required for efficient basal body synthesis and multiciliogenesis.
(A) Wild-type and Pcm1−/− P3 wholemount brain ventricles immunostained for basal bodies (FOP, yellow), actin (phalloidin, cyan) and cilia (TUBAc, magenta). Inset depicts area of ventricle imaged (cyan box). (B) Wild-type and Pcm1−/− P5 wholemount ventricles immunostained for basal bodies (FOP, yellow), cilia (TUBAc, magenta), and nuclei (DAPI, blue). Below: single optical planes highlight the persistence of rosettes and disrupted ciliogenesis in Pcm1−/− ependymal cells. (C) Percentage of ependymal cells with >4 basal bodies in wild-type and Pcm1−/− P3, P5, and P16 ventricles. Each shape represents an animal; the smaller symbols represent individual images and the larger shape the mean for each animal. Student’s t-test: *p < 0.05, **p < 0.01, ns: not significant. (D) Percentage of ependymal cells with multiple cilia in wild-type and Pcm1−/− P3, P5, and P16 ventricles. Student’s t-test: ***p < 0.001, ns, not significant. (E) The number of basal bodies per wild-type and Pcm1−/− P5 ependymal cell. (F) Percentage of P3 wild-type and Pcm1−/− ependymal cells with centriolar rosette structures. Student’s t-test: *p < 0.05. (G, H) Rose plots of the translational polarity of basal bodies in wild-type and Pcm1−/− P5 and P16 ependymal cells, as assessed from immunofluorescent images as in Figure 3—figure supplement 1A, B. Schematic insets represent individual ependymal cells with polarized or unpolarized basal bodies (yellow). An arrow was drawn from the center of the nucleus (blue) to the center of the basal bodies (yellow) and the distance and angle is plotted relative to the average angle for that field of view, which was set to 0ᵒ. At both P5 and P16, the standard deviations between wild-type and Pcm1−/− ependymal cells are different (F-test: ***p < 0.0001). (I) Transmission electron microscopy (TEM) of ependymal cell cilia from P3 wild-type and Pcm1−/− ventricles. Wild-type cilia display 9 + 2 microtubule arrangement. Pcm1−/− cilia display axonemal defects, including missing microtubule doublets and axoneme fusion (indicated by *). (J) Colorized heat map (scale: yellow – high, blue – low) of maximum projection of the standard deviation of pixel intensity in Figure 3—videos 1 and 2, depicting wild-type and Pcm1−/− cultured ependymal cell cilia beat coordination. Areas of high pixel intensity variation reflect areas of increased movement. (K) Percentage of P3 wild-type and Pcm1−/− ependymal cilia structural anomalies. Chi-squared test: ***p < 0.001. n = 121 cilia from 3 wild-type mice and 61 cilia from 3 Pcm1−/− mice. (L) Percentage of cultured wild-type and Pcm1−/− ependymal cells with ranges of cilia number 14–16 days after serum withdrawal. Chi-squared test: ***p < 0.001. ns: not significant. (M) Percentage of cultured wild-type and Pcm1−/− ependymal cells with coordinated ciliary beating 14–16 days after serum withdrawal. Chi-squared test: ***p < 0.01. (N) Cilia beat frequency of cultured wild-type and Pcm1−/− ependymal cells 14–16 days after serum withdrawal. Small symbols represent individual cells, large symbols represent average for each cell lines from an individual animal. Student’s t-test: ***p < 0.001, **p < 0.01. (O) Representative images of wild-type and Pcm1−/− mouse tracheal epithelium cells (mTECs) cultured at air–liquid interface for 3 days and immunostained for basal bodies (FOP, yellow) and CEP131 (magenta). Representative cells cultured from n = 3 wild-type and 3 Pcm1−/− animals, at the ‘centriolar amplification’ (C/A), ‘growth’ (G), and ‘disengagement’ (D) stages of centriolar amplification are shown (see also Figure 3—figure supplement 1G). Scale bars: 15 µm (A), 5 µm (B), 100 nm (I), and 1 μm main panel, 2 μm inset (O). Error bars represent SEM.
Once committed to making multiple centrioles, the numbers of basal bodies per cell formed by Pcm1−/− ependymal cells in vivo was similar to controls at P5 (Figure 3B, E). However, at this early stage, Pcm1−/− mice also exhibited increased numbers of cells with rosette-like arrangements of basal bodies (Figure 3B, F). As rosettes are typically present earlier in ependymal centriole biogenesis, these results are consistent with the absence of PCM1 causing a delay in centriole biogenesis.
In addition, basal bodies of Pcm1−/− ependymal cells displayed disrupted translational polarity of basal bodies within the apical domain, which persisted until P16 (Figure 3B, G, H, Figure 3—figure supplement 1A, B). Basal body positioning within the apical domain is thought to be independent of ciliary motility, suggesting roles for PCM1 in ependymal cells beyond motility (Kishimoto and Sawamoto, 2012; Mirzadeh et al., 2010b).
Interestingly, Pcm1−/− ependymal cells contained highly elongated FOP- and Centrin-containing centriole-like structures measuring 5.0 ± 1.9 µm (mean ± standard deviation [SD]) in length (Figure 3—figure supplement 2A–F). Together these results suggest disrupted centriole biogenesis and migration in the absence of PCM1.
At P5, there were fewer Pcm1−/− ciliated ependymal cells. However, by P16, the number of ciliated Pcm1−/− ependymal cells was equivalent to control ventricles (Figure 3A, B, D, Figure 3—figure supplement 1A, B). This delay in ependymal ciliogenesis in the absence of PCM1 could be secondary to the delay in centriole biogenesis. At P3, Pcm1−/− ependymal cilia displayed ultrastructural defects, including missing microtubule doublets and fused axonemes (Figure 3I, K).
To further analyze the function of PCM1 in multiciliogenesis, we cultured primary ependymal cells (Guirao et al., 2010) isolated from P0–P3 wild-type control and Pcm1−/− mice. These Pcm1−/− ependymal cells possessed fewer centrioles at the disengagement stage of centriole biogenesis, but once the cells became multiciliated had normal numbers of centrioles (Figure 3—figure supplement 1C, E, G). In culture, Pcm1−/− ependymal cells formed fewer cilia than control ependymal cells (Figure 3J, L, Figure 3—figure supplement 1C, F). High-speed video microscopy revealed that Pcm1−/− ependymal cilia beat slowly and uncoordinatedly (Figure 3J, M, N, Figure 3—videos 1–3). These findings further support the conclusion that the lack of PCM1 causes a delay in centriole biogenesis and disrupts motile ciliary function.
Thus, PCM1 is not essential for ciliogenesis, but is required for timely basal body biogenesis, maturation, migration, and ciliogenesis in ependymal cells. We propose that hydrocephaly in Pcm1−/− mice is caused by delayed ependymal cell ciliogenesis and compromised ciliary motility.
Like the brain ventricles, the trachea is lined by motile multiciliated cells. To examine whether PCM1 also promotes ciliogenesis and ciliary motility in the airways, we examined mouse tracheal basal bodies and cilia by immunofluorescence. Pcm1−/− tracheal multiciliated cells in vivo did not display decreased numbers of basal bodies or cilia at P5, or altered axonemal ultrastructure at 6 months of age (Figure 3—figure supplement 3B–D). High-speed video microscopy revealed Pcm1−/− tracheal cilia beat at normal frequency (Figure 3—figure supplement 3E, Figure 3—videos 4 and 5).
To investigate the dynamics of ciliogenesis in these cells, we differentiated mouse tracheal epithelial cells (mTECs) into multiciliated cells in vitro (Eenjes et al., 2018; You et al., 2002). Concurring with a previous reports on the dispensability of PCM1 in mTECs (Vladar and Stearns, 2007), Pcm1−/− mTECs displayed normal basal body biogenesis, ciliogenesis, and ciliary beat frequency (Figure 3—figure supplement 3A, F). However, proteomic analysis of differentiating Pcm1−/− mTECs revealed that many motile ciliary proteins, including dynein motors, dynein assembly factors and dynein docking factors, were reduced early in ciliogenensis (air–liquid interface [ALI] day 7) (Figure 3—figure supplement 3G, Supplementary file 5). Similar to the transitory delay we observed in Pcm1−/− ependymal cell ciliogenesis, proteomic differences in Pcm1−/− mTECs resolved by ALI day 21 (Figure 3—figure supplement 3G, Supplementary file 5). Thus, as in ependymal cells, PCM1 promotes timely cilia maturation in tracheal cells.
In multiciliated cells, PCM1 and other centriolar satellite proteins including CEP131 and PCNT localize to fibrogranular material, satellite-like networks (Zhao et al., 2021). Consistent with previous findings from Zhao et al., we found that CEP131 in mTECs lacking PCM1 localized not to fibrogranular material but to centrioles, (Figure 3O). Similarly, in Pcm1−/− ependymal cells, CEP131 mislocalized to the centrioles, although rather than being absent from the fibrogranular material, this non-centriolar CEP131 pool became more elongated (Figure 3—figure supplement 1H). Not all centriolar satellite components behaved similarly in the absence of PCM1; localization of PCNT was normal in Pcm1−/− ependymal cells (Figure 3—figure supplement 1I). Thus, fibrogranular material in the absence of PCM1 can either be disrupted or change its distribution in different multiciliated cell types. Together, these results suggest that PCM1 is required for fibrogranular material integrity, centriole biogenesis, and migration, and timely ciliogenesis in multiciliated cells.
PCM1 is required for centriolar satellite integrity
To assess whether PCM1 is essential for centriolar satellite integrity, we analyzed Pcm1−/− MEFs and PCM1−/− RPE1 cells (Kumar et al., 2021). Immunoblot and immunofluorescence analyses confirmed loss of PCM1 protein in the mutant cells (Figure 1A, B, Figure 4A, H). In addition to PCM1 and CEP131, centriolar satellites contain proteins such as CEP290 and the E3 ligase MIB1 (Hall et al., 2013; Staples et al., 2012; Villumsen et al., 2013). In control RPE1 cells, CEP131 and CEP290 localized to both centriolar satellites and to the centrioles themselves. In PCM1−/− RPE1 cells, the centriolar satellite pool of CEP131 was absent, CEP290 was reduced and dispersed, and both displayed increased accumulation at centrioles (Figure 4B, C). In control MEFs, CEP131 and MIB1 localized to both centriolar satellites and to the centrioles themselves. In Pcm1−/− MEFs, the centriolar satellite pool of CEP131 was absent and MIB1 was reduced and dispersed, with CEP131 displaying increased accumulation at centrioles, similar to Pcm1−/− tracheal epithelial cells (Figure 4D–G). We conclude that PCM1 is critical for centriolar satellite integrity. In the absence of satellites, some satellite proteins (e.g., CEP131 and CEP290) over-accumulate at centrioles, while others (e.g., MIB1) do not, highlighting the protein-specific role centriolar satellites play in controlling centriolar localization. We propose that centriolar satellites both deliver and remove select cargos from centrioles.
Figure 4 with 2 supplements see all
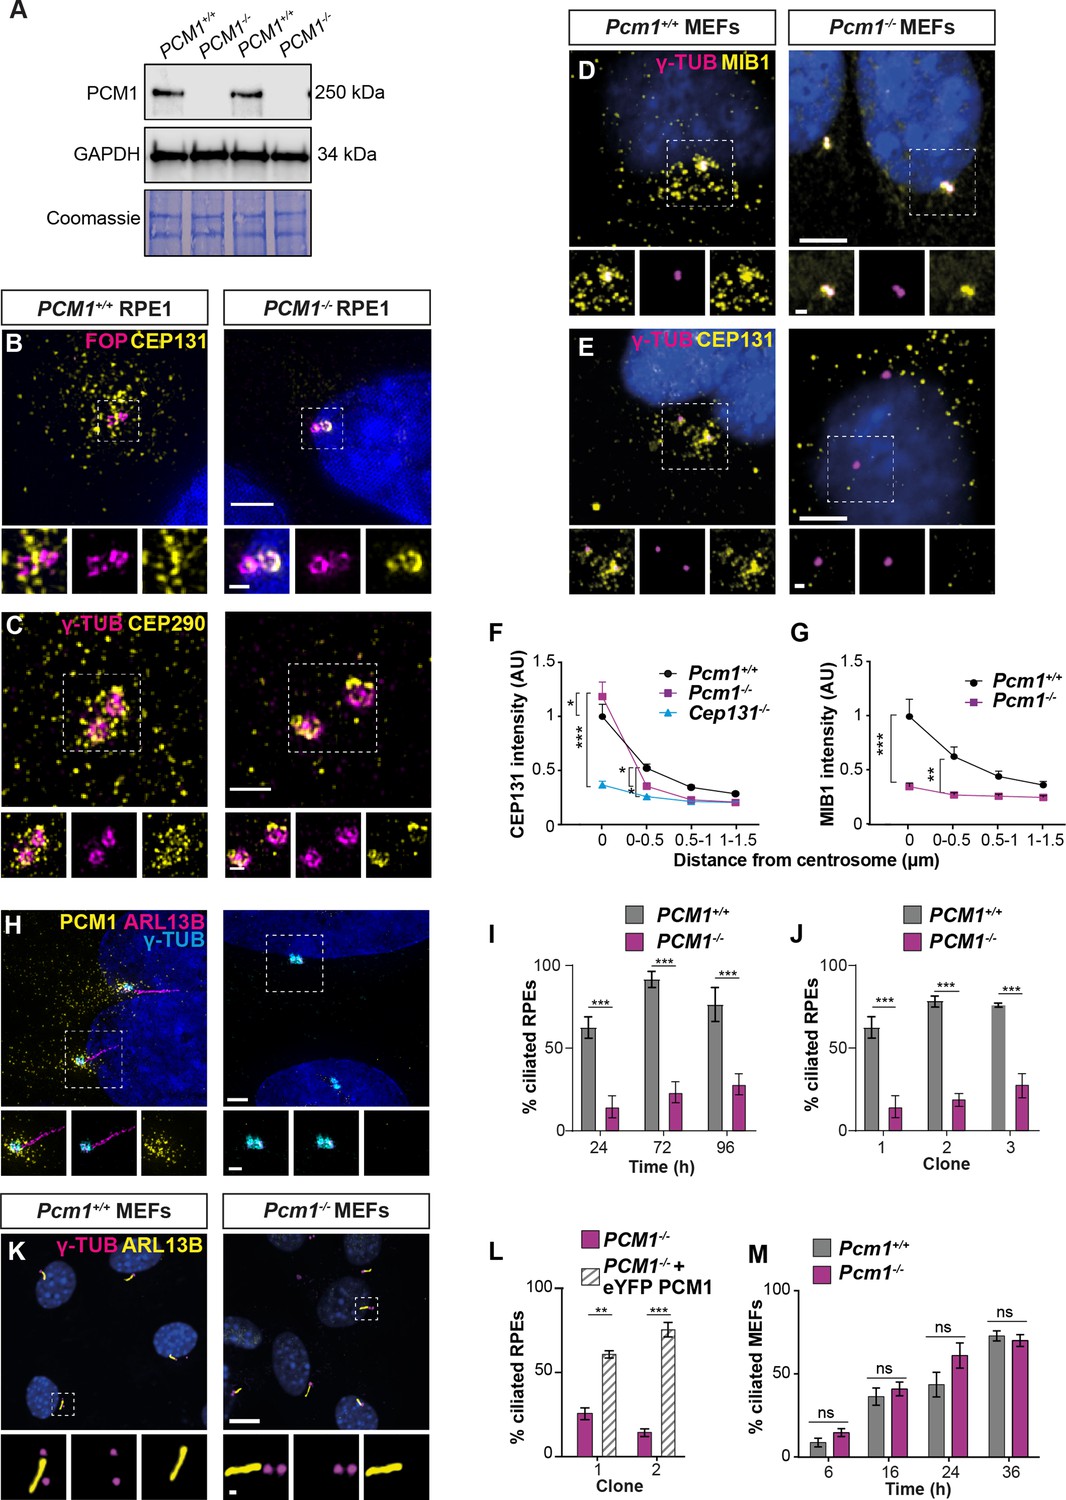
PCM1 is essential for centriolar satellite integrity and, in some cell types, ciliogenesis.
(A) Immunoblot of wild-type and PCM1−/− retinal pigmented epithelial 1 (RPE1) cell lysates for PCM1 and GAPDH (loading control). Gel stained with Coomassie blue. (B) Wild-type and PCM1−/− RPE1 cells immunostained for CEP131 (yellow), centrioles (FOP, magenta), and nuclei (DAPI, blue). (C) Wild-type and PCM1−/− RPE1 cells immunostained for CEP290 (yellow), centrioles (γ-TUB, magenta), and nuclei (DAPI, blue). (D, E) Wild-type and Pcm1−/− mouse embryonic fibroblasts (MEFs) immunostained for centrioles (γ-TUB, magenta), and nuclei (DAPI, blue) with CEP131 (D) or MIB1 (E) (yellow). (F) CEP131 intensity as a function of distance from the centrosome. Cep131−/− MEFs are included as a control (Hall et al., 2013). Two-way analysis of variance (ANOVA), comparing wild-type to mutants, with Dunnett correction for multiple testing: *p < 0.05, **p < 0.01, ***p < 0.001. Error bars represent standard error of the mean (SEM). (G) MIB1 intensity as a function of distance from the centrosome. (H) Wild-type and PCM1−/− RPE1 cells immunostained for PCM1 (yellow), cilia (ARL13B, magenta), centrioles (γ-TUB, cyan), and nuclei (DAPI, blue). (I) Percentage of wild-type and PCM1−/− RPE1 cells serum starved for 24, 72, or 96 hr that are ciliated. Bar graphs show means ± standard deviation (SD). Unpaired Student’s t-test: ***p < 0.001. n > 100 cells from 3 replicates. (J) Percentage of three control (treated with non-targeting sgRNA) and PCM1−/− RPE1 clonal lines, serum starved for 24 hr that are ciliated. Bar graphs show means ± SEM. Unpaired Student’s t-test: ***p < 0.001. n > 100 cells from 2 replicates. (K) Wild-type and Pcm1−/− MEFs immunostained for cilia (ARL13B, yellow), centrioles (γ-TUB, magenta), and nuclei (DAPI, blue). (L) Percentage of two PCM1−/− RPE1 clonal lines with and without eYFP-PCM1 expression serum starved for 24 hr. Bar graphs show means ± SEM. Unpaired Student’s t-test: **p < 0.01, ***p < 0.001. n > 100 cells from 2 replicates. (M) Percentage of wild-type and Pcm1−/− MEFs serum starved for 6–36 hr that are ciliated. Bar graphs show means ± SEM. n = 3 MEF lines from different embryos per genotype. Student’s t-test, ns: not significant. Scale bars: 2 µm (B), 1 µm (C), 0.5 µm (B, C insets), 5 µm (D, E), 1 µm (D, E insets), 10 µm (H, K), and 1 µm (H, K insets).
-
Figure 4—source data 1
Full uncropped immunoblots for Figure 4G, labeled and unlabeled.
- https://cdn.elifesciences.org/articles/79299/elife-79299-fig4-data1-v2.pdf
One way in which satellites could traffic cargos to and from centrioles would be via their movement within the cell. To visualize PCM1, we engineered mice expressing a fusion of PCM1 and the SNAP tag (Keppler et al., 2003) from the Pcm1 locus. We derived MEFs from Pcm1SNAP mice, covalently labeled PCM1-SNAP with tetramethylrhodamine (Crivat and Taraska, 2012), and imaged centriolar satellite movement relative to cilia. Consistent with previous reports (Conkar et al., 2019), centriolar satellites moved both toward and away from the ciliary base, with frequent fission and fusion at the ciliary base (Figure 4—video 1).
To further explore how centriolar satellites promote ciliogenesis, we examined ciliogenesis in MEFs and RPE1 cells lacking PCM1. In accordance with previous observations (Odabasi et al., 2019; Wang et al., 2016), ciliogenesis was abrogated in several PCM1−/− RPE1 cell lines (Figure 4H, J) and could be rescued by expression of eYFP-PCM1 (Figure 4L).
In marked contrast, and consistent with the tissue-specific effects of loss of PCM1 on ciliogenesis (Figure 1—figure supplement 3), ciliogenesis was not perturbed in Pcm1−/− MEFs, with Pcm1−/− MEFs displaying cilia number, centrosome number and cilia length indistinguishable from those of controls (Figure 4K, M, Figure 4—figure supplement 1A–D). Thus, PCM1, despite broad roles in regulating the centriolar localization of proteins such as CEP131, plays cell-type-specific roles in ciliogenesis.
PCM1 is dispensable for removal of Centrobin and assembly of distal and subdistal appendages
An early step in ciliogenesis is the removal of daughter centriole-specific protein Centrobin (Stephen et al., 2015; Wang et al., 2018). A previous study proposed a role for PCM1-localizing centriolar satellites in regulating the abundance of Talpid3, a component of the distal centriole implicated in the removal of Centrobin from the mother centriole (Wang et al., 2018; Wang et al., 2016). We found that both Talpid3 and Centrobin localization to centrioles in PCM1−/− RPE1 cells was equivalent to those of controls (Figure 5—figure supplement 1A–E). Thus, Talpid3 recruitment to centrioles and Centrobin removal from the mother centriole are not dependent upon PCM1 or, by extension, centriolar satellites.
Distal appendages anchor the mother centriole to the ciliary membrane and subdistal appendages position the cilium within cells (Mazo et al., 2016; Schmidt et al., 2012; Sillibourne et al., 2013; Tanos et al., 2013). Since centriolar satellite cargos (e.g., CEP90, OFD1, and MNR) are essential for ciliogenesis and distal appendage assembly (Kumar et al., 2021), we hypothesized that PCM1 may participate in distal or subdistal appendage formation. To test this hypothesis, we examined localization of components of the distal (i.e., FBF1 and ANKRD26) and subdistal appendages (i.e., Ninein) at the mother centriole. In PCM1−/− RPE1 cells, both distal and subdistal appendage components localized to the mother centriole (Figure 5—figure supplement 1F–K), although the amount of distal appendage proteins at the mother centriole was slightly reduced. Serial section transmission electron microscopy (TEM) confirmed that subdistal and distal appendages were present in PCM1−/− RPE1 cells (Figure 5—figure supplement 2). Therefore, centriolar satellites are not required for the assembly of distal or subdistal appendages at the mother centriole.
PCM1 promotes formation of the ciliary vesicle
After acquiring distal appendages, the mother centriole docks to preciliary vesicles, small vesicles which accumulate at the distal appendages of the mother centriole and are converted into a larger ciliary vesicle (Schmidt et al., 2012; Sillibourne et al., 2013; Tanos et al., 2013). To further examine the cause of reduced ciliogenesis in RPE1 cells lacking centriolar satellites, we investigated whether preciliary vesicle docking or ciliary vesicle formation depends on PCM1.
Myosin-Va adorns preciliary and ciliary vesicles (Wu et al., 2018). Using 3D-SIM imaging of Myosin-Va, we identified preciliary vesicles at the basal bodies of control RPE1 cells soon after the induction of ciliogenesis (i.e., after 1 hr of serum starvation). PCM1−/− RPE1 cells showed reduced Myosin-Va at preciliary vesicles (Figure 5A, B), suggesting that centriolar satellites promote timely centriolar docking of preciliary vesicles.
Figure 5 with 2 supplements see all
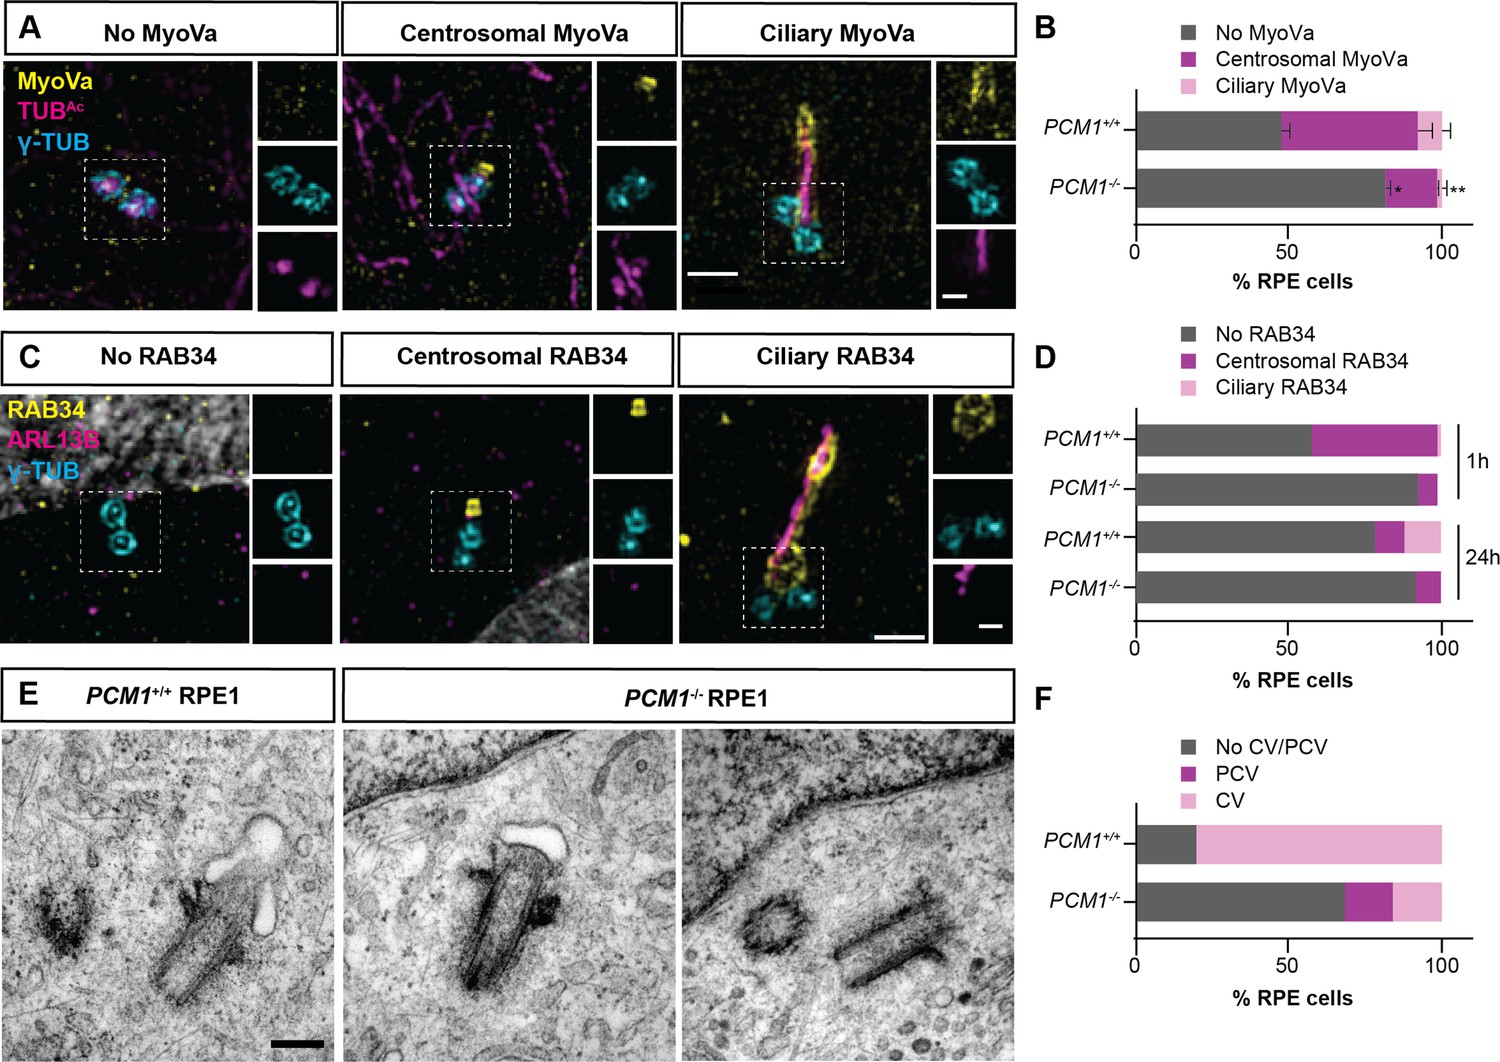
PCM1 promotes mother centriole docking to preciliary vesicles.
(A) 3D-SIM images of Myosin-Va (MyoVa, yellow), centrioles (γ-TUB, cyan) and cilia (TUBAc, magenta) in wild-type and PCM1−/− RPE cells 1 hr after serum starvation. Scale bars: 1 and 0.5 μm for main panels and insets, respectively. (B) Percentage of wild-type and PCM1−/− retinal pigmented epithelial 1 (RPE1) cells with no MyoVa at centrosomes, MyoVa at centrosomes, and MyoVa at cilia. Bar graphs show means ± standard error of the mean (SEM). Unpaired Student’s t-test compared with wild-type: *p < 0.05, **p < 0.005. n > 50 cells from 2 replicates. (C) 3D-SIM images of RPE1 cells immunostained with RAB34 (yellow), centrioles (γ-TUB, cyan), and cilia (ARL13B, magenta). Scale bars: 1 and 0.5 μm for main panels and insets, respectively. (D) Percentage of wild-type and PCM1−/− RPE cells 1 and 24 hr after serum starvation exhibiting no centrosomal RAB34, RAB34 at centrosomes, and RAB34 at cilia. n > 100 cells. (E) Serial-section transmission electron microscopy (TEM) of RPE1 cells during early ciliogenesis (1 hr after serum starvation). Scale bar: 200 nm. (F) Percentage of wild-type and PCM1−/− RPE1 cells in which TEM images demonstrate basal body association with preciliary vesicles (PCV) or ciliary vesicles (CV). n = 5–20 cells.
Since Myosin-Va marks both preciliary and ciliary vesicles, we more specifically assessed ciliary vesicle formation at the mother centriole by examining the localization of RAB34. RAB34 is a GTPase that marks the ciliary vesicle early in ciliogenesis and, later, the ciliary sheath (Ganga et al., 2021). Using 3D-SIM imaging, we observed RAB34 at the centrosome of wild-type RPE1 cells after 1-hr serum starvation, and at both centrosomes and ciliary sheaths after 24-hr serum starvation (Figure 5C, D). PCM1−/− RPE1 cells showed reduced RAB34 at both centrosomes and ciliary sheaths (Figure 5C, D), suggesting that centriolar satellites promote timely docking of the mother centriole to the preciliary vesicles, and the fusion of preciliary vesicles into a ciliary vesicle.
To assess ciliary vesicle formation using a complementary approach, we performed serial section TEM of control and PCM1−/− RPE1 cells early in ciliogenesis (i.e., after 1 hr of serum starvation). We quantified preciliary and ciliary vesicles at mother centrioles. In PCM1−/− cells, mother centrioles (identified by the presence of distal and subdistal appendages) exhibited reduced association with preciliary and ciliary vesicles (Figure 5E, F, Figure 5—figure supplement 2). Thus, centriolar satellites promote the attachment of the mother centriole to preciliary vesicles and formation of the ciliary vesicle, important early steps in ciliogenesis.
PCM1 promotes CP110 and CEP97 removal from the mother centriole
In vertebrates, CP110 is required for docking of the mother centriole to preciliary vesicles (Walentek et al., 2016; Yadav et al., 2016) and is removed from the mother centriole subsequent to formation of the ciliary vesicle (Lu et al., 2015; Wu et al., 2018). The cap comprised of CP110 and CEP97 inhibits ciliogenesis, and its removal from the distal mother centriole is important for axoneme elongation (Spektor et al., 2007; Yadav et al., 2016). Since PCM1 promotes timely ciliary vesicle formation, we examined whether CP110 and CEP97 removal also depends on PCM1. In contrast to control cells, CP110 and CEP97 persisted at the distal mother centriole in PCM1−/− RPE1 cells after 24 hr of serum starvation (Figure 6A–D).
Figure 6 with 1 supplement see all

PCM1 promotes removal of CP110 and CEP97 from the mother centriole.
(A) Wild-type and PCM1−/− RPE1 cells serum starved for 24 hr immunostained for CP110 (yellow), centrioles (FOP, cyan), and distal appendages (CEP164, magenta). (B) Wild-type and PCM1−/− RPE1 cells serum starved for 24 hr immunostained for CEP97 (yellow), centrioles (γ-TUB, cyan), and cilia (TUBAc, magenta). (C) Percentage of wild-type and PCM1−/− RPE1 cells with CP110 levels at one or two centrioles. Bar graphs show means ± standard error of the mean (SEM). Unpaired Student’s t-test compared with wild-type: ***p < 0.0005. n > 50 cells from 2 replicates. (D) Percentage of wild-type and PCM1−/− RPE1 cells with CEP97 levels at one or two centrioles. Bar graphs show means ± SEM. Unpaired Student’s t-test compared with wild-type: ***p < 0.0005. n > 50 cells from 2 replicates. (E) Wild-type and Pcm1−/− MEFs serum starved for 24 hr and immunostained for CP110 (yellow) and cilia (TUBAc, magenta). (F) Wild-type and Pcm1−/− lateral ventricular wall immunostained for CP110 (yellow), basal bodies (FOP, cyan), and nuclei (DAPI, blue). (G) Percentage of wild-type and Pcm1−/− MEFs serum starved for 24 hr with CP110 levels at none, one or two centrioles. Chi squared test ***p < 0.001. (H) The ratio of CP110 intensity on daughter and mother centrioles in wild-type and Pcm1−/− MEFs serum starved for 24 hr. (I) Intensity of CP110 in wild-type and Pcm1−/− ependymal cells. n = 3 per genotype. Large symbols represent individual animals, small symbols represent individual cells. Student’s t-test, *p < 0.05, **p < 0.01, ***p < 0.001. Scale bars represent 1 µm (main panel) and 0.5 µm (inset) (A, B), represent 5 µm (main panel) and 1 µm (inset) (E), and 2 µm (F).
Interestingly, in wild-type MEFs, a small amount of CP110 persisted on the mother centriole even after axoneme formation (Figure 6E, G, H). Strikingly, mother centrioles in Pcm1−/− MEFs had CP110 levels comparable to daughter centrioles after 24 hr serum starvation, despite undergoing ciliogenesis at rates equal to that of wild-type cells (Figure 6E, G, H). Thus, PCM1 is essential for removing CP110 from the mother centriole, but CP110 removal is not required for ciliogenesis in MEFs.
Similar to RPE1 cells and MEFs, in Pcm1−/− ependymal cells in vivo, CP110 levels were elevated at P3, an age when ependymal calls are engaged in ciliogenesis (Figure 6F, I). Moreover, CP110 levels were elevated at the multiple basal bodies of Pcm1−/− tracheal multiciliated cells (Figure 6—figure supplement 1). Thus, diverse cell types require PCM1 to remove CP110 from the mother centriole, despite differentially requiring PCM1 for ciliogenesis.
PCM1 promotes transition zone formation and intraflagellar transport (IFT) recruitment
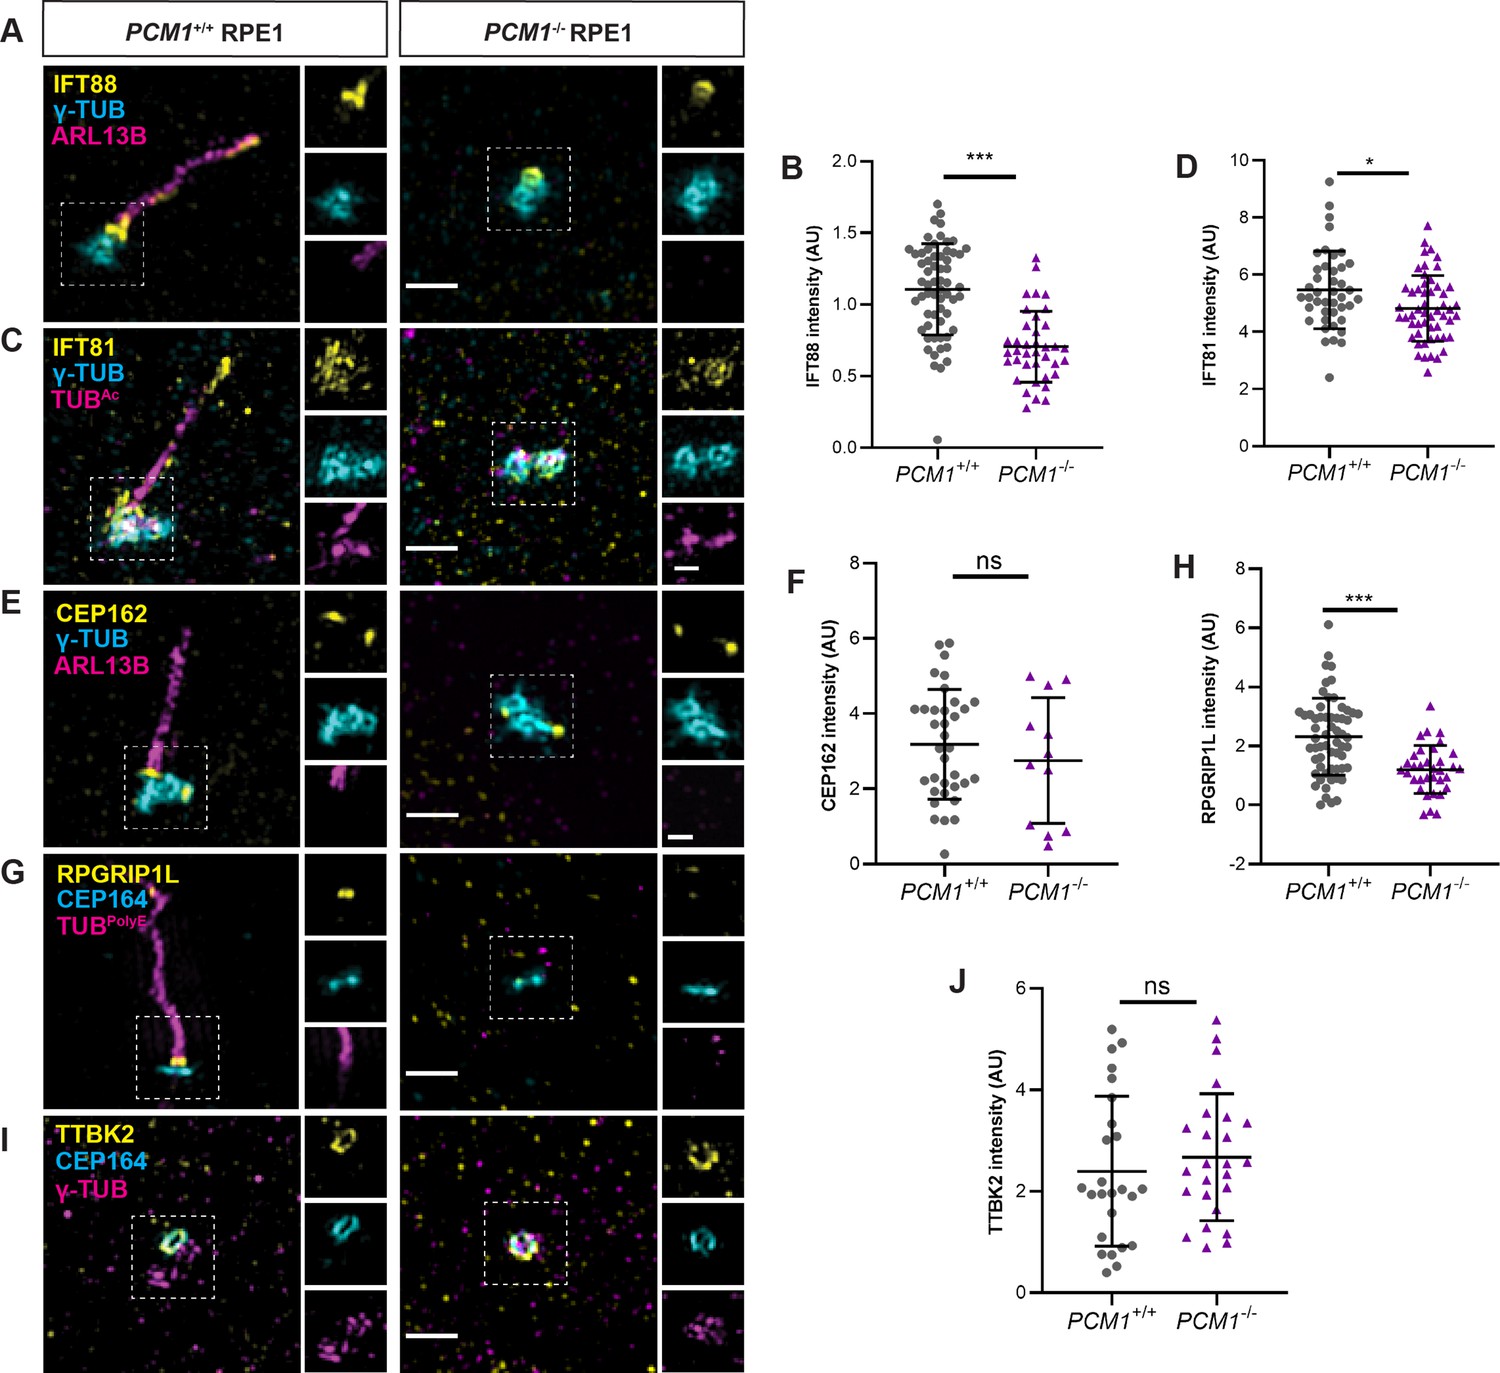
Following ciliary vesicle docking and removal of CP110 and CEP97 from the mother centriole, ciliogenesis proceeds with transition zone construction and IFT recruitment (Ishikawa and Marshall, 2011). Since PCM1 promotes ciliary vesicle docking and CP110 and CEP97 removal, we hypothesized that in cells lacking PCM1 the subsequent engagement of IFT and transition zone components would be compromised.
To test this hypothesis, we immunostained control and PCM1−/− RPE1 cells with antibodies to IFT88 and IFT81. As expected, IFT88 and IFT81 localized to mother centrioles and along the length of cilia in control cells (Figure 7A, C). Localization of both IFT88 and IFT81 at mother centrioles was reduced in PCM1−/− RPE1 cells (Figure 7A–D), suggesting that IFT recruitment to the mother centriole is promoted by centriolar satellites. In contrast, ciliary and basal body levels of IFT88 were normal in Pcm1−/− MEFs (Figure 7—figure supplement 1A, B), indicating a concordance between PCM1-dependent IFT recruitment and ciliogenesis.
Figure 7 with 1 supplement see all
PCM1 promotes IFT recruitment and transition zone formation.
(A) Wild-type and PCM1−/− RPE1 cells immunostained for IFT88 (yellow), centrioles (γ-TUB, cyan), and cilia (ARL13B, magenta). (B) Quantification of IFT88 intensity at basal bodies. (C) Immunostaining for IFT81 (yellow), centrioles (γ-TUB, cyan), and cilia (TUBAc, magenta). (D) Quantification of IFT81 intensity at basal bodies. (E) Immunostaining for CEP162 (yellow), centrioles (γ-TUB, cyan), and cilia (ARL13B, magenta). (F) Quantification of CEP162 intensity at basal bodies. (G) Immunostaining for transition zone component RPGRIP1L (yellow), distal appendages (CEP164, cyan), and cilia (TUBpolyE, magenta). (H) Quantification of RPGRIP1L intensity at transition zones. (I) Immunostaining for TTBK2 (yellow), distal appendages (CEP164, cyan), and centrioles (γ-TUB, magenta). (J) Quantification of TTBK2 intensity at basal bodies. Scale bars in main figures represent 1 µm and in insets represent 0.5 µm. Bar graphs show means ± standard deviation (SD) from 2 experiments. Student’s t-test: *p < 0.05, ***p < 0.001, ns, not significant.
The transition zone controls ciliary protein composition. We determined whether PCM1 was required for the formation of the transition zone by assessing the localization of CEP162, an axoneme-associated protein that recruits components of the transition zone, such as RPGRIP1L (Wang et al., 2013b). Recruitment of CEP162 to the mother centriole was unaffected in PCM1−/− RPE1 cells (Figure 7E, F). In contrast, PCM1−/− RPE1 cells exhibited reduced RPGRIP1L at the transition zone (Figure 7G, H). Therefore, centriolar satellites promote both IFT recruitment and transition zone formation at RPE1 cell mother centrioles.
Centriolar satellites restrict CP110 and CEP97 levels at centrioles
To explore the mechanisms by which centriolar satellites regulate CP110 and CEP97 levels at the centrioles, we examined the localization of TTBK2. TTBK2 is a kinase recruited by CEP164, a distal appendage component required to remove CP110 and CEP97 from mother centrioles (Goetz et al., 2012). In PCM1−/− RPE1 cells, TTBK2 recruitment to distal mother centrioles was equivalent to that of control cells (Figure 7I, J). These results suggest that centriolar satellites regulate CP110 and CEP97 removal from the distal mother centriole through a mechanism independent of TTBK2 recruitment.
As PCM1 is dispensable for the localization of TTBK2 at the distal mother centriole, we considered alternative mechanisms by which PCM1 may regulate local CP110 and CEP97 levels at the mother centriole. Since centriolar satellites are highly dynamic and localization of CP110 and CEP97 is actively controlled at the initiation of ciliogenesis, we hypothesized that CP110 and CEP97 are transported away from the centrioles via satellites. A prediction of this model is that CP110 and CEP97 should localize to satellites.
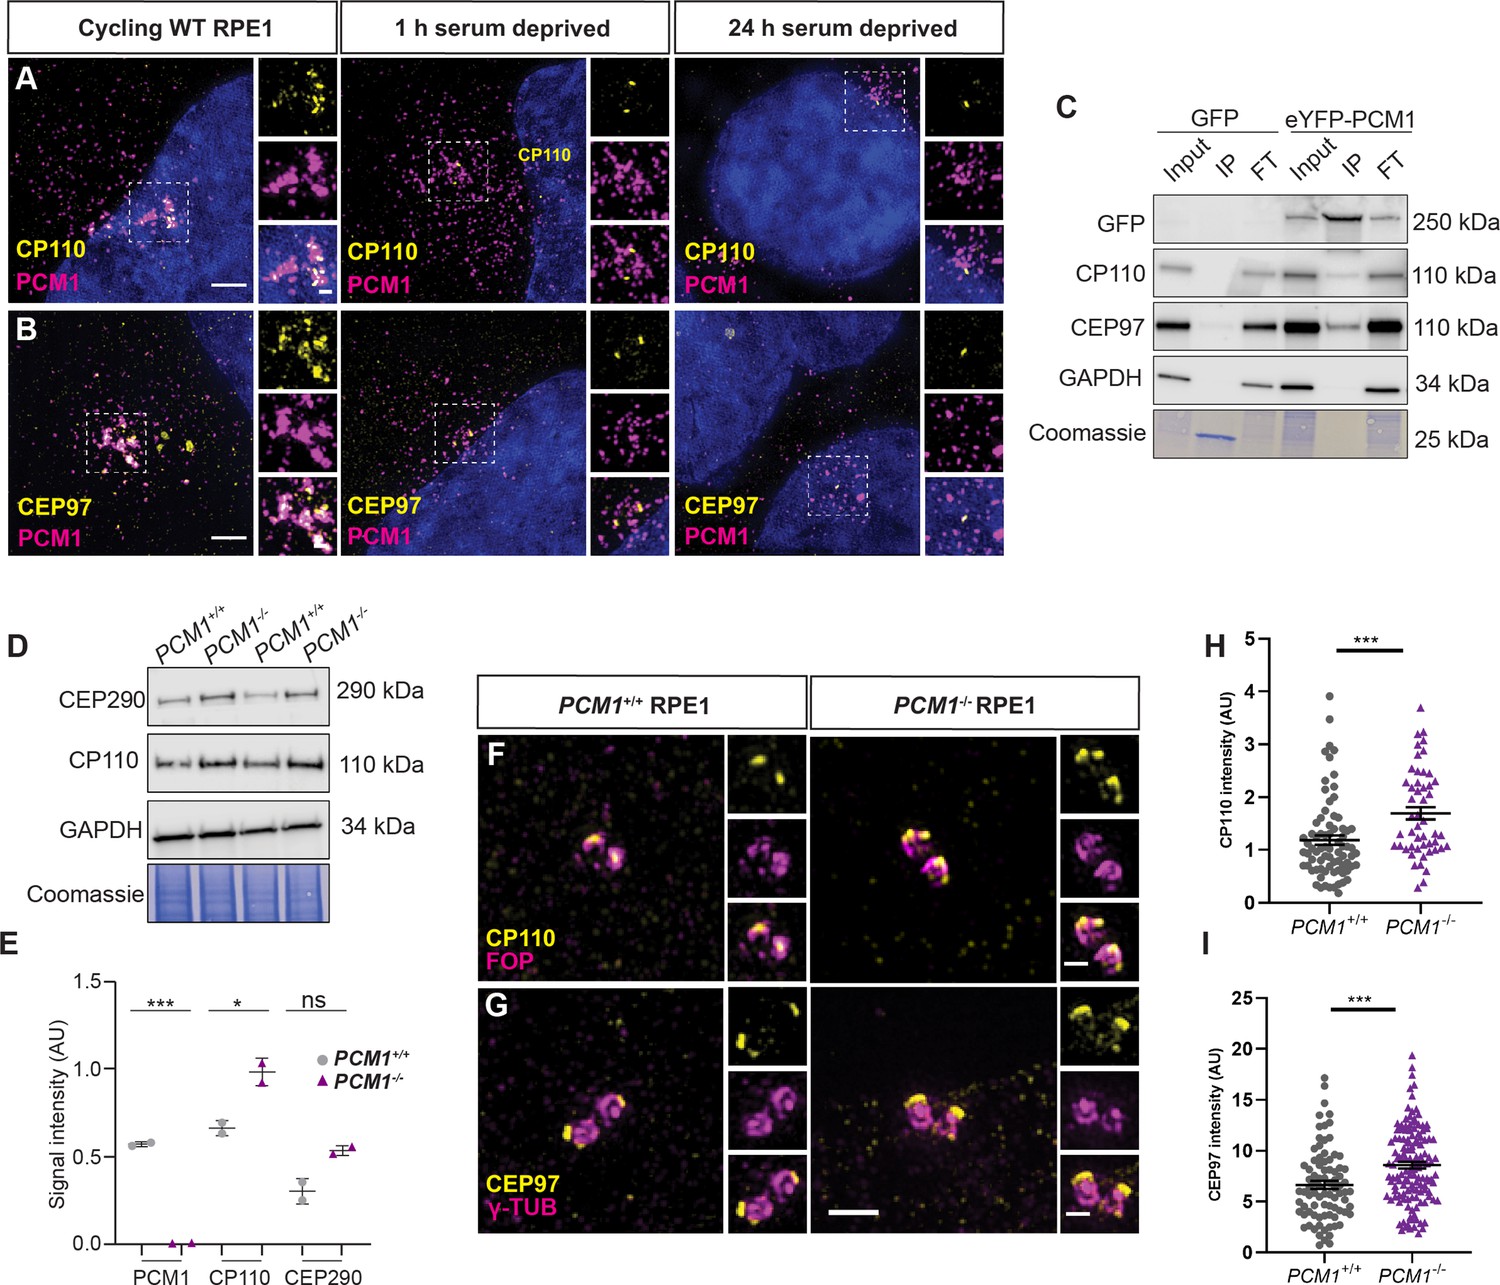
We examined RPE1 cells for CP110 and CEP97 and found that, indeed, CP110 and CEP97 colocalized with PCM1 and CEP290 at centriolar satellites in cycling cells (Figure 8A, B, Figure 8—figure supplement 1A, C). Moreover, this satellite pool of CP110 was absent in PCM1−/− RPE cells (Figure 8—figure supplement 1B). Consistent with CP110 and CEP97 co-localizing with PCM1 at centriolar satellites, CP110 and CEP97 co-immunoprecipitated with PCM1 in cycling cells (Figure 8C).
Figure 8 with 1 supplement see all
PCM1 restricts CP110 and CEP97 localization to distal mother centrioles.
(A) Wild-type and PCM1−/− RPE1 cells immunostained for CP110 (yellow), centriolar satellites (PCM1, magenta), and nuclei (DAPI, blue) in cells with serum (cycling) or 1 or 24 hr after withdrawing serum. (B) Immunostaining for CEP97 (yellow), centriolar satellites (PCM1, magenta), and nuclei (DAPI, blue). (C) Total cell lysates of PCM1−/− RPE1 cell lines stably expressing eGFP or eYFP-PCM1 subjected to immunoprecipitation with anti-GFP. Precipitating proteins were immunoblotted for GFP, CP110, CEP97, and GAPDH. IP: eluate. FT: flow through. (D) Immunoblot of wild-type and PCM1−/− RPE1 cell lines lysates for CP110 and GAPDH, as well as Coomassie stain of gels. Cells were deprived of serum for 24 hr prior to lysis. (E) Quantification of PCM1 and CP110 levels from immunoblots. Bar graphs show means ± SEM from 2 experiments. (F) Wild-type and PCM1−/− RPE1 cells immunostained for CP110 (yellow) and centrioles (FOP, magenta). Cycling cells were treated with nocodazole to disperse the centriolar satellite pool of CP110, leaving the centriolar pool. (G) Immunostaining for CEP97 (yellow) and centrioles (γ-TUB, magenta) in cycling cells treated with nocodazole. (H) Quantification of CP110 levels at centrioles stained as in F. (I) Quantification of CEP97 levels at centrioles stained as in G. Scale bars: 1 and 0.5 μm in main panels and insets, respectively. Bar graphs show means ± SEM and n>30 cells from 2 experiments. Student’s t-test: *p < 0.05, ***p < 0.001, ns, not significant.
-
Figure 8—source data 1
Full uncropped immunoblots for Figure 8C, I and Figure 8—figure supplement 1E, labeled and unlabeled.
- https://cdn.elifesciences.org/articles/79299/elife-79299-fig8-data1-v2.pdf
By examining RPE1 cells at different timepoints after serum depletion, we observed that the localization of CP110 and CEP97 to centrioles and centriolar satellites was dynamic: 1 hr after initiating ciliogenesis, CP110 and CEP97 at satellites decreased and, by 24 hr of serum depletion, CP110 and CEP97 were absent from the mother centriole (Figure 8A, B).
CP110 interacts with satellite protein CEP290 (Tsang et al., 2008), so we hypothesized that CEP290 may hold CP110 at the satellites. Consistent with this model, CP110 no longer localized to satellites in cycling RPE1 cells upon CEP290 knockdown (Figure 8—figure supplement 1D). We propose that CP110 and CEP97 are centriolar satellite cargos which are wicked away from mother centrioles by centriolar satellites during early ciliogenesis.
If centriolar satellites transport CP110 and CEP97 away from centrioles as an early step in ciliogenesis, PCM1 may be critical for CP110 turnover. We therefore assessed total CP110 and CEP290 protein levels by immunoblot. In serum-starved PCM1−/− RPE1 cells, both CEP290 and CP110 were modestly elevated relative to serum-starved control cells (Figure 8D, E). Similarly, in synchronized RPE1 cells, CP110 levels were increased in the absence of PCM1, most markedly during mitosis and G0 (Figure 8—figure supplement 1E).
Where does this overabundant CP110 and CEP97 accumulate? Using immunofluorescence microscopy of cycling cells treated with nocodazole, we examined the localization of CP110 and CEP97 to centrioles. In the absence of PCM1, CP110, and CEP97 over-accumulated at both centrioles (Figure 8F–I), suggesting that centriolar satellites restrict CP110 and CEP97 accumulation at centrioles.
We conclude that centriolar satellites restrict CP110 and CEP97 levels at centrioles, the removal of which promotes ciliogenesis in specific cell types. Centriolar satellites help promote timely ciliary vesicle formation and remove CP110 and CEP97 from the mother centriole, enabling recruitment of IFT and construction of the transition zone, early steps in ciliogenesis important for the prevention of ciliopathy-associated phenotypes such as hydrocephaly (Figure 9).
Figure 9
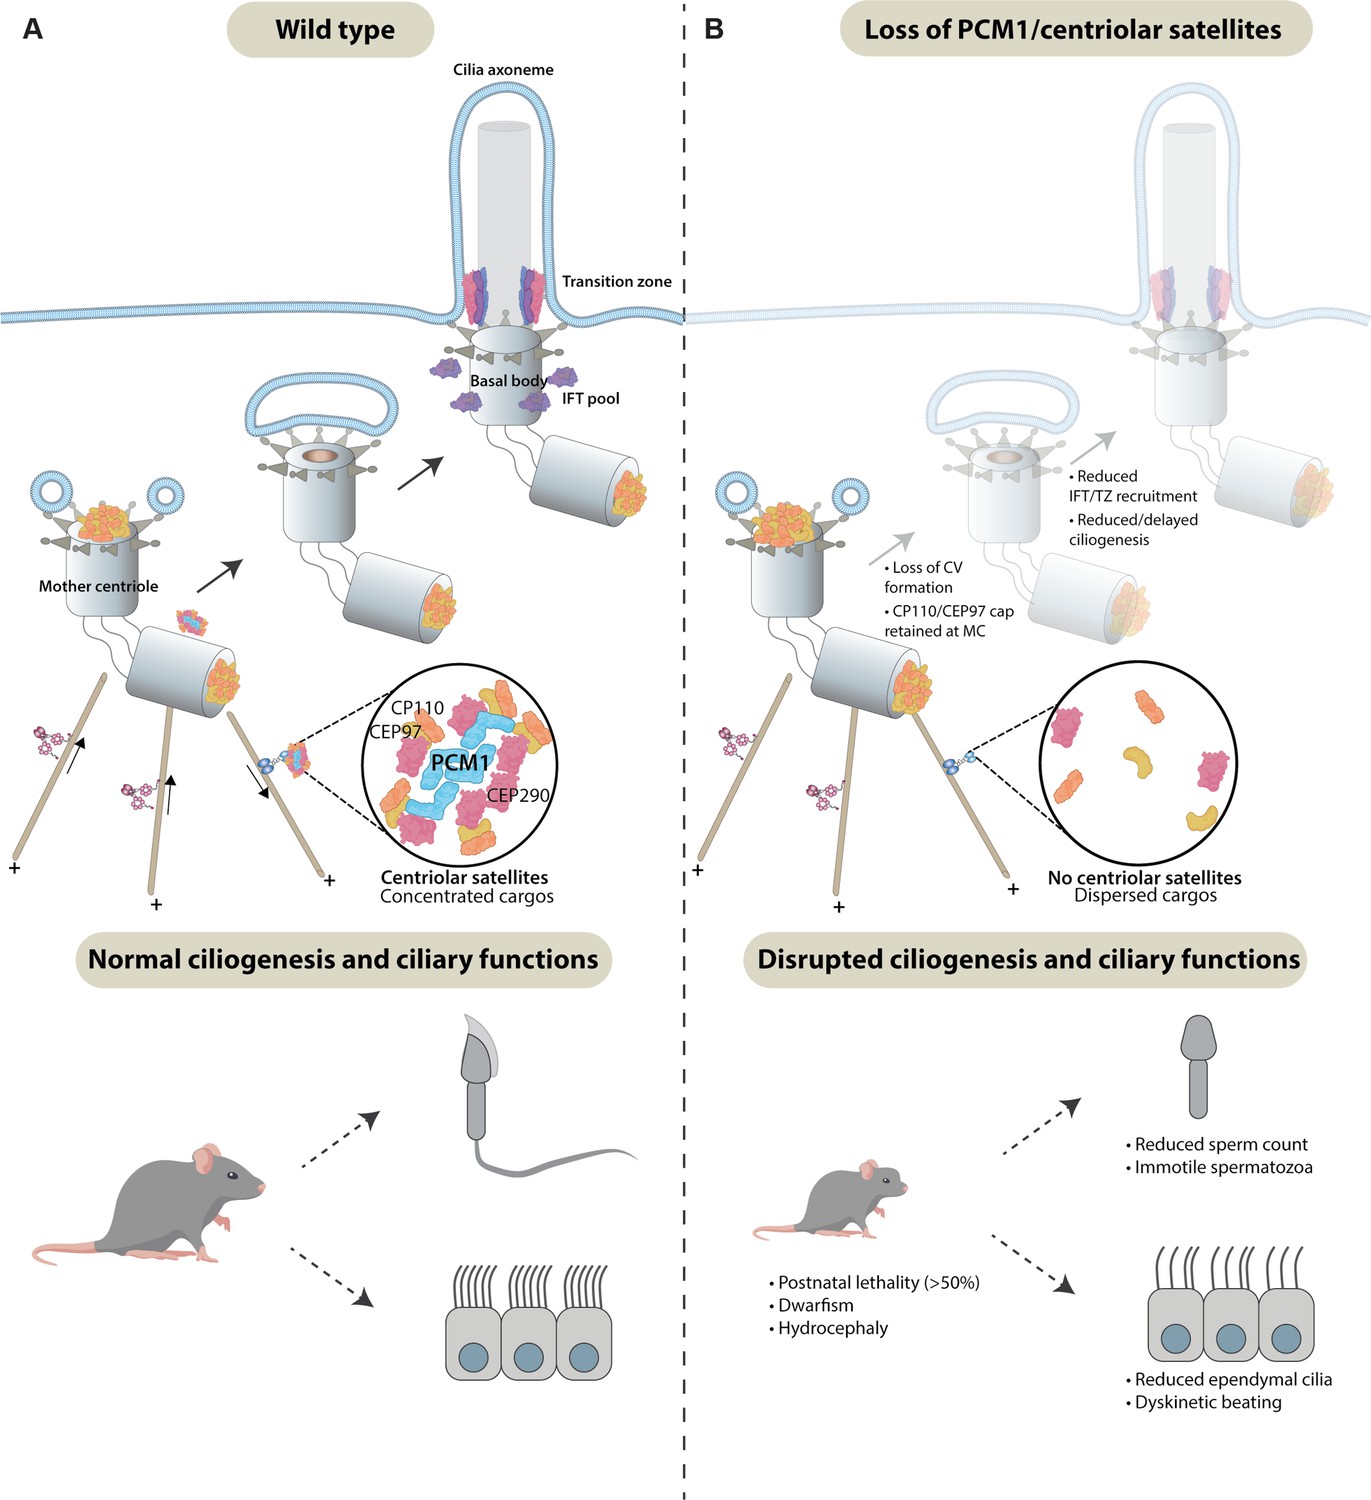
Centriolar satellites remodel centrioles to promote ciliogenesis.
(A) PCM1 (cyan) scaffolds centriolar satellites, dynamic and heterogeneous condensates of centriolar proteins. During ciliogenesis, we propose that centriolar satellites remove, or wick away, CP110 and CEP97 from the mother centriole. Departure of CP110 and CEP97 is important for subsequent steps in ciliogenesis, including centriolar vesicle formation, transition zone formation, and IFT recruitment. (B) In the absence of PCM1 and centriolar satellites, CP110 and CEP97 are not efficiently removed during ciliogenesis, disrupting subsequent steps, impeding ciliogenesis in a cell-type-specific way and leading to hydrocephaly and other ciliopathy-associated phenotypes.
Discussion
PCM1 performs select ciliogenic functions in vivo
Cilia are essential for key events in mammalian development; mice lacking cilia die during embryogenesis with developmental defects including randomized left–right axes and polydactyly (Ferrante et al., 2006; Huangfu et al., 2003). Many E18.5 Pcm1−/− tissues possessed cilia and Pcm1−/− mice survived at Mendelian ratios to birth and displayed no evidence of situs abnormalities or polydactyly, revealing that centriolar satellites are not required for mammalian ciliogenesis in many cell types.
Despite PCM1 being dispensable for ciliogenesis in many tissues, most Pcm1−/− mice died perinatally with hydrocephaly, delayed formation and disrupted function of ependymal cilia, oligospermia, and abnormalities in tracheal epithelial cell ciliogenesis. In addition, Pcm1−/− mice exhibited cerebellar hypoplasia and partially penetrant hydronephrosis, both of which can be caused by defective Hedgehog signaling, a signal transduction pathway dependent on cilia (Huangfu et al., 2003; Spassky et al., 2008; Wallace, 1999; Wechsler-Reya and Scott, 1999; Yu et al., 2002). These phenotypes indicate that PCM1 promotes ciliogenesis in select cell types, many of which possess motile cilia.
Recently, a mouse Pcm1 gene trap was described (Monroe et al., 2020). Aged mice homozygous for this allele exhibited enlarged brain ventricles, progressive neuronal cilia maintenance defects and late-onset behavioral changes, but not perinatal lethality or other early cilia-associated phenotypes. While background differences may influence penetrance and expressivity, it is possible that the absence of reported hydrocephaly and other ciliopathy-related phenotypes indicates that the Pcm1 gene trap allele is hypomorphic.
Most human ciliopathies affect select tissues (Reiter and Leroux, 2017). For many ciliopathies, it remains unclear why tissues are differentially sensitive to ciliary defects. As mammalian PCM1 is particularly required for cilia function in ependymal cells and sperm, differential requirements for centriolar satellite function may be one determinant of tissue specificity in human ciliopathies.
PCM1 and centriolar satellites promote centriole amplification in ependymal cells
In almost all cells, centriole duplication is tightly restricted to make only two new centrioles per cell cycle (Nigg and Holland, 2018). In marked contrast, multiciliated cells produce tens to hundreds of centrioles. This centriole amplification has been proposed to occur by two mechanisms: (1) generation of new centrioles in proximity to the parental centrioles and (2) generation via deuterosomes, electron dense structures unique to multiciliated cells (Mercey et al., 2019b; Nanjundappa et al., 2019; Zhao et al., 2013; Zhao et al., 2019). However, centriole amplification and multiciliogenesis are not blocked in the absence of deuterosomes or parental centrioles (Mercey et al., 2019a; Mercey et al., 2019b; Zhao et al., 2019), indicating that a third mechanism of centriole biogenesis exists.
A previous study demonstrated that knockdown of Pcm1 in cultured mouse ependymal cells did not affect centriole number, but did alter ciliary structure (Zhao et al., 2021). We found that, in the absence of PCM1, ependymal cells displayed retarded centriole amplification and multiciliogenesis, as well as hydrocephaly. Our data indicate that PCM1, unlike deuterosomes, is critical for timely centriole amplification in ependymal cells. We propose that PCM1 is key to this previously postulated third mechanism of centriole amplification.
Ependymal cells lacking PCM1 also displayed disorganized beat patterns with disrupted basal body translational polarity. In contrast, tracheal multiciliated cells, which do not undergo clear planar polarization of basal body position, displayed normal beating in the absence of PCM1. We speculate that the role of PCM1 in basal body polarization could underlie its unique requirement for beat pattern in ependymal cells. Perhaps the involvement of PCM1 in ependymal cell basal body polarization explains the presence of hydrocephaly in Pcm1−/− mice with no gross effect on airway mucus clearance.
Pcm1−/− ependymal cells also generated extremely long (3–7 μm) centriole-like structures containing FOP and Centrin2. These centriole-related structures were present within the cytoplasm, distant from the apical domain where basal bodies nucleate cilia, and are reminiscent of elongated centrioles caused by depletion of CP110 (Spektor et al., 2007). One possibility is that the mechanisms by which CP110 and PCM1 restrain elongation are distinct. Alternatively, in multiciliated ependymal cells, the increased CP110 at many basal bodies may deplete the available pool of free CP110, causing a minority of basal bodies to be depleted of CP110 and thereby elongate abnormally.
Consistent with prior observations by Zhao et al., 2021, Pcm1−/− tracheal and ependymal multiciliated cells showed altered fibrogranular material, intracellular networks to which many centriolar proteins localize. Interestingly, PCM1 loss affects fibrogranular material differently in ependymal cells and multiciliated tracheal cells: in Pcm1−/− mTECs, the fibrogranular material pool of CEP131 is absent and CEP131 accumulates at the basal bodies, whereas in Pcm1−/− ependymal cells, the fibrogranular material pool of CEP131 persists, but is altered, displaying a more fibrous organization. It is possible that by altering the fibrogranular material, the loss of PCM1 alters the distribution and function of centriolar proteins, resulting in delayed centriole biogenesis and the generation of long centriole-related structures.
Centriolar satellites promote the timely removal of CP110 and CEP97 to support ciliogenesis
Our work indicates that PCM1 and centriolar satellites help control the composition of centrioles. We found that in diverse cell types, including MEFs, RPE1, ependymal and tracheal cells, PCM1 promotes the removal of CP110 from distal mother centrioles, an early step in ciliogenesis. Similarly, PCM1 restricts levels of CEP131, CEP290, and CEP97 at centrioles. Recent work showed that Pcm1 knockdown in ependymal cells also increased CEP135 and CEP120 localization to basal bodies (Zhao et al., 2021). Thus, centriolar satellites restrict the centriolar accumulation of multiple proteins.
A previous study proposed a role for PCM1 in protecting Talpid3 from degradation by sequestering the E3 ligase, MIB1 away from the centrioles (Wang et al., 2016). We found that, in the absence of PCM1, MIB1 no longer localizes to centrioles and Talpid3 levels on PCM1−/− centrioles were comparable to control centrioles, suggesting that PCM1 is not a critical determinant of centriolar Talpid3 levels. Talpid3 is required for distal appendage assembly and removal of daughter centriole proteins (e.g., Centrobin) from mother centrioles (Wang et al., 2018). We found that PCM1 is dispensable for distal appendage assembly and removal of Centrobin from the mother centrioles, further suggesting that PCM1 and centriolar satellites are not required for Talpid3-dependent functions. Thus, centriolar satellites limit the centriolar localization of some, but not all, centriole components.
In the absence of PCM1, total cellular CP110 levels are increased and CP110 and CEP97 levels are elevated at centrioles, indicating a role for centriolar satellites in CP110 degradation. As CP110 and CEP97 transiently localized at satellites, we propose that satellites transport CP110 and CEP97 away from centrioles for degradation. Alternately, satellites could deliver proteins that degrade CP110 and CEP97 to the mother centriole. Such proteins could include UBR5, an E3 ubiquitin ligase that ubiqutinylates CP110, the linear ubiquitin chain assembly complex (LUBAC) that also ubiqutinylates CP110, or PRPF8, which removes ubiquitinylated CP110 from centrioles (Gonçalves et al., 2021; Hossain et al., 2017; Shen et al., 2022). As centriolar satellite composition and distribution can change in response to environmental cues and stressors (Joachim et al., 2017; Prosser et al., 2022; Tollenaere et al., 2015; Villumsen et al., 2013), satellites likely help remove centriolar proteins beyond CP110 and CEP97.
The transient localization of CP110 to centriolar satellites is dependent on its interactor, CEP290. As inhibition of ciliogenesis by CP110 is dependent on CEP290 (Tsang et al., 2008), we suggest that one function for CEP290 may be to recruit CP110 to satellites for removal from mother centrioles.
In vertebrates, CP110 is required for docking of the mother centriole to preciliary vesicles (Walentek et al., 2016; Yadav et al., 2016) and is removed from the mother centriole subsequent to docking, suggesting that CP110 has both positive and inhibitory roles in ciliogenesis (Lu et al., 2015). Our finding that PCM1 promotes both CP110 removal and vesicular docking of the mother centriole suggests that centriolar satellites are involved in both intimately connected processes. One possibility is that centriolar satellites promote preciliary vesicle formation via transporting CP110 away from the mother centriole. This possibility is supported by data indicating that WDR8, another centriolar and centriolar satellite component, also contributes to CP110 removal from mother centrioles and ciliary vesicle formation (Kurtulmus et al., 2016). However, centriolar satellites may contribute to preciliary vesicle docking through mechanisms independent of CP110 removal. For example, although PCM1 is dispensable for distal appendage formation, the subtle changes in some distal appendage component localization in PCM1−/− cells could alter distal appendage composition or conformation in ways that compromise preciliary vesicle docking.
Interestingly, despite centriolar satellites promoting removal of CP110 from MEF mother centrioles, they are dispensable for ciliogenesis in MEFs. Therefore, removal of all CP110 from mother centrioles is not a precondition for ciliogenesis in some cell types. Multiple roles for CP110, both promoting and inhibiting ciliogenesis, have previously been described (Gonçalves et al., 2021; Spektor et al., 2007; Walentek et al., 2016; Yadav et al., 2016). One possible explanation for the cell-type specificity of PCM1 function is that centriolar satellites remove CP110 from mother centrioles in all cell types, but different thresholds of CP110 reduction are required to initiate ciliogenesis in different cell types. Thus, unlike core centriolar proteins, some of which are trafficked via centriolar satellites, centriolar satellites themselves are not essential for all centriole- and cilium-dependent events in many mammalian cell types.
These cell-type-specific differences may reflect differences in how centrioles must be remodeled to effect duplication or ciliogenesis. Perhaps centriolar satellite-mediated CP110 removal from mother centrioles is especially important for cells, like many epithelial cells, in which basal bodies dock directly to the plasma membrane, rather than to a ciliary vesicle. In the crowded environment at the heart of the centrosome, diffusion may be insufficient for the timely delivery and removal of centriolar proteins. PCM1 and centriolar satellites promote centriole amplification and ciliogenesis by coupling assembly and/or degradation of centriolar components in the satellites to their active transport to and from centrioles on microtubules.
Materials and methods
Generation of mouse models
Request a detailed protocolAnimals were maintained in SPF environment and studies carried out in accordance with the guidance issued by the Medical Research Council in ‘Responsibility in the Use of Animals in Medical Research’ (July 1993) and licensed by the Home Office under the Animals (Scientific Procedures) Act 1986 under project license number P18921CDE in facilities at the University of Edinburgh (PEL 60/6025). Pcm1 null mice (Pcm1∆5-14/∆5-14: Pcm1em1Pmi MGI:6865681 and Pcm1∆796-800/∆796-800: Pcm1em2Pmi MGI:6865682) were generated using CRISPR/Cas9 as described in Figure 1—figure supplement 1, using guides detailed in Supplementary file 1. Genotyping was performed using primers detailed in Supplementary file 2 followed by Sanger sequencing (for Pcm1∆5-14/∆5-14) or digestion with DdeI (for Pcm1∆796-800/∆796-800), or alternately genotyping was performed by Transnetyx. Pcm1SNAP animals were generated with CRISPR Cas9 targeting first coding exon 2 (Supplementary file 1) and a SNAP tag was inserted after the ATG, followed by a GSGG linker, using a repair template with 700 nt homology arms, detailed in Supplementary file 1, resulting in a gene encoding N-terminally SNAP tagged PCM1 in the endogenous locus. Genotyping was performed using primers detailed in Supplementary file 2 or alternately by Transnetyx.
Mouse gait analysis
Request a detailed protocolGait analysis was performed on a Catwalk XT according to manufacturer’s instructions. Briefly, mice were habituated to the Catwalk for 5 min, and then the glass was cleaned prior to acquisition. Each mouse (n > 4 per experimental group) was then allowed to perform at least 3 runs across the Catwalk, which records paw position and analyses gait patterns using the Catwalk XT 10.6 Acquisition and Analysis Software.
Retinal imaging
Request a detailed protocolElectroretinograms and fundal imaging was performed as described in Findlay et al., 2018. PCM1-SNAP retinal labeling was carried out under inhaled anesthesia. 1.5 μl of 0.6 μM SNAP-Cell 647-SiR (New England Biolabs) was injected into the mouse vitreous under direct visualization using a Zeiss operating microscope. After 2 hr, mice were sacrificed by cervical dislocation and eyes enucleated. Keratectomy, sclerectomy and lensectomy were performed and whole retinas isolated. Flat mount petaloid retinal explants were made and mounted, photoreceptor side up, on Menzel_Glaser Superfrost Plus Gold slides (Thermo Fisher Scientific; K5800AMNZ72). Nuclei were stained with DAPI and mounted in Prolong Gold under coverslip. Slices were imaged on an Andor Dragonfly spinning disc confocal.
Cell lines and cell culture
Request a detailed protocolMEFs were maintained as previously published (Hall et al., 2013). SNAP labeling was performed as previously described (Quidwai et al., 2021). Ependymal cells were isolated and cultured as published in Delgehyr et al., 2015. mTECs were isolated and cultured as described in Eenjes et al., 2018; You et al., 2002. RPE1-hTERT (female, human epithelial cells immortalized with hTERT, Cat. No. CRL-4000) from ATCC were grown in Dulbecco's Modified Eagle Medium (DMEM, Life Technologies) or DMEM/F12 (Thermo Fisher Scientific, 10565042) supplemented with 10% fetal bovine serum at 37°C with 5% CO2. For live imaging, the membrane was cut out and placed cilia down on a glass dish (Nest, 801002) in a drop of media. PCM1−/− RPE1 cells were generated as described previously (Kumar et al., 2021) (all figures except for Figure 8—figure supplement 1, in which case they were generated as in Gheiratmand et al., 2019). hTERT-RPE1: Source ATCC, confirmed mycoplasma negative and verified by STR profiling. Two PCM1−/− RPE1 cell lines were generated using single guide RNAs (Supplementary file 1). Loss of PCM1 was confirmed by genotyping, immunoblotting, and immunofluorescence. Monoclonal PCM1−/− RPE1 cell lines stably expressing eGFP or eYFP-PCM1 (plasmid a gift from Bryan Dynlacht; Wang et al., 2016) were generated using lentiviruses and manually selected based on fluorescence. To synchronize cells in G1/S aphidicolin (Sigma) was added to the culture medium at 2 μg/ml for 16 hr. To arrest cells in mitosis, taxol (paclitaxel; Millipore-Sigma) was added to the culture medium at 5 μM for 16 hr prior to rounded up cells being collected by mitotic shake-off. For arrest in G0, cells were washed 2× with phosphate-buffered saline (PBS; Gibco) and 1× with DMEM (without serum) before being cultured in serum-free DMEM for 16 hr. To disrupt cytoplasmic microtubules, cells were treated with 20 μM nocodozole (Sigma, SML1665) for 1–2 hr prior to fixation.
RNA-mediated interference
Request a detailed protocolhTERT RPE-1 cells were transfected with 20 nM (final concentration) of the respective siRNA for 48 hr using Lipofectamine RNAiMAX (Invitrogen) according to the manufacturer’s instructions. Effective knockdown was confirmed by immunofluorescence microscopy. Details of individual siRNAs are provided in the Supplementary file 1.
Proteomics
Request a detailed protocolmTECs were lysed in 0.1% sodium dodecyl sulfate (SDS) in PBS plus 1× HALT protease inhibitor (Thermo Fisher Scientific, 78443), then processed by a multi-protease FASP protocol as described (Wiśniewski and Mann, 2012). In brief, SDS was removed and proteins were first digested with Lys-C (Wako) and subsequently with Trypsin (Promega) with an enzyme to protein ratio (1:50). 10 μg of Lys-C and Trypsin digests were loaded separately and desalted on C18 Stage tip and eluates were analyzed by high-performance liquid chromatography coupled to a Q-Exactive mass spectrometer as described previously (Farrell et al., 2014). Peptides and proteins were identified and quantified with the MaxQuant software package, and label-free quantification was performed by MaxLFQ (Cox et al., 2014). The search included variable modifications for oxidation of methionine, protein N-terminal acetylation, and carbamidomethylation as fixed modification. Peptides with at least seven amino acids were considered for identification. The false discovery rate (FDR), determined by searching a reverse database, was set at 0.01 for both peptides and proteins. All bioinformatic analyses were performed with the Perseus software (Tyanova et al., 2016). Intensity values were log-normalized, 0-values were imputed by a normal distribution 1.8 π down of the mean and with a width of 0.2 π.
Proteomic expression data were analyzed in R (3.6.0) with the Bioconductor package DEP (1.6.1) (Zhang et al., 2018). To aid in the imputation of missing values only those proteins that are identified in all replicates of at least one condition were retained for analysis. The filtered proteomic data were normalized by variance stabilizing transformation. Following normalization, data missing at random, such as proteins quantified in some replicates but not in others, were imputed using the k-nearest neighbour approach. For differential expression analysis between the wild-type and mutant groups, protein-wise linear models combined with empirical Bayes statistics were run using the Bioconductor package limma (3.40.6) (Ritchie et al., 2015). Significantly differentially expressed proteins were defined by an FDR cutoff of 0.05. Total proteomic data are available via ProteomeXchange with identifier PXD031920 and are summarized in Supplementary file 5.
Immunoblotting
Request a detailed protocolTestes were lysed in RIPA buffer (Pierce) plus HALT protease inhibitor (Thermo Fisher Scientific), homogenized with an electronic pestle for 1 min, incubated at 4°C with agitation for 30 min, sonicated for 3 × 30 s, and then clarified at 14,000 × g at 4°C for 20 min. RPE lysates were collected in 2× SDS–polyacrylamide gel electrophoresis (PAGE) buffer and treated with benzonase nuclease (Millipore-Sigma) for 5 min. Samples were loaded into NuPAGE precast gels, transferred onto polyvinylidene fluoride (PVDF) membrane (Amersham Hybond P, Cytiva), and then rinsed in water then TBST, and then blocked in 5% milk in TBS plus 0.1% Tween. Membranes were then incubated overnight at 4°C in primary antibodies (Supplementary file 3) diluted in 5% milk TBST. Membranes were then washed 3 × 10 min TBST, incubated in Horse Radish Peroxidase (HRP)-conjugated secondary antibodies detailed in Supplementary file 4 for 1 hr at room temperature and developed using Pierce SuperSignal Pico Plus (Pierce) or ECL (GE Healthcare) reagent and imaged on ImageQuant.
Co-immunoprecipitation
Request a detailed protocolCo-immunoprecipitation assays and western blots were performed as described previously (Kumar et al., 2021) using GFP trap magnetic agarose beads (Chromotek, gtma-10).
Ventricle and tracheal wholemount
Request a detailed protocolVentricles were dissected according to Mirzadeh et al., 2010a, pre-extracted with 0.1% Triton X in PBS for 1 min, then fixed in 4% paraformaldehyde (PFA) or ice cold methanol for at least 24 h at 4°C, followed by permeabilization in PBST (0.5% Triton X-100) for 20-min room temperature. Tracheas were dissected and cut longitudinally into two, pre-extracted in for 30 s on ice in PEM (0.1 M PIPES (1,4-Piperazinediethanesulfonic acid disodium salt) pH 6.8, 2 mM EGTA (ethylene glycol tetraacetic acid), 1 mM MgSO4) prior to fixing in ice cold methanol on ice for at least 24 hr. Ventricles and tracheas were blocked in 10% donkey serum in TBST (0.1% Triton X) or 4% bovine serum albumin (BSA) in PBST (0.25% Triton X-100) for 1 hr at room temperature, then placed cilia layer down in primary antibodies (Supplementary file 3) in 4% BSA PBST (0.25% Tween-20) or 1% donkey serum in TBST (0.1% Triton X) for at least 12 hr. Ventricles and tracheas were washed in PBS 3 × 10 min and secondaries (Supplementary file 4) in 4% BSA in PBST (0.25% Triton X-100) or 1% donkey serum in TBST (0.1% Triton X) were added at 4°C for at least 12 hr. Ventricles and tracheas were washed in PBS 3 × 10 min, and ventricles were mounted on glass bottom dishes (Nest, 801002) in Vectashield (VectorLabs), immobilized with a cell strainer (Greiner Bio-One, 542040). Tracheas were mounted on slides with Prolong Gold.
Histology
Request a detailed protocolKidneys and brains were fixed in 4% PFA/PBS, testes were fixed in Bouin’s fixative, and eyes and E18.5 embryos were fixed in Davidson’s fixative according to standard protocols. Tissues were serially dehydrated and embedded in paraffin. Microtome sections of 8 µm thickness were examined histologically via haematoxylin and eosin (H&E) or periodic acid-Schiff (PAS) staining.
For immunofluorescent analysis, paraffin sections were dewaxed and re-hydrated via ethanol series, followed by antigen retrieval by boiling the sections for 15 min in the microwave in citrate buffer. Sections were blocked in 10% donkey serum/0.1% Triton X-100 in PBS and primary antibodies were diluted in 1% donkey serum/PBS (Supplementary file 3). Slides were washed and incubated in Alexafluor conjugated secondary antibodies (Supplementary file 4), washed and mounted in ProLong Gold (Thermo Fisher Scientific).
Immunofluorescence
Request a detailed protocolMEFs, mTECs, and cultured ependymal cells were processed for immunofluorescence as published (Hall et al., 2013). Briefly, cells were washed twice with warm PBS, then fixed in either 4% PFA in 1× PHEM (PIPES pH 6.9, HEPES (-2-hydroxyethylpiperazine-N-2-ethane sulfonic acid), EGTA, MgCl2)/PBS 10 min at 37°C, or pre-extracted for 30 s on ice in PEM (0.1 M PIPES pH 6.8, 2 mM EGTA, 1 mM MgSO4) prior to fixing in ice cold methanol on ice for 10 min according to Supplementary file 3, then washed twice with PBS. Cells were permeabilized and blocked with 10% donkey serum in 0.1% Triton X-100/TBS for 60 min at room temperature, or overnight at 4°C. Primary antibodies (Supplementary file 3) were added to samples and incubated for 4°C overnight, in dilutant made of 1% donkey serum in 0.1% Triton X-100/TBS. Samples were washed in 0.1% Triton X-100/TBS 4–6 times, 10 min each. Secondary antibodies (Supplementary file 4) diluted in 1% donkey serum and 0.1% Triton X-100/TBS were added for 60 min at room temperature, in some cases co-stained with AlexaFluor 647 Phalloidin (Thermo Fisher Scientific), added with the secondaries at 1/500 for 1 hr at room temperature. Samples were washed with 0.1% Triton X-100/TBS 4–6 times 10 min, stained with DAPI (1:1000) in 0.1% Triton X-100/TBS for 5 min at room temperature, and mounted using ProLong Gold antifade (Thermo Fisher Scientific), according to the manufacturer’s instructions.
RPE1 cells were fixed with 100% cold methanol for 3 min and incubated in blocking buffer (2.5% BSA, 0.1% Triton X-100 in PBS) for 1 hr at room temperature (except in Figure 8—figure supplement 1 where they were fixed in ice cold methanol for 10 min and incubated in 2% BSA in PBS for 10 min at room temperature). Coverslips were then incubated in primary antibodies (Supplementary file 3) in blocking buffer overnight at 4°C or room temperature for 50 min, washed three times with PBS and incubated with secondary antibodies (Supplementary file 4) in blocking buffer for 1 hr at room temperature along with Hoechst 33352 or DAPI (0.1 μg/ml). Coverslips were washed three times with PBS and mounted with Prolong Diamond (Thermo Fisher Scientific P36961) or ProLong Gold Antifade (Molecular Probes). For TTBK2 staining, cells were fixed with 4% PFA/PBS for 10 min in general tubulin buffer (80 mM PIPES, pH 7, 1 mM MgCl2, and 1 mM EGTA), permeabilized with 0.1% TX-100 and stained as described above (Loukil et al., 2017).
Sperm preparation
Request a detailed protocolCauda and caput epididymides were dissected into M2 media (Thermo Fisher Scientific). For live imaging, sperm were imaged in M2 media or 1% methyl cellulose (Sigma), in capillary tubes (Vitrotubes Mountain Leaks) sealed with Cristaseal (Hawskley). Sperm counts were performed on sperm from the cauda epididymides, diluted in H2O using a haemocytometer, only counting intact sperm (with both head and tail).
Transmission electron microscopy
Request a detailed protocolSamples were dissected into PBS. Samples were fixed in 2% PFA/2.5% glutaraldehyde/0.1 M sodium cacodylate buffer pH 7.4 (Electron Microscopy Sciences). Lateral ventricle walls were fixed for 18 hr at 4°C then subdissected into anterior, mid, and posterior sections. Tissue was rinsed in 0.1 M sodium cacodylate buffer, post-fixed in 1% OsO4 (Agar Scientific) for 1 hr and dehydrated in sequential steps of acetone prior to impregnation in increasing concentrations of resin (TAAB Lab Equipment) in acetone followed by 100%, placed in moulds and polymerized at 60°C for 24 hr.
Ultrathin sections of 70 nm were subsequently cut using a diamond knife on a Leica EM UC7 ultramicrotome. Sections were stretched with chloroform to eliminate compression and mounted on Pioloform filmed copper grids prior to staining with 1% aqueous uranyl acetate and lead citrate (Leica). They were viewed on a Philips CM100 Compustage Transmission Electron Microscope with images collected using an AMT CCD camera (Deben).
RPE1 cells processed for TEM analysis were cultured on Permanox slides (Nunc 177445), serum starved for 1 hr and processed as described previously (Kumar et al., 2021).
Imaging
Request a detailed protocolBrightfield images in Figure 2 and Figure 2—figure supplement 1 were imaged on a Hamumatsu Nanozoomer XR with ×20 and ×40 objectives. Macroscope images in Figure 1 and Figure 2 were imaged on a Nikon AZ100 Macroscope. Figure 1—figure supplement 3 was imaged on Leica Stellaris DMI8 equiped with 4 (HyD X/HyD S) GaSP detectors with ×40 or ×60 oil objectives. Fluorescent images in Figure 2, Figure 3A, Figure 3—figure supplement 1A, B, Figure 3—figure supplement 2A, Figure 3—figure supplement 3, and Figure 7—figure supplement 1 were taken on a Nikon A1+Confocal with Oil 60 or ×100 objectives with 405, Argon 561 and 640 lasers and GaSP detectors. Fluorescent images in Figure 1, Figure 2—figure supplement 1D, Figure 4D, E, K, Figure 4—figure supplement 1, and Figure 6—figure supplement 1 were taken with Andor Dragonfly and Mosaic Spinning Disc confocal. Images in Figure 3B, O, Figure 3—figure supplement 1C, H, I, Figure 3—figure supplement 2C–E, and Figure 6E, F were taken with Nikon SORA with 405 nm 120 mW, 488 nm 200 mW, and 561 nm 150 mW lasers, ×100 1.35 NA Si Apochromat objective and a Photometrics Prime 95B 11 mm pixel camera. High-speed video microscopy was performed on a Nikon Ti microscope with a ×60 Nikon Plan Apo VC ×60/1.20 water immersion objective, and Prime BSI, A19B204007 camera, imaged at 250 fps. 3D-SIM imaging in Figure 4B, C, H, Figure 5, Figure 5—figure supplement 1, Figure 6A, B, Figure 7, and Figure 8 was performed using the GE Healthcare DeltaVision OMX-SR microscope equipped with the ×60/1.42 NA oil-immersion objective and three cMOS cameras. Immersion oil with refractive index of 1.518 was used for most experiments, and z stacks of 5–6 µm were collected every 0.125 µm. Images were reconstructed using GE Healthcare SoftWorx 6.5.2 using default parameters. Images for quantifications were collected at the widefield setting using the same microscope. Figure 8—figure supplement 1 was imaged using a DeltaVision Elite high-resolution imaging system equipped with a sCMOS 2048x2048 pixel camera (GE Healthcare). Z-stacks (0.2 μm step) were collected using a ×60 1.42 NA plan apochromat oil-immersion objective (Olympus) and deconvolved using softWoRx (v6.0, GE Healthcare).
Image analysis
Request a detailed protocolImage analysis was performed in NIS Elements, FIJI (Schindelin et al., 2012), QuPath (Bankhead et al., 2017), CellProfiler (Stirling et al., 2021), or Imaris. All analysis tools have been made available on GitHub (https://github.com/IGC-Advanced-Imaging-Resource/Hall2022_Paper; Murphy, 2022). Cerebellum and ventricle area was measured from PAS stained sagittal brain sections in QuPath. The number of cilia in E18.5 ribs was calculated using Batch Pipeline in Imaris, segmenting DAPI and cilia as surfaces. The number of ependymal cells with multiple basal bodies was calculated by segmenting FOP staining and cells in 2D using a CellProfiler pipeline. Briefly, an IdentifyPrimaryObjects module was used to detect the nuclei, followed by an IdentifySecondaryObjects module using the tubulin stain to detect the cell boundaries. Another Identify Primary objects module was used to detect the basal bodies and a RelateObjects module was used to assign parent–child relationships between the cells and basal bodies. The percentage of ciliated ependymal cells, and the number of ependymal cells with rosette-like FOP staining, and elongated FOP-positive structures were counted by eye using NIS Elements Counts Tool. Analysis of cultured ependymal cells (beat frequency, number of cilia, coordinated beat pattern) and beat frequency determination in mTECs and trachea was assessed in FIJI by eye while blinded to genotype. The number of centrioles and cilia in cultured ependymal cells was manually calculated using Imaris. CEP131 and MIB1 intensity at satellites was calculated in FIJI using a macro which segmented basal bodies with Gamma Tubulin, then drew concentric rings, each 0.5 μm wider than the previous and calculated the intensity of MIB1 and CEP131 within these rings. CP110 intensity in MEFs was calculated by manually defining mother and daughter centrioles in FIJI, CP110 intensity in ependyma and tracheas was calculated by segmenting FOP in 3D in Imaris and calculating CP110 intensity within this volume. Image quantification in RPE1 cells were performed using CellProfiler as described previously (Kumar et al., 2021). Images were prepared for publication using FIJI, Imaris, Adobe Photoshop, Illustrator, and InDesign.
Data analysis
Request a detailed protocolData analysis was carried out in Microsoft Excel, GraphPad Prism 6/9, and Matlab. Statistical tests are described in the figure legends.
Appendix 1
Appendix 1—key resources table
| Reagent type (species) or resource | Designation | Source or reference | Identifiers | Additional information |
|---|---|---|---|---|
| Genetic reagent (M. musculus) | Pcm1∆5-14Pcm1em1Pmi MGI:6865681 | This paper | Allele symbol: Pcm1em1Pmi Allele synonym: Pcm1∆5-14; Accession ID: MGI:6865681 | |
| Genetic reagent (M. musculus) | Pcm1∆796-800Pcm1em2Pmi MGI:6865682 | This paper | Allele symbol: Pcm1em2Pmi Allele synonym: Pcm1∆796-800; Accession ID: MGI:6865681 | |
| Genetic reagent (M. musculus) | Pcm1SNAPPcm1em3Pmi MGI:6865681 | This paper | Allele symbol: Pcm1em3Pmi Allele synonym: Pcm1SNAP; Accession ID: MGI:6865681 | |
| Biological sample (M. musculus) | Mouse embryonic fibroblasts (MEFs) | This paper | N/A | |
| Biological sample (M. musculus) | Mouse tracheal epithelial cells (mTECs) | This paper | N/A | See Vladar and Brody, 2013 for protocol. |
| Biological sample (M. musculus) | PCM1−/− RPE 1 | Kumar et al., 2021 | All Figures except Figure 8—figure supplement 1 | |
| Biological sample (M. musculus) | PCM1−/− RPE 1 | Gheiratmand et al., 2019 | In Figure 8—figure supplement 1 | |
| Sequence-based reagent | Pcm1 Exon 2 | Dharmacon | 5′-ATTAAAGGCAACATGGCCAC-3′ | RISPR guide for generation of Pcm15-14 and Pcm1SNAP mouse |
| Sequence-based reagent | Pcm1 Exon 6 | Dharmacon | 5′-TCAGGCCAGAGATCCTCAGC-3′ | CRISPR guide for generation of Pcm1 796–800 mouse |
| Sequence-based reagent | SNAP repair | IDT | 5′- aaaaataattctgaagccaaaaaccgctgcaaggaggatttatgagtttggcagacttcagggagattgacacaacactatgagagacagtaagcactcattgaaatgtgtttagtgcatttgttctgttttatttggaacaaactttattttaaatagcttactataagctcaggctggtctagaacacctgattctcatacttacctcctagtactgcgattataagcatgtgctaccatctccattatataatgtgtatatcatgtagatcaatttatctgtgatacgtgtttgatagtgtattcttttatatttttggttgtgagcctagcctttaacagctgagccatctctccagctcgatagtgtattctttaagataagtgtttgaaagattcctttatattaataagtttgatagaatgctttaaaatctgaagatggttcagcatatgaaagtgcttgccatacaaacctgatgacctcagatcacacagtggcaggagagaactgactccagatagttgctctgacctctgcacacatgctatggtacatacatgtctgcacttacatacaaaaacatgcatatacacaatataattattagtacattttataataaaataaagtttgtctttctgtgttaaaaattaatttttacttattttgcagAGAATTAATTAAAGGCAACATGGACAAAGACTGCGAAATGAAGCGCACCACCCTGGATAGCCCTCTGGGCAAGCTGGAACTGTCTGGGTGCGAACAGGGCCTGCACCGTATCATCTTCCTGGGCAAAGGAACATCTGCCGCCGACGCCGTGGAAGTGCCTGCCCCAGCCGCCGTGCTGGGCGGACCAGAGCCACTGATGCAGGCCACCGCCTGGCTCAACGCCTACTTTCACCAGCCTGAGGCCATCGAGGAGTTCCCTGTGCCAGCCCTGCACCACCCAGTGTTCCAGCAGGAGAGCTTTACCCGCCAGGTGCTGTGGAAACTGCTGAAAGTGGTGAAGTTCGGAGAGGTCATCAGCTACAGCCACCTGGCCGCCCTGGCCGGCAATCCCGCCGCCACCGCCGCCGTGAAAACCGCCCTGAGCGGAAATCCCGTGCCCATTCTGATCCCCTGCCACCGGGTGGTGCAGGGCGACCTGGACGTGGGGGGCTACGAGGGCGGGCTCGCCGTGAAAGAGTGGCTGCTGGCCCACGAGGGCCACAGACTGGGCAAGCCTGGGCTGGGTGGCGGAAGCGGAGCCACAGGAGGAGGTCCTTTTGAAGAAGTCATGCATGATCAGGACTTACCAAACTGGAGCAATGACAGTGTGGATGACCGACTCAACAATATGGTATGATGTTttactctgggtggtatattgttgaccactaatgttcagtgaggctctcccatcgattgtatttactgaaactctgtaaaaactgtaggcagatagactaagggactcttggttgaagacactttagctgtagttaatagaaagcatgaattagcttaaacaaaaaatgatttattaaaaggaggtgaaagtgctttatggaagccatgttaaagagtatagctcagttttaggaaaggaaaaagaaacagcagagttgttcgaaattgcttttcacctctgtgcctgtgcttctaagaccttttccctaaccgagctttcccttctagatctgccttctttctctctctgctttgtgtcatatattgagatggcctttttaaagatttgcagccatggaggaacttatataatgactaatttaacattatgattatctagctaaatttgtttagatctccttttttcacttatcaggatcatgaaagggatgaattaaataatataaaaggttcacaggactacccatacatggaacagttcctcgaggggcaaaatttcctagaagtgatgacagtactaagcagttttattatag- 3′ | Repair template for generation of Pcm1SNAP mouse |
| Sequence-based reagent | PCM1 Exon 3 | Synthego | 5′-GAAAAGAAUAAGAAAAAGUU-3′ | CRISPR guide for generation of PCM1−/− RPE cells |
| Sequence-based reagent | PCM1 Exon 3 | Synthego | 5′-CGACUCCGGAGAAAUAUCA-3′ | CRISPR guide for generation of PCM1−/− RPE cells |
| Sequence-based reagent | Luciferase GL2 Duplex siRNA | Dharmacon | 5′-CGUACGCGGAAUACUUCGA-3′ | Control siRNA |
| Sequence-based reagent | CEP290 ID: s37024 Silencer Select siRNA | Ambion/Thermo Fisher | 5′-GAUACUCGGUUUUUACGUA-3′ | CEP290 siRNA |
| Sequence-based reagent | CEP290 ID: s37025 Silencer Select siRNA | Ambion/Thermo Fisher | 5′-CACUUACGGACUUCGUUAA-3′ | CEP290 siRNA |
| Sequence-based reagent | Pcm1 2F | Sigma | 5′ CTCTGACCTCTGCACACATG 3′ | Genotyping Pcm1∆5-14 mouse. PCR followed by Sanger sequencing. Product size: 332 bp |
| Sequence-based reagent | Pcm1 2R | Sigma | 5′ ACAATCGATGGGAGAGCCTC 3′ | Genotyping Pcm1∆5-14 mouse. PCR followed by Sanger sequencing. Product size: 332 bp |
| Sequence-based reagent | Pcm1 6F | Sigma | 5′ AGTATCGCTGTACTTTGCCA 3′ | Genotyping Pcm1∆796-800 mouse. PCR followed by Dde1 digestion. Product size: 266 bp |
| Sequence-based reagent | Pcm1 6R | Sigma | 5′ CAGAGTCATCCATCACAGCTAT 3′ | Genotyping Pcm1∆796-800 mouse. PCR followed by Dde1 digestion. Product size: 266 bp |
| Sequence-based reagent | Pcm1 2F | Sigma | 5′ CTCTGACCTCTGCACACATG 3′ | Genotyping Pcm1SNAP mouse. PCR. Product size: 332 bp, only amplifies in WT |
| Sequence-based reagent | Pcm1 2R | Sigma | 5′ ACAATCGATGGGAGAGCCTC 3′ | Genotyping Pcm1SNAP mouse. PCR. Product size: 332 bp, only amplifies in WT |
| Sequence-based reagent | SNAP F | Sigma | 5′ GGCCTGCACCGTATCATCTT 3′ | Genotyping Pcm1SNAP mouse. PCR. Product size: 132 bp, only amplifies in mutant |
| Sequence-based reagent | SNAP R | Sigma | 5′ AAAGTAGGCGTTGAGCCAGG 3′ | Genotyping Pcm1SNAP mouse. PCR. Product size: 132 bp, only amplifies in mutant |
| Chemical compound, drug | SNAP-Cell 647-SiR | New England Biolabs | ||
| Chemical compound, drug | nocodozole | Sigma | SML1665 | 20 μM |
| Antibody | Acetylated Alpha Tubulin | Sigma | 6-11B-1 T6793 | IF (1:1000–1:2000) |
| Antibody | ANKRD26 | GeneTex | GTX128255 | IF(1:100 MeOH) |
| Antibody | ARL13B | Proteintech Group | 17711-1-AP | IF (1:1000, PFA) |
| Antibody | α-tubulin | Sigma | DM1A | WB (1:1000) |
| Antibody | α-tubulin | Abcam | ab4074 | WB (1:1000) |
| Antibody | CENTRIN | Merck | 20 H5 04-1624 | IF (1:300 MeOH w. PE) |
| Antibody | CENTRIOLIN | Santa Cruz | sc-365521 | IF (1:100 MeOH w PE) |
| Antibody | CENTROBIN | Abcam | Ab70448 | IF (1:100 MeOH) |
| Antibody | CEP131 | Proteintech Group | 25735-1-AP | IF (1:75 MeOH w PE) |
| Antibody | CEP162 | Sigma Prestige | HPA030170 | IF(1:100 MeOH) |
| Antibody | CEP164 | Santa Cruz | sc-240226 | IF(1:100 MeOH) |
| Antibody | CEP290 | Santa Cruz | B-7 sc-390462 | IF (1:500 MeOH) |
| Antibody | CEP97 | Proteintech Group | 22050-1-AP | IF(1:100 MeOH) |
| Antibody | CP110 | Proteintech Group | 12780-1-AP | IF/WB (1:1000) |
| Antibody | CP110 | Millipore | MABT1354 | IF (1:100 MeOH w. PE) |
| Antibody | FBF1 | Proteintech Group | 11531-1-AP | IF(1:100 MeOH) |
| Antibody | FOP | Proteintech Group | 11343-1-AP | IF (1:100 PFA or MeOH) |
| Antibody | Gamma Tubulin | Sigma | GTU88 T6557 | IF (1:500, MeOH w PE) |
| Antibody | GAPDH | Proteintech Group | 6008-1-Ig | WB (1:100,000) |
| Antibody | IFT81 | Proteintech Group | 11744-1-AP | IF (1:100 PFA) |
| Antibody | IFT88 | Proteintech Group | 13967-1-AP | IF (1:100 PFA) |
| Antibody | MIB1 | Sigma | M5948 | IF (1:1000 MeOH w. PE) |
| Antibody | MYOVA | Cell Signaling Technology | 3402S | IF(1:100 MeOH) |
| Antibody | NINEIN | Michel Bornens | L79 | IF(1:200 MeOH) |
| Antibody | PCM1 | Proteintech Group | 19856-1-AP | IF (1:100, MeOH w PE) |
| Antibody | PCM1 C | Novus Biologicals | NBP1-87196 | WB (1:1000) |
| Antibody | PCM1 N | Novus Biologicals | H0005108-B01P | WB (1:1000) |
| Antibody | PCM1 | Santa Cruz | D-19 sc-50164 | (Figure 7—figure supplement 1) IF (1:1000 MeOH) |
| Antibody | PCNT | Abcam | ab4448 | IF (1:1000, MeOH) |
| Antibody | Polyglutamylated tubulin | Adipogen HPA030170 | AG-20B-0020-C100/GT335 | IF (1:500) |
| Antibody | RAB34 | Proteintech Group | 27435-1-AP | IF (1:500) |
| Antibody | RPGRIP1L | Proteintech Group | 29778-1-AP | IF (1:100 PFA w 1% SDS) |
| Antibody | TALPID3 | Proteintech Group | 24421-1-AP | IF(1:100 MeOH) |
| Antibody | TTBK2 | Sigma | HPA018113 | IF(I:100) |
| Antibody | ECL -Mouse IgG, HRP-conjugated Host: Sheep | GE Healthcare UK Ltd | WB (1:7500) | |
| Antibody | ECL -Rabbit IgG, HRP-conjugated Host: Sheep | GE Healthcare UK Ltd | WB (1:7500) | |
| Antibody | HRP-conjugated –Rabbit IgG H+L Host: Goat | Bio-Rad | WB (1:5000) | |
| Antibody | HRP-conjugated –Mouse IgG H+L Host: Goat | Bio-Rad | WB (1:5000) | |
| Antibody | Alexa 488-conjugated – Mouse Host: Donkey | Invitrogen Molecular Probes | IF (1:500) | |
| Antibody | Alexa 594-conjugated – Rabbit Host: Donkey | Invitrogen Molecular Probes | IF (1:500) | |
| Antibody | Alexa 488-conjugated – Rabbit Host: Donkey | Invitrogen Molecular Probes | IF (1:500) | |
| Antibody | Alexa 594-conjugated – Mouse Host: Donkey | Invitrogen Molecular Probes | IF (1:500) | |
| Antibody | Alexa 647-conjugated – Rabbit Host: Donkey | Invitrogen Molecular Probes | IF (1:500) | |
| Antibody | Alexa 647-conjugated – Mouse Host: Donkey | Invitrogen Molecular Probes | IF (1:500) | |
| Antibody | Alexa 647-conjugated – Goat Host: Donkey | Invitrogen Molecular Probes | IF (1:500) | |
| Software algorithm | QuPath | PMID:29203879 | https://github.com/IGC-Advanced-Imaging-Resource/Hall2022_Paper | |
| Software algorithm | Nis-Elements AR V4.6 | Nikon Instruments | ||
| Software algorithm | FIJI | Schindelin et al., 2012 | https://github.com/IGC-Advanced-Imaging-Resource/Hall2022_Paper | |
| Software algorithm | CellProfiler | Stirling et al., 2021 | https://github.com/IGC-Advanced-Imaging-Resource/Hall2022_Paper | |
| Software algorithm | Imaris | Oxford Instruments |
Data availability
Proteomics data files are uploaded to ProteomeXchange (Identifier: PXD031920), with the accession number is available with the paper. All analysis tools have been made available on GitHub (copy archived at swh:1:rev:7b4d68b8ba0c7bf5cc06de6b6589656c3785e6e0), as described in Materials and methods.
-
PRIDEID PXD031920. Centriolar satellites expedite mother centriole remodeling to promote ciliogenesis.
References
-
Centriolar satellites: busy orbits around the centrosomeEuropean Journal of Cell Biology 90:983–989.https://doi.org/10.1016/j.ejcb.2011.07.007
-
The centriolar satellite protein CCDC66 interacts with CEP290 and functions in cilium formation and traffickingJournal of Cell Science 130:1450–1462.https://doi.org/10.1242/jcs.196832
-
Accurate proteome-wide label-free quantification by delayed normalization and maximal peptide ratio extraction, termed maxlfqMolecular & Cellular Proteomics 13:2513–2526.https://doi.org/10.1074/mcp.M113.031591
-
Imaging proteins inside cells with fluorescent tagsTrends in Biotechnology 30:8–16.https://doi.org/10.1016/j.tibtech.2011.08.002
-
Assembly of centrosomal proteins and microtubule organization depends on PCM-1The Journal of Cell Biology 159:255–266.https://doi.org/10.1083/jcb.200204023
-
Ependymal cell differentiation, from monociliated to multiciliated cellsMethods in Cell Biology 127:19–35.https://doi.org/10.1016/bs.mcb.2015.01.004
-
HGF induces epithelial-to-mesenchymal transition by modulating the mammalian hippo/MST2 and ISG15 pathwaysJournal of Proteome Research 13:2874–2886.https://doi.org/10.1021/pr5000285
-
Mouse idh3a mutations cause retinal degeneration and reduced mitochondrial functionDisease Models & Mechanisms 11:dmm036426.https://doi.org/10.1242/dmm.036426
-
Regulation of centriolar satellite integrity and its physiologyCellular and Molecular Life Sciences 74:213–229.https://doi.org/10.1007/s00018-016-2315-x
-
Ciliogenesis: building the cell’s antennaNature Reviews. Molecular Cell Biology 12:222–234.https://doi.org/10.1038/nrm3085
-
Planar polarity of ependymal ciliaDifferentiation; Research in Biological Diversity 83:S86–S90.https://doi.org/10.1016/j.diff.2011.10.007
-
The novel centriolar satellite protein SSX2IP targets Cep290 to the ciliary transition zoneMolecular Biology of the Cell 25:495–507.https://doi.org/10.1091/mbc.E13-09-0526
-
A ciliopathy complex builds distal appendages to initiate ciliogenesisThe Journal of Cell Biology 220:e202011133.https://doi.org/10.1083/jcb.202011133
-
The daughter centriole controls ciliogenesis by regulating neurl-4 localization at the centrosomeThe Journal of Cell Biology 216:1287–1300.https://doi.org/10.1083/jcb.201608119
-
Loss of centrosome integrity induces p38-p53-p21-dependent G1-S arrestNature Cell Biology 9:160–170.https://doi.org/10.1038/ncb1529
-
The subventricular zone en-face: wholemount staining and ependymal flowJournal of Visualized Experiments 1:1938.https://doi.org/10.3791/1938
-
Cilia organize ependymal planar polarityThe Journal of Neuroscience 30:2600–2610.https://doi.org/10.1523/JNEUROSCI.3744-09.2010
-
SoftwareHall2022_Paper, version swh:1:rev:7b4d68b8ba0c7bf5cc06de6b6589656c3785e6e0Software Heritage.
-
Once and only once: mechanisms of centriole duplication and their deregulation in diseaseNature Reviews. Molecular Cell Biology 19:297–312.https://doi.org/10.1038/nrm.2017.127
-
Unraveling the mysteries of centriolar satellites: time to rewrite the textbooks about the centrosome/cilium complexMolecular Biology of the Cell 31:866–872.https://doi.org/10.1091/mbc.E19-07-0402
-
Centriolar satellite biogenesis and function in vertebrate cellsJournal of Cell Science 133:jcs239566.https://doi.org/10.1242/jcs.239566
-
Genes and molecular pathways underpinning ciliopathiesNature Reviews. Molecular Cell Biology 18:533–547.https://doi.org/10.1038/nrm.2017.60
-
Fiji: an open-source platform for biological-image analysisNature Methods 9:676–682.https://doi.org/10.1038/nmeth.2019
-
Control of centriole length by CPAP and Cp110Current Biology 19:1005–1011.https://doi.org/10.1016/j.cub.2009.05.016
-
Cep164 mediates vesicular docking to the mother centriole during early steps of ciliogenesisThe Journal of Cell Biology 199:1083–1101.https://doi.org/10.1083/jcb.201202126
-
Lubac regulates ciliogenesis by promoting Cp110 removal from the mother centrioleThe Journal of Cell Biology 221:e202105092.https://doi.org/10.1083/jcb.202105092
-
The centriolar satellite protein cep131 is important for genome stabilityJournal of Cell Science 125:4770–4779.https://doi.org/10.1242/jcs.104059
-
Ccdc13 is a novel human centriolar satellite protein required for ciliogenesis and genome stabilityJournal of Cell Science 127:2910–2919.https://doi.org/10.1242/jcs.147785
-
CellProfiler 4: improvements in speed, utility and usabilityBMC Bioinformatics 22:433.https://doi.org/10.1186/s12859-021-04344-9
-
Centriole distal appendages promote membrane docking, leading to cilia initiationGenes & Development 27:163–168.https://doi.org/10.1101/gad.207043.112
-
Molecular characterization of centriole assembly in ciliated epithelial cellsThe Journal of Cell Biology 178:31–42.https://doi.org/10.1083/jcb.200703064
-
Analysis of ciliogenesis in primary culture mouse tracheal epithelial cellsMethods in Enzymology 525:285–309.https://doi.org/10.1016/B978-0-12-397944-5.00014-6
-
PCM1 recruits plk1 to the pericentriolar matrix to promote primary cilia disassembly before mitotic entryJournal of Cell Science 126:1355–1365.https://doi.org/10.1242/jcs.114918
-
Growth and differentiation of mouse tracheal epithelial cells: selection of a proliferative populationAmerican Journal of Physiology. Lung Cellular and Molecular Physiology 283:L1315–L1321.https://doi.org/10.1152/ajplung.00169.2002
-
Proteome-Wide identification of ubiquitin interactions using ubia-MSNature Protocols 13:530–550.https://doi.org/10.1038/nprot.2017.147
Article and author information
Author details
Vicente Herranz-Pérez

Laurence Pelletier
Funding
Medical Research Council (MR_UU_1201018/26)
- Emma A Hall
- Dhivya Kumar
- Patricia L Yeyati
- Lorraine Rose
- Lisa McKie
- Daniel O Dodd
- Peter A Tennant
- Roly Megaw
- Laura C Murphy
- Graeme Grimes
- Lucy Williams
- Tooba Quidwai
- Pleasantine Mill
- Marisa F Ferreira
European Commission (866355)
- Emma A Hall
- Daniel O Dodd
- Pleasantine Mill
Canadian Institutes of Health Research (167279)
- Suzanna L Prosser
- Laurence Pelletier
National Institutes of Health (R01GM095941)
- Vicente Herranz-Pérez
- Jose Manuel García-Verdugo
- Jeremy F Reiter
- Dhivya Kumar
Jane Coffin Childs Memorial Fund for Medical Research
- Dhivya Kumar
Sandler Foundation
- Dhivya Kumar
Krembil Foundation
- Suzanna L Prosser
- Laurence Pelletier
European Commission (702601)
- Suzanna L Prosser
National Institutes of Health (R01AR054396)
- Dhivya Kumar
- Vicente Herranz-Pérez
- Jose Manuel García-Verdugo
- Jeremy F Reiter
National Institutes of Health (RO1HD089918)
- Vicente Herranz-Pérez
- Jose Manuel García-Verdugo
- Jeremy F Reiter
- Dhivya Kumar
National Institutes of Health (5K99GM140175)
- Dhivya Kumar
The funders had no role in study design, data collection, and interpretation, or the decision to submit the work for publication.
Acknowledgements
We thank the IGC Advanced Imaging Resource and the IGC Mass Spectrometry facility, as well as the Newcastle University Electron Microscopy Research services and, in particular, Tracey Davey. Work by the group of JFR is supported by NIH R01GM095941, R01AR054396, and R01HD089918. DK is supported by NIH K99 grant (5K99GM140175) and was funded by the Jane Coffin Childs memorial foundation and a Program for Biomedical Research award by the Sandler foundation. Work by the group of PM is supported by MRC intramural funding (MC_UU_12018/26) and by the European Commission (H2020 Grant No. 866355). Work by the group of LP is supported by CIHR Foundation (FDN#167279) and the Krembil Foundation. LP is a Tier 1 Canada Research Chair in Centrosome Biogenesis and Function and SLP was funded by a European Union Horizon 2020 Marie Skłodowska-Curie Global Fellowship (No. 702601).
Ethics
Animals were maintained in SPF environment and studies carried out in accordance with the guidance issued by the Medical Research Council in 'Responsibility in the Use of Animals in Medical Research' (July 1993) and licensed by the Home Office under the Animals (Scientific Procedures) Act 1986 under project license number P18921CDE in facilities at the University of Edinburgh (PEL 60/6025).
Copyright
© 2023, Hall, Kumar et al.
This article is distributed under the terms of the Creative Commons Attribution License, which permits unrestricted use and redistribution provided that the original author and source are credited.
Metrics
-
- 3,933
- views
-
- 683
- downloads
-
- 53
- citations
Views, downloads and citations are aggregated across all versions of this paper published by eLife.
Citations by DOI
-
- 53
- citations for umbrella DOI https://doi.org/10.7554/eLife.79299
Download links
A two-part list of links to download the article, or parts of the article, in various formats.
Downloads (link to download the article as PDF)
Open citations (links to open the citations from this article in various online reference manager services)
Cite this article (links to download the citations from this article in formats compatible with various reference manager tools)
Centriolar satellites expedite mother centriole remodeling to promote ciliogenesis
eLife 12:e79299.
https://doi.org/10.7554/eLife.79299


