Structural insight on the mechanism of an electron-bifurcating [FeFe] hydrogenase
- Structural Biology Laboratory and York Biomedical Research Institute, Department of Chemistry, The University of York, United Kingdom
- Max Planck Institute for Chemical Energy Conversion, Germany
- Division of Materials Science, Nara Institute of Science and Technology, Japan
- Graduate School of Life Science, University of Hyogo, Japan
Figures
Figure 1 with 7 supplements
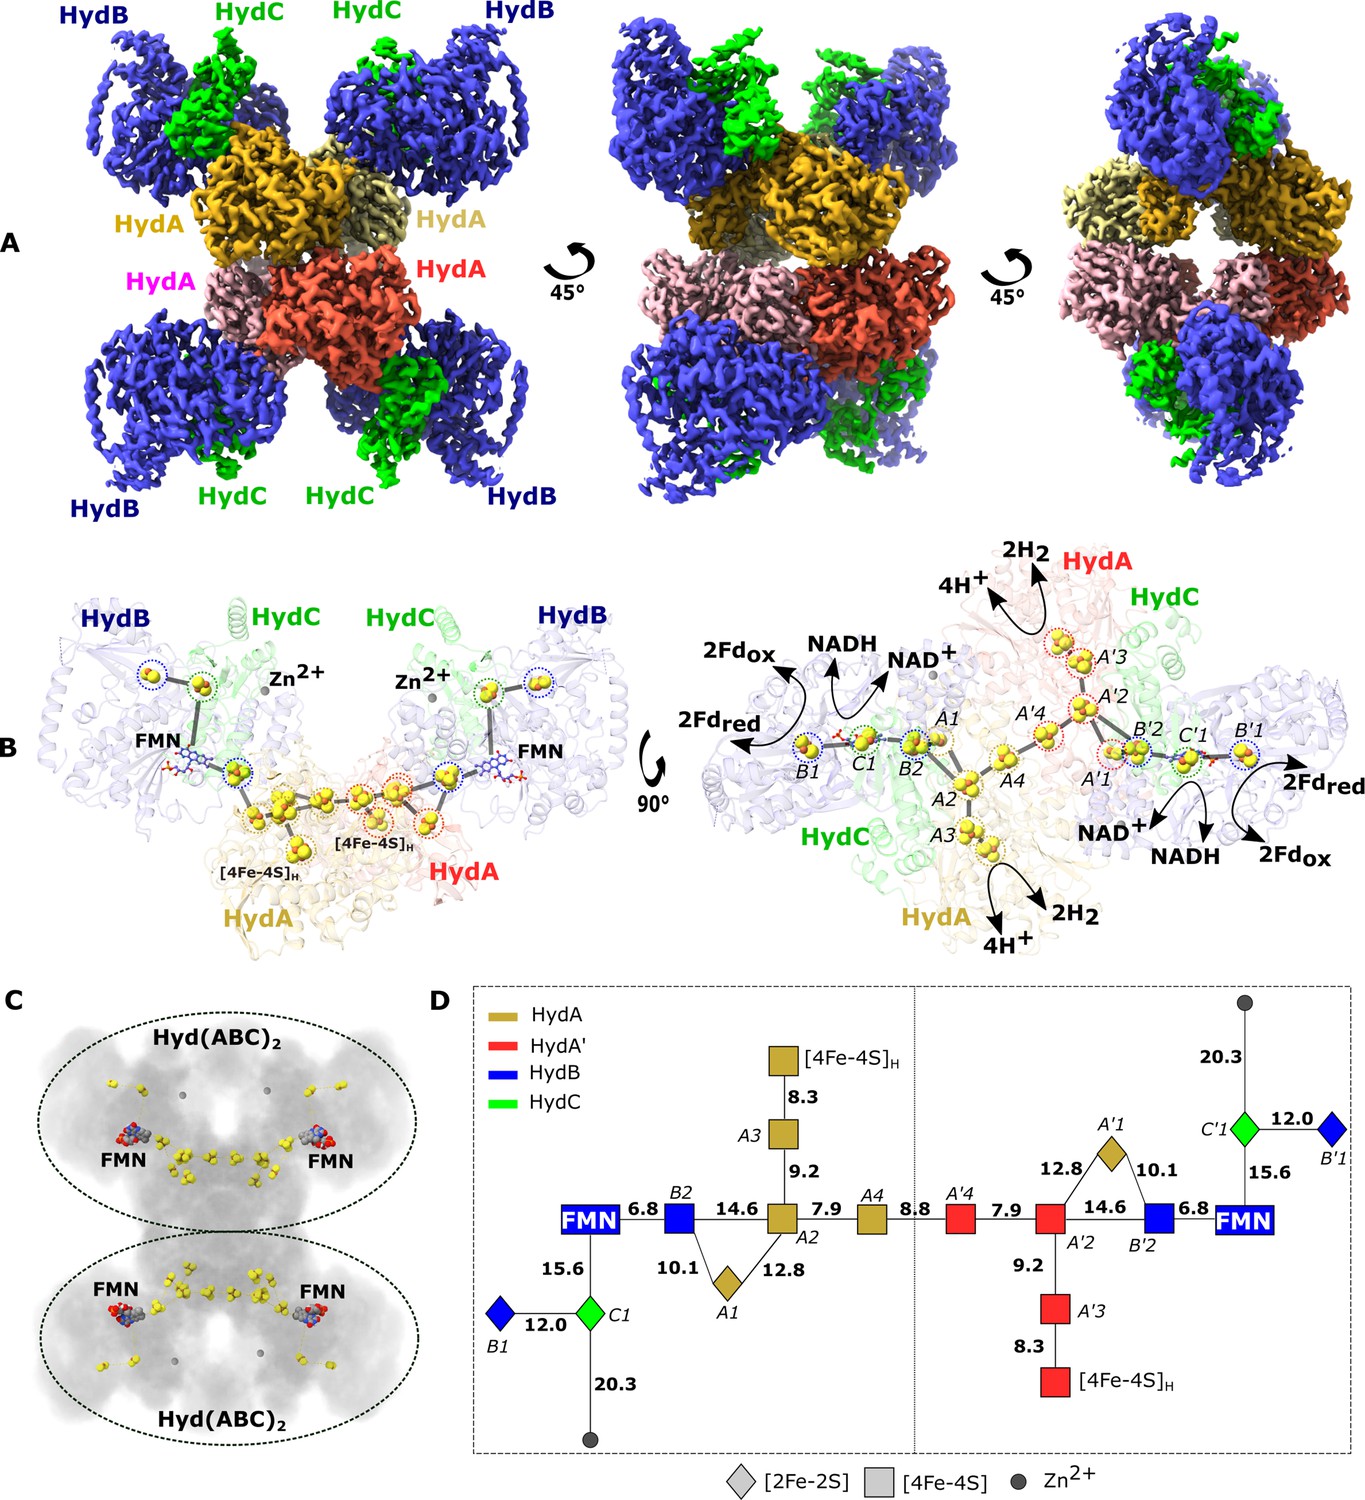
Cryo-EM structure of the HydABC tetramer and arrangement of the redox cofactors.
(A) The unsharpened 2.3 Å map of Hyd(ABC)4 with D2 symmetry enforced showing a tetramer of HydABC heterotrimers. All four copies of HydB and C are colored blue and green, respectively. The four HydA copies that make up the core of the complex are in orange, yellow, pink, and red. The top and bottom halves of the complex are constituted by dimers of HydABC protomers (each HydABC unit is a protomer); the two protomers within the same dimer are strongly interacting, while a weaker interaction is present between the top and bottom dimers. (B) HydABC dimer highlighting the iron–sulfur clusters and flavin mononucleotide (FMN) constituting the electron transfer network. (C) The arrangement of redox cofactors within the protein complex, showing two independent identical redox networks (dashed circles); each redox network is composed of iron–sulfur clusters belonging to a Hyd(ABC)2 unit composed of two strongly interacting HydABC protomers. (D) Schematic of the electron transfer network of one of the two identical Hyd(ABC)2 units showing edge-to-edge distances (in Å) between the various cofactors. Note that our structure is of apo-HydABC and contains only the [4Fe–4S]H subcluster of the H-cluster. The 2H+/H2 interconversion reaction in (B) illustrates the site at which this reaction occurs, but this will only occur in the full assembled H-cluster including [2Fe]H.
Figure 1—figure supplement 1
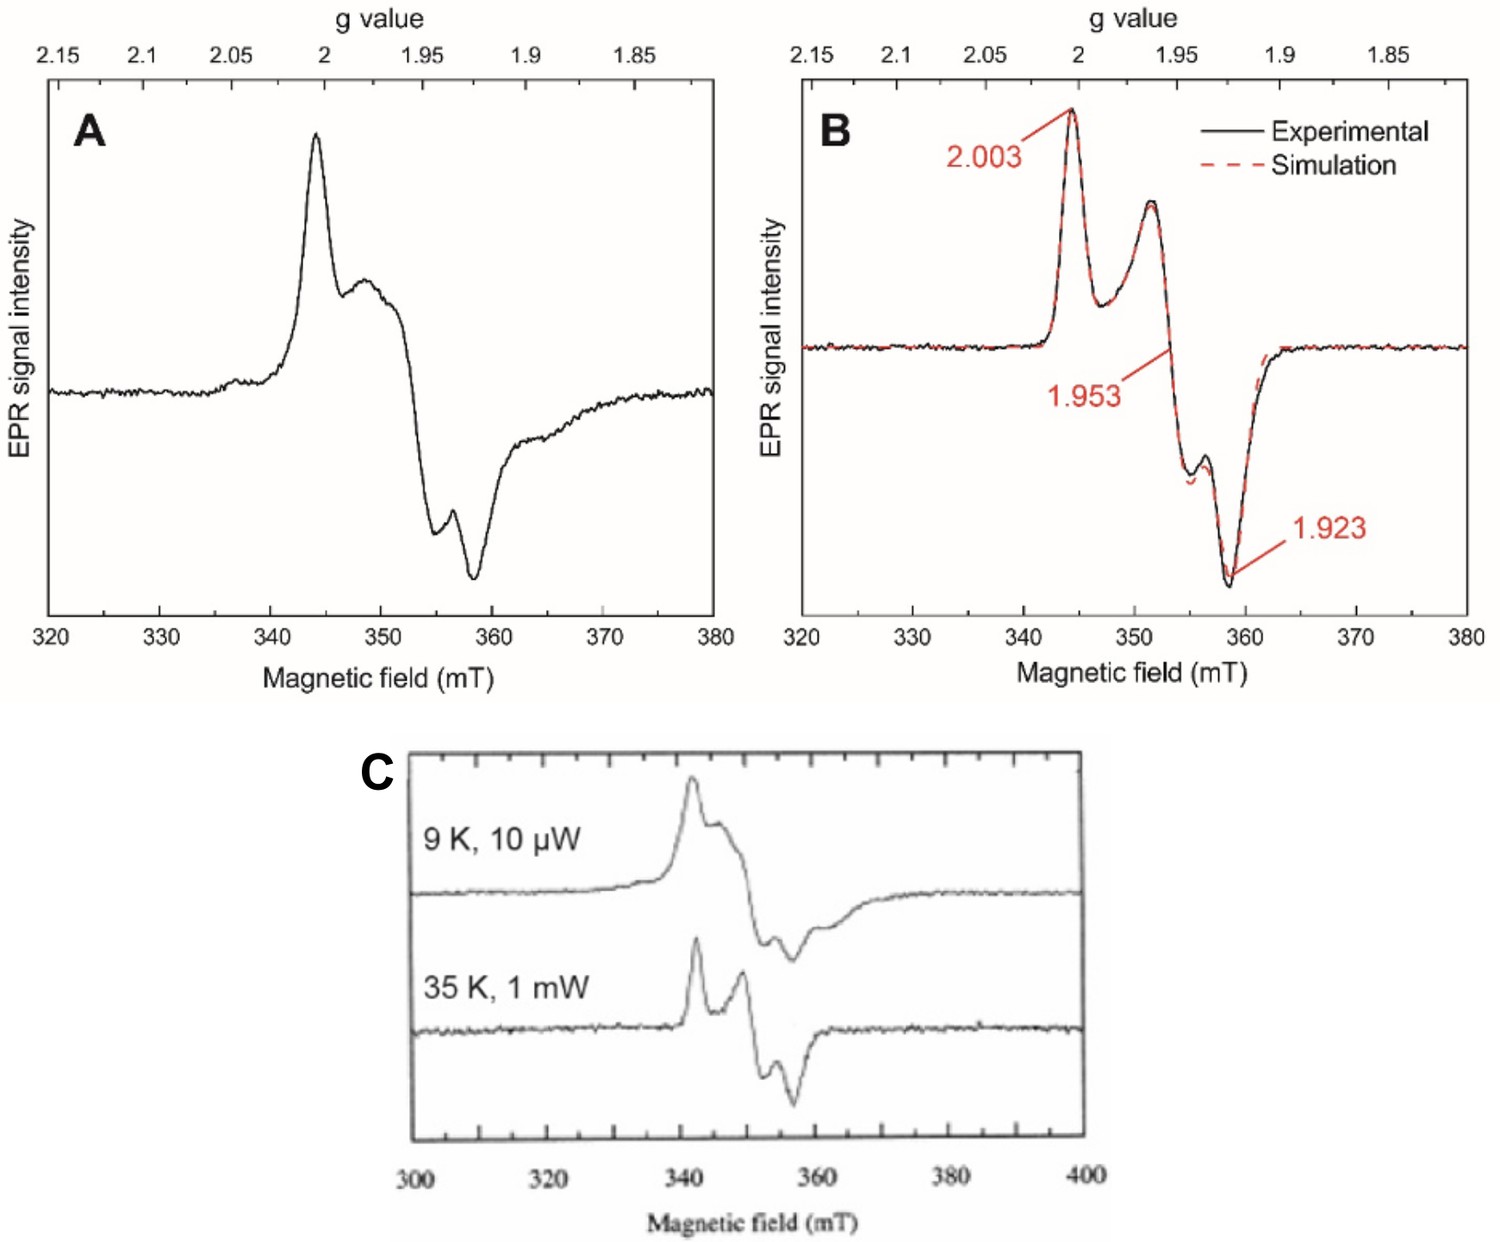
X-band (CW) electron paramagnetic resonance (EPR) spectroscopy on the isolated HydB subunit from Thermotoga maritima produced in E. coli (0.2 mM) reduced with 10 mM sodium dithionite.
(A) The spectrum measured at 10 K and 10 μW power shows a mixture of spin-coupled [4Fe–4S] clusters (evidenced by the features at g ≈ 2.04, 1.97, and 1.89) and a [2Fe–2S] cluster (evidenced by the features at g ≈ 2.00, 1.95, and 1.92). (B) The spectrum measured at 40 K and 1 mW power shows the pure spectrum of a [2Fe–2S] cluster simulated using a rhombic g tensor (2.003, 1.953, 1.923) using g strain (0.012, 0.018, 0.015). At 40 K, the additional features observed at 10 K have been lifetime broadened, confirming that they arise from fast relaxing [4Fe–4S] clusters. All other EPR parameters are given in the methods. (C) EPR spectra of HydB isolated from native T. maritima are reproduced from Verhagen et al., 1999 for comparison. The close agreement between the spectrum in (A) and the upper spectrum in (C) and between the spectrum in (B) and the lower spectrum in (C) indicates that the same cohort of EPR-detectable iron–sulfur clusters is present in both preparations.
© 1999, Elsevier. Figure 1 - figure supplement 1C is reproduced from Figure 6 from Verhagen et al., 1999, with permission from Elsevier. It is not covered by the CC-BY 4.0 licence and further reproduction of this panel would need permission from the copyright holder.
Figure 1—figure supplement 2
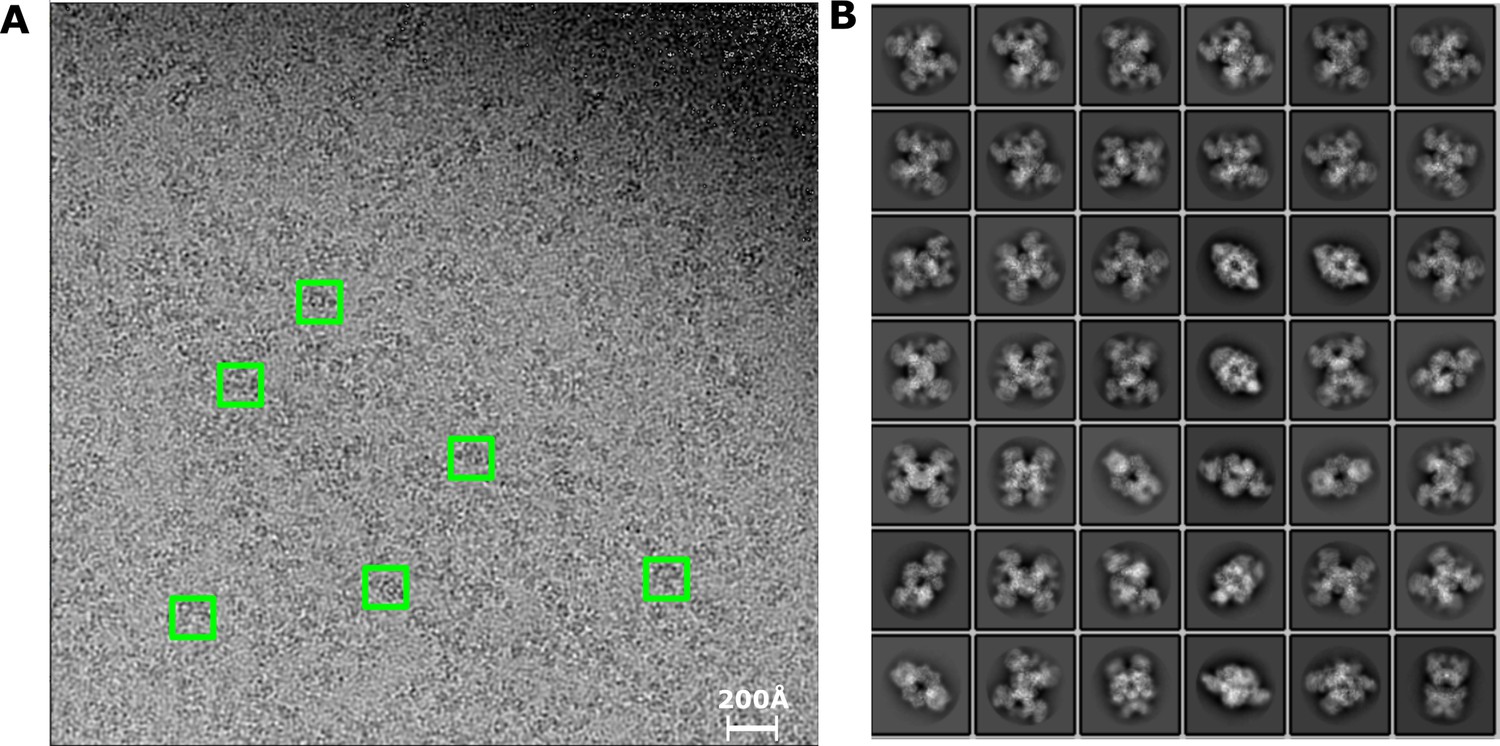
Micrograph and 2D classes averages of T. maritima HydABC.
(A) Representative micrograph from the data collection used to resolve the structure of T. maritima HydABC. A few different views of well isolated particles are shown, highlighted with a green box. (B) 2D class averages after cleaning the dataset with coarse 3D classification, only the full tetramer of trimers is observed.
Figure 1—figure supplement 3
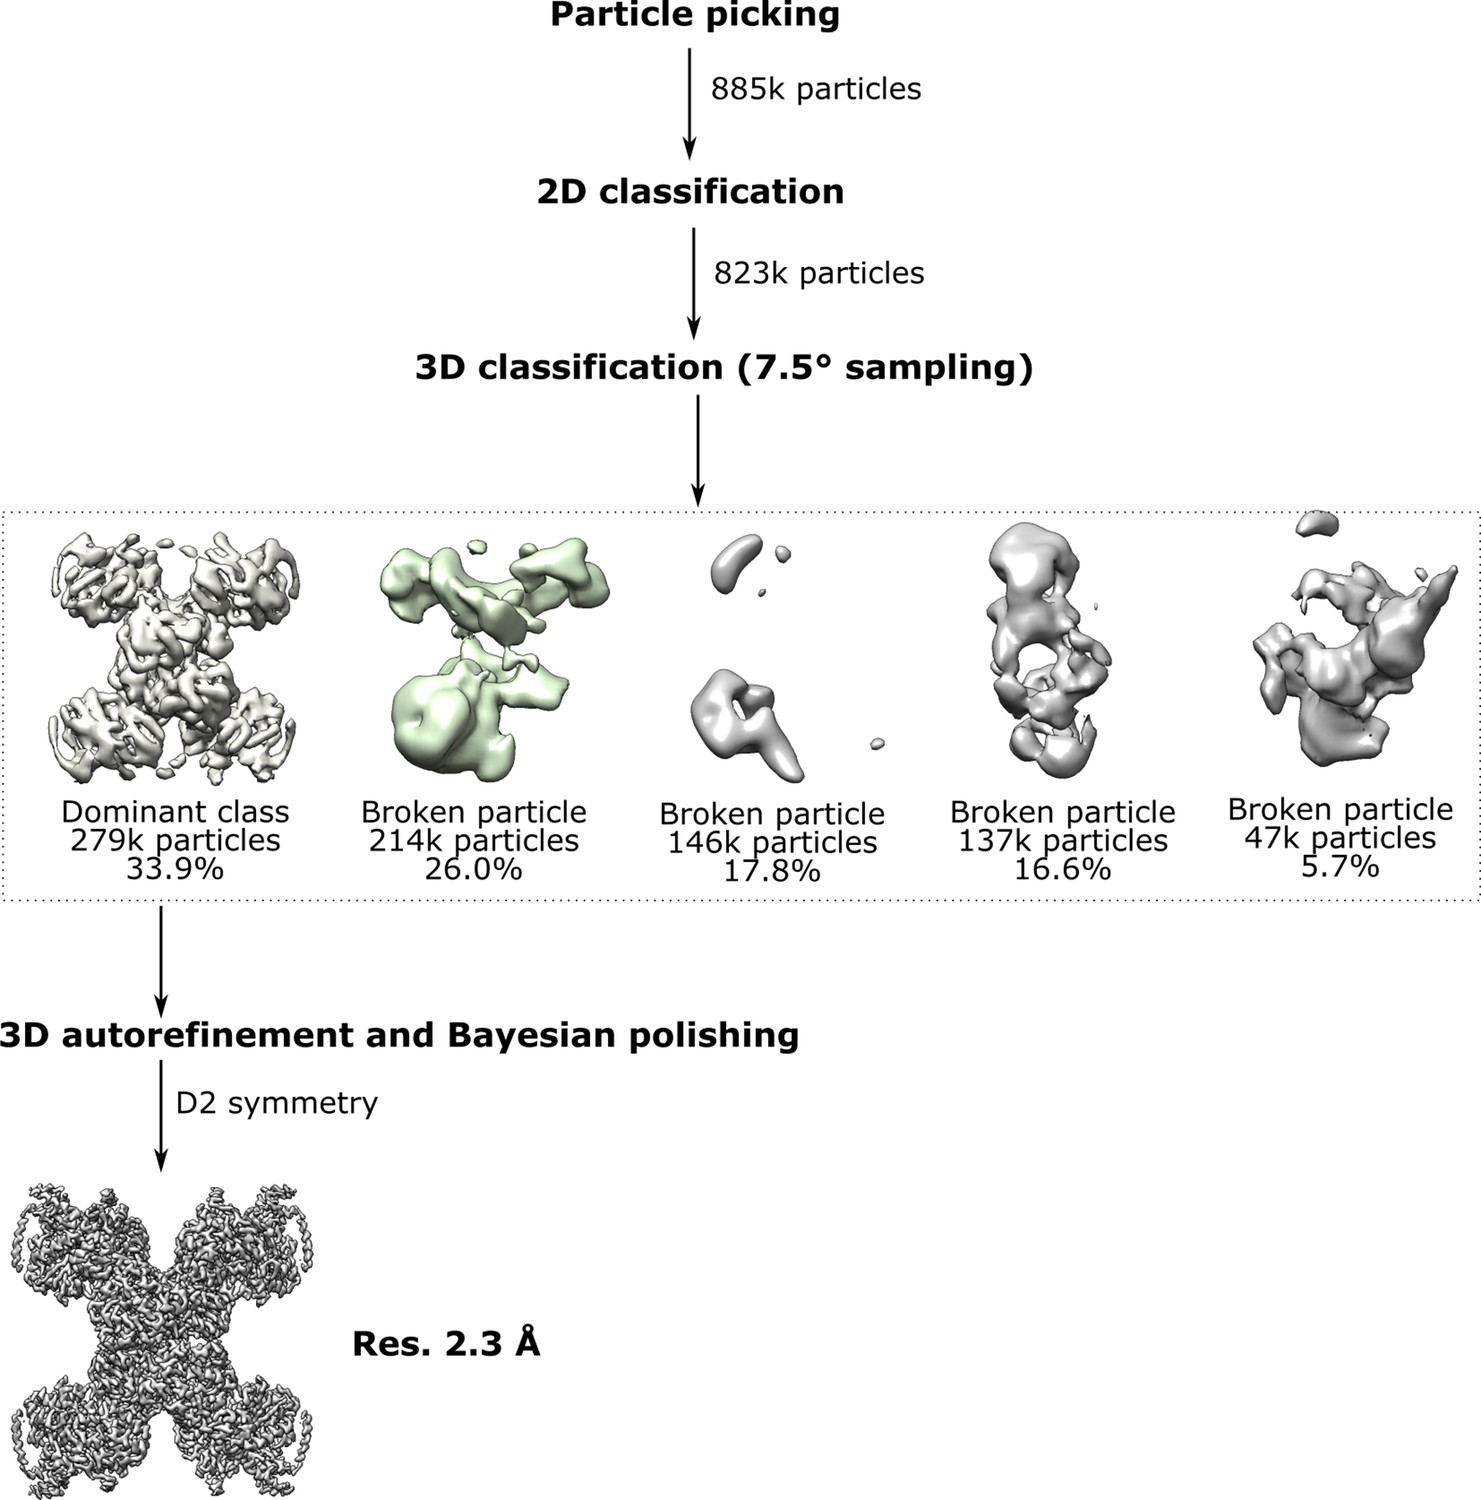
Classification and refinement of the cryo-EM density map for TmHydABC using the RELION pipeline.
Following automatic particle picking and 2D and 3D classification to discard broken particles and contaminants, 3D refinement, and particle polishing were performed. Subsequently, the particles were classified using an angular sampling of 7.5° and pixel size of 3.4 Å, limiting the data to 6.8 Å (see Materials and methods). All five classes provided were populated. The dominant class refined to 2.3 Å. The remaining classes contained what appeared to be damaged particles or fragments of broken particles.
Figure 1—figure supplement 4

Fourier shell correlation (FSC) curve showing the resolution of the D2 map, reaching 2.3 Å.
Figure 1—figure supplement 5
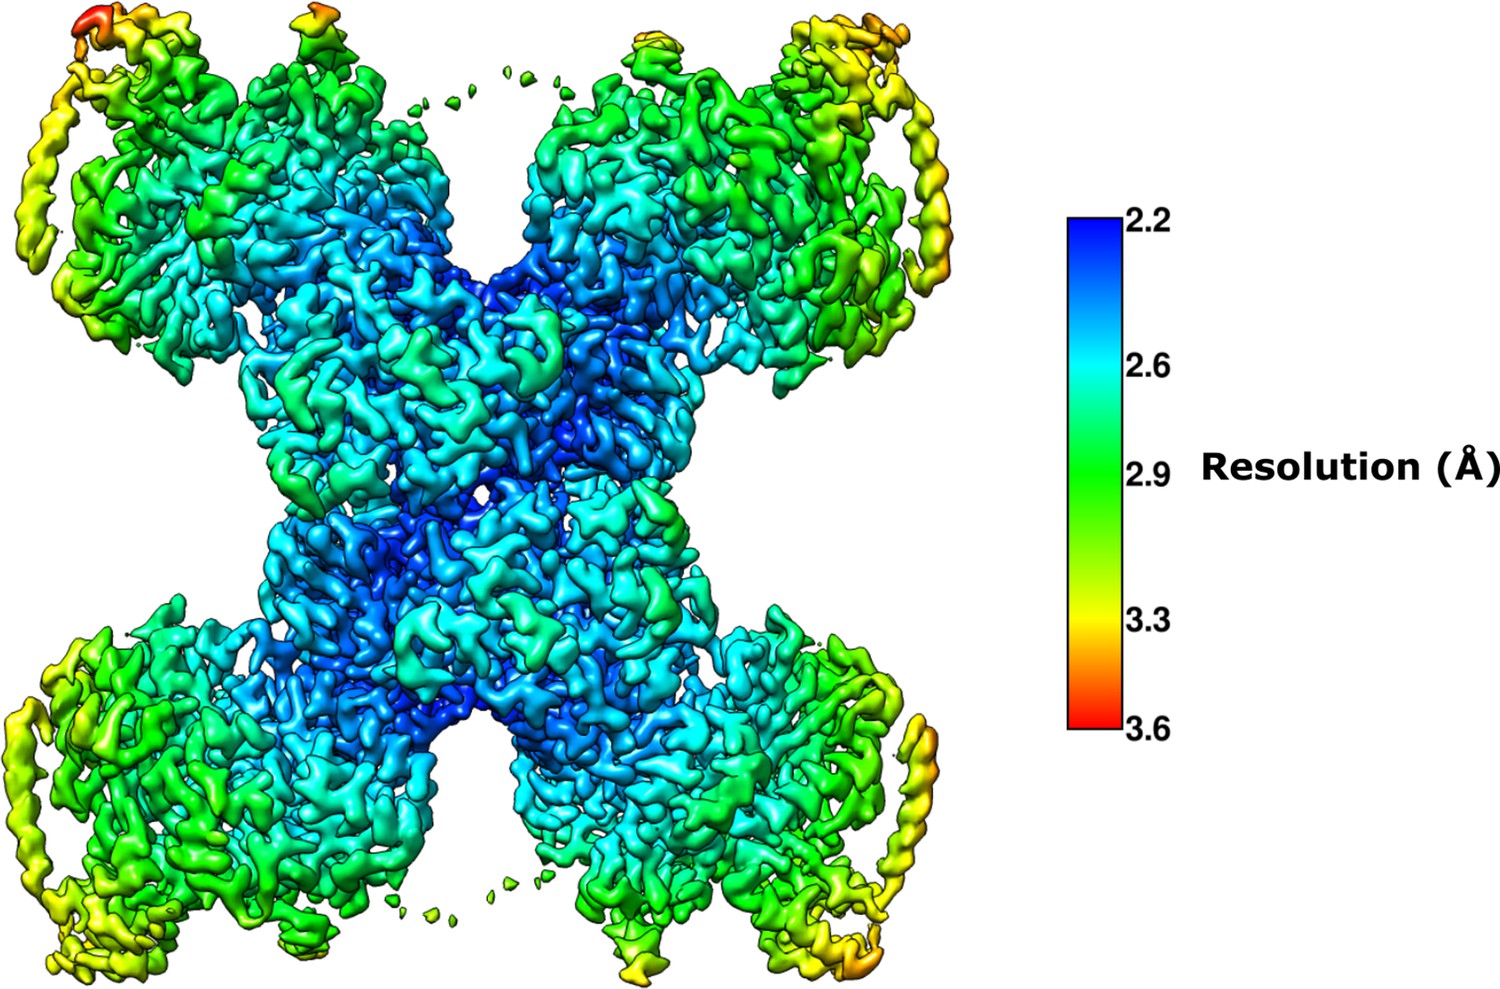
Local resolution of the D2 map.
Local resolution was estimated using the local resolution function in RELION with default parameters. The figure was created using UCSF Chimera.
Figure 1—figure supplement 6
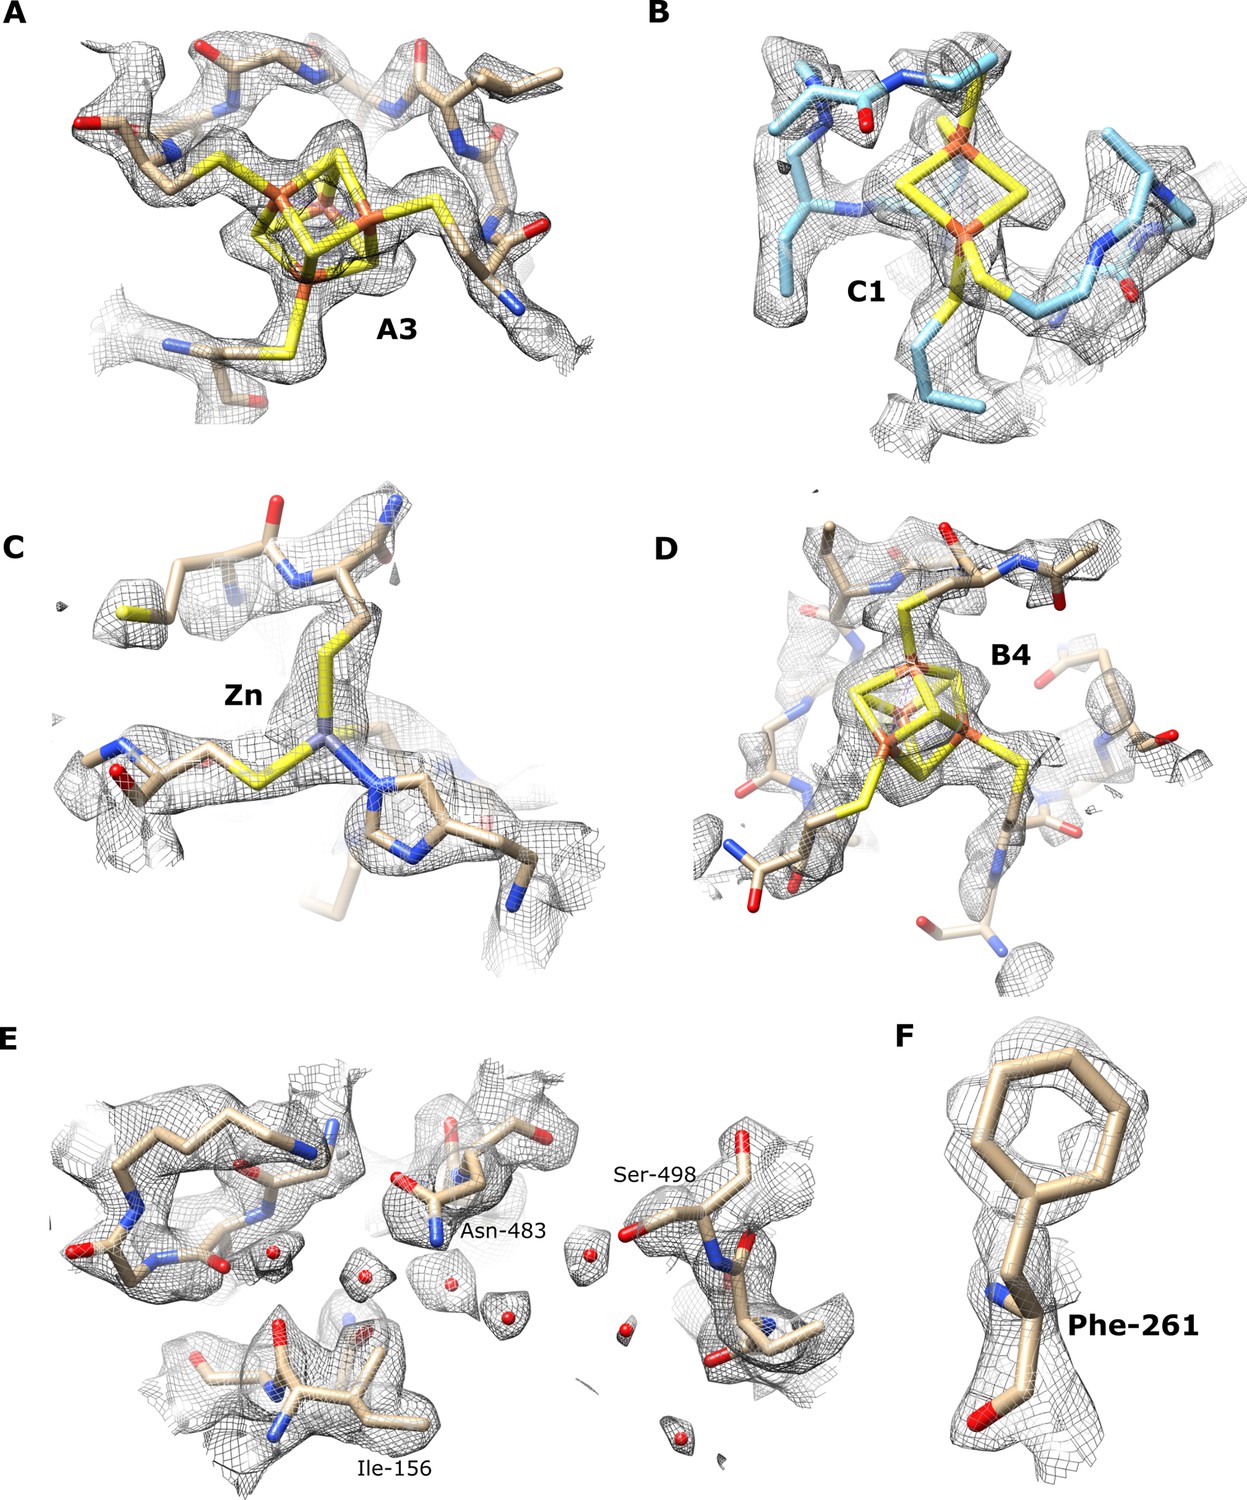
Exemplar denisty maps and models for various regions of the TmHydABC cryo-EM structure.
Density maps and model of A3 [4Fe4S] cluster at (threshold 0.097) (A), C1 [2Fe2S] cluster (threshold 0.044) (B), Zn2+ site (threshold 0.040) (C), B4 [4Fe4S] cluster in the bridge domain (threshold 0.034) (D), example of waters in HydA (threshold 0.038) (E), Phenylalanine-261 in HydA (threshold 0.078) (F).
Figure 1—figure supplement 7
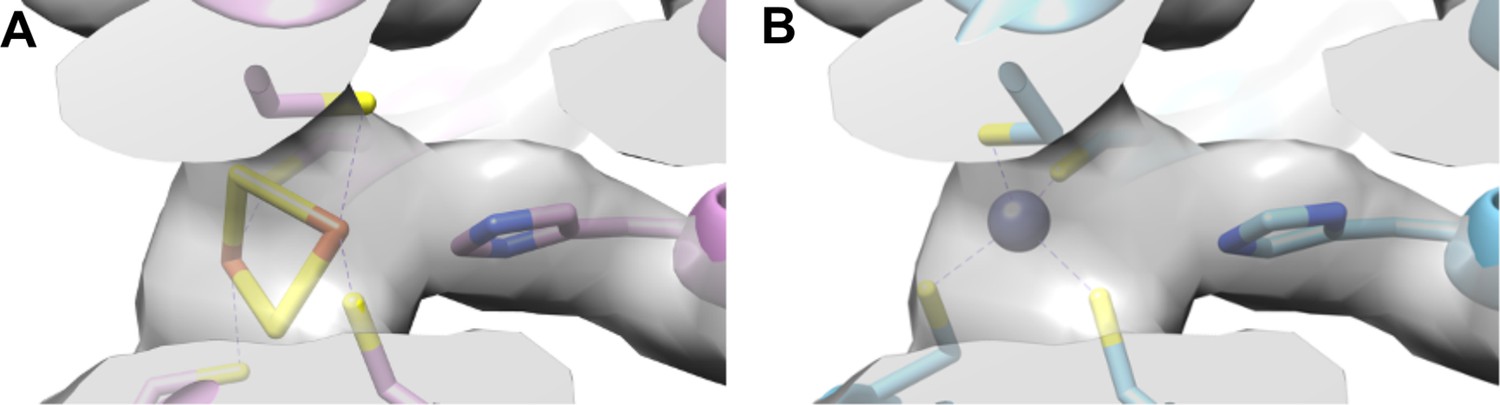
Investigating alternative models for the observed map density (average resolution of 3 Å) for the metal center in the HydABCSL from Acetomicrobium mobile.
(A) shows the center in chain B (HydB) as published with a [2Fe–2S] cluster, pdb code: 7T30 (Feng et al., 2022). (B) shows the same center but built with a tetrahedral Zn; other tetrahedral metals with similiar geometry will also provide a satisfactory fit, given the resolution (≈3 Å). In both cases, the map (EMD-25647) is displayed identically, at a threshold of 0.138.
Figure 2 with 1 supplement
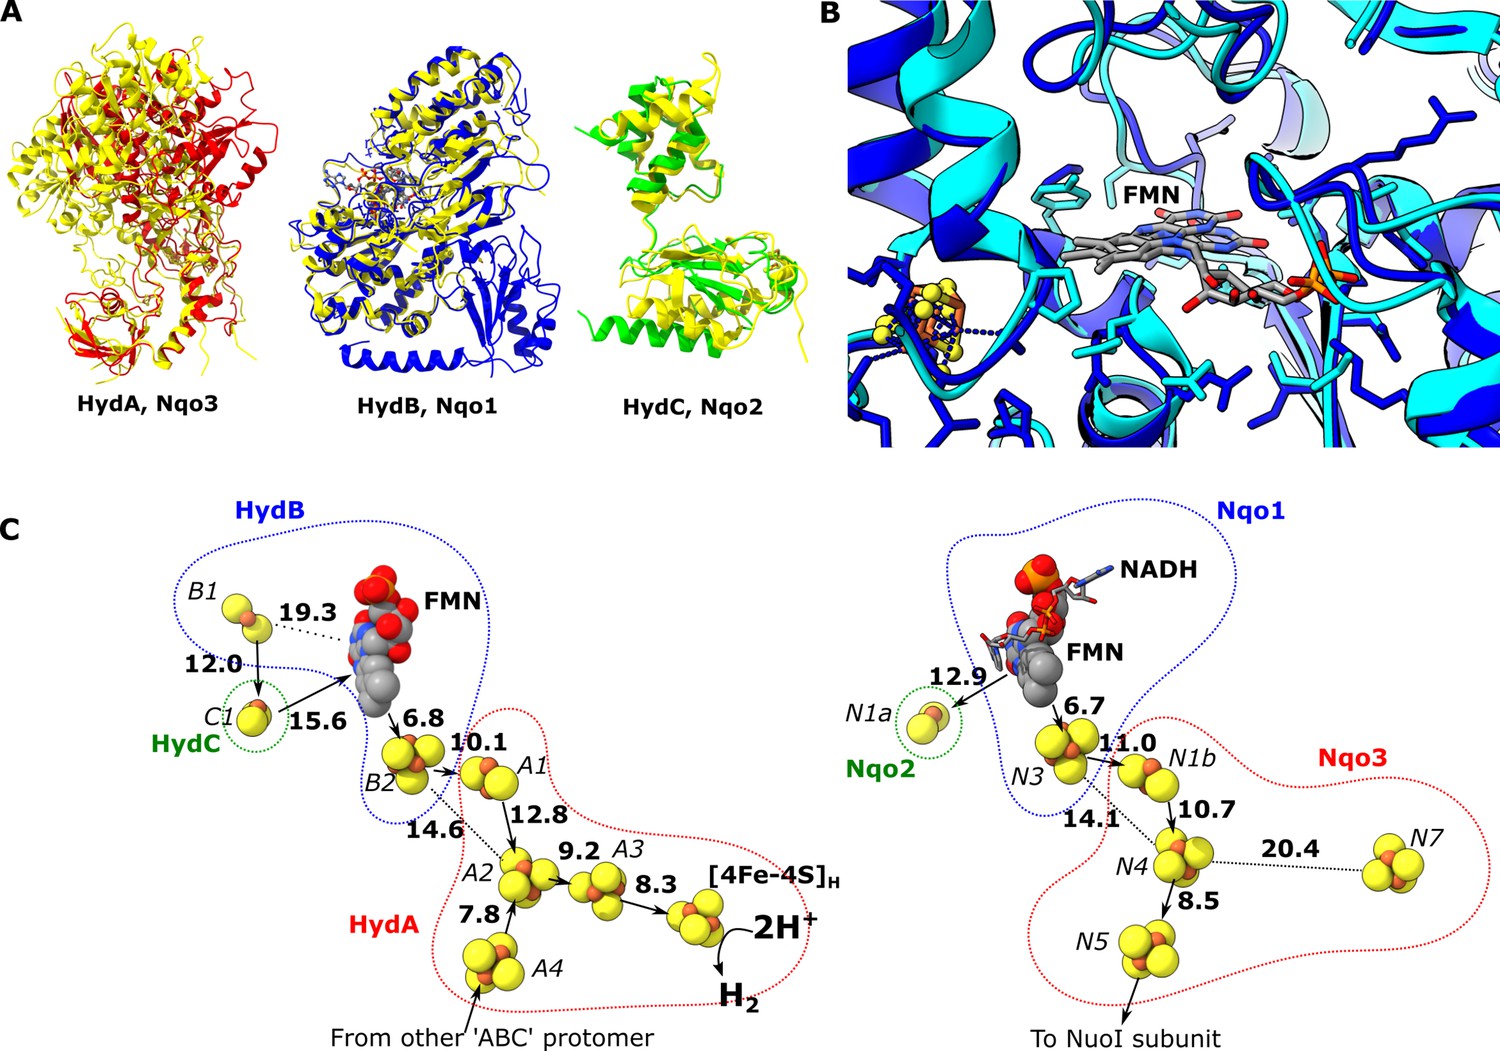
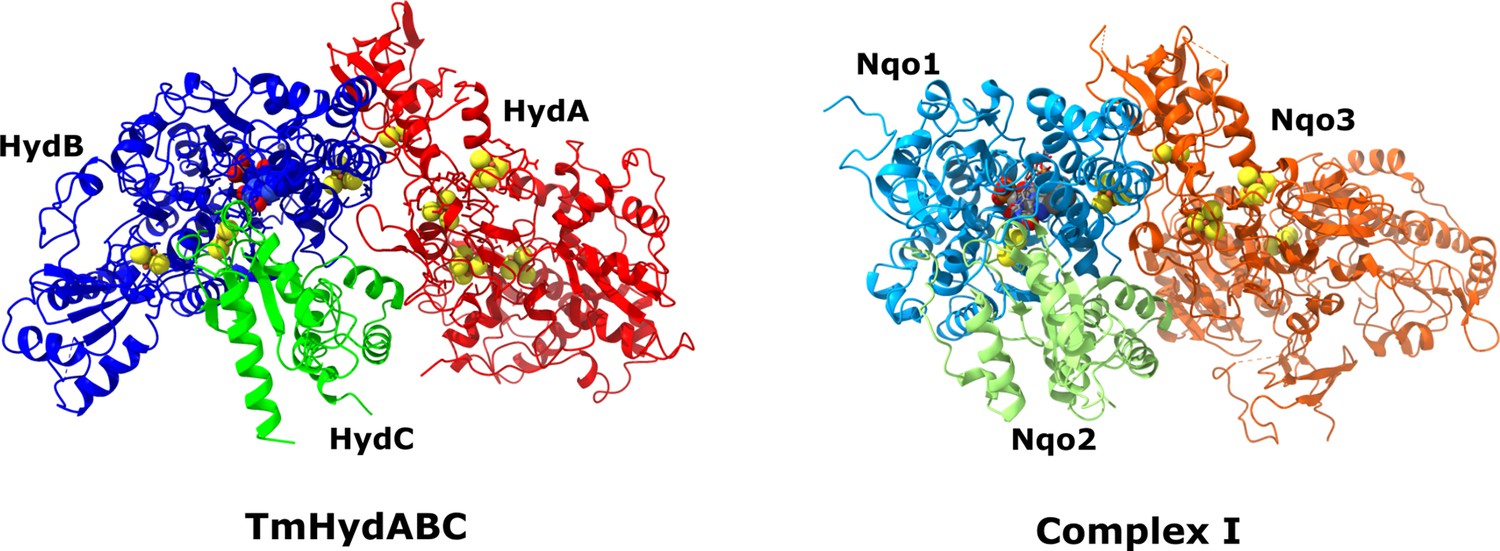
Comparion of the HydA, B and C subunits of the electron bifurcating [FeFe] hydrogenase from Thermotoga maritima with the Nqo3, 1 and 2 subunits from respiratory complex I from Thermus thermophilus.
(A) Subunits HydA (red), HydB (blues), and HydC (green) overlaid with, respectively, Nqo3, Nqo1, and Nqo2 (all yellow) of complex I from T. thermophilus (Gutiérrez-Fernández et al., 2020, PDB: 6ZIY). (B) Comparison of the NADH-binding site of the Nqo1 subunit of complex I from T. thermophilus (light blue) with the flavin mononucleotide (FMN) site in HydB; the high similarity suggests NADH binds in the proximity of FMN in HydABC similar to complex I. (C) Electron transfer network in HydABC compared to complex I from T. thermophilus with edge-to-edge distances indicated in bold. The red, blue, and green dotted lines indicate the cofactors present in the HydA (Nqo3), HydB (Nqo1), and HydC (Nqo2) subunits, respectively. Note that our structure is of the apo-HydABC and lacks the [2Fe]H subcluster of the H-cluster. The 2H+/H2 interconversion reaction in (C) illustrates the site at which this reaction occurs, but this will only occur in the full assembled H-cluster including [2Fe]H.
Figure 2—figure supplement 1
HydABC protomer next to Nqo3, Nqo1, and Nqo2 subunits of complex I from Thermus Thermophilus (PDB ID: 6I1P) in their native arrangements (Gutiérrez-Fernández et al., 2020).
Figure 3 with 1 supplement
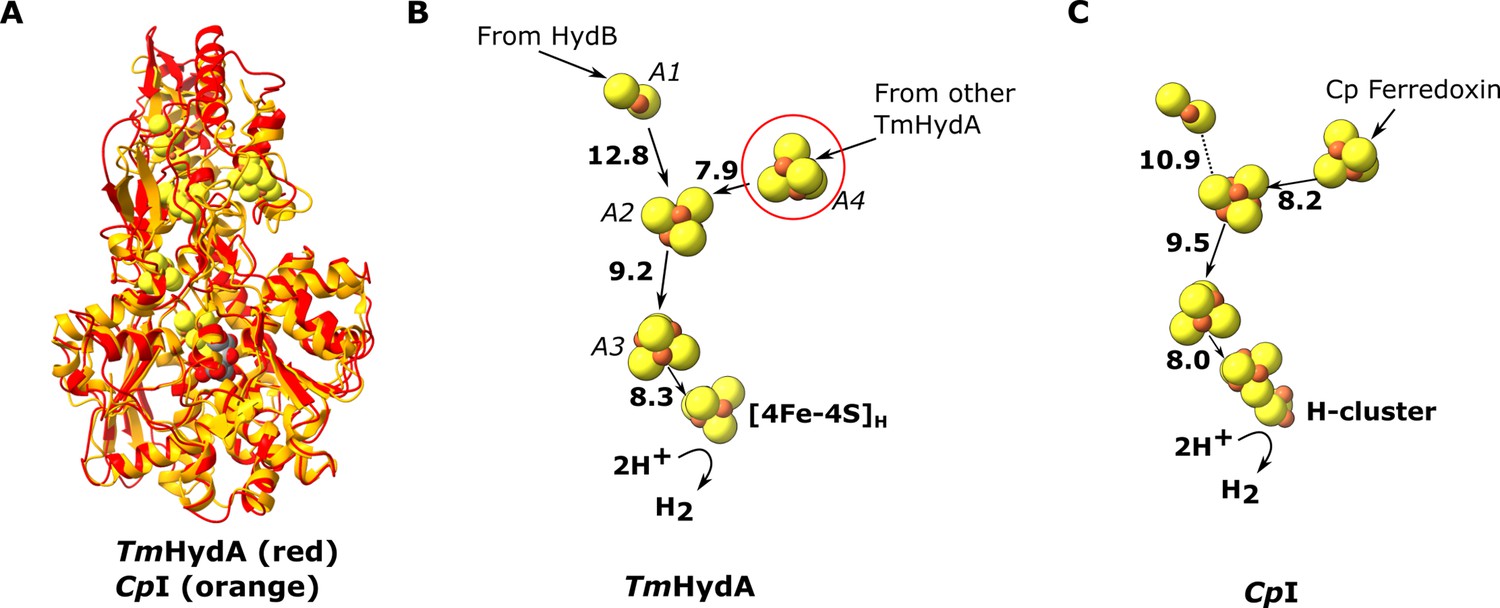
Comparion of the HydA subunit of the electron bifurcating [FeFe] hydrogenase from Thermotoga maritima with the [FeFe] hydrogenase (CpI) from Clostridium pasteurianum.
(A) HydA from Thermotoga maritima (red) compared with CpI hydrogenase from Clostridium pasteurianum (orange) (Artz et al., 2020, PDB: 6N59). (B) Electron transfer network in HydA showing the iron–sulfur cluster that connects adjacent HydABC protomers (red circle). (C) Electron transfer network in CpI, with Cp ferredoxin, predicted to bind closely to the [4Fe–4S] cluster on the right (Artz et al., 2017), although the [2Fe–2S] cluster has also been suggested (Gauquelin et al., 2018). Note that only the [4Fe–4S]H subcluster of the H-cluster is present in our TmHydA structure, whereas the complete H-cluster including the [2Fe]H subcluster is present in the CpI structure. Edge-to-edge electron transfer distances are indicated in bold. The 2H+/H2 interconversion reaction in (B) illustrates the site at which this reaction occurs, but this will only occur in the full assembled H-cluster including [2Fe]H.
Figure 3—figure supplement 1

Comparison of the region around the H-cluster in the [FeFe] hydrogenase from Clostridium pasteurianum (CpI, gray, PDB ID 6N59) with the region around [4Fe–4S]H in apo-HydABC (pink).
The [2Fe]H subcluser is only shown for the CpI structure as it is lacking in apo-HydABC.
Figure 4 with 2 supplements
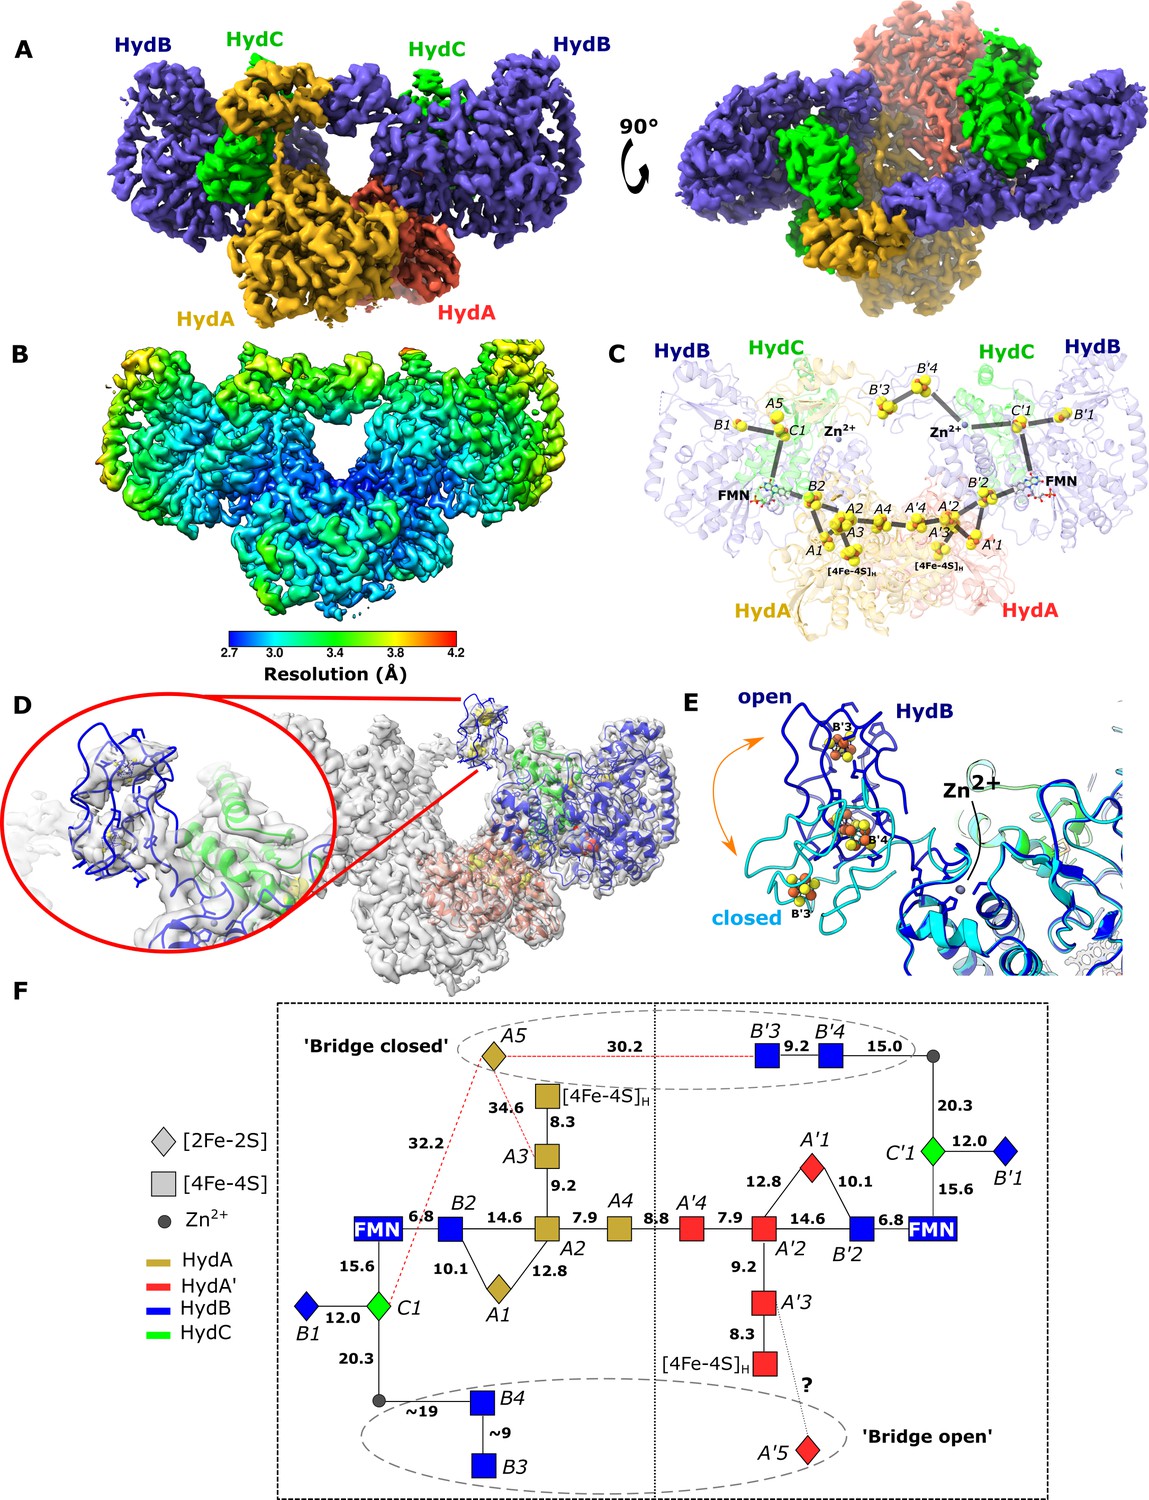
Cryo-EM structures of the closed-bridge and open-bridge conformations of HydABC from Thermotoga maritima.
(A) The unsharpened 2.8 Å map of the bridge forward class subparticle, identical to the bridge backward class if a C2 rotation is applied. The map shows only the Hyd(ABC)2 unit as the two Hyd(ABC)2 units constituting the Hyd(ABC)4 complex were found to be independent after 3D classification. All four copies of HydB and C are colored blue and green, respectively. The two HydA copies are in light brown and light red. (B) Local resolutions were estimated using the local resolution function in RELION with default parameters. (C) The atomic model that was built into the map density with the iron–sulfur electron transfer chain. (D) Map showing the HydB bridge domain in the open position and its fitted model. (E) Zn2+ hinge region, showing the two possible conformations of the HydB bridge domain, open (blue) and closed (light blue). (F) Schematic of the electron transfer network of one of the two identical Hyd(ABC)2 units showing edge-to-edge distances (Å) between the components. Represented are the iron–sulfur clusters, [4Fe–4S]H subcluster of the H-cluster, flavin mononucleotide FMN, and Zn2+ site; the bridge components and Zn site are enclosed in a dashed ellipse. Each of the two HydABC protomers constituting the Hyd(ABC)2 unit is included within a dashed rectangle. Here, the top bridge is represented in its closed conformation, while the bottom one is in its open conformation. Note that our structure is of the apo-HydABC and lacks the [2Fe]H subcluster of the H-cluster.
Figure 4—figure supplement 1
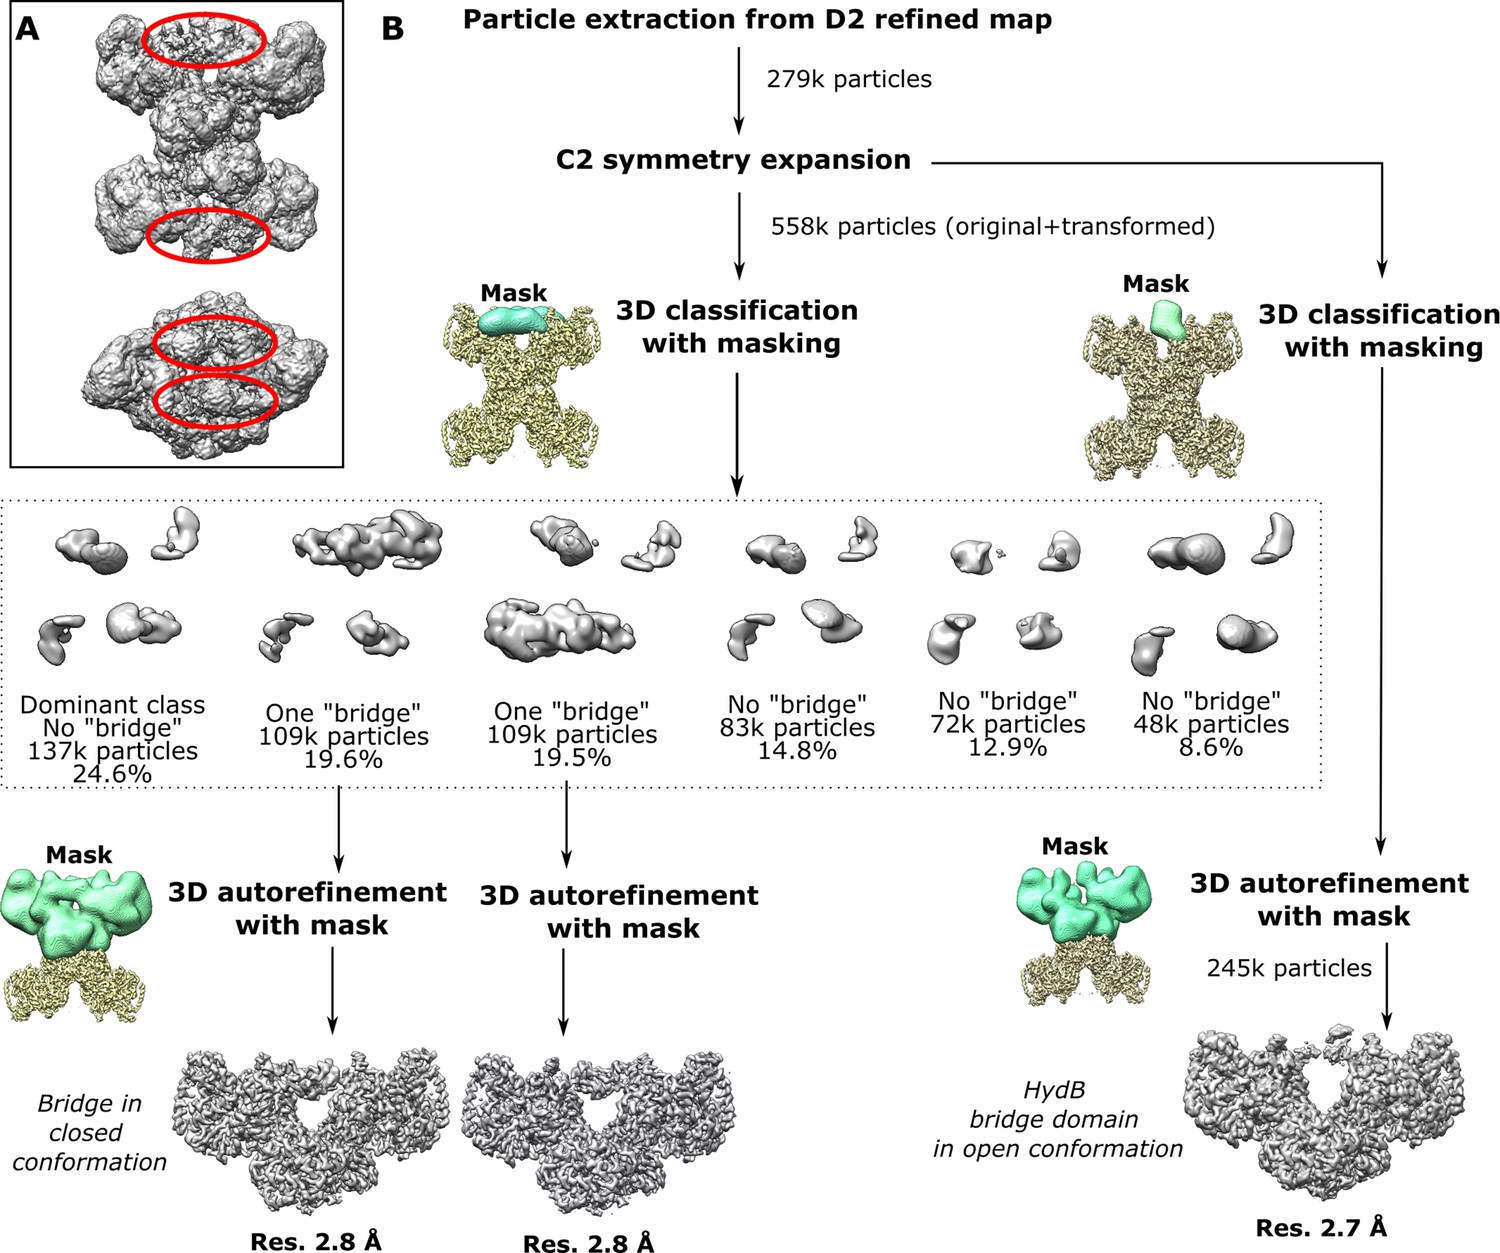
Classification and refinement of the symmetry expanded cryo-EM density maps for TmHydABC using the RELION pipeline.
(A) Map at low-density threshold shows blurry regions between the HydBC lobes (red circle). (B) Symmetry expansion, classification, and refinement using the extracted particles from the high-resolution D2 map using RELION pipeline. Following particle extraction, C2 symmetry expansion was applied, effectively doubling the dataset and allowing independent classification of the two subparticles top and bottom (Hyd(ABC)2 units) in each Hyd(ABC)4 complex. 3D classification of the expanded dataset with masking revealed two classes with a clear bridging density. Those two classes were refined separately revealing a bridge backward and forward conformation.
Figure 4—figure supplement 2
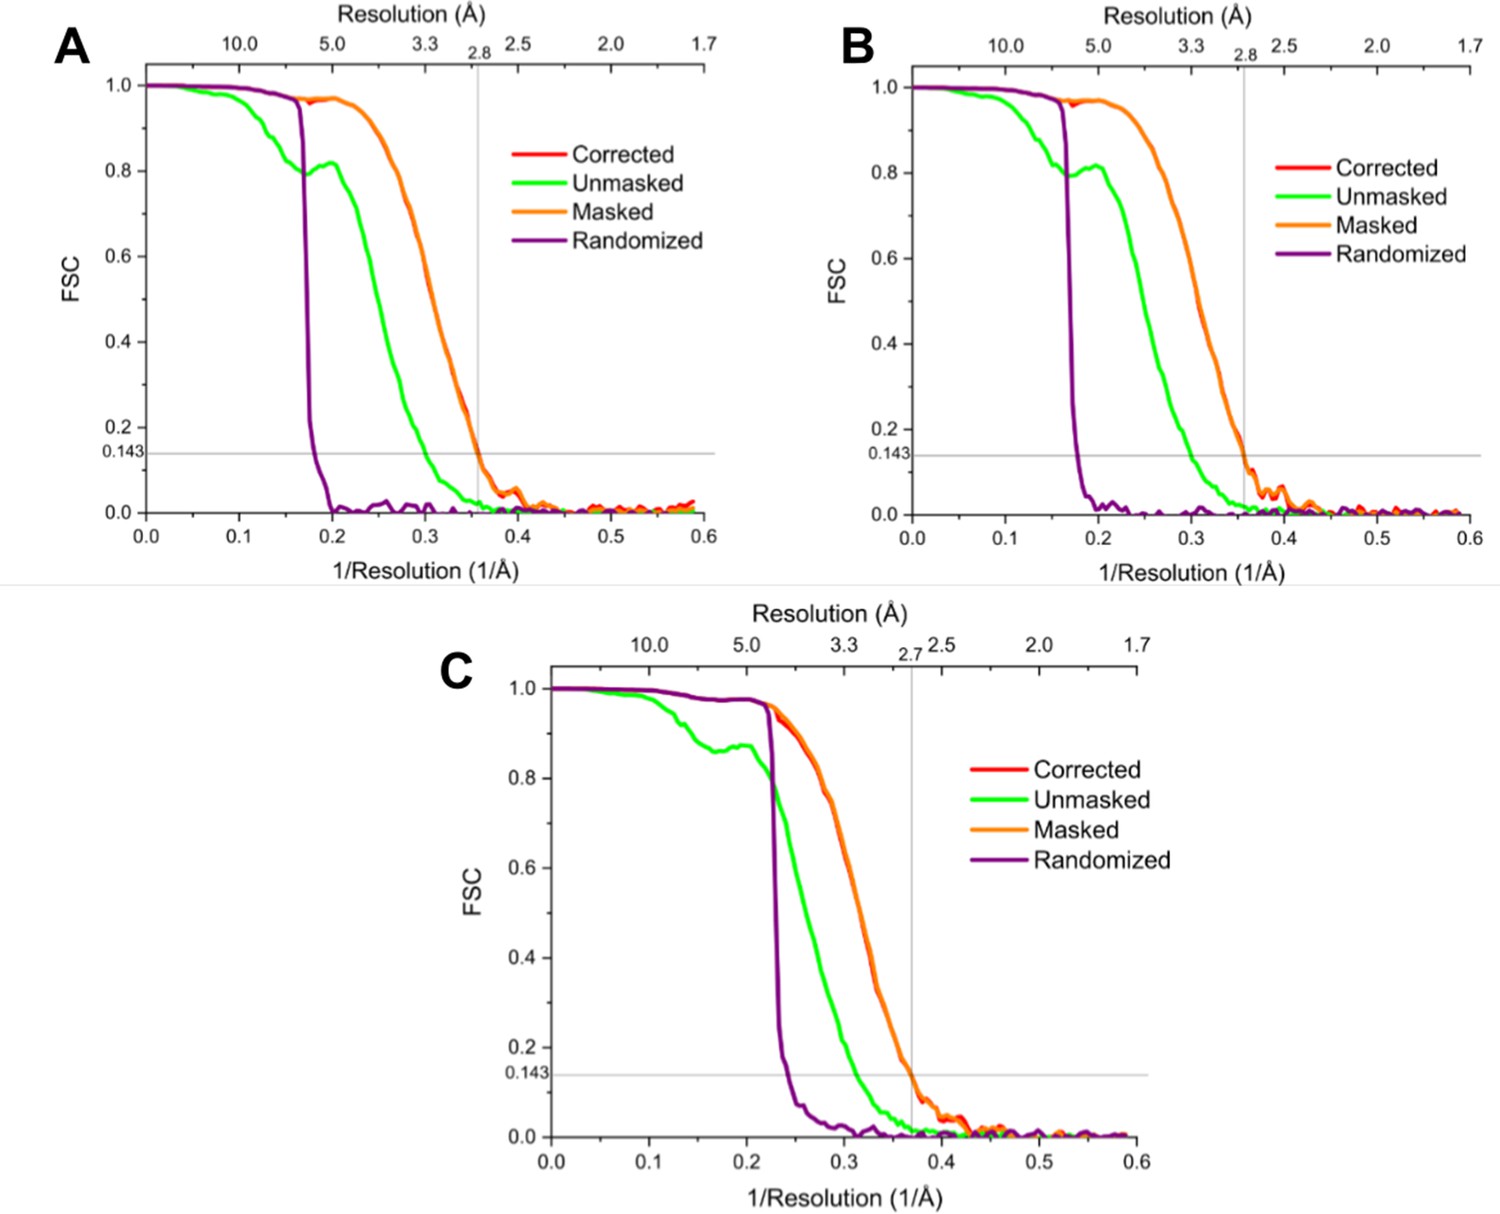
Fourier shell correlation (FSC) curves of the symmetry expanded maps.
Fourier shell correlation (FSC) curves showing the resolution of (A, B) the ‘bridge closed’ maps, both reaching a resolution of 2.8 Å and (C), the ‘bridge open’ map, reaching a resolution of 2.7 Å (although note that the bridge is much less well resolved than the core in this particular map).
Figure 5 with 1 supplement
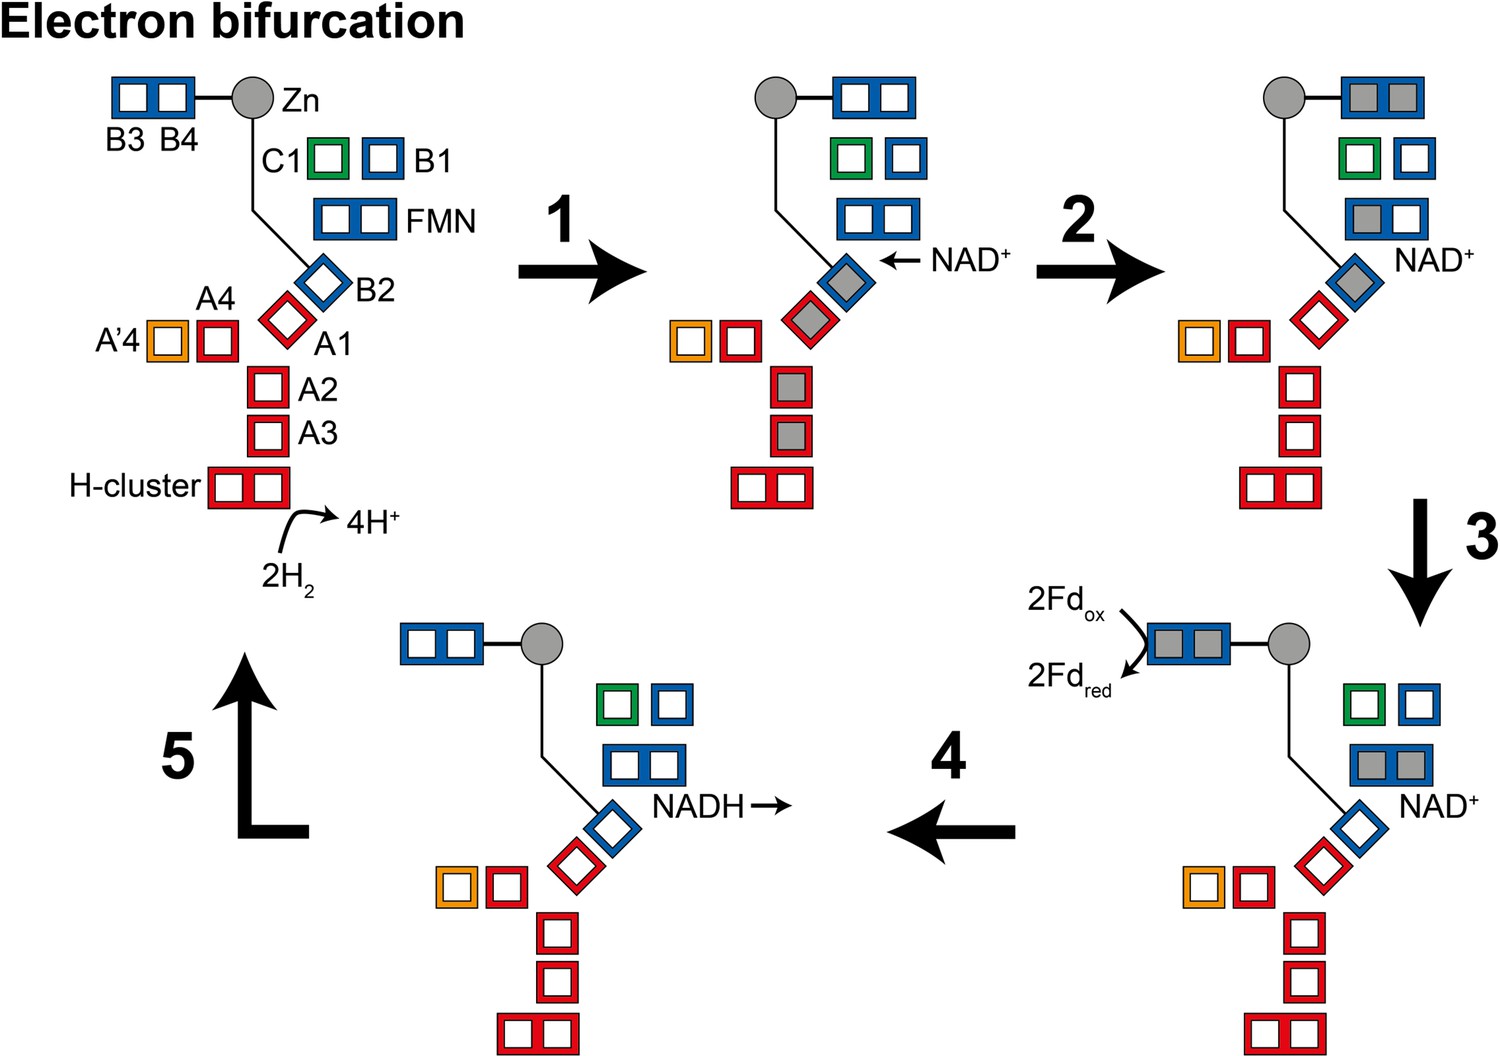
Illustration of a possible mechanism of electron transfer in HydABC during electron bifurcation.
(1) Electrons generated by oxidation of H2 at the H-cluster travel down the core electron transfer pathway to the B2 cluster but not to the flavin mononucleotide (FMN). Reduction of the B2 cluster triggers bridge movement allowing the B3/B4 clusters to get close to the B1 and C1 clusters. (2) NAD+ binding stabilizes the FMN•− radical allowing electron transfer to the FMN, then to the B1/C1 clusters, and finally to the B3 and B4 clusters. (3) The bridge domain then returns to the closed position allowing reduction of ferredoxin. (4) Domain movement triggers the FMN to get fully reduced to the FMNH− state, which can then reduce NAD+ to NADH. (5) NADH is released and the enzyme returns to its initial state. The reverse, electron confurcation, direction (NADH and reduced ferredoxin are used to produce H2) is described in Figure 5—figure supplement 1. Color code: red regions are in HydA, orange regions are in HydA’, blue regions are in HydB, and green regions are in HydC. The gray circle indicates the Zn site. Gray squares represent the location of electrons.
Figure 5—figure supplement 1
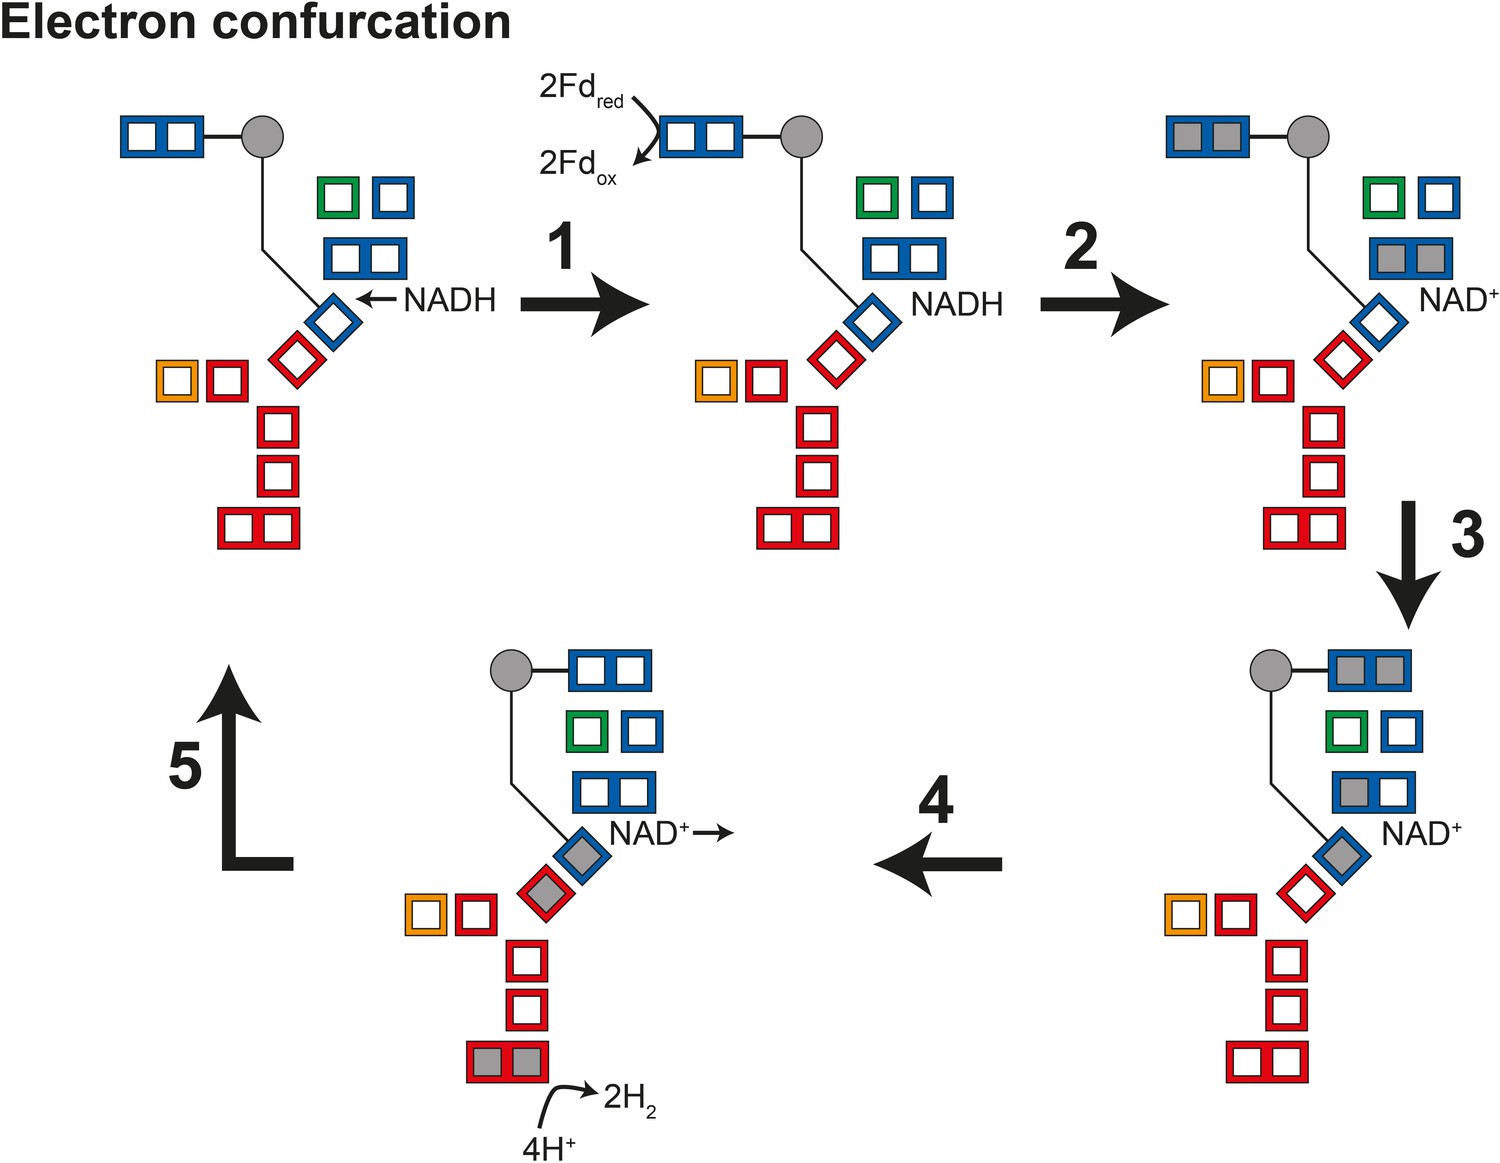
Illustration of a possible mechanism of electron transfer in HydABC during electron confurcation.
(1) NADH binds. (2) Two ferredoxin are oxidized by the B3/B4 clusters while the bridge is closed and hydride transfer occurs from NADH to flavin mononucleotide (FMN) giving FMNH−FMNH−. (3) Electron transfer to the B2 cluster to give an FMN•− radical, which is stabilized by NAD+. Reduction of the B2 cluster triggers the HydB-CT domain to open and move to a position close to the B1/C1 clusters. (4) Electrons are then transferred from B3/B4 to the H-cluster via B1/C1, the FMN, and the core electron transfer pathway. (5) The electrons in the core electron transfer pathway reduce 4H+ to H2. Oxidation of the FMN•− radical triggers NAD+ dissociation and oxidation of the B2 cluster triggers the bridge to close again returning the enzyme to its initial state.
Videos
Video 1
In the first few frames the cryo-EM structure of the heterododecameric Hyd(ABC)4 complex overlaid (7P5H) with the cryo-EM map can be seen rotating around the central vertical axis.
The cryo-EM map then fades to reveal the structural model with the protein represented in the ribbon mode (HydA in the center in red, pink, green, and orange, HydB in blue, and HydC in yellow) and the cofactors shown as spheres. After rotation, again around the central vertical axis, the ribbon structure fades to reveal the iron–sulfur cluster cofactors as yellow and brown spheres, the zinc sites as gray spheres, and the flavin mononucleotide (FMN) as sticks. It is clear to see that the redox cofactors in the top and bottom halves of the dodecamer are separated by a large distance, too large for efficient electron transfer. Thus, the two redox cofactor networks cannot exchange electrons with each other. It is also clear that there is a core electron transfer pathway linking the FMN sites and a peripheral electron transfer pathway consisting of two iron–sulfur clusters on the other side of the FMN from the core pathway. Finally, the video centers on the region around one of the FMN cofactors for a closer view.
Video 2
In this movie, the conformational change observed between the ‘Bridge closed forward’ (7P8N) and ‘Open bridge’ (7PN2) classes is shown.
The HydB C-terminal iron–sulfur cluster domain is colored blue and the HydA C-terminal iron–sulfur cluster domain is colored orange. The zinc ion (gray sphere) and ligating residues (three cysteine ligands and one histidine) are also shown. The location of the HydA C-terminal domain when the bridge is open is unknown so it is shown transparently in both states for reference.
Tables
Key resources table
| Reagent type (species) or resource | Designation | Source or reference | Identifiers | Additional information |
|---|---|---|---|---|
| Strain, strain background (Escherichia coli) | BL21(DE3)ΔiscR/pASK-IBA17plus/hydabc | Chongdar et al., 2020 | n/a | A genetically modified strain of E. coli containing a kanamycin resistance cassette inserted in the iscR gene and transformed with a pASK-IBA17plus plasmid containing the hydabc protein-coding DNA sequence |
| Chemical compound, drug | Strep-Tactin Superflow high capacity resin | IBA-life sciences | 2-1208-025 | Used for purification of TmHydABC |
| Software, algorithm | RELION-3.1 | Zivanov et al., 2019 | n/a | Image processing |
| Software, algorithm | WinCoot | Emsley et al., 2010 | n/a | Modeling |
| Software, algorithm | Phenix | Liebschner et al., 2019 | n/a | Model refinement |
| Software, algorithm | ChimeraX 1.1 | Pettersen et al., 2021 | n/a | Used to visualize maps and models and to make the figures in this paper |
| Software, algorithm | EasySpin 5.2.35 | Stoll and Schweiger, 2006 | n/a | Used to simulate EPR spectra |
| Other | UltrAuFoil R 1.2/1.3 Gold foil on Gold 300 mesh grid | Quantifoil Micro Tools GmbH | n/a | Used to prepare cryo-EM grids |
Additional files
-
Supplementary file 1
Tables summarizing the structural features of HydABC from Thermotoga maritima and the cryo-EM data collection and refinement statistics.
(a) Table summarizing the buried surface area (in Å2), number of salt bridges and number of hydrogen (H-)bonds between the various interacting partners in the heterododecameric Hyd(ABC)4 complex.
(b) Table summarizing the cryo-EM data collection and refinement statistics of the four structural models presented in this work: (1) the D2 tetramer of trimers model (PDB ID: 7P5H), (2) the bridge closed forward model (PDB ID: 7P8N), (3) the bridge closed reverse model (PDB ID: 7P91), and (4) the open bridge model (PDB ID: 7P92).
- https://cdn.elifesciences.org/articles/79361/elife-79361-supp1-v2.docx
-
MDAR checklist
- https://cdn.elifesciences.org/articles/79361/elife-79361-mdarchecklist1-v2.pdf
Download links
A two-part list of links to download the article, or parts of the article, in various formats.
Downloads (link to download the article as PDF)
Open citations (links to open the citations from this article in various online reference manager services)
Cite this article (links to download the citations from this article in formats compatible with various reference manager tools)
Structural insight on the mechanism of an electron-bifurcating [FeFe] hydrogenase
eLife 11:e79361.
https://doi.org/10.7554/eLife.79361


