Distinct architectural requirements for the parS centromeric sequence of the pSM19035 plasmid partition machinery
- Laboratory of Molecular Biology, National Institute of Diabetes and Digestive and Kidney Diseases, National Institutes of Health, United States
- Departamento de Biotecnología Microbiana, Centro Nacional de Biotecnología, Consejo Superior de Investigaciones Científicas, Spain
Figures
Figure 1 with 3 supplements

ParApSM ATPase activation by ParBpSM, parSpSM, and nsDNA.
(A) Efficient activation of ParApSM ATPase by ParBpSM exhibits critical dependency on parSpSM heptad-sequence-repeat number. The ATPase reactions contained ParApSM (2 μM), pBR322 DNA (60 μM in bp, unless noted otherwise), ParBpSM (at the concentration indicated), and parSpSM duplex substrates (4.4 μM of the 7 bp consensus sequence repeats) or equal amount of a scrambled sequence duplex (scram). (B) Comparison of parSpSM containing four contiguous repeats with different heptad orientation arrangements. (C) parSpSM containing different heptad arrangements of three contiguous repeats and two contiguous triple heptad repeats with a gap fails to fully activate the ParApSM ATPase. (D) 7R-parSpSM concentration dependence of ParApSM ATPase activity. Reaction mixtures contained ParApSM (2 μM), ParBpSM (2 μM), pBR322 DNA (60 μM in bp), and increasing concentration of 7R-parSpSM duplex (duplex fragment concentration shown, the ratio of parSpSM heptad repeat sequence to ParBpSM dimers are indicated on top). (E) The numbers and arrangement of the heptad repeats of the parSpSM fragments used in this study (also see Figure 1—figure supplement 2). Data points represent means and standard errors of mean (SEM) of N repeated experiments (N* represents repeats for majority of data points, see Figure 1—source data 1 for details). Curves were fitted after subtraction of the background in the absence of ParApSM to an equation v-v0 = (vmax[B]n)/(KAn + [B]n). The maximum turnover rates (vmax) cited in the text represent mean ± 95% confidence intervals (symmetrized to the larger estimated errors from the mean for simplicity).
Figure 1—figure supplement 1
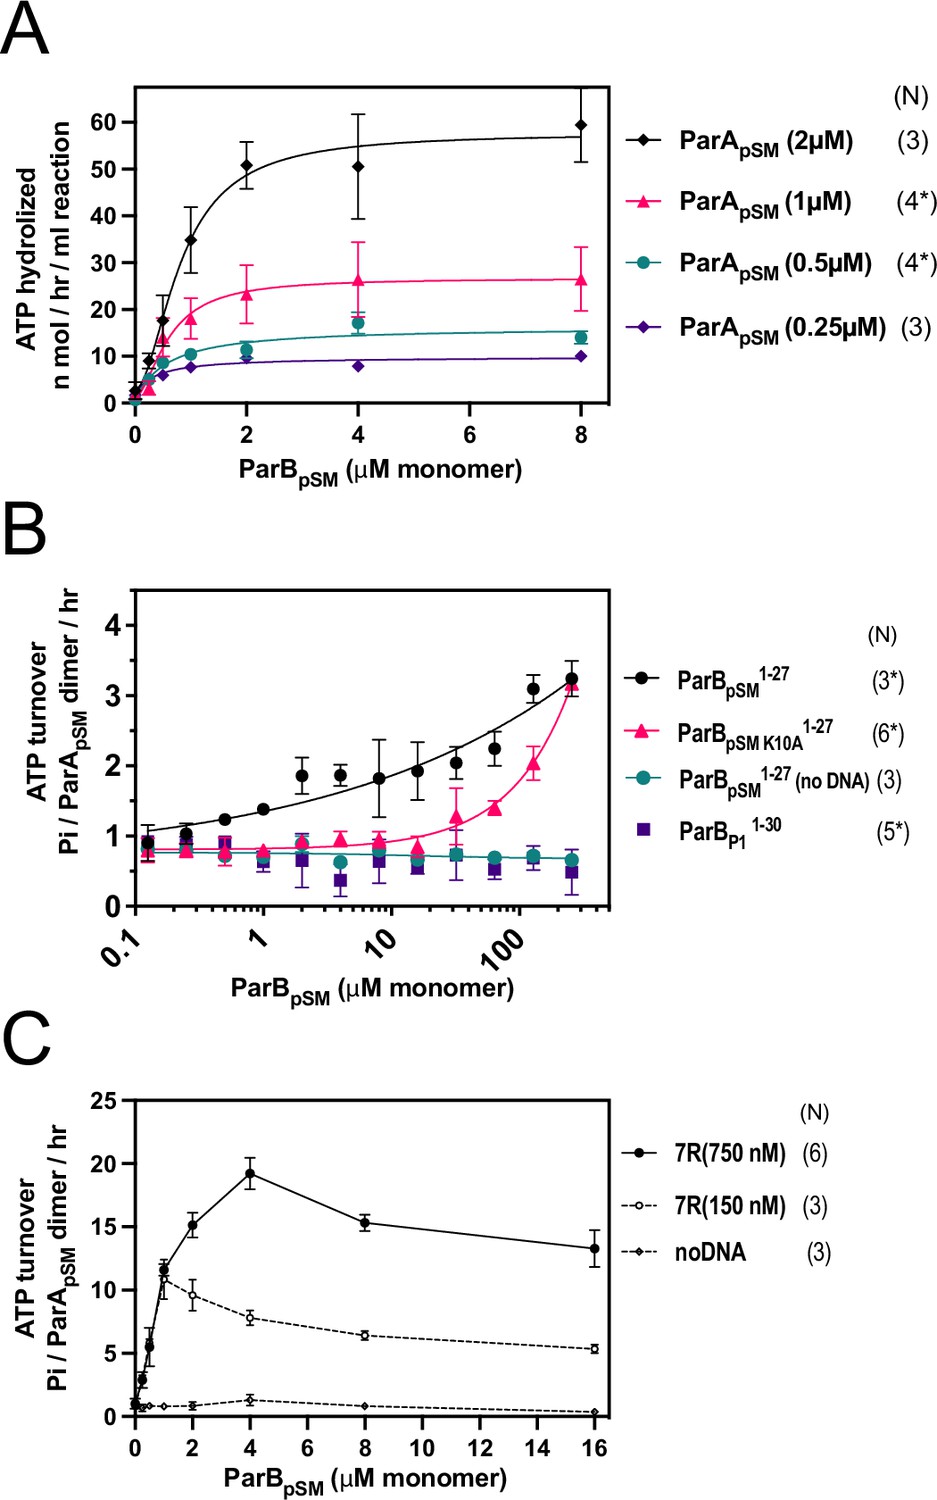
ParApSM-ATPase stimulation by ParBpSM at different ParApSM concentrations, ParBpSM1-27, and ParBpSM-7R-parSpSM in the absence of nsDNA.
(A) The ATPase reactions contained ParApSM at concentrations indicated, nonspecific plasmid DNA (30 μM in bp), ParBpSM (at the concentration indicated), and 7R-parSpSM duplex (34.6 μM in bp or 4.4 μM of the ParBpSM-binding consensus sequence). (B) The ParBpSM1-27 (black circles) and its variant K10A (red triangles) weakly stimulated ParApSM ATPase (2 μM) in the presence of nsDNA. No stimulation was observed with ParBP11-30, which specifically interacts with P1 plasmid ParAP1 (purple square) or when nsDNA was omitted from the reaction (green circle). (C) Reactions with two concentrations of 7R-parSpSM dsDNA fragment, 0.75 μM (filled circles) and 0.15 μM (open circles) in parSpSM fragment concentration (or ~5 μΜ and ~1 μΜ of the ParBpSM-binding consensus sequence) in the absence of nsDNA were compared in the presence of a range of ParBpSM concentrations indicated. Data points represent means and standard errors of mean (SEM) of N repeated experiments (N* represents repeats for majority of data points; see Figure 1—figure supplement 1—source data 1).
-
Figure 1—figure supplement 1—source data 1
- https://cdn.elifesciences.org/articles/79480/elife-79480-fig1-figsupp1-data1-v3.xlsx
Figure 1—figure supplement 2
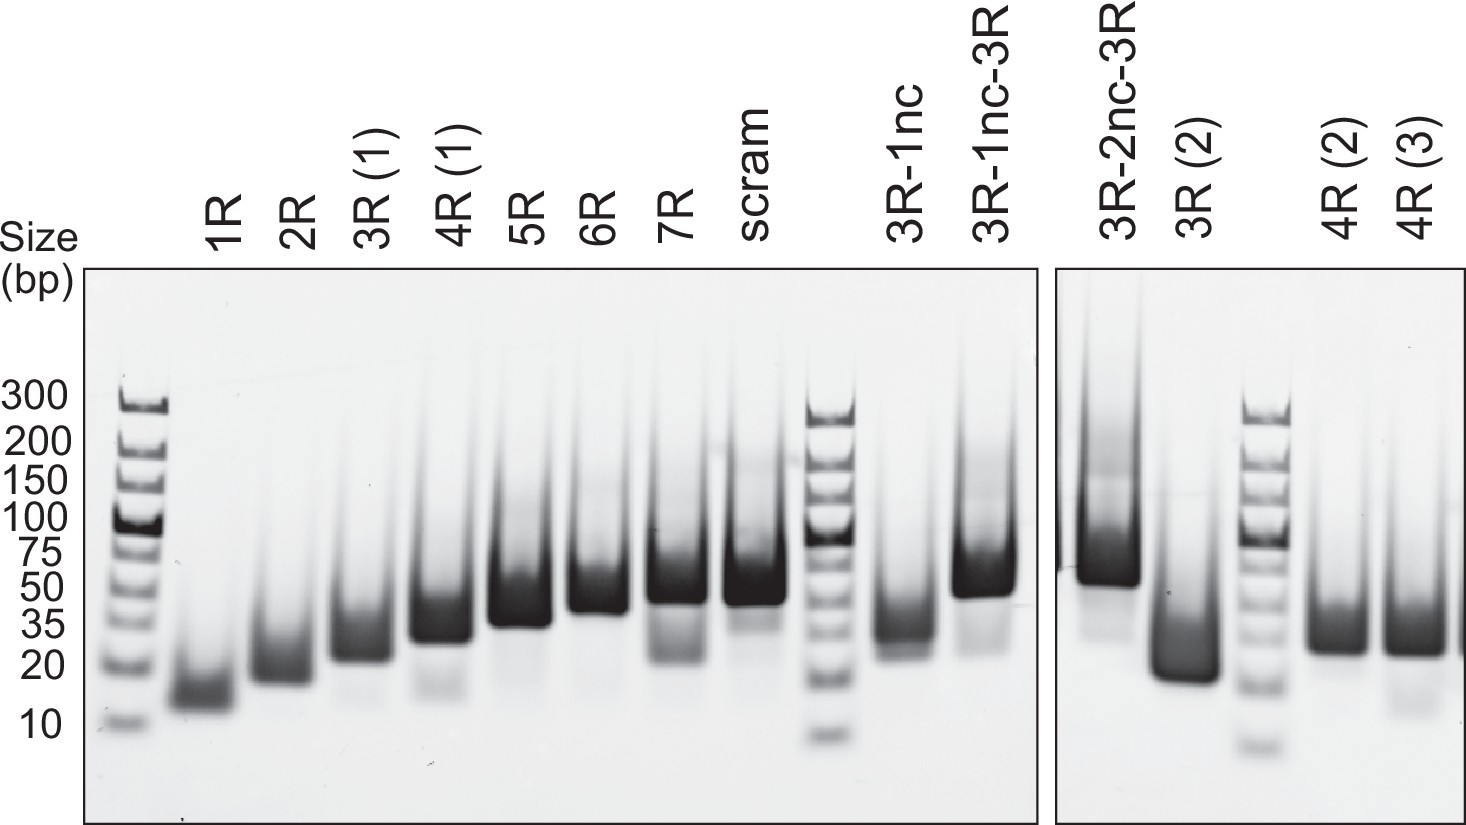
DNA duplex substrates.
Analysis of annealed dsDNA fragments (500 ng per well) used in this study by 6% PAGE stained with EtBr.
-
Figure 1—figure supplement 2—source data 1
- https://cdn.elifesciences.org/articles/79480/elife-79480-fig1-figsupp2-data1-v3.pdf
Figure 1—figure supplement 3
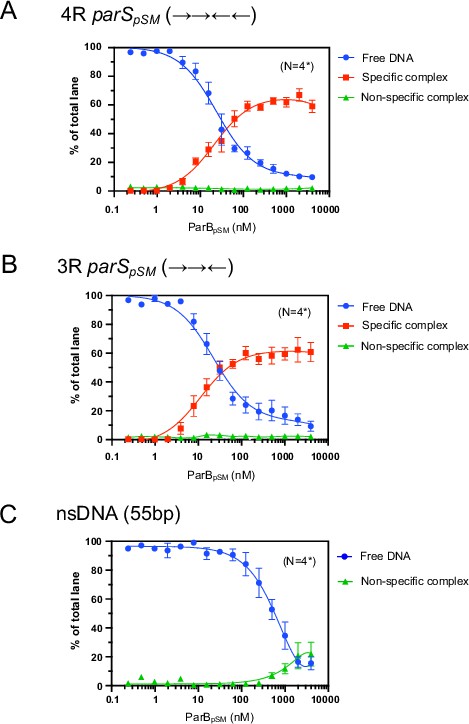
Binding affinity of ParBpSM to 4R- and 3R-parSpSM.
Binding affinity of ParBpSM to 4R- (panel A) and 3R-parSpSM (panel B) was compared to a scrambled sequence DNA fragment (55 bp, nsDNA, panel C) by EMSA. Indicated concentrations of ParBpSM were preincubated with 0.05 nM 32P-labeled DNA substrate in 50 mM Tris–HCl pH 7.4, 100 mM KCl, 2 mM MgCl2, 1 mM DTT at room temperature for 15 min. The samples were analyzed by 4–12% PAGE and autoradiography. The smear between the specific complex and free DNA bands in the gel due to dissociation of the complex during electrophoresis was not included in the analysis but assumed to be proportional to the measured quantity of the specific complex. Significant quantity of nonspecific complex, which stayed at the top of the gel, was detected only at the highest concentrations of ParBpSM with nsDNA. Data points represent means and standard errors of mean (SEM) of N repeated experiments (N* represents repeats for majority of data points, see Figure 1—figure supplement 3—source data 1 for details.)
-
Figure 1—figure supplement 3—source data 1
- https://cdn.elifesciences.org/articles/79480/elife-79480-fig1-figsupp3-data1-v3.xlsx
Figure 2 with 3 supplements
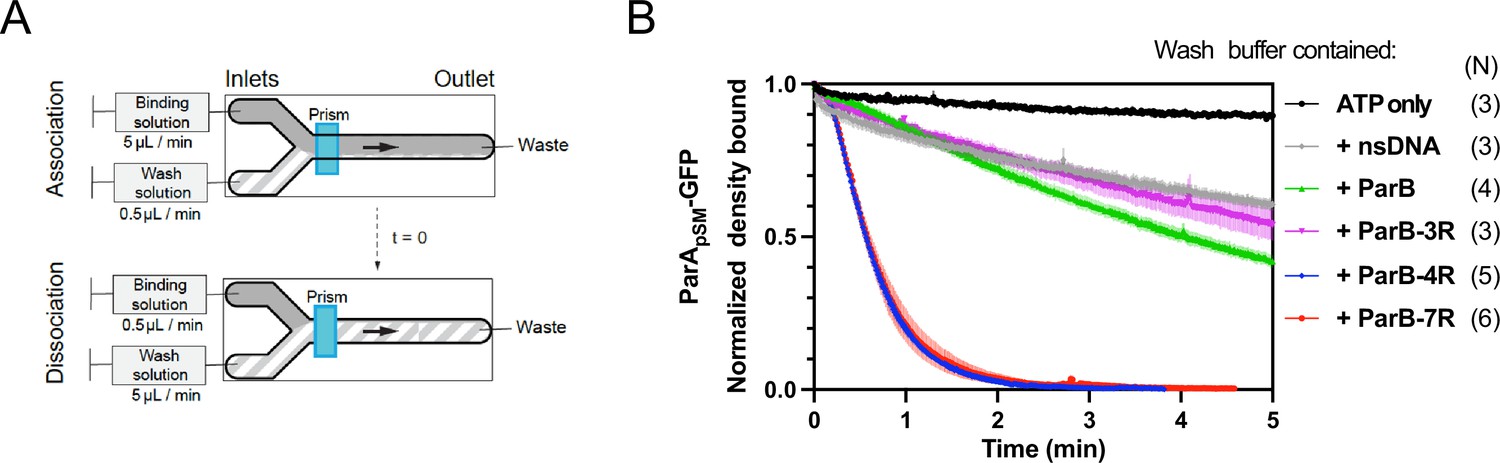
Kinetics of ParApSM disassembly from the nsDNA-carpet.
(A) Schematic of two-inlet flow cell used for visualizing the association and dissociation of fluorescent proteins on nsDNA-carpet. Binding and washing solutions each containing proteins, double-stranded DNA fragments or buffer alone as specified were infused at different flow rates (5 μl/min or 0.5 μl/min) from two inlets on the left into a Y-shaped flow cell. At the middle of the flow channel just downstream of the flow convergence point where the observations are made, content of the faster infusion syringe flows over the observation point. By switching the flow rates of the two syringes, protein binding to the nsDNA-carpet and dissociation during the washing cycle can be recorded. (B) ParBpSM in the presence of parSpSM with at least four contiguous ParBpSM-binding sequence repeats stimulates the ParApSM-GFP dissociation from the nsDNA-carpet. ParApSM-GFP (1 μM) preincubated with 1 mM ATP was infused into the nsDNA-carpeted flow cell at 5 μl/min, while the washing solution containing the specified components was infused at 0.5 μl/min. When the ParApSM-GFP density on the nsDNA-carpet reached 5–10% of the saturation density (t = 0) (~4000 ParApSM dimers/μm2), the flow rates were switched to start the wash with solution containing: buffer alone, 55 bp scramDNA fragment (65 nM in bp), or with ParBpSM (1 μM) without or with different parSpSM fragment (0.5 μM parSpSM heptad repeat sequence). The Y-axis shows the ParApSM-GFP intensity normalized to that at t = 0. Each time point represents the mean with error bar corresponding to the standard errors of mean (SEM) of N repeated experiments.
Figure 2—figure supplement 1
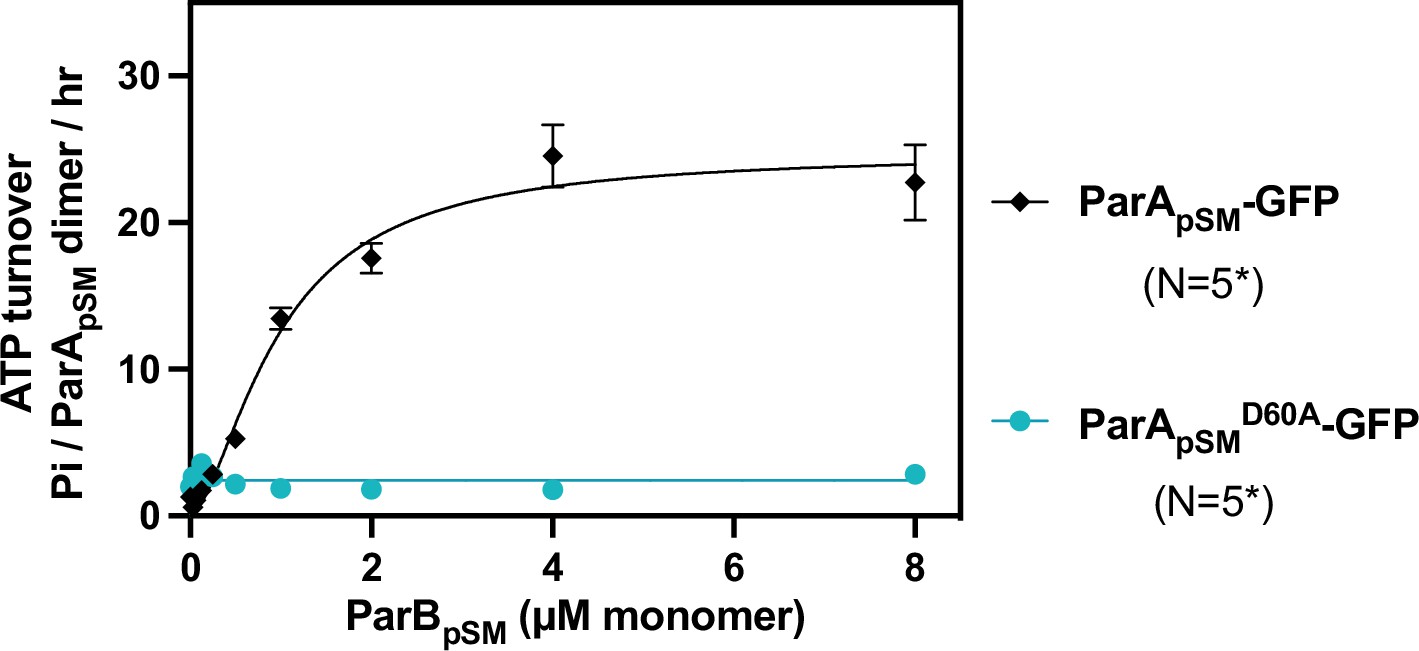
ATPase activity of ParApSM-GFP and the hydrolysis-deficient ParApSMD60E-GFP.
The ATPase reaction contained 2 μM ParApSM-GFP (black) or ParApSMD60E-GFP (cyan), pBR322 DNA (30 μM bp), ParBpSM-Alexa647 (1% labeled), and 7R-parSpSM DNA (4.4 μM 7 bp consensus sequence repeats). Measurements are averages of at least three independent measurements, and the error bars represent the standard errors of mean. N* indicates some lower concentrations of ParBpSM were not included in some of the experimental repeats.
-
Figure 2—figure supplement 1—source data 1
- https://cdn.elifesciences.org/articles/79480/elife-79480-fig2-figsupp1-data1-v3.xlsx
Figure 2—figure supplement 2
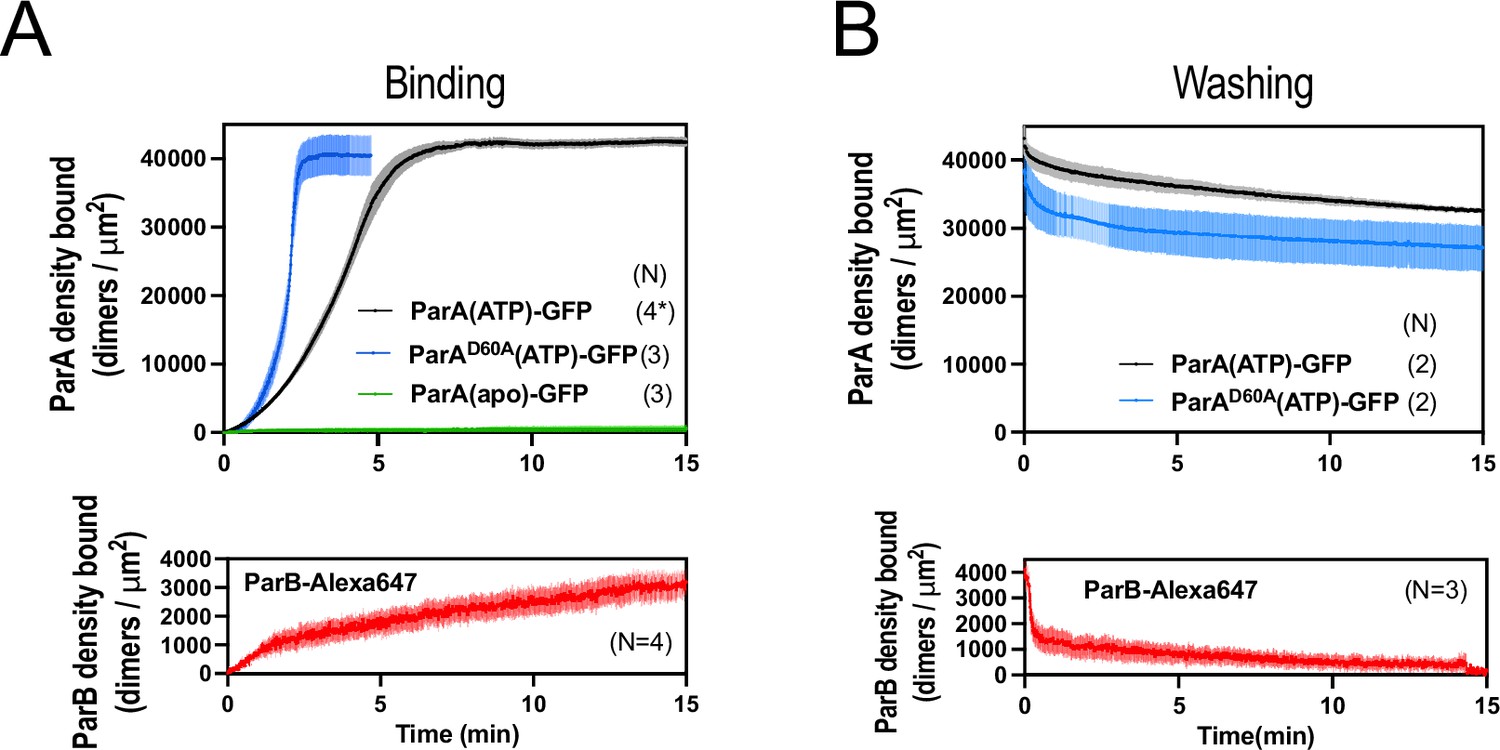
ParApSM, ParApSMD60E, and ParBpSM interactions with the DNA-carpet measured each separately.
(A) ParApSM-GFP, ParApSMD60E-GFP (top) and ParBpSM-Alexa647 (bottom) binding to the nsDNA-carpet separately. ParApSM-GFP (1 μM, black), ParApSMD60E-GFP (1 μM, cyan), or ParBpSM-Alexa647 (1% labeled,1 μM, red) were preincubated with 1 mM ATP and separately infused into the nsDNA-carpeted flow cell at 5 μl/min for 15 min. ParApSM-GFP (apo) (green line, top) was without ATP. (B) Dissociation kinetics of proteins separately bound to the nsDNA carpet. ParApSM-GFP (black) and ParApSMD60E-GFP (cyan) (top) or ParBpSM-Alexa647 (bottom, red) densities on the nsDNA-carpet during wash with buffer containing ATP. Each time point represents means and standard errors of mean (vertical spread) of N experiments.
-
Figure 2—figure supplement 2—source data 1
- https://cdn.elifesciences.org/articles/79480/elife-79480-fig2-figsupp2-data1-v3.xlsx
Figure 2—figure supplement 3
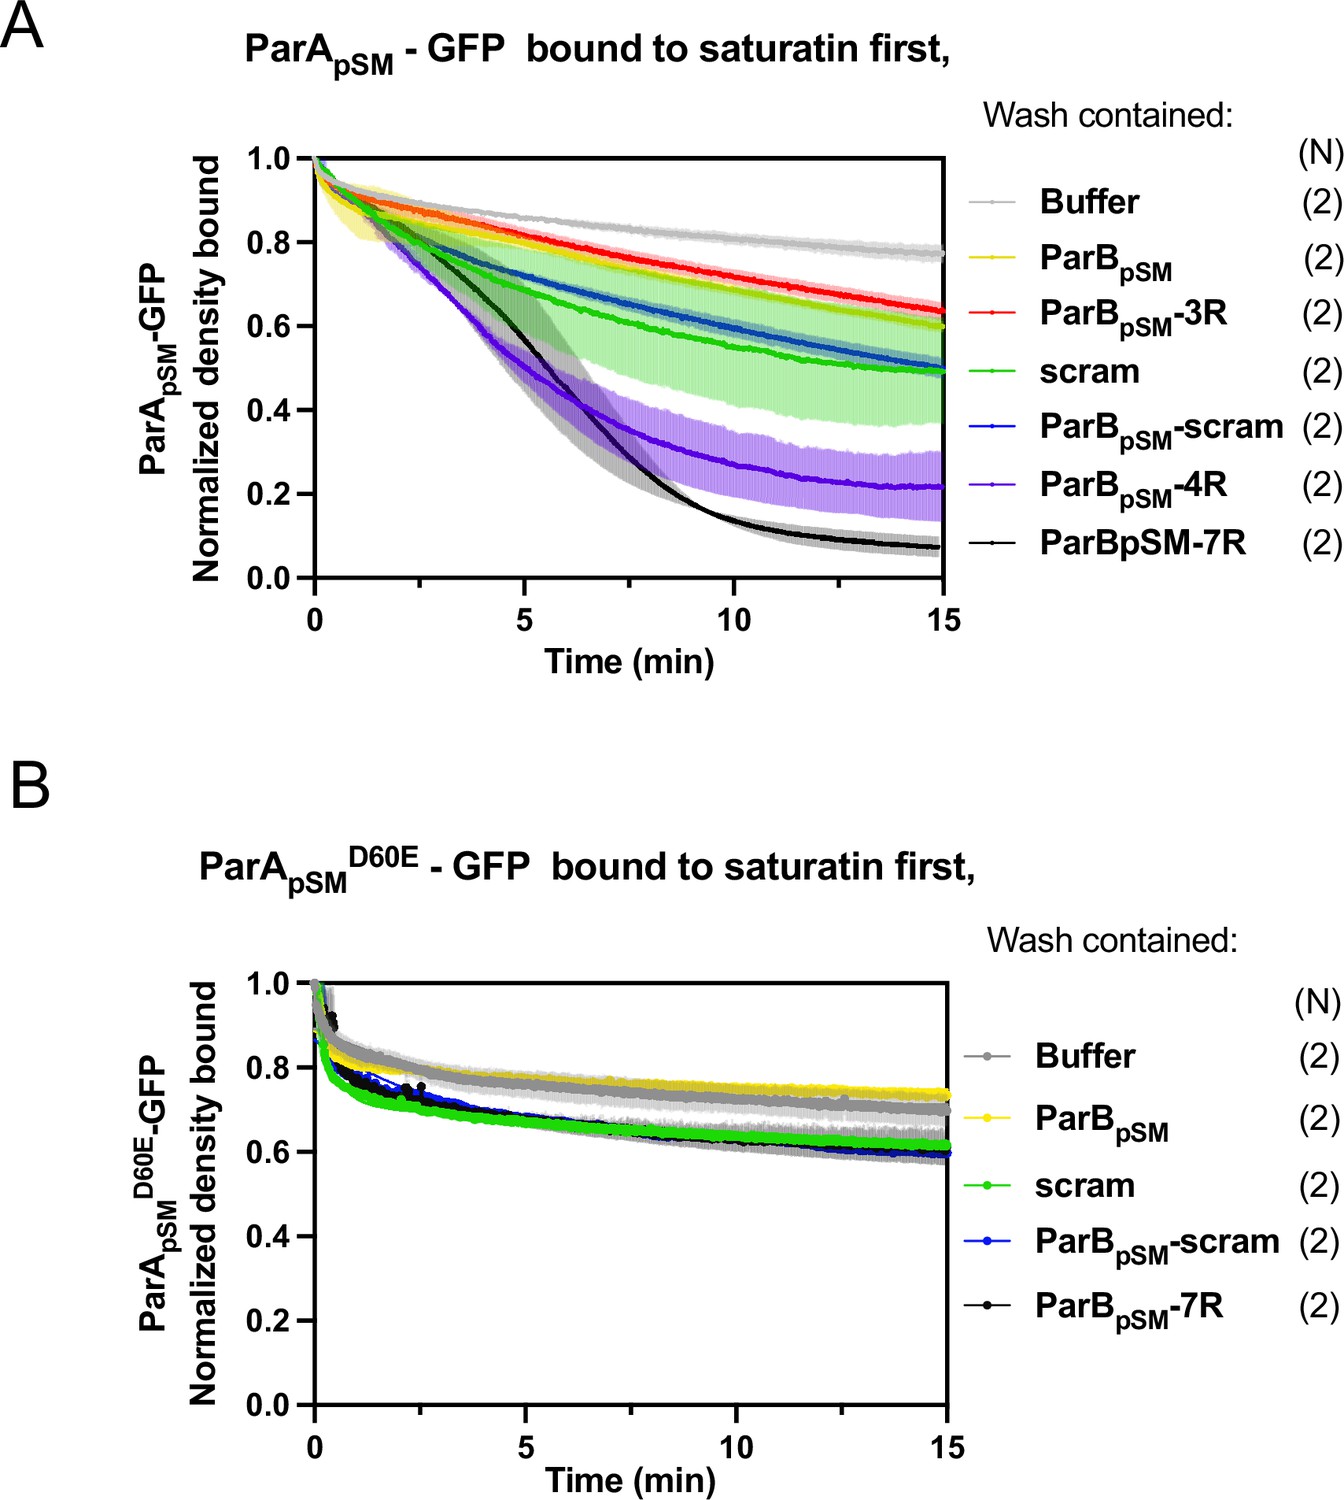
ParBpSM-activated dissociation of ParApSM-GFP or ParApSMD60E-GFP bound to nsDNA-carpet to saturation density.
ParApSM-GFP (A) or ParApSMD60E-GFP (B) (1 μM) was preincubated with 1 mM ATP and infused into the nsDNA-carpeted flow cell at 5 μl/min up to saturation binding. At t = 0, the solution flowing over the observation area was switched to the ATP-containing wash buffer with the indicated cofactors: ParBpSM, 1 μM with or without; 3R-, 4R-, or 7R-parSpSM (0.5 μM consensus sequence), or 55 bp scrambled sequence duplex (5.5 μM in bp) as indicated. ParBpSM and parSpSM fragments were preincubated prior to use. The fluorescence intensity of ParA-GFP proteins were normalized to that at t = 0. Each time point represents means and standard errors of mean (vertical spread) of N experiments.
-
Figure 2—figure supplement 3—source data 1
- https://cdn.elifesciences.org/articles/79480/elife-79480-fig2-figsupp3-data1-v3.xlsx
Figure 3
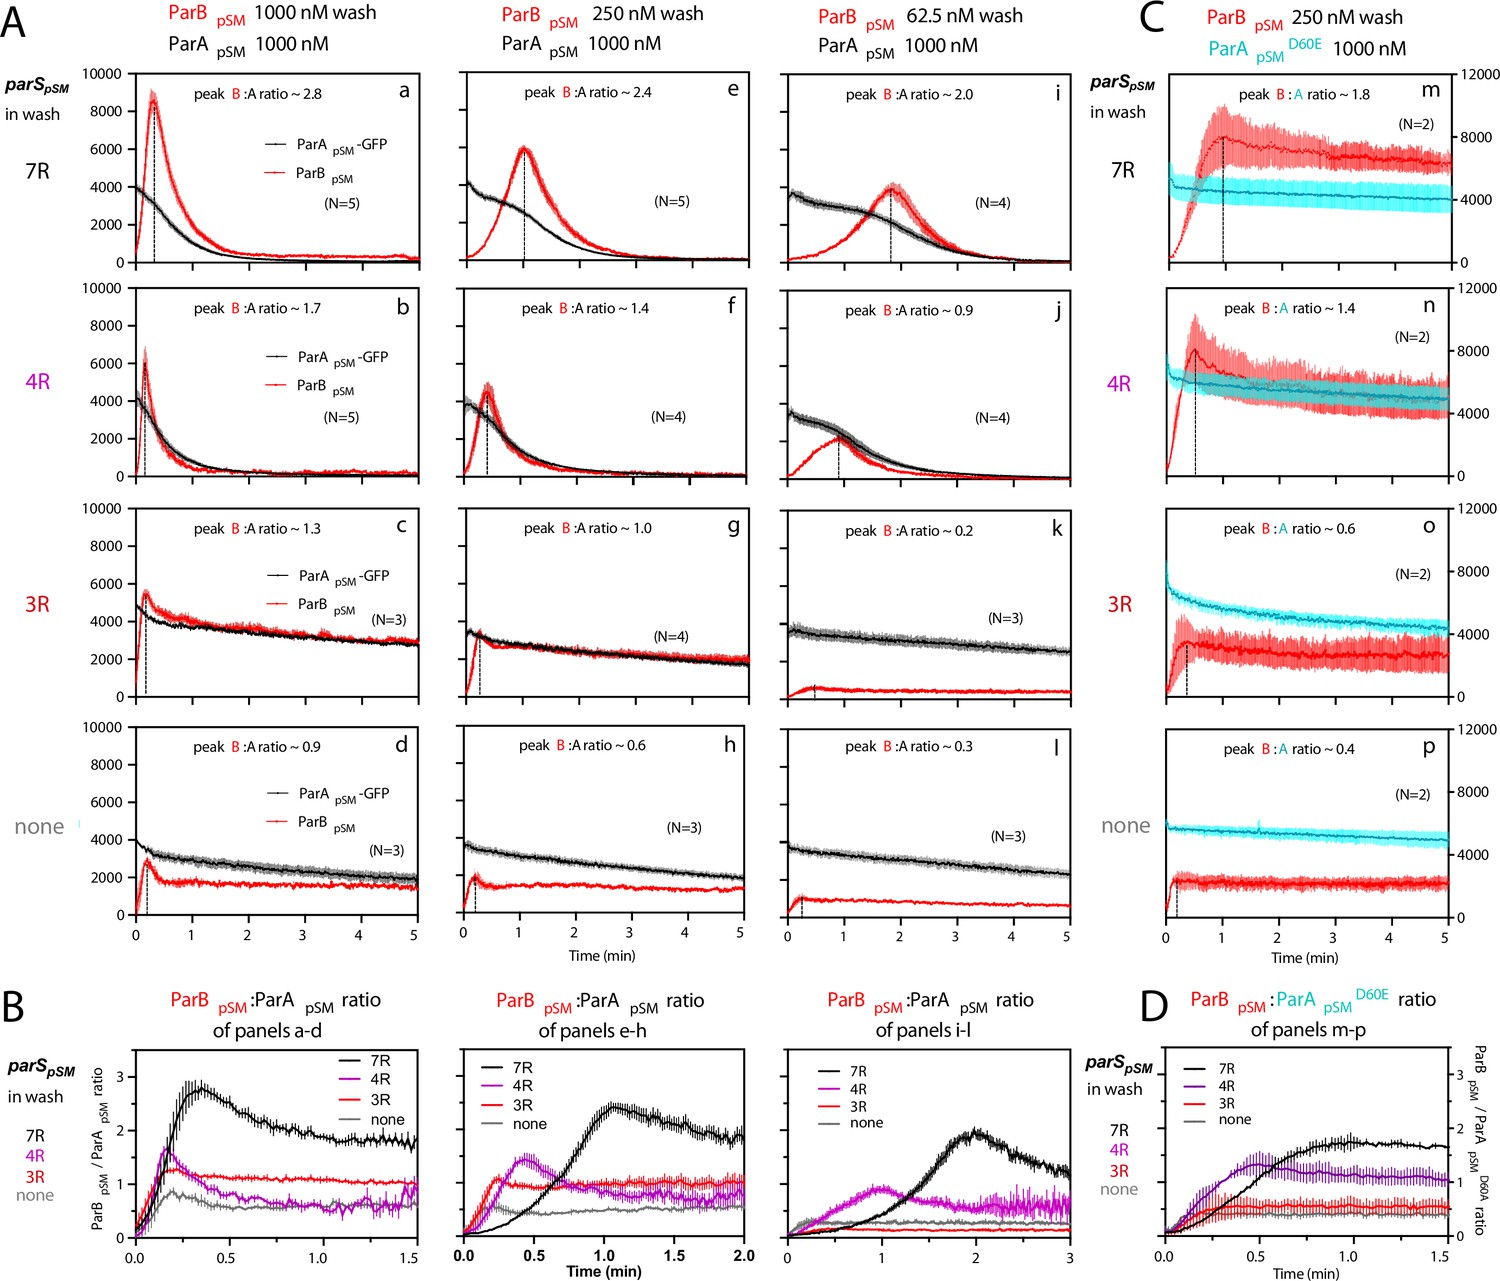
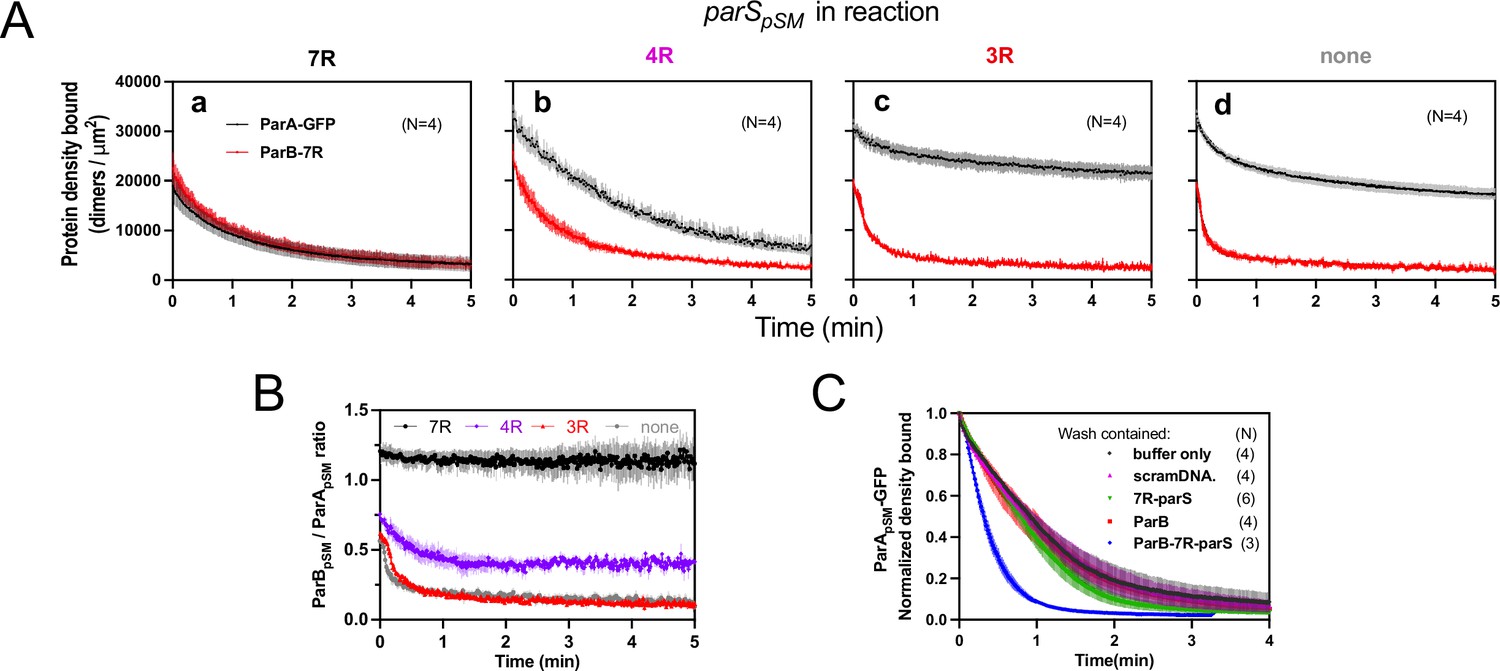
ParBpSM-parSpSM concentration affects kinetics of ATP hydrolysis-dependent ParApSM disassembly from the nsDNA-carpet.
(A) ParApSM-GFP (1 μM) preincubated with 1 mM ATP was infused into the nsDNA-carpeted flow cell at 5 μl/min and when the ParApSM-GFP density on the nsDNA-carpet reached ~10% of the saturation density, the flow over the observation area was switched (t = 0) to wash solution containing ParBpSM ([a–d] 1000 nM, [e–h] 250 nM, or [i–l] 62.5 nM) and the stoichiometric concentration of parSpSM fragments indicated in the ‘parSpSM in wash’ column on the left side of each row of panels. Fluorescence signal was converted to protein density and plotted (dimers/μm2, ParApSM-GFP: black; and ParBpSM-Alexa647: red). Each time point represents mean and standard errors of mean (SEM) (vertical spread) of N repeated experiments. Dashed vertical lines indicate the peak ParBpSM density on the nsDNA-carpet. (B) The time course of the ParBpSM:ParApSM molar ratio (B/A) for the four panels in the columns in (A) with matching ParBpSM concentration with different parSpSM (7R: black; 4R: purple, 3R: red; none: gray) in the wash solution. (C) ATP hydrolysis is required for accelerated ParApSM release from the nsDNA-carpet. The experiments shown in (A) (middle column) were repeated using ParApSMD60E-GFP (1 μM) bound to the nsDNA-carpet and ParBpSM (250 nM) plus parSpSM fragment, (m) 7R, (n) 4R, (o) 3R, or (p) without parSpSM (125 nM heptad concentration) in the wash solution. Fluorescence signal was converted to protein density (dimers/μm2, ParApSMD60E-GFP: cyan; ParBpSM-Alexa647: red) and plotted. Each time point represents mean and SEM (vertical spread) of N experiments. (D) The time course of the ParBpSM:ParApSMD60E molar ratio (B/AD60E) for the four panels of (C) (7R: black; 4R: purple; 3R: red; none: gray). Each time point represents the mean with error bar corresponding to the SEM of N repeated experiments.
Figure 4
Stable ParApSM-ParBpSM complex is formed prior to ATP hydrolysis in the presence of functionally active parSpSM.
(A) ParApSM-GFP (1 μM) and ParBpSM-Alexa647 (1% labeled, 1 μM) were preincubated with ATP (1 mM) plus (a) 7R-, (b) 4R-, (c) 3R-parSpSM, or (d) without parSpSM. The preincubated sample was infused into the nsDNA-carpeted flow cell at 5 μl/min for 15 min and then the solution flowing over the observation area was switched to a buffer containing ATP (t = 0). Fluorescence signals of ParApSM (black) and ParBpSM (red) were converted to protein density on the nsDNA-carpet (dimers per μm2) and plotted. Each time point represents mean and SEM (vertical spread) of N experiments. (B) Time course of the carpet-bound ParBpSM:ParApSM molar ratio for the four panels of (A) (7R: black; 4R: purple; 3R: red; none: gray). (C) Continued supply of ParBpSM and parSpSM in the washing solution is required to sustain high rate of ParApSM disassembly. The experiment in the presence of 7R-parSpSM in panel (Aa) was repeated with addition of ParBpSM and/or 7R-parSpSM in the wash solution. Fluorescence signals of ParApSM were normalized to the value at t = 0. Each time point represents mean and standard errors of mean (SEM) (vertical spread) of N experiments.
Figure 5
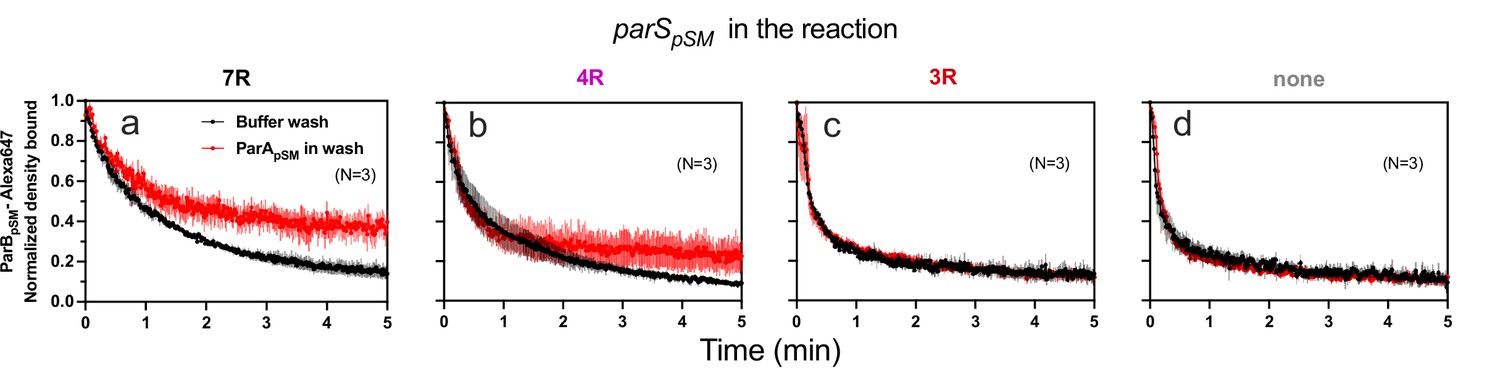
ParApSM-ATP stabilizes functionally active parSpSM-bound ParBpSM on the nsDNA-carpet.
Complexes containing ParApSM-GFP, and ParBpSM-Alexa647 bound to the DNA-carpet together with different parSpSM DNA fragments, (a) 7R, (b) 4R, (c) 3R, or (d) without parSpSM, were washed with either a buffer containing 1 mM ATP (black) or the same buffer containing ParApSM-GFP (0.5 μM, red), in addition to ATP. The ParBpSM-Alexa647 dissociation curves normalized to the protein density at t = 0 were plotted. Each time point represents mean and standard errors of mean (SEM) (vertical spread) of N experiments.
Figure 6
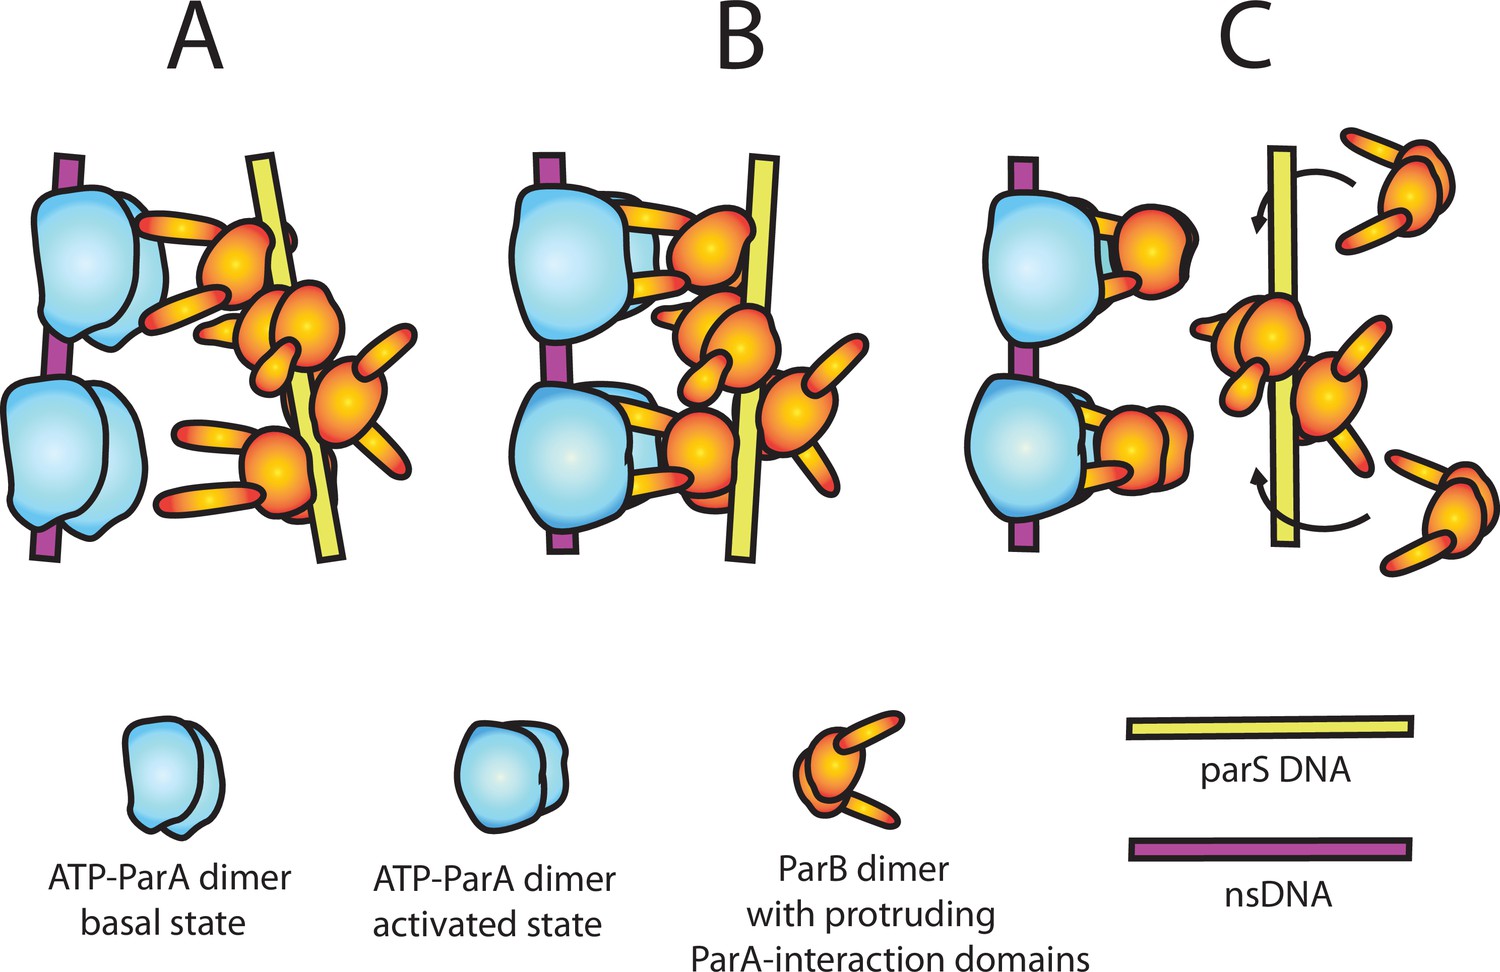
A model of nsDNA-bound ParApSM-ATPase activation by parSpSM-bound ParBpSM.
(A) ParApSM-ATP dimers bound to nsDNA in their basal state can interact with ParA-activation domains protruding from ParBpSM dimers bound to parSpSM sequence repeats. However, multiple ParApSM dimers in a mini-filament cannot simultaneously interact with ParBpSM dimers bound to a set of repeated sequence copies within a parSpSM site and the two proteins dissociate quickly. We propose the interacting pair of proteins at this stage are not fully engaged and these ParApSM dimers are not in the ATPase-activated state. Here, we assume two ParA-interacting domains belonging to one ParBpSM dimer binds one ParApSM dimer. (B) We propose torsional (or other conformational) thermal Brownian dynamics of the mini-filaments allow the ParBpSM dimer at the fourth position to establishes interaction with another ParApSM dimer, locking in the non-equilibrium conformation of the individual mini-filaments prior to the formation of this second bridge. The distortion promotes conformational transition of the ParApSM dimers to the ATPase active state with fully engaged ParBpSM. (C) The conformational transition also destabilizes ParBpSM-parS interaction, releasing the parSpSM DNA from the activated nsDNA-ParApSM-ParBpSM complex prior to ATP hydrolysis and disassembly of the complex. This allows reloading of fresh ParBpSM to the released parSpSM, which recycles to disassemble the remaining ParApSM on the nsDNA. Meanwhile, fully engaged ParBpSM dimers left on the ParApSM dimers cause ATP hydrolysis and disassemble ParApSM dimers from nsDNA.
Tables
Table 1
The accelerated ParApSM dissociation phase of the curves in Figure 3Aa,c,i and b,f,j after the peak ParBpSM/ParApSM ratio points were fitted to single exponential curves to estimate the koff values.
The means with error bars corresponding to the standard errors of mean (SEM) of N repeated experiments in Figure 3 are shown.
| [ParBpSM] (nM) | 7R-parSpSM | 4R-parSpSM |
|---|---|---|
| ParApSM koff (min–1) | ParApSM koff (min–1) | |
| 1000 | 1.808 ± 0.045 | 1.909 ± 0.057 |
| 250 | 1.495 ± 0.024 | 1.462 ± 0.040 |
| 62.5 | 1.184 ± 0.041 | 1.101 ± 0.033 |
Key resources table
| Reagent type (species) or resource | Designation | Source or reference | Identifiers | Additional information |
|---|---|---|---|---|
| Strain, strain background (Escherichia coli) | BL21 DE3 AI | Invitrogen | C607003 | Protein expression strain |
| Recombinant DNA reagent | pET11a | EMD Millipore | 9436 | Protein expression vector |
| Recombinant DNA reagent | pT712ω | Welfle et al., 2005 | ParBpSM overexpression plasmid | |
| Recombinant DNA reagent | pCB746 (pT712 vector) | Pratto et al., 2008 | ParApSM overexpression plasmid | |
| Recombinant DNA reagent | pCB755 (pT712 vector) | Pratto et al., 2008 | ParApSMD60A overexpression plasmid | |
| Recombinant DNA reagent | pET11a- ParApSMD60E | This work | ParApSMD60E overexpression plasmid | |
| Recombinant DNA reagent | pCB1033 (pT712 vector) | This work | ParBpSM-GCE overexpression plasmid | |
| Recombinant DNA reagent | pET11a- ParApSM-EGFP | This work | ParApSM-EGFP overexpression plasmid | |
| Recombinant DNA reagent | pET11a- ParApSMD60A-EGFP | This work | ParApSMD60A-EGFP overexpression plasmid | |
| Recombinant DNA reagent | pET11a- ParApSMD60E-EGFP | This work | ParApSMD60E-EGFP overexpression plasmid | |
| Sequence-based reagent | Scrambled 55mer DNA oligo + strand | This work | GGGATCAAACACTTGATAGACAAGTCTTTGACCTAATTGTGAAAATTATGAAGGG | |
| Sequence-based reagent | Scrambled 55mer DNA oligo - strand | This work | CCCTTCATAATTTTCACAATTAGGTCAAAGACTTGTCTATCAAGTGTTTGATCCC | |
| Sequence-based reagent | 7R parS DNA oligo + strand | This work | GGGAATCACAAATCACAAGTGATTAATCACAAATCACTTGTGATTTGTGATTGGG | |
| Sequence-based reagent | 7R parS DNA oligo - strand | This work | CCCAATCACAAATCACAAGTGATTTGTGATTAATCACTTGTGATTTGTGATTCCC | |
| Sequence-based reagent | 6R parS DNA oligo + strand | This work | GGGAATCACAAGTGATTAATCACAAATCACTTGTGATTTGTGATTGGG | |
| Sequence-based reagent | 6R parS DNA oligo - strand | This work | CCCAATCACAAATCACAAGTGATTTGTGATTAATCACTTGTGATTCCC | |
| Sequence-based reagent | 5R parS DNA oligo + strand | This work | GGGAATCACAAATCACAAATCACTTGTGATTTGTGATTGGG | |
| Sequence-based reagent | 5R parS DNA oligo - strand | This work | CCCAATCACAAATCACAAGTGATTTGTGATTTGTGATTCCC | |
| Sequence-based reagent | 4R(1) parS DNA oligo + strand | This work | GGGAATCACAAATCACTTGTGATTTGTGATTGGG | |
| Sequence-based reagent | 4R(1) parS DNA oligo - strand | This work | CCCAATCACAAATCACAAGTGATTTGTGATTCCC | |
| Sequence-based reagent | 4R(2) parS DNA oligo + strand | This work | GGGAATCACTTATCACAAGTGATTAATCACTGGG | |
| Sequence-based reagent | 4R(2) parS DNA oligo - strand | This work | CCCAGTGATTAATCACTTGTGATAAGTGATTCCC | |
| Sequence-based reagent | 4R(3) parS DNA oligo + strand | This work | GGGAATCACTTATCACAAATCACAAATCACTGGG | |
| Sequence-based reagent | 4R(3) parS DNA oligo - strand | This work | CCCAGTGATTTGTGATTTGTGATAAGTGATTCCC | |
| Sequence-based reagent | 3R-2nc-3R parS DNA oligo + strand | This work | GGGAATCACAAATCACAAATCACATCATAGTTCATAGTTGTGATTTGTGATTTGTGATTGGG | |
| Sequence-based reagent | 3R-2nc-3R parS DNA oligo - strand | This work | CCCAATCACAAATCACAAATCACAACTATGAACTATGATGTGATTTGTGATTTGTGATTCCC | |
| Sequence-based reagent | 3R-1nc-3R parS DNA oligo + strand | This work | GGGAATCACAAATCACAAATCACATCATAGTTGTGATTTGTGATTTGTGATTGGG | |
| Sequence-based reagent | 3R-1nc-3R parS DNA oligo - strand | This work | CCCAATCACAAATCACAAATCACAACTATGATGTGATTTGTGATTTGTGATTCCC | |
| Sequence-based reagent | 3R-1nc parS DNA oligo + strand | This work | GGGAATCACAAATCACTTGTGATTTCATAGTGGG | |
| Sequence-based reagent | 3R-1nc parS DNA oligo - strand | This work | CCCACTATGAAATCACAAGTGATTTGTGATTCCC | |
| Sequence-based reagent | 3R(1) parS DNA oligo + strand | This work | GGGAATCACAAATCACTTGTGATTGGG | |
| Sequence-based reagent | 3R(1) parS DNA oligo - strand | This work | CCCAATCACAAGTGATTTGTGATTCCC | |
| Sequence-based reagent | 3R(2) parS DNA oligo + strand | This work | GGGAATCACTTATCACAAATCACAGGG | |
| Sequence-based reagent | 3R(2) parS DNA oligo - strand | This work | CCCTGTGATTTGTGATAAGTGATTCCC | |
| Sequence-based reagent | 2R parS DNA oligo + strand | This work | GGGAATCACTTGTGATTGGG | |
| Sequence-based reagent | 2R parS DNA oligo - strand | This work | CCCAATCACAAGTGATTCCC | |
| Sequence-based reagent | 1R parS DNA oligo + strand | This work | GGGAATCACTGGG | |
| Sequence-based reagent | 1R parS DNA oligo - strand | This work | CCCAGTGATTCCC | |
| Peptide, recombinant protein | ParBpSM1-27 | This work | MIVGNLGAQKAKRNDTPISAKKDIMGD | |
| Peptide, recombinant protein | ParBpSM1-27 K10A | This work | MIVGNLGAQAAKRNDTPISAKKDIMGD | |
| Peptide, recombinant protein | ParBP11-30 | This work | MSKKNRPTIGRTLNPSILSGFDSSSASGDR | |
| Chemical compound, drug | [γ−32P]ATP | PerkinElmer | NEG002A250UC | |
| Chemical compound, drug | Biotin-17-dCTP | Invitrogen | 65601 | |
| Chemical compound, drug | Terminal transferase | New England Biolabs | M0315 | |
| Chemical compound, drug | Alexa Fluor 488 C5 maleimide | Thermo Fisher | A10254 | |
| Chemical compound, drug | Alexa Fluor 594 C5 maleimide | Thermo Fisher | A10256 | |
| Chemical compound, drug | Alexa Fluor 647 C2 maleimide | Thermo Fisher | A20347 | |
| Chemical compound, drug | Antifoam Y-40 emulsion | Sigma | A5758 | |
| Chemical compound, drug | EDTA-free Sigmafast protease inhibitor cocktail tablet | Sigma | S8830 | |
| Chemical compound, drug | DOPC | Avanti Polar Lipids | 850375P | |
| Chemical compound, drug | DOPE-Biotin | Avanti Polar Lipids | 870273C | |
| Chemical compound, drug | Biotin-14-dCTP | Thermo Fisher | 19518018 | |
| Software, algorithm | Prism 9 | GraphPad | Prism 9 | Used for curve fitting, and fitting parameters and their error estimation |
| Software, algorithm | MetaMorph 7 | Molecular Devices | MetaMorph 7 | Used for TIRF microscope data acquisition |
| Software, algorithm | ImageJ/Fiji | National Institutes of Health | ImageJ | Used for TIRF microscope image analysis |
| Other (instrument) | Prism type TIRF microscope | In-house; Vecchiarelli et al., 2013, Ivanov and Mizuuchi, 2010 | Used for ParAF-ParBF complex assembly–disassembly experiments |
Additional files
Download links
A two-part list of links to download the article, or parts of the article, in various formats.
Downloads (link to download the article as PDF)
Open citations (links to open the citations from this article in various online reference manager services)
Cite this article (links to download the citations from this article in formats compatible with various reference manager tools)
Distinct architectural requirements for the parS centromeric sequence of the pSM19035 plasmid partition machinery
eLife 11:e79480.
https://doi.org/10.7554/eLife.79480


