Enhancing and inhibitory motifs regulate CD4 activity
- Department of Immunobiology, The University of Arizona College of Medicine, United States
- School of Animal and Comparative Biomedical Sciences, University of Arizona, United States
- Cancer Biology Graduate Interdisciplinary Program and Genetics Graduate Interdisciplinary Program, The University of Arizona, United States
- The BIO-5 Institute, The University of Arizona, United States
- The University of Arizona Cancer Center, United States
- The Arizona Center on Aging, The University of Arizona College of Medicine, United States
Figures
Figure 1 with 1 supplement
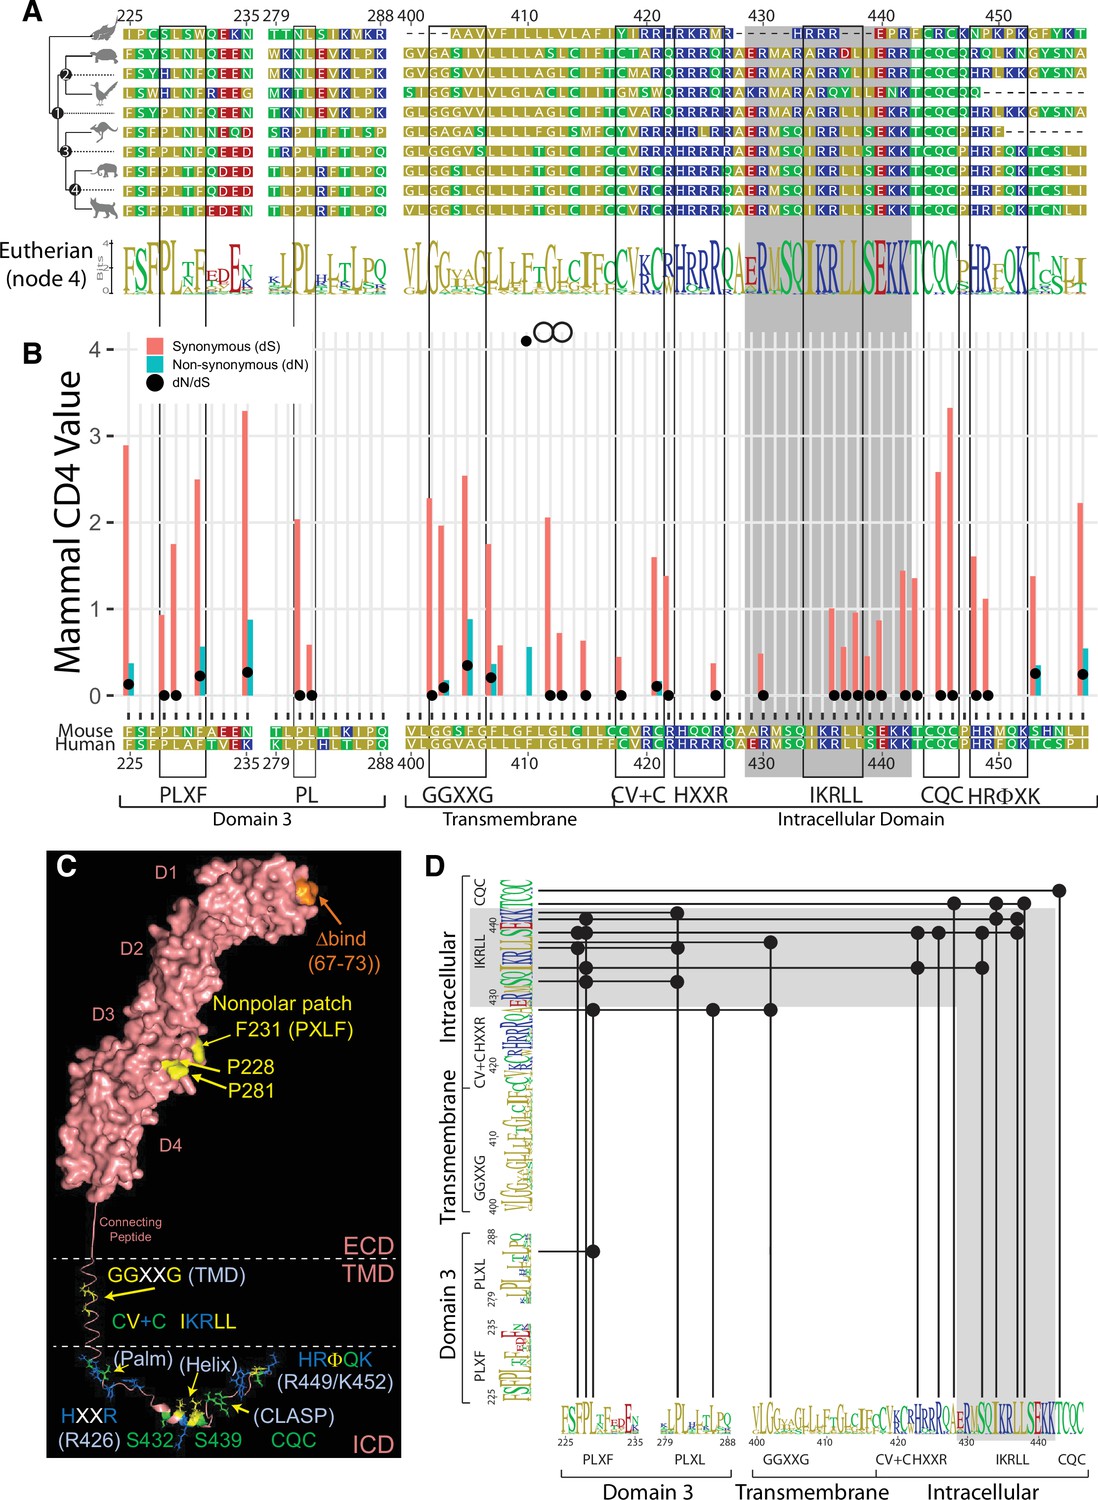
Evolutionary analysis of the CD4 molecule.
(A) Reduced representation maximum likelihood phylogenetic tree clusters of CD4 sequences are shown with mouse CD4 numbering (uniprot) used as a reference. Residues are colored based on sidechain polarity. Dashes (-) indicate an evolutionary insertion or deletion event. Predicted most recent common ancestor (MRCA) sequences are shown at each node in the tree (Node 1-4). Logo plots of extant eutherian CD4 sequences are aligned at the bottom of the tree. Each stack of letters represents the sequence conservation at that position in the alignment. The height of symbols indicates the relative frequency of each amino acid at that specific position.(B) Synonymous (dS, red bars) and nonsynonymous (dN, blue bars) substitution rates within the CD4 coding sequence are shown as calculated for all CD4 orthologs included in the initial phylogenetic analysis using the Fixed Effects Likelihood (FEL) method. Only bars for which the likelihood ratio test indicated statistical significance (alpha = 0.1) are shown. Black circles show the ratio of both these values. Codons under diversifying selection have a dN:dS ratio >1. Those under purifying selection have a dN:dS ratio <1.(C) A theoretical structural model to show the relative location of the motifs discussed here. The surface rendered ECD of human CD4 (pdb 1WIQ) was joined with a connecting peptide and TMD (built using the PyMol Molecular Graphics system), and ICD (pdb 1Q68). Note here that mouse residue numbering (uniport) is used in this model for consistency with panels A–C.(D) Covarying residues were calculated using MISTIC2. Residues that covary are indicated with a black dot and connected with a solid line. Motifs identified in this study are indicated. The logo plot represents eutherian sequences. The complete MISTIC2 results matrix is available on Dryad (https://doi.org/10.5061/dryad.59zw3r26z). Boxes are used to highlight motifs discussed in this study, while the grey shading indicates the helix-turn region within the ICD. Key: MRCA = Most Recent Common Ancestor; FEL = Fixed Effects Likelihood; dS = Synonymous; dN = nonsynonymous; ECD = Extracellular Domain; TMD = Transmembrane Domain; ICD = Intracellular Domain.
Figure 1—figure supplement 1
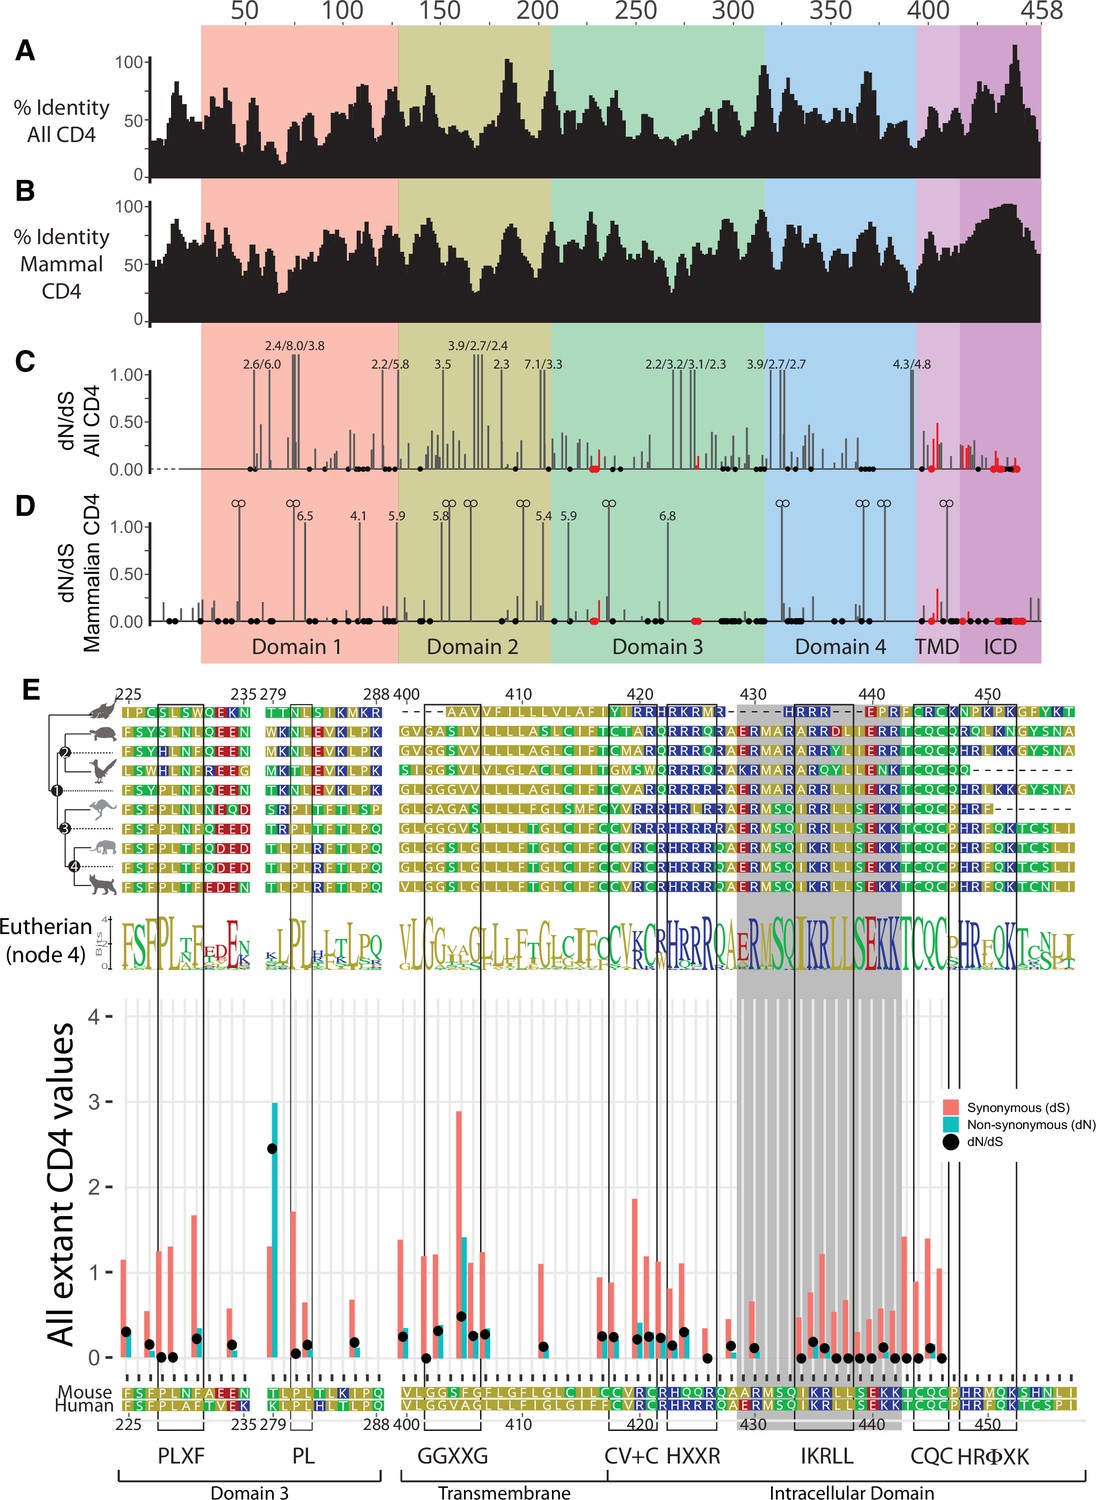
Additional evolutionary analysis of the CD4 molecule.
(A) CD4 signal for each sucrose gradient fraction is shown as a percent of the total CD4 signal detected in all fractions (left). The area under the curve (AUC) is presented for the normalized CD4 signal in the detergent resistant membrane (DRM) fractions (center) and detergent soluble membrane (DSM) fractions (right).(B) Cholera toxin subunit B (CTxB) signal is shown for each sucrose fraction normalized to the CD4 signal detected in the corresponding fraction (left). The AUC is shown for the normalized CTxB signal in the DRM (center) and DSM (right) fractions.(C) Lck signal is shown for each sucrose fraction normalized to the CD4 signal detected in the corresponding fraction (left). The AUC is shown for the normalized Lck signal in the DRM (center) and DSM (right) fractions. (D) IL-2 production is shown in response to a titration of MCC peptide (left). AUC analysis for the dose response is shown as a measure of the response magnitude (center). The average response to a low dose (41nM) of peptide is shown as a measure of sensitivity (right). For (A–C) each data point represents the mean ± SEM for the same three independent experiments (biological replicates). For (D), the dose response represents one of three experiments showing the mean ± SEM of triplicate wells (technical replicates). the magnitude and sensitivity data represents the mean ± of three independent experiments (biological replicates). One-way ANOVA with a Dunnet's posttest for comparisons with WT samples, or a Sidak's posttest for comparisons between selected samples, were performed. Key: AUC = Area Under the Curve; DRM = Detergent Resistant Membrane; DSM = Detergent Soluble Membrane; CTxB = Cholera Toxin subunit B.
Figure 2 with 4 supplements
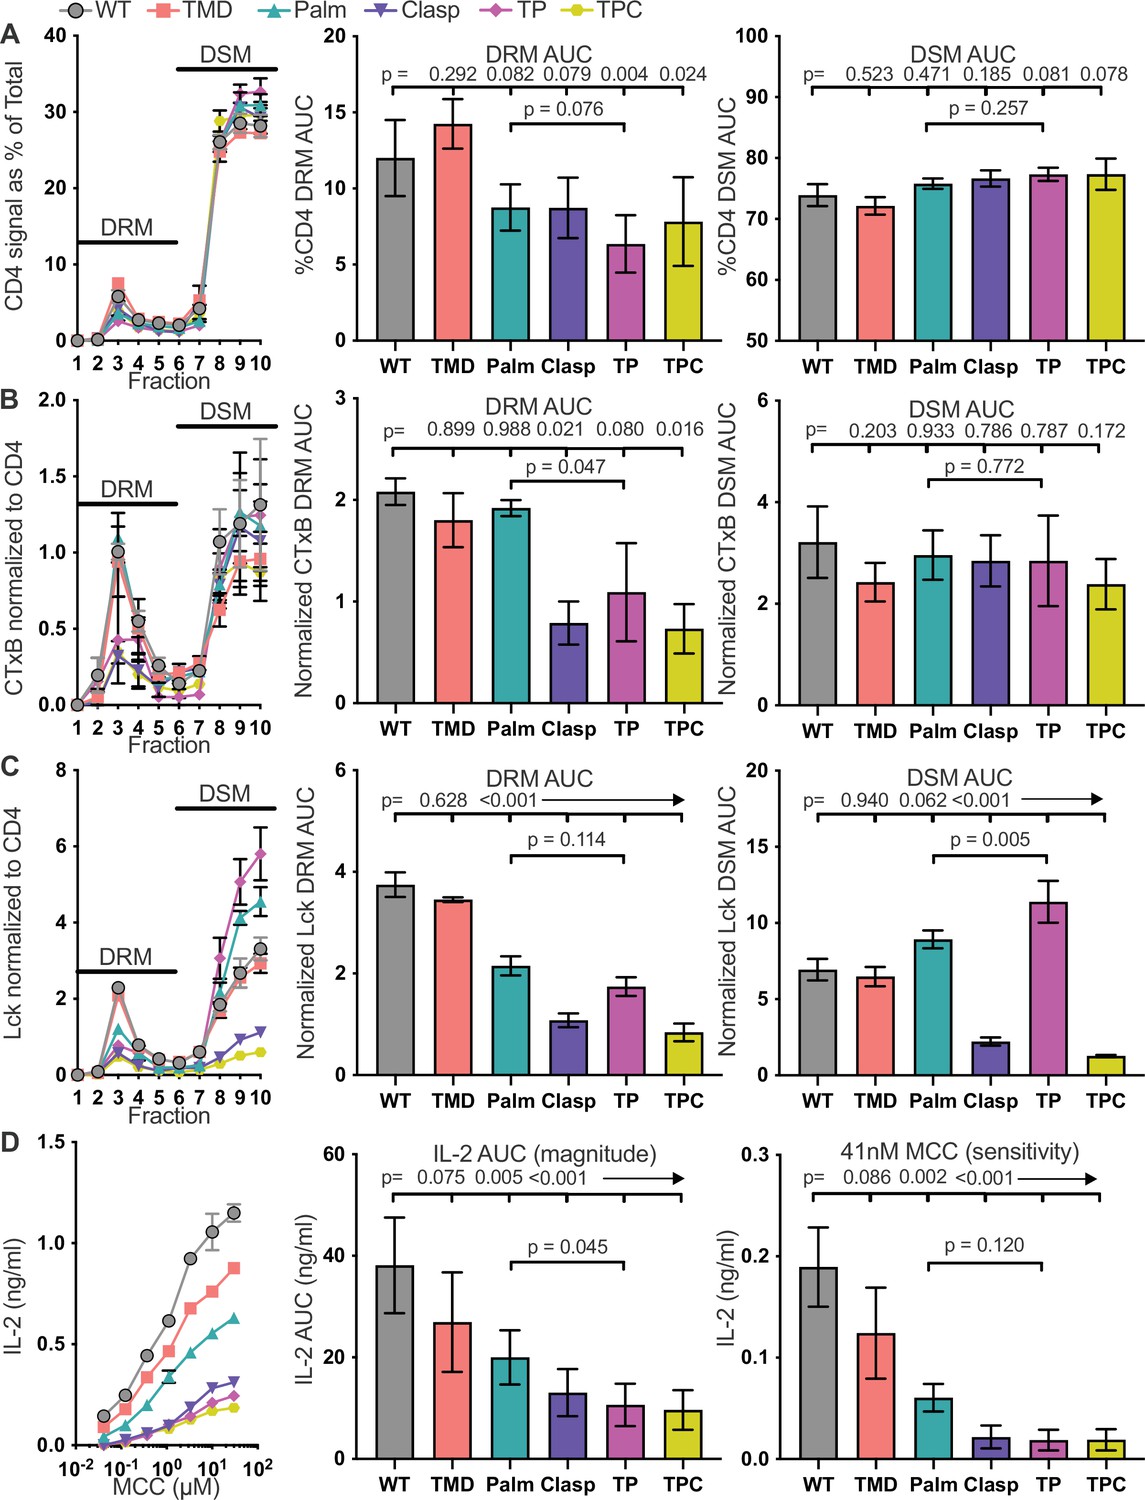
The GGXXG + CV+C motifs influence CD4 membrane domain localization and function.
(A) CD4 signal for each sucrose gradient fraction is shown as a percent of the total CD4 signal detected in all fractions (left). The area under the curve (AUC) is presented for the normalized CD4 signal in the detergent resistant membrane (DRM) fractions (center) and detergent soluble membrane (DSM) fractions (right). (B) Cholera toxin subunit B (CTxB) signal is shown for each sucrose fraction normalized to the CD4 signal detected in the corresponding fraction (left). The AUC is shown for the normalized CTxB signal in the DRM (center) and DSM (right) fractions. (C) Lck signal is shown for each sucrose fraction normalized to the CD4 signal detected in the corresponding fraction (left). The AUC is shown for the normalized Lck signal in the DRM (center) and DSM (right) fractions. (D) IL-2 production is shown in response to a titration of MCC peptide (left). AUC analysis for the dose response is shown as a measure of the response magnitude (center). The average response to a low dose (41nM) of peptide is shown as a measure of sensitivity (right).For (A-C) each data point represents the mean ± SEM for the same three independent experiments (biological replicates). For (D), the dose response represents one of three experiments showing the mean ± SEM of triplicate wells (technical replicates). the magnitude and sensitivity data represents the mean ± of three independent experiments (biological replicates). One-way ANOVA with a Dunnet's posttest for comparisons with WT samples, or a Sidak's posttest for comparisons between selected samples, were performed. Key: AUC = Area Under the Curve; DRM = Detergent Resistant Membrane; DSM = Detergent Soluble Membrane; CTxB = Cholera Toxin subunit B.
Figure 2—figure supplement 1
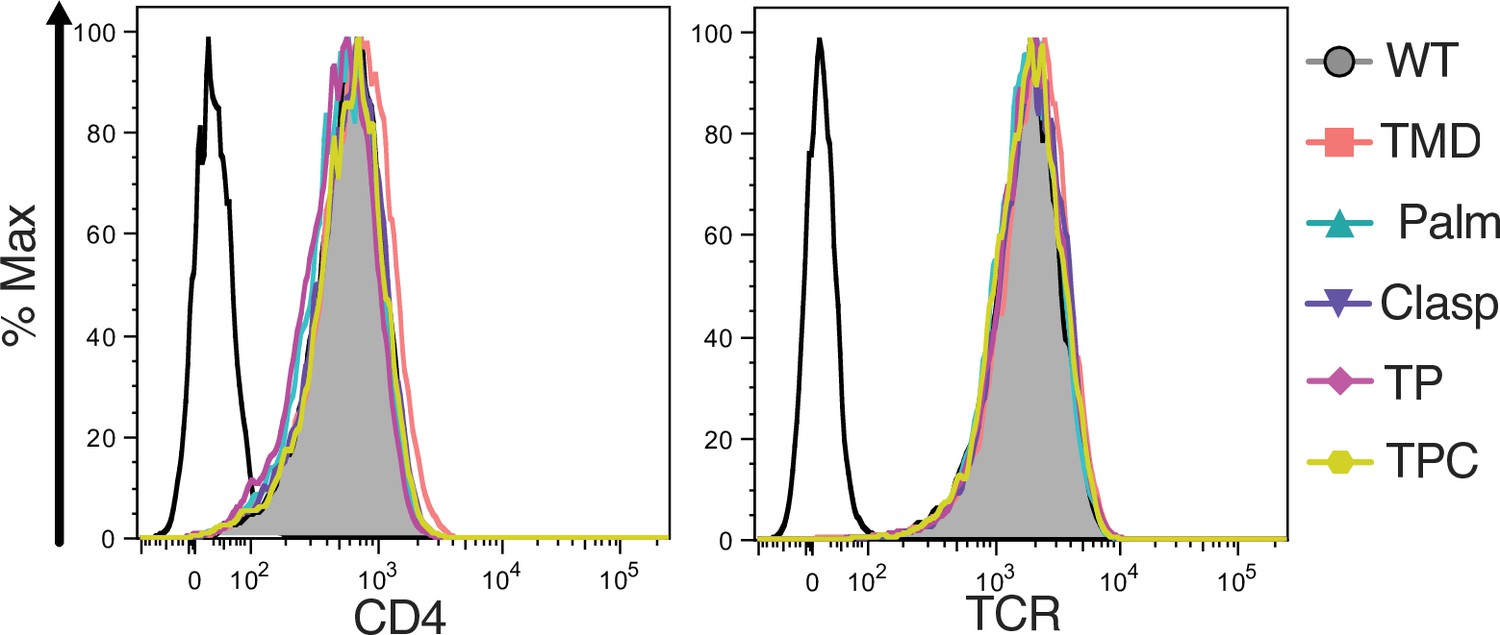
Surface expression.
Flow cytometry analysis of CD4 (left) and TCR (right) expression on 58α-β- cells. Parental 58α-β- cells served as negative control for surface expression (open black histogram trace).
Figure 2—figure supplement 2

Raw sucrose gradient values.
(A) Raw CD4 signal data is shown for each sucrose fraction (left). AUC is shown for the DRM (center) and DSM fractions (right). (B) Raw cholera toxin subunit B (CTxB) signal data is shown for each sucrose fraction (left). AUC is shown for the DRM (center) and DSM fractions (right). (C) Raw Lck signal data is shown for each sucrose fraction (left). AUC is shown for the DRM (center) and DSM fractions (right). For (A–C) each data point represents the mean ± SEM for the same three independent experiments (biological replicates). One-way ANOVA was performed with a Dunnett’s posttest for comparison with WT samples, and a Sidak’s posttest for comparisons between selected samples. Key: AUC = Area Under the Curve; DRM = Detergent Resistant Membrane; DSM = Detergent Soluble Membrane; CTxB = Cholera Toxin subunit B.
Figure 2—figure supplement 3
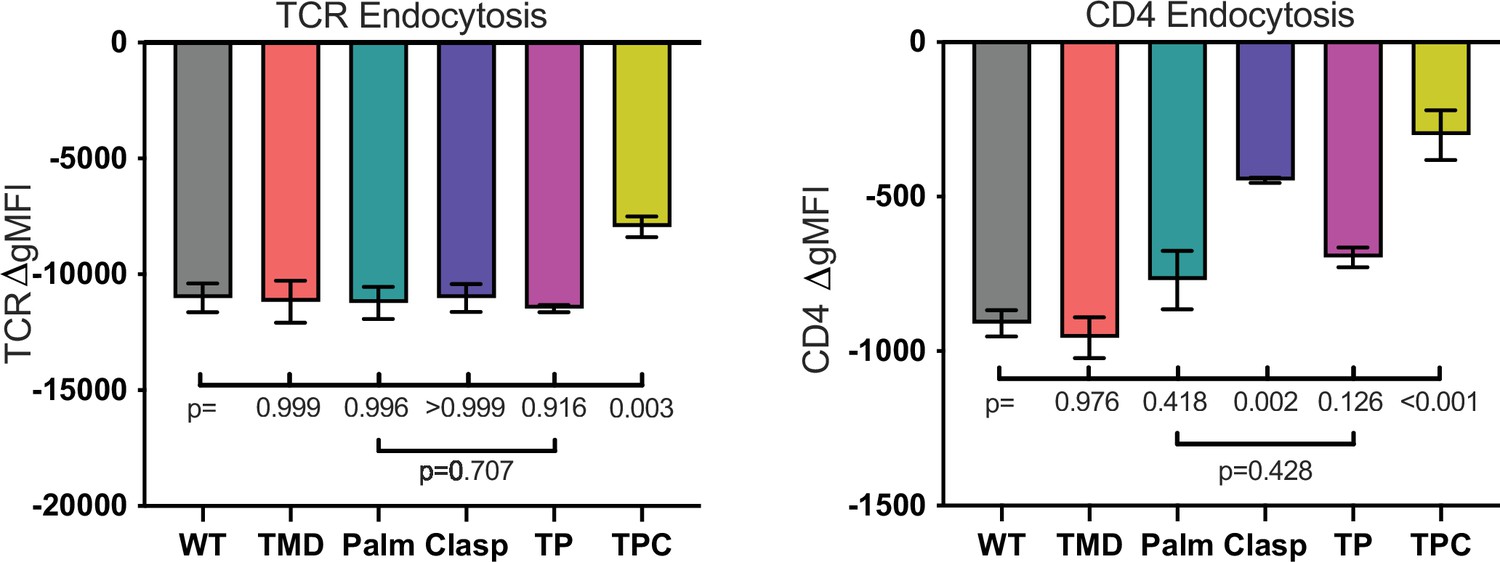
TCR (left) and CD4 (right) endocytosis after pMHCII engagement is shown for the indicated cell lines after 16 hours coculture with APCs in the presence of 10μM MCC peptide.
The change in TCR and CD4 gMFI, as measured by flow cytometry, is shown for each cell line relative to an equivalent sample cultured with APCs in the absence of MCC peptide. Each data point represents the mean ± SEM for three independent experiments (biological replicates). For endocytosis measurements were performed in triplicate (technical replicates) for each experiment. One-way ANOVA was performed with a Dunnett’s posttest for comparisons with WT samples, and a Sidak’s posttest for comparisons between selected samples. Key: APC = Antigen Presenting Cell; gMFI = geometric Mean Fluorescence Intensity.
Figure 2—figure supplement 4

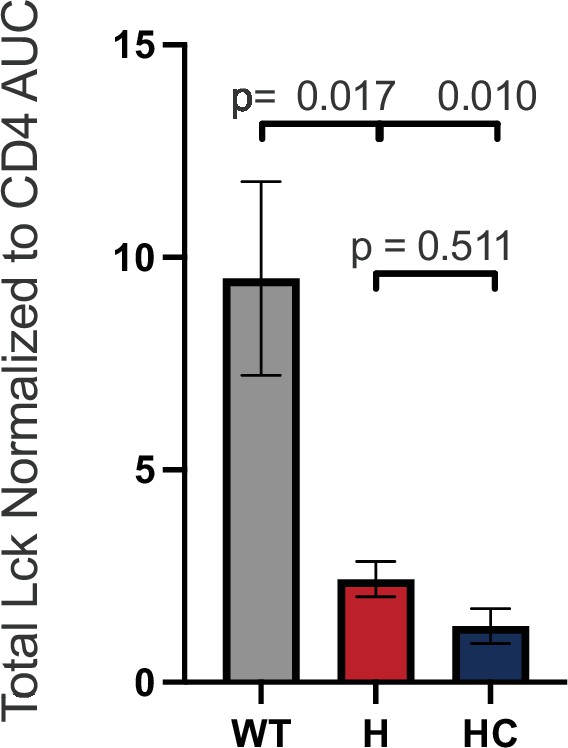
Total Lck normalized to CD4.
Total Lck signal normalized to CD4 signal data is shown for the indicated cell lines. Each data point represents the mean ± SEM for the same three independent experiments (biological replicates) as in Figure 2. One-way ANOVA was performed with a Dunnett’s posttest for comparison with WT samples, and a Sidak’s posttest for comparisons between selected samples.
Figure 3 with 4 supplements
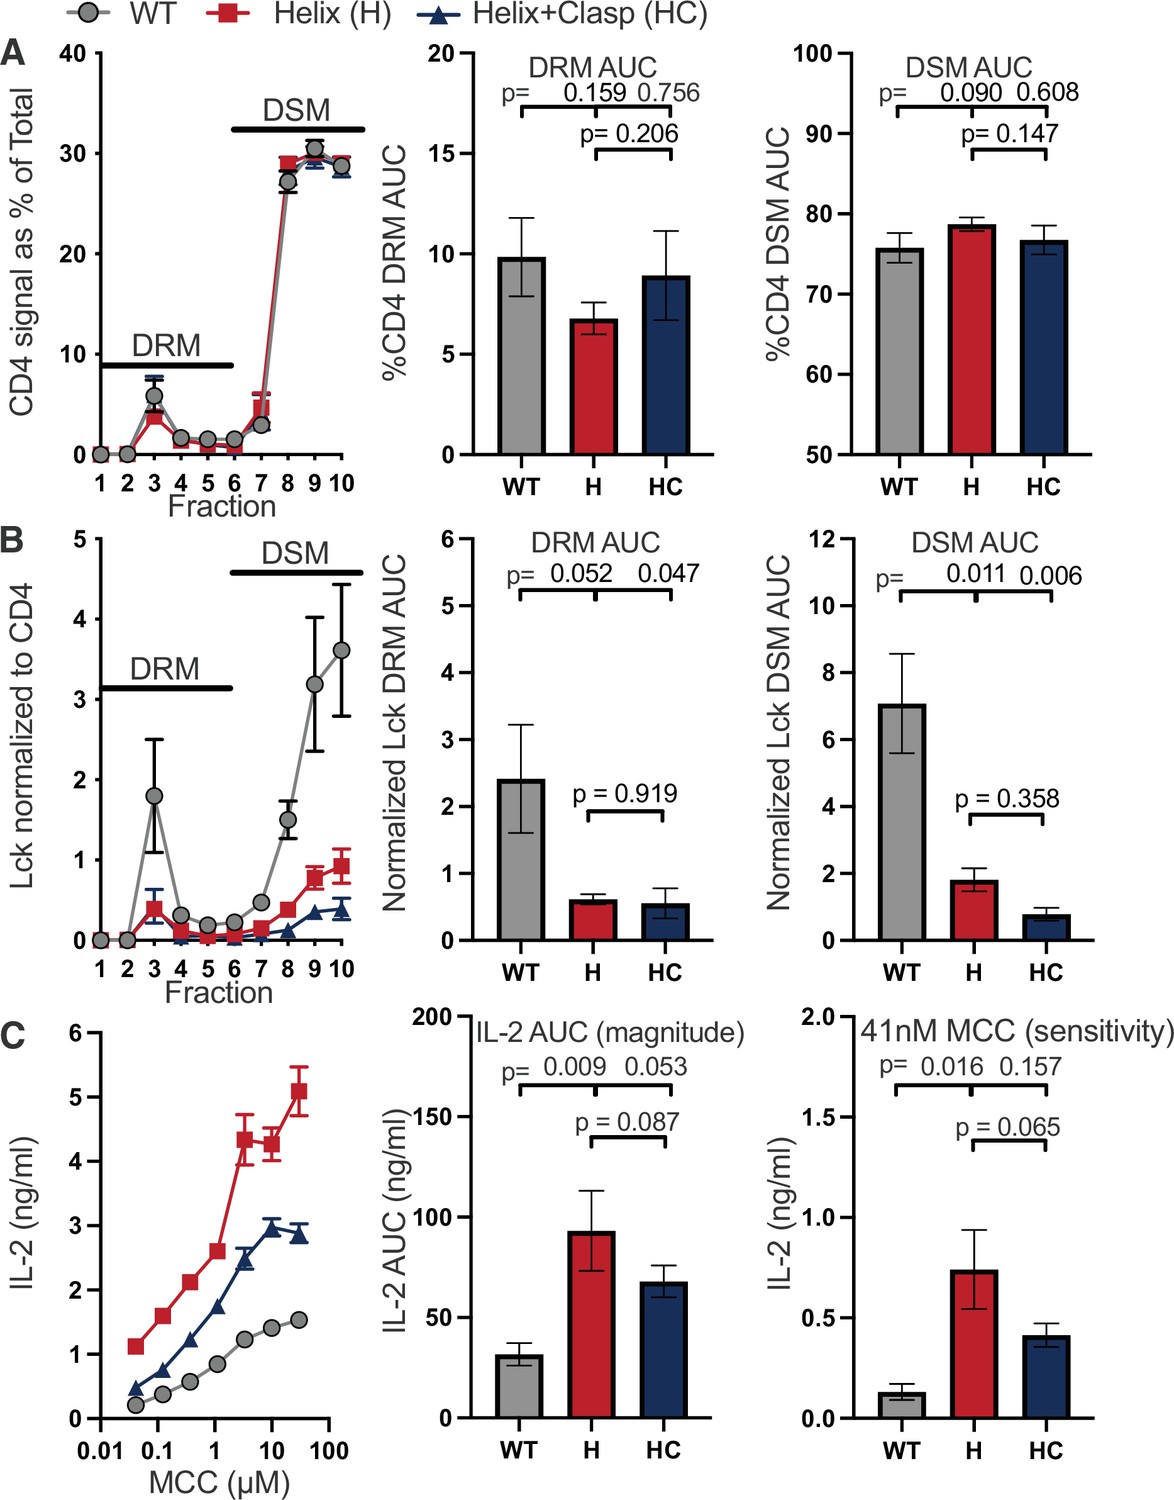
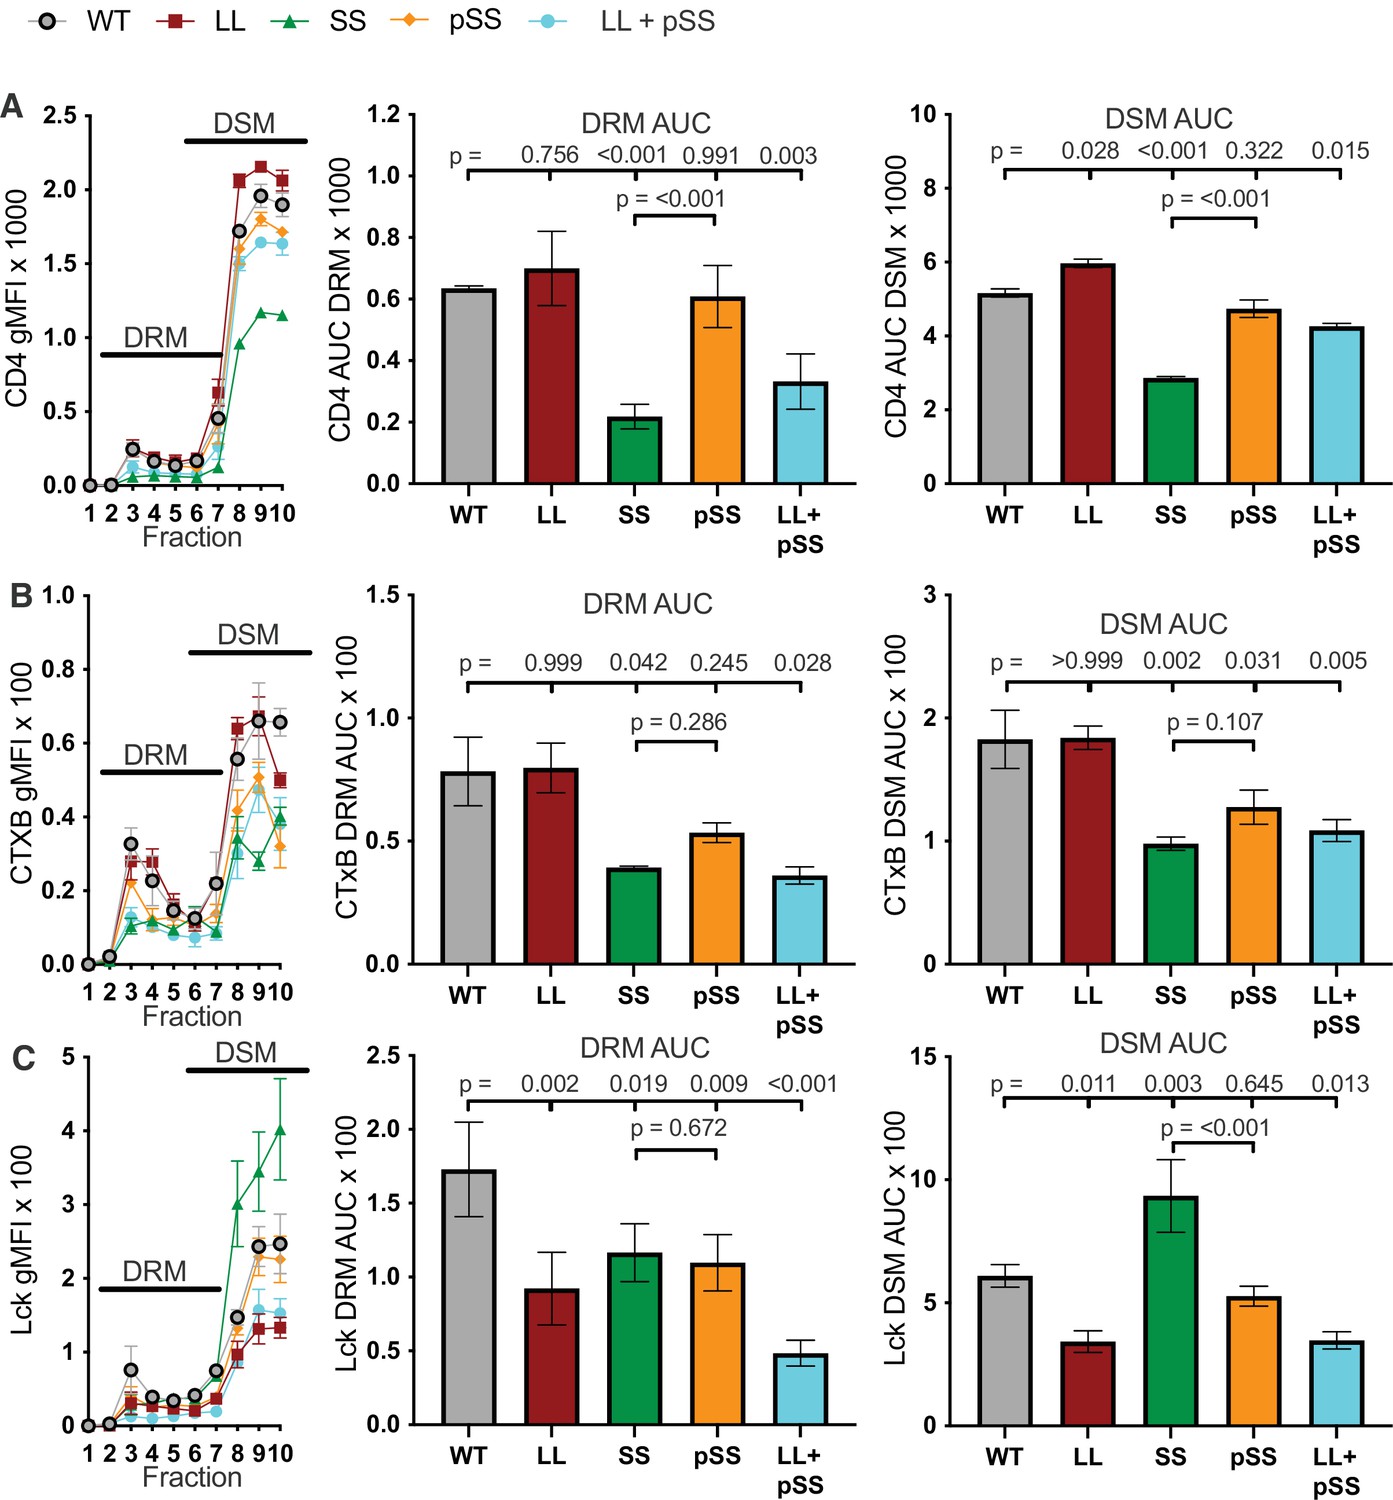
The intracellular helix attenuates response magnitude and sensitivity.
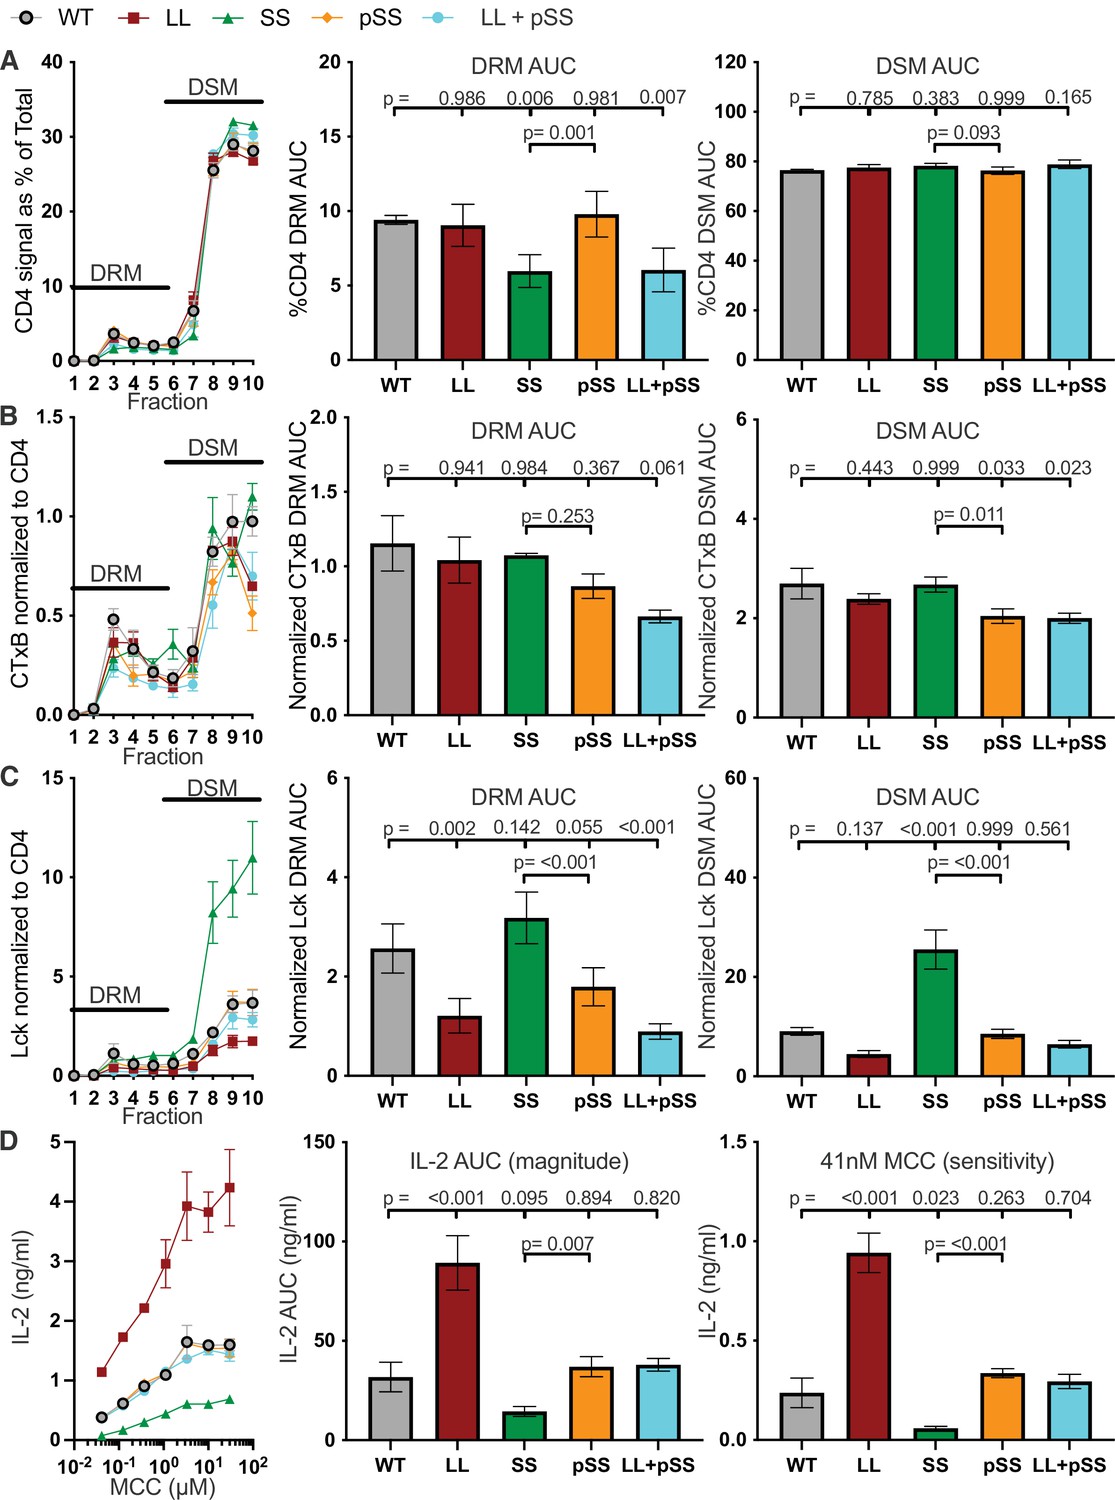
(A) CD4 signal for each sucrose gradient fraction is shown as a percent of the total CD4 signal detected in all fractions (left). The area under the curve (AUC) is presented for the normalized CD4 signal in the detergent resistant membrane (DRM) fractions (center) and detergent soluble membrane (DSM) fractions (right). (B) Lck signal is shown for each sucrose fraction normalized to the CD4 signal detected in the corresponding fraction (left). The AUC is shown for the normalized Lck signal in the DRM (center) and DSM (right) fractions. (C) IL-2 production is shown in response to a titration of MCC peptide (left). AUC analysis for the dose response is shown as a measure of the response magnitude (center). The average response to a low dose (41nM) of peptide is shown as a measure of sensitivity (right). For (A–C) The data are presented as in Figure 2. Key: AUC = Area Under the Curve; DRM = Detergent Resistant Membrane; DSM = Detergent Soluble Membrane.
Figure 3—figure supplement 1
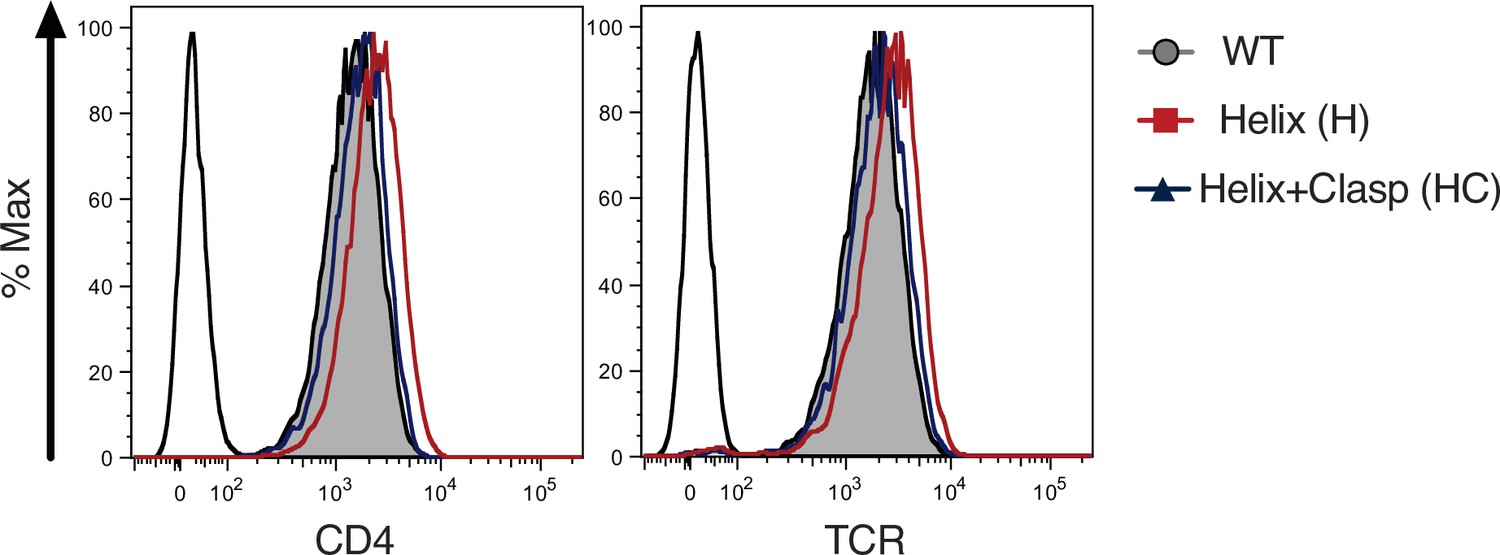
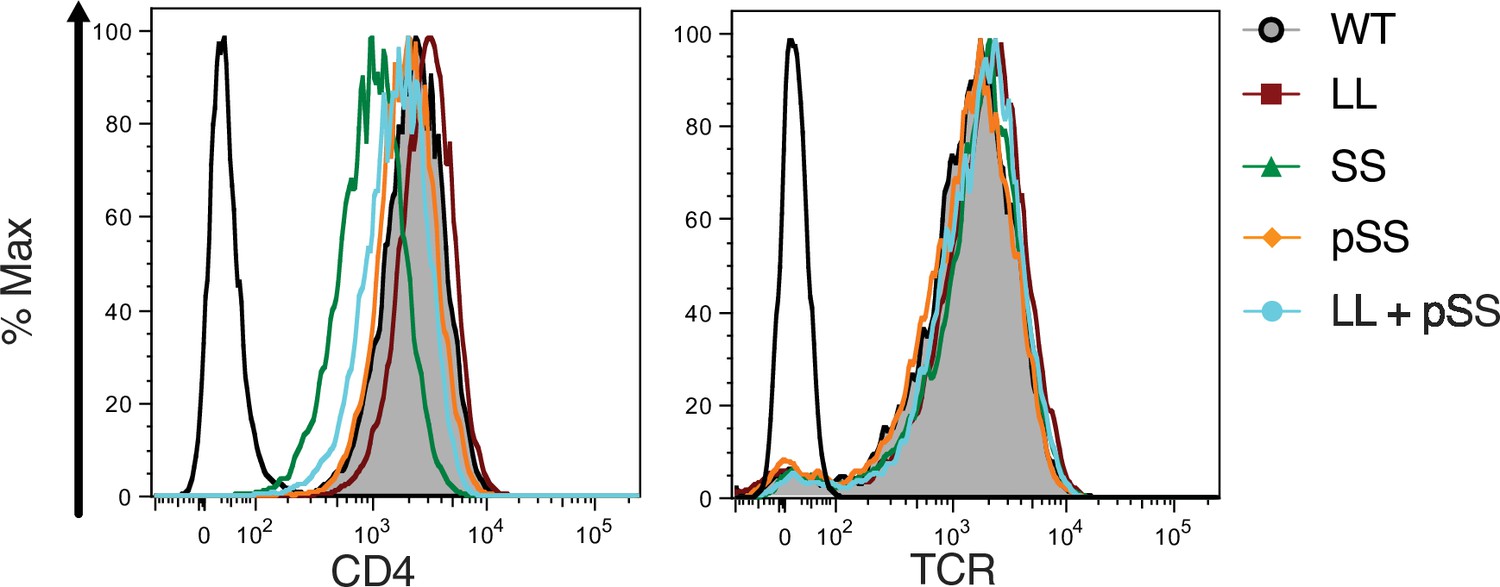
Surface expression.
Flow cytometry analysis of CD4 (left) and TCR (right) expression on 58α-β- cells. Parental 58α-β- cells served as negative control for surface expression (open black histogram trace).
Figure 3—figure supplement 2
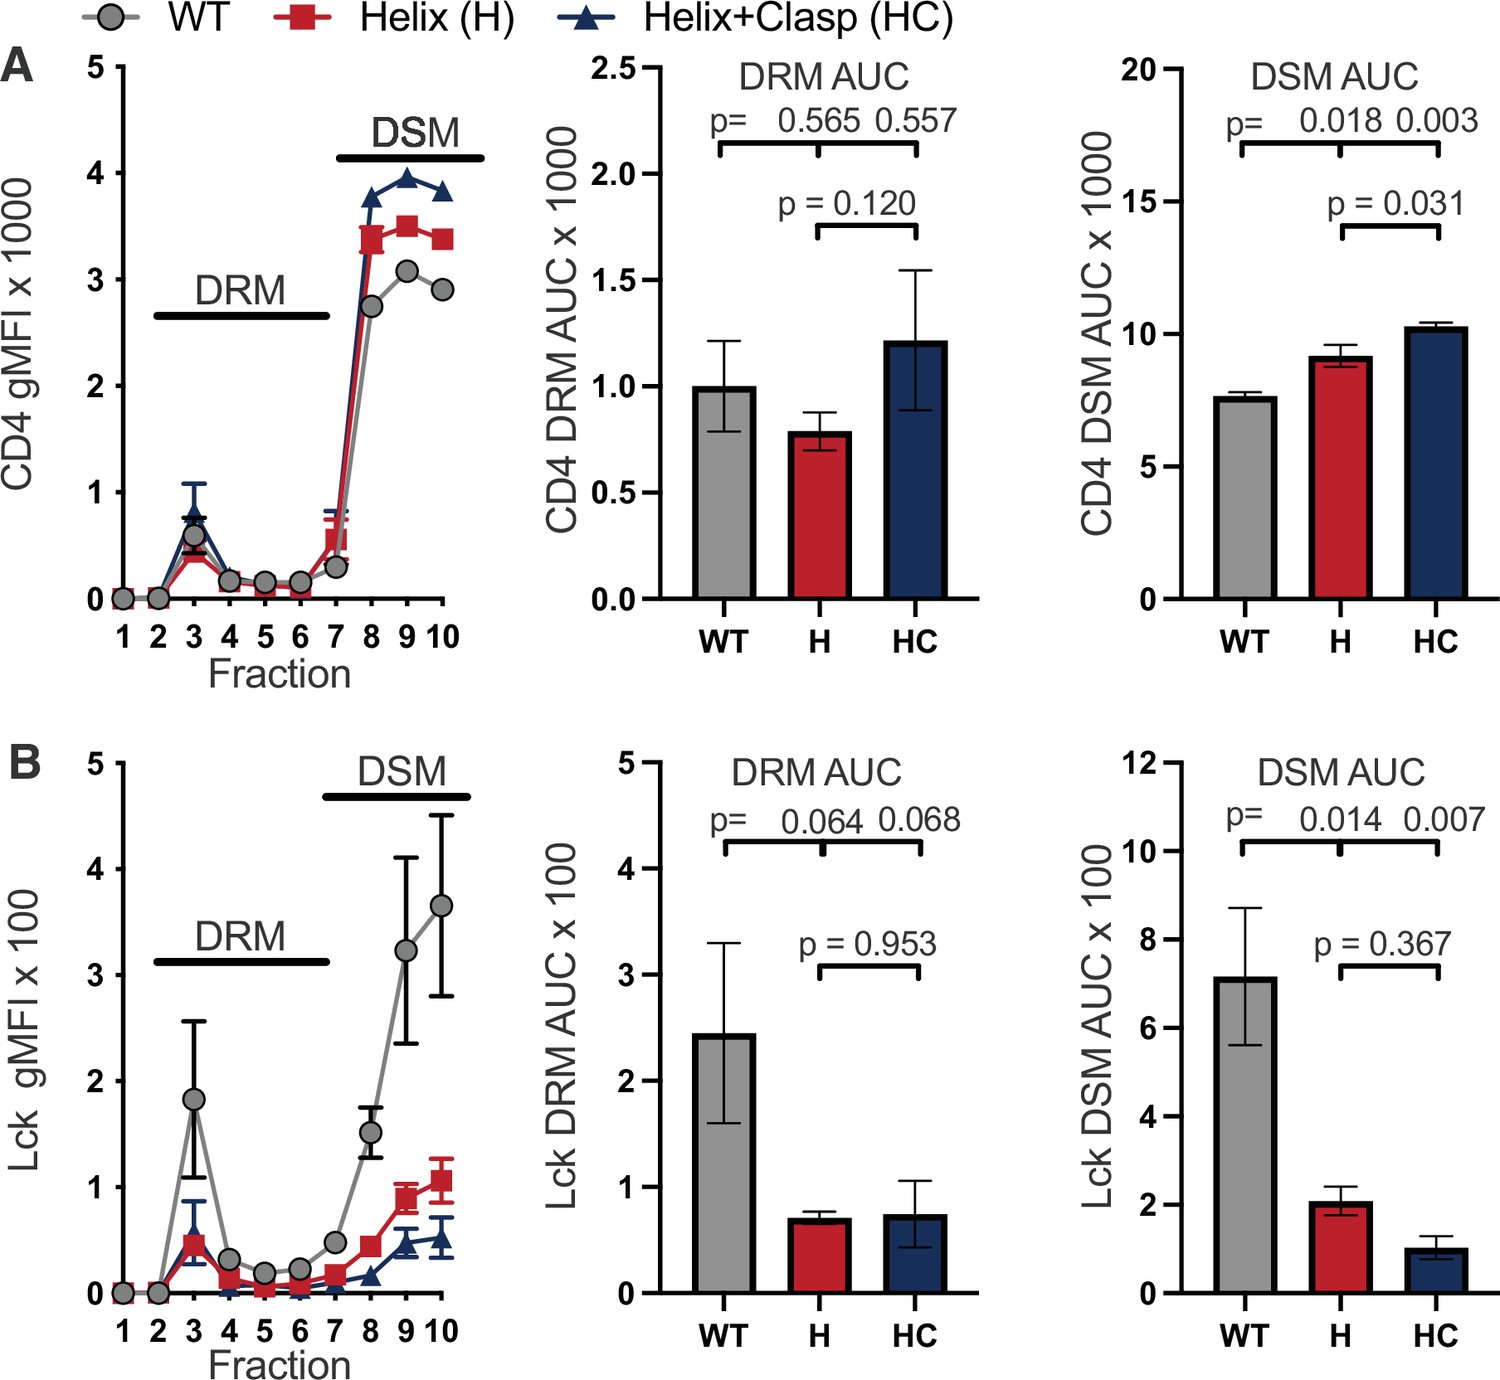
Raw sucrose gradient values.
(A) Raw CD4 signal is shown for each sucrose fraction (left). AUC is shown for the DRM (center) and DSM fractions (right). (B) Raw Lck signal is shown for each sucrose fraction (left). AUC is shown for the DRM (center) and DSM fractions (right). For (A–B) each data point represents the mean ± SEM for the same three independent experiments (biological replicates). One-way ANOVA was performed with a Dunnett’s posttest for comparison with WT samples, and a Sidak’s posttest for comparisons between selected samples. Key: AUC = Area Under the Curve; DRM = Detergent Resistant Membrane; DSM = Detergent Soluble Membrane.
Figure 3—figure supplement 3
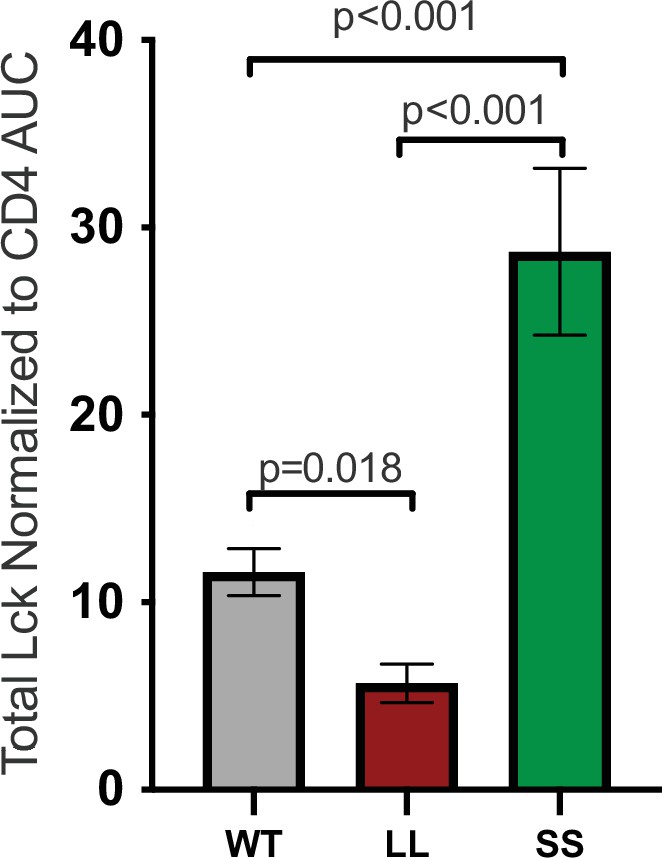
Total Lck Normalized to CD4.
Total Lck signal normalized to CD4 signal data is shown for the indicated cell lines. Each data point represents the mean ± SEM for three independent experiments (biological replicates). One-way ANOVA was performed with a Dunnett’s posttest for comparison with WT samples, and a Sidak’s posttest for comparisons between selected samples.
Figure 3—figure supplement 4
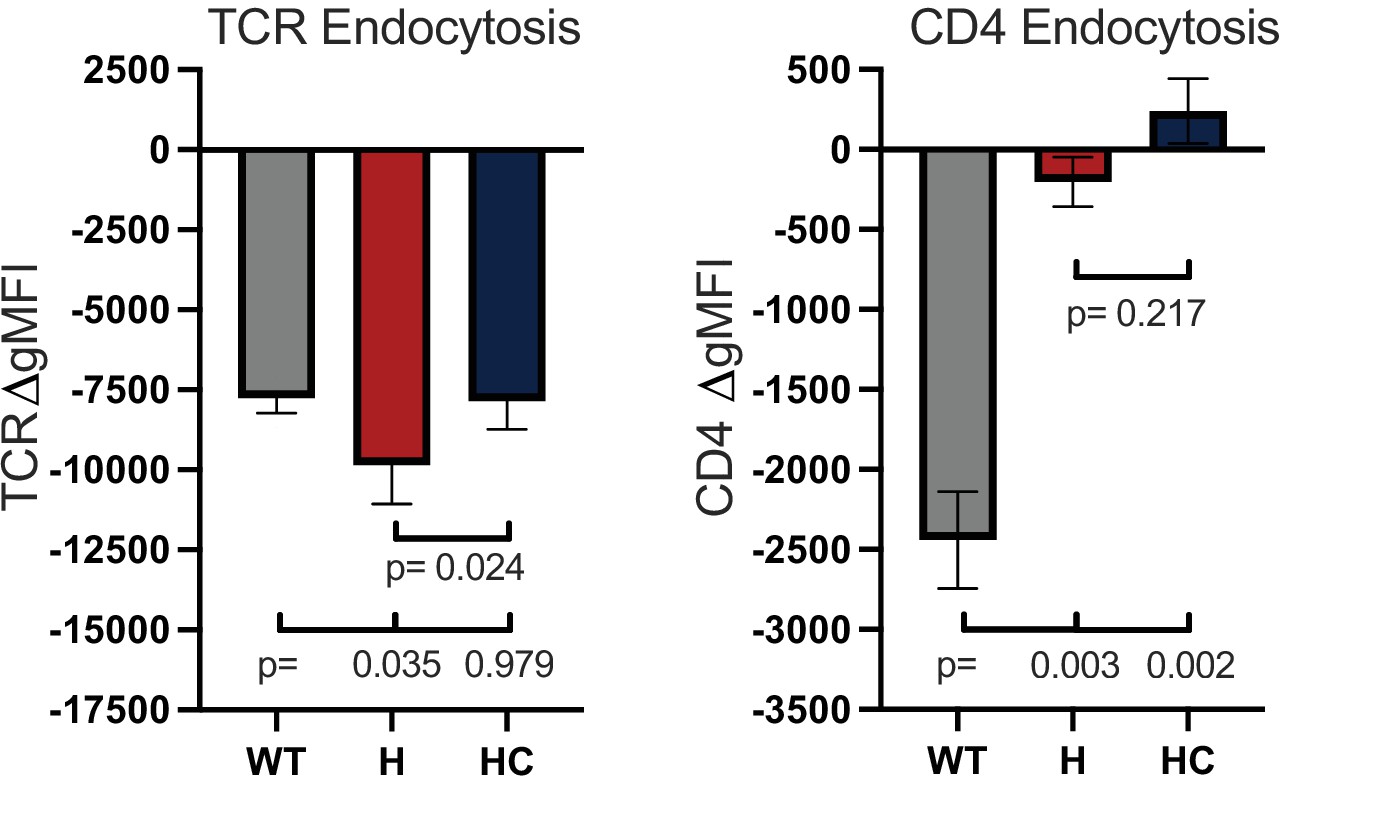
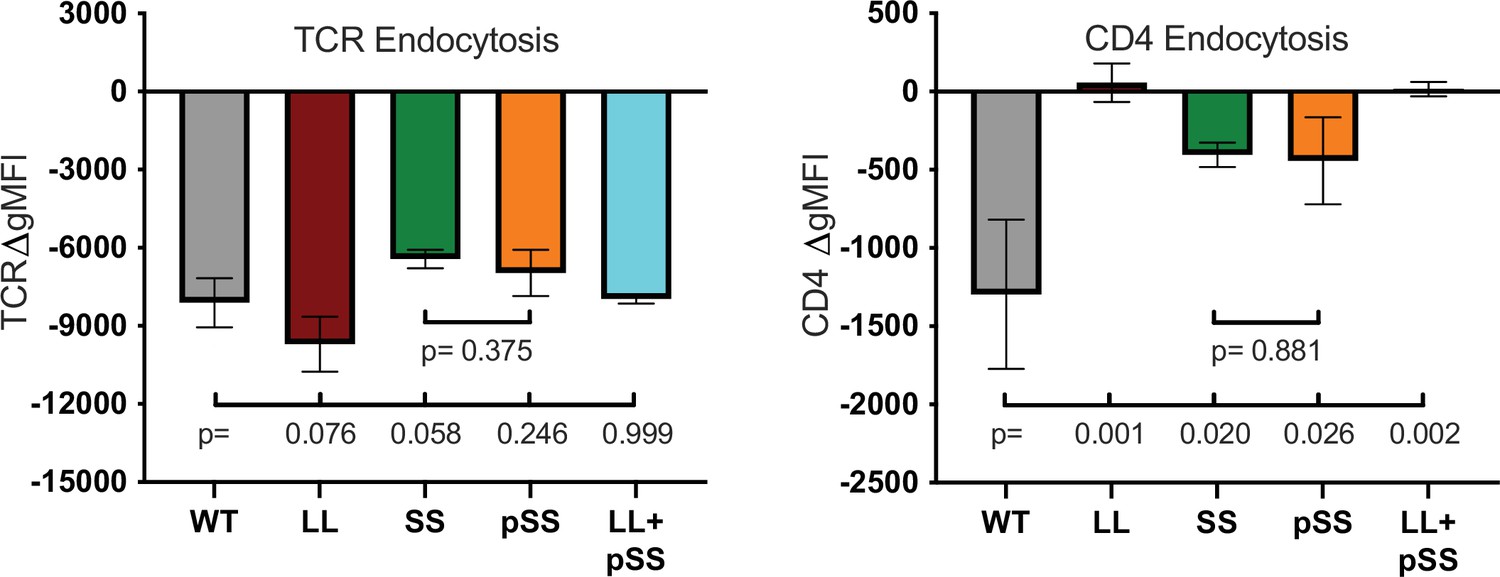
TCR and CD4 endocytosis.
TCR (left) and CD4 (right) endocytosis after pMHCII engagement is shown for the indicated cell lines after 16 hours coculture with APCs in the presence of 10μM MCC peptide. The change in TCR and CD4 gMFI, as measured by flow cytometry, is shown for each cell line relative to an equivalent sample cultured with APCs in the absence of MCC peptide. Each data point represents the mean ± SEM for three independent experiments (biological replicates). For endocytosis, measurements were performed in triplicate (technical replicates) for each experiment. One-way ANOVA was performed with a Dunnett’s posttest for comparisons with WT samples, and a Sidak’s posttest for comparisons between selected samples. Key: APC = Antigen Presenting Cell; gMFI = geometric Mean Fluorescence Intensity.
Figure 4 with 6 supplements
The IKRLL motif mediates the inhibitory function of the helix.
(A) CD4 signal normalized as a percent of the total is shown for each sucrose gradient fraction (left) along with the AUC analysis for the DRM (center) and DSM (right) fractions. (B) Cholera toxin subunit B (CTxB) signal normalized to CD4 signal detected is shown for each sucrose fraction (left) along with the AUC analysis for the DRM (center) and DSM fractions (right). (C) Lck signal normalized to CD4 signal is shown for each sucrose fractions (left) along with the AUC analysis for the DRM (center) and DSM (right) fractions. (D) IL-2 dose response to MCC peptide (left). AUC analysis as a measure of the response magnitude (center), and the average response to a low dose (41nM) of MCC as a measure of sensitivity (right) are shown. For (A–D), the data are presented as in Figure 2. Key: AUC = Area Under the Curve; DRM = Detergent Resistant Membrane; DSM = Detergent Soluble Membrane; CTxB = Cholera Toxin subunit B.
Figure 4—figure supplement 1
Surface expression.
Flow cytometry analysis of CD4 (left) and TCR (right) expression on 58α-β- cells. Parental 58α-β- cells served as negative control for surface expression (open black histogram trace).
Figure 4—figure supplement 2
Raw sucrose gradient values.
(A) Raw CD4 signal data is shown for each sucrose fraction (left). AUC is shown for the DRM (center) and DSM fractions (right). (B) Raw cholera toxin subunit B (CTxB) signal data is shown for each sucrose fraction (left). AUC is shown for the DRM (center) and DSM fractions (right). (C) Raw Lck signal data is shown for each sucrose fraction (left). AUC is shown for the DRM (center) and DSM fractions (right). For (A–C) each data point represents the mean ± SEM for three independent experiments (biological replicates). One-way ANOVA was performed with a Dunnett’s posttest for comparison with WT samples, and a Sidak’s posttest for comparisons between selected samples. Key: AUC = Area Under the Curve; DRM = Detergent Resistant Membrane; DSM = Detergent Soluble Membrane; CTxB = Cholera Toxin subunit B.
Figure 4—figure supplement 3
Total Lck normalized to CD4.
Total Lck signal normalized to CD4 signal data is shown for the indicated cell lines Each data point represents the mean ± SEM for three independent experiments (biological replicates). One-way ANOVA was performed with a Dunnett’s posttest for comparison with WT samples, and a Sidak’s posttest for comparisons between selected samples.
Figure 4—figure supplement 4
TCR and CD4 endocytosis.
TCR (left) and CD4 (right) endocytosis after pMHCII engagement is shown for the indicated cell lines after 16 hours coculture with APCs in the presence of 10μM MCC peptide. The change in TCR and CD4 gMFI, as measured by flow cytometry, is shown for each cell line relative to an equivalent sample cultured with APCs in the absence of MCC peptide. Each data point represents the mean ± SEM for three independent experiments (biological replicates). For endocytosis measurements were performed in triplicate (technical replicates) for each experiment. One-way ANOVA was performed with a Dunnett’s posttest for comparisons with WT samples, and a Sidak’s posttest for comparisons between selected samples. Key: APC = Antigen Presenting Cell; gMFI = geometric Mean Fluorescence Intensity.
Figure 4—figure supplement 5
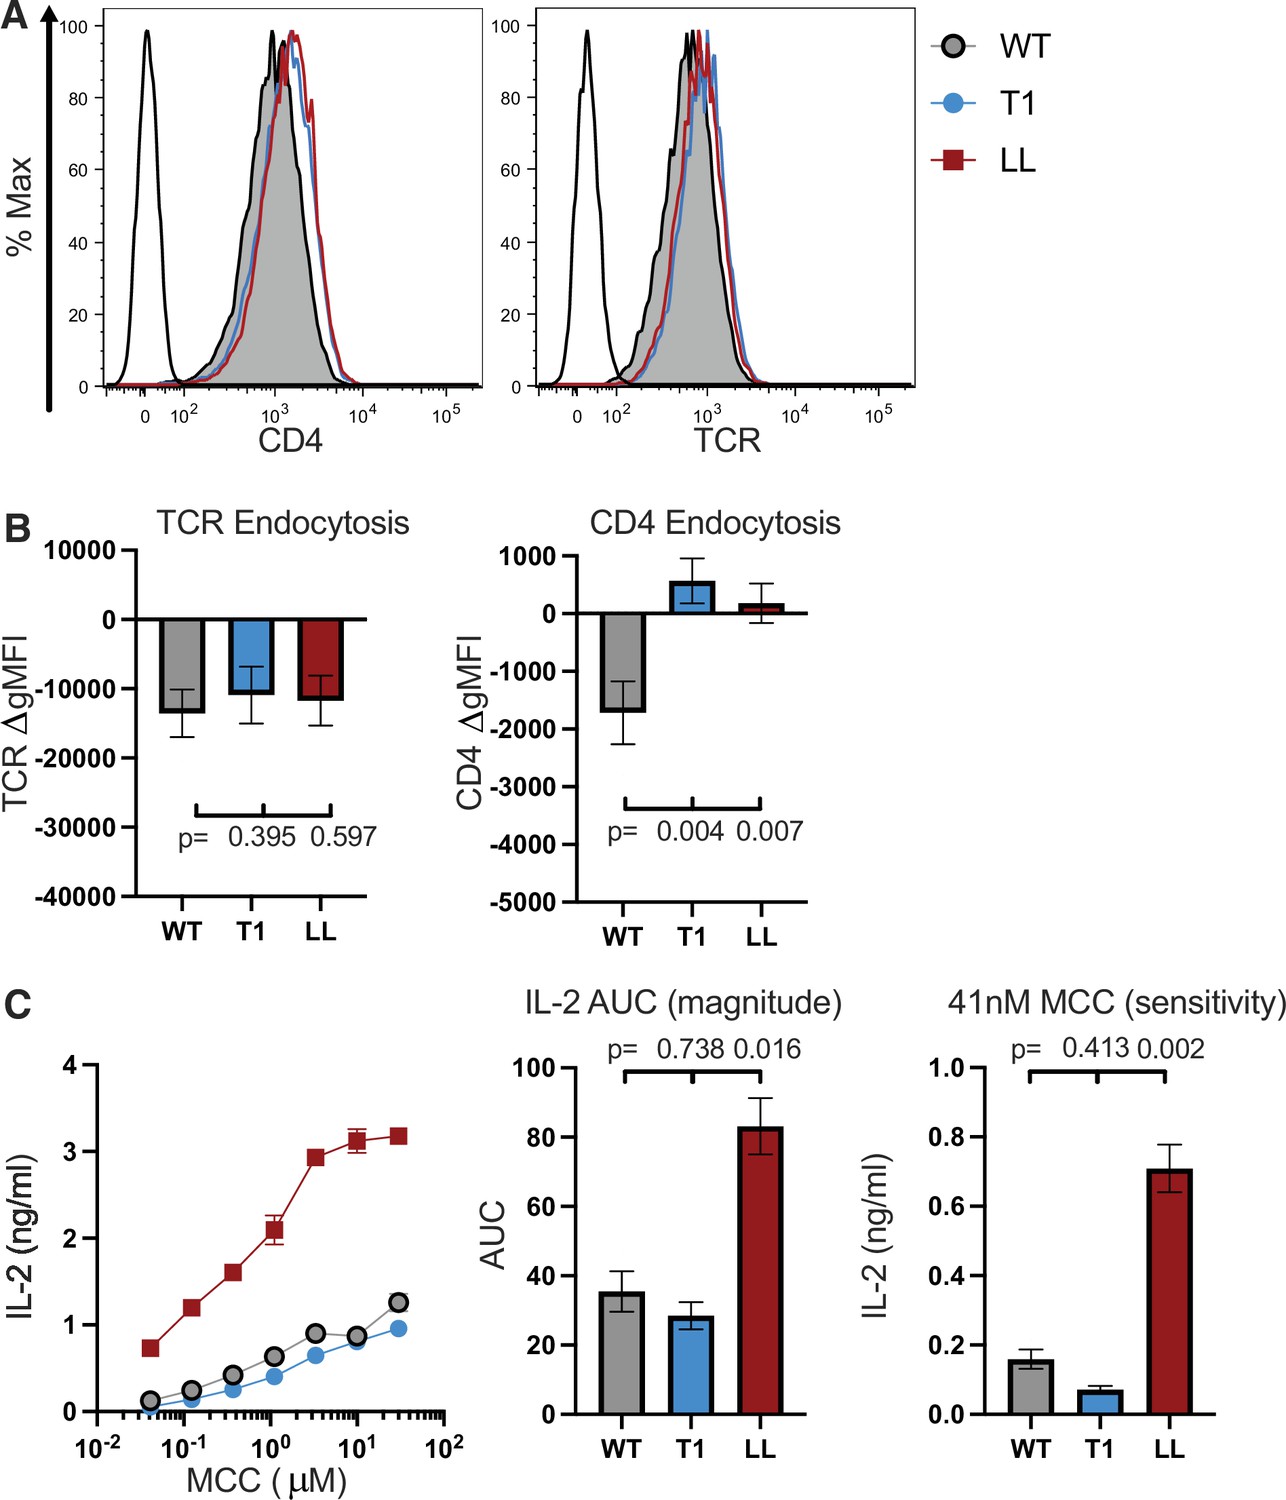
Comparison of CD4 T1 and LL mutants.
(A) Flow cytometry analysis of CD4 (left) and TCR (right) expression on 58α-β- cells. Parental 58α-β- cells served as negative control for surface expression (Open black histogram trace). (B) TCR (left) and CD4 (right) endocytosis after pMHCII engagement is shown for the indicated cell lines after 16 hours coculture with APCs in the presence of 10μM MCC peptide. The change in TCR and CD4 gMFI, as measured by flow cytometry, is shown for each cell line relative to an equivalent sample cultured with APCs in the absence of MCC peptide. Each data point represents the mean ± SEM for three independent experiments (biological replicates). For endocytosis measurements were performed in triplicate (technical replicates) for each experiment. One-way ANOVA was performed with a Dunnett’s posttest for comparisons with WT samples, and a Sidak’s posttest for comparisons between selected samples. (C) IL-2 production is shown in response to a titration of MCC peptide (left). AUC analysis for the dose response is shown as a measure of the response magnitude (center). The average response to a low dose (41nM) of peptide is shown as a measure of sensitivity (right). For (C), the dose response represents one of three experiments showing the ± SEM of triplicate wells (technical replicates). The magnitude and sensitivity data represents the mean +/- SEM of three independent experiments (biological replicates). One-way ANOVA with a Dunnett’s posttest for comparisons with WT samples. Key: APC = Antigen Presenting Cell, MCC = Moth Cytochrome C (88-103); gMFI = geometric Mean Fluorescence Intensity; AUC = Area Under the Curve.
Figure 4—figure supplement 6
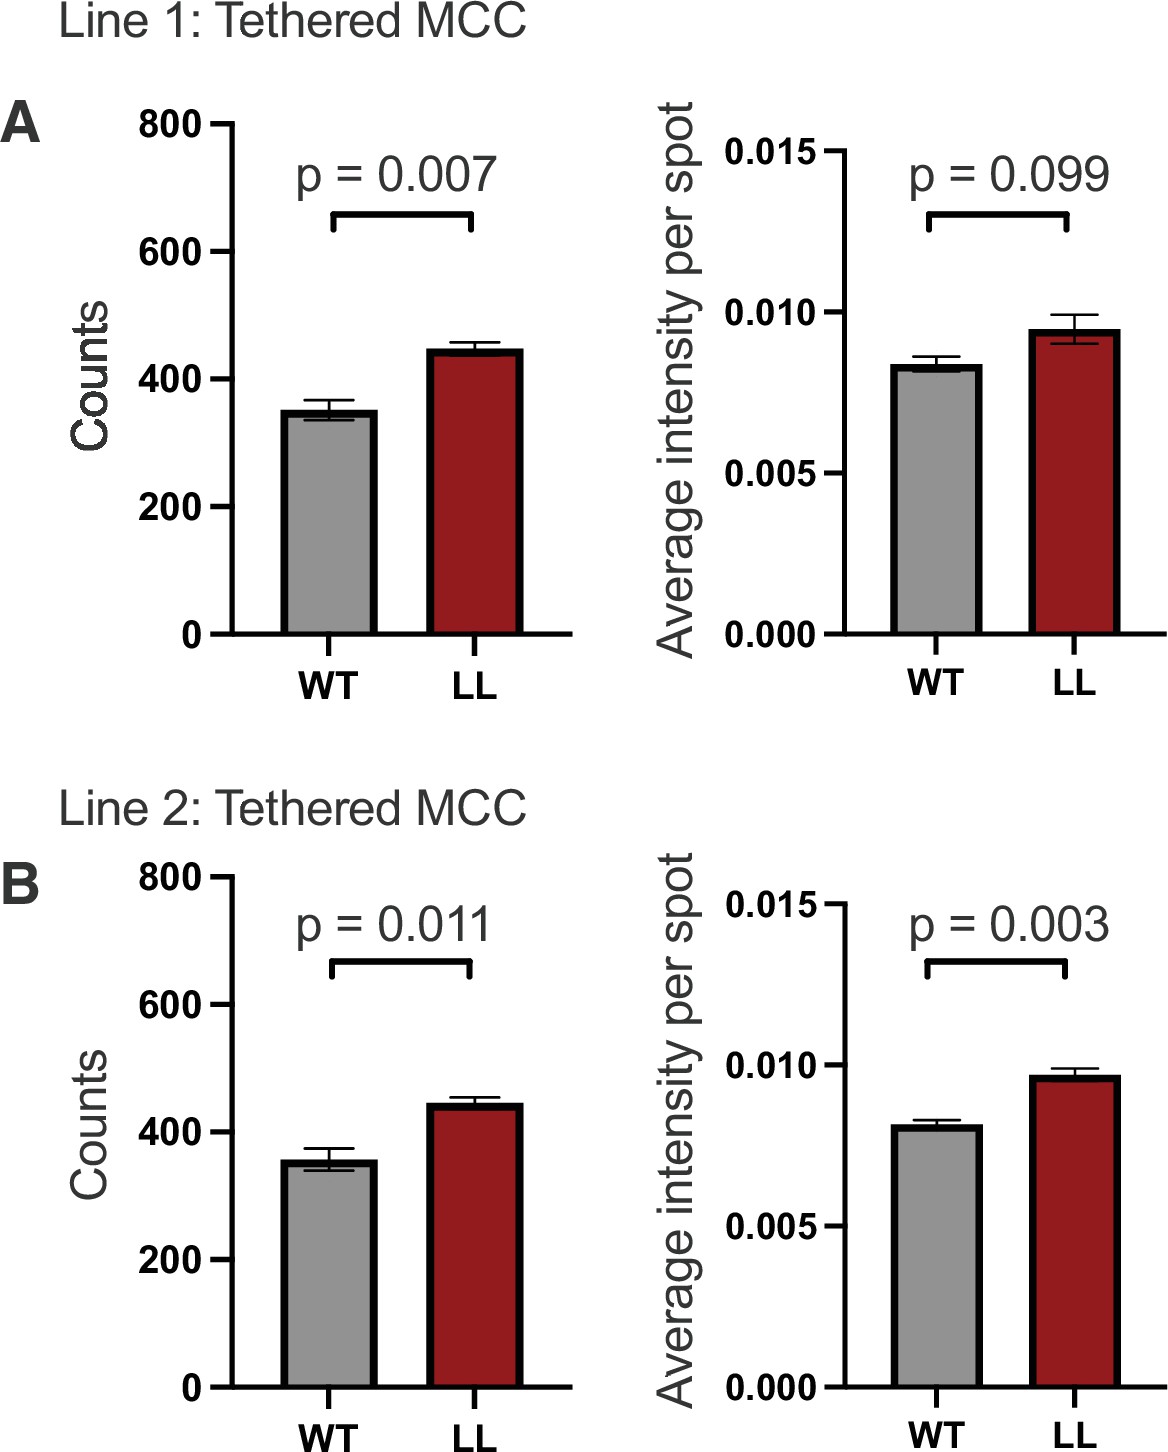
ELISPOT analysis.
(A) ELISpot data is shown for 1.25X10³ 58α-β- cells expressing WT CD4 or the LL mutant (Line 1) after 16hrs coculture with 1X10⁵ M12 cells expressing tethered MCC:I-Ek molecules. Graphs of spot counts (right) and average intensity per spot (left) ± SEM are shown for an independent cell line. (B) ELISpot data is shown as in (A) for Line 2. Student's t Test were performed for statistical comparisons.
Figure 5 with 1 supplement
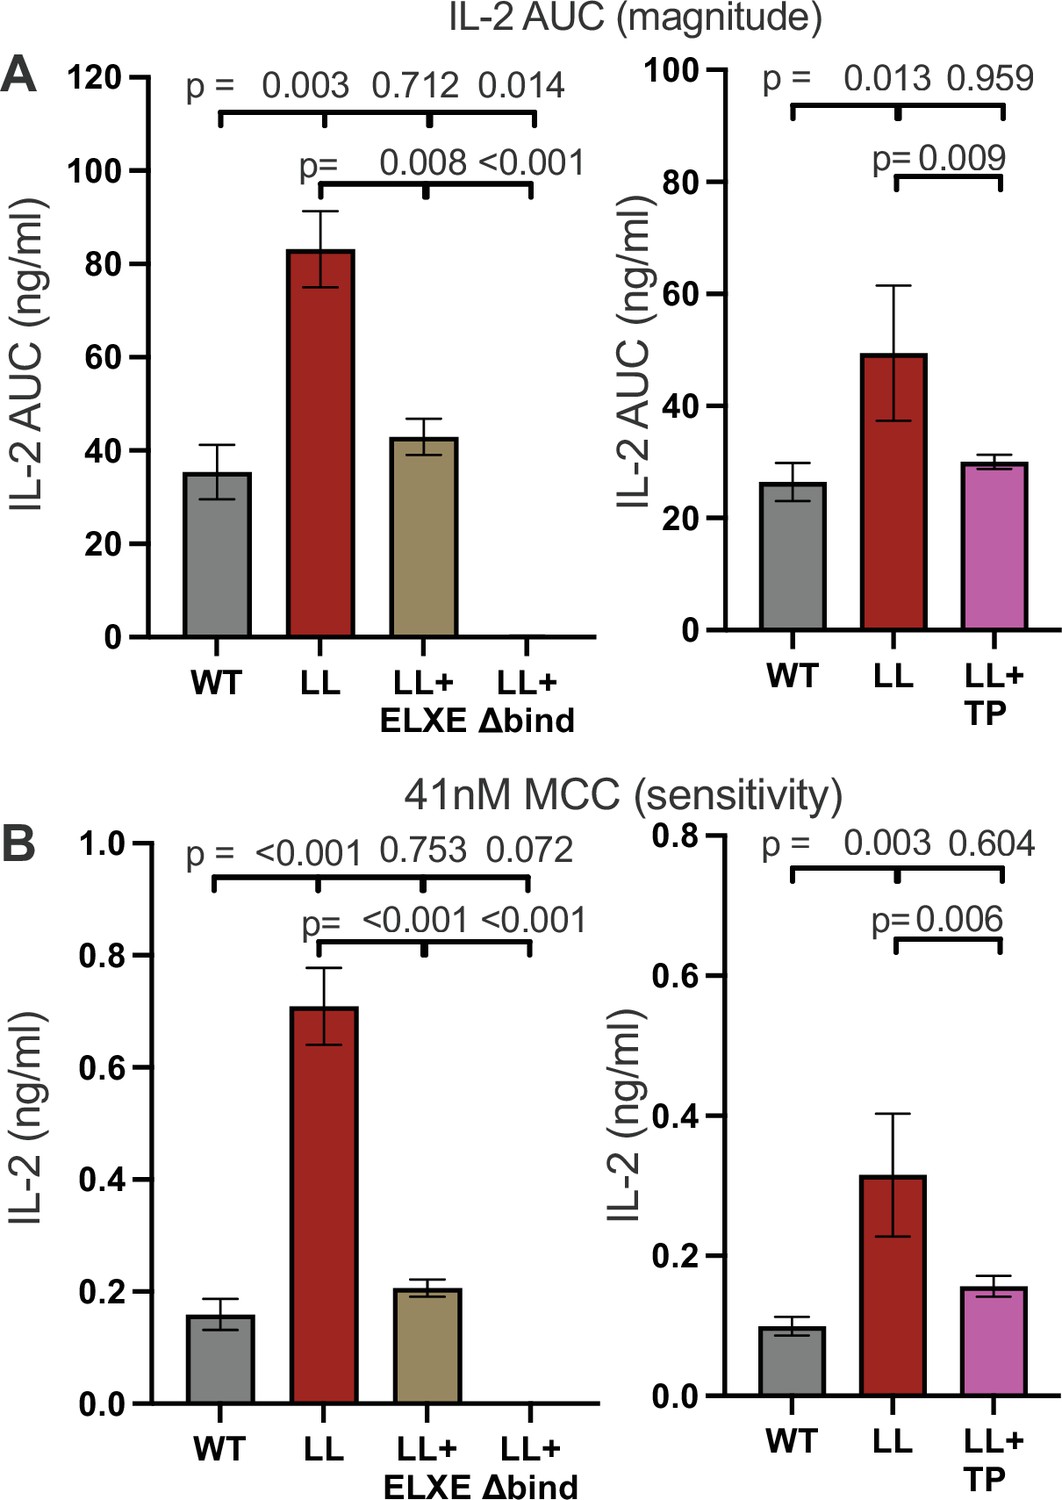
Coevolving motifs in the extracellular and intracellular domains functionally counterbalance each other.
(A) AUC analysis of IL-2 dose response to MCC peptide are shown as a measure of the response magnitude for the indicated samples. (B) The average IL-2 response to a low dose (41nM) of MCC is shown as a measure of sensitivity for the indicated samples. For (A and B) the magnitude and sensitivity data represent the mean ± SEM of three independent experiments (biological replicates) for which triplicate measurements were performed (technical replicates). One-way ANOVA was performed with a Dunnett's posttest for comparisons with WT samples, and a Sidak's posttest for comparisons between selected samples. Individual graphs indicate experiments that were performed with cell lines generated at the same time. Key: AUC = Area Under the Curve.
Figure 5—figure supplement 1
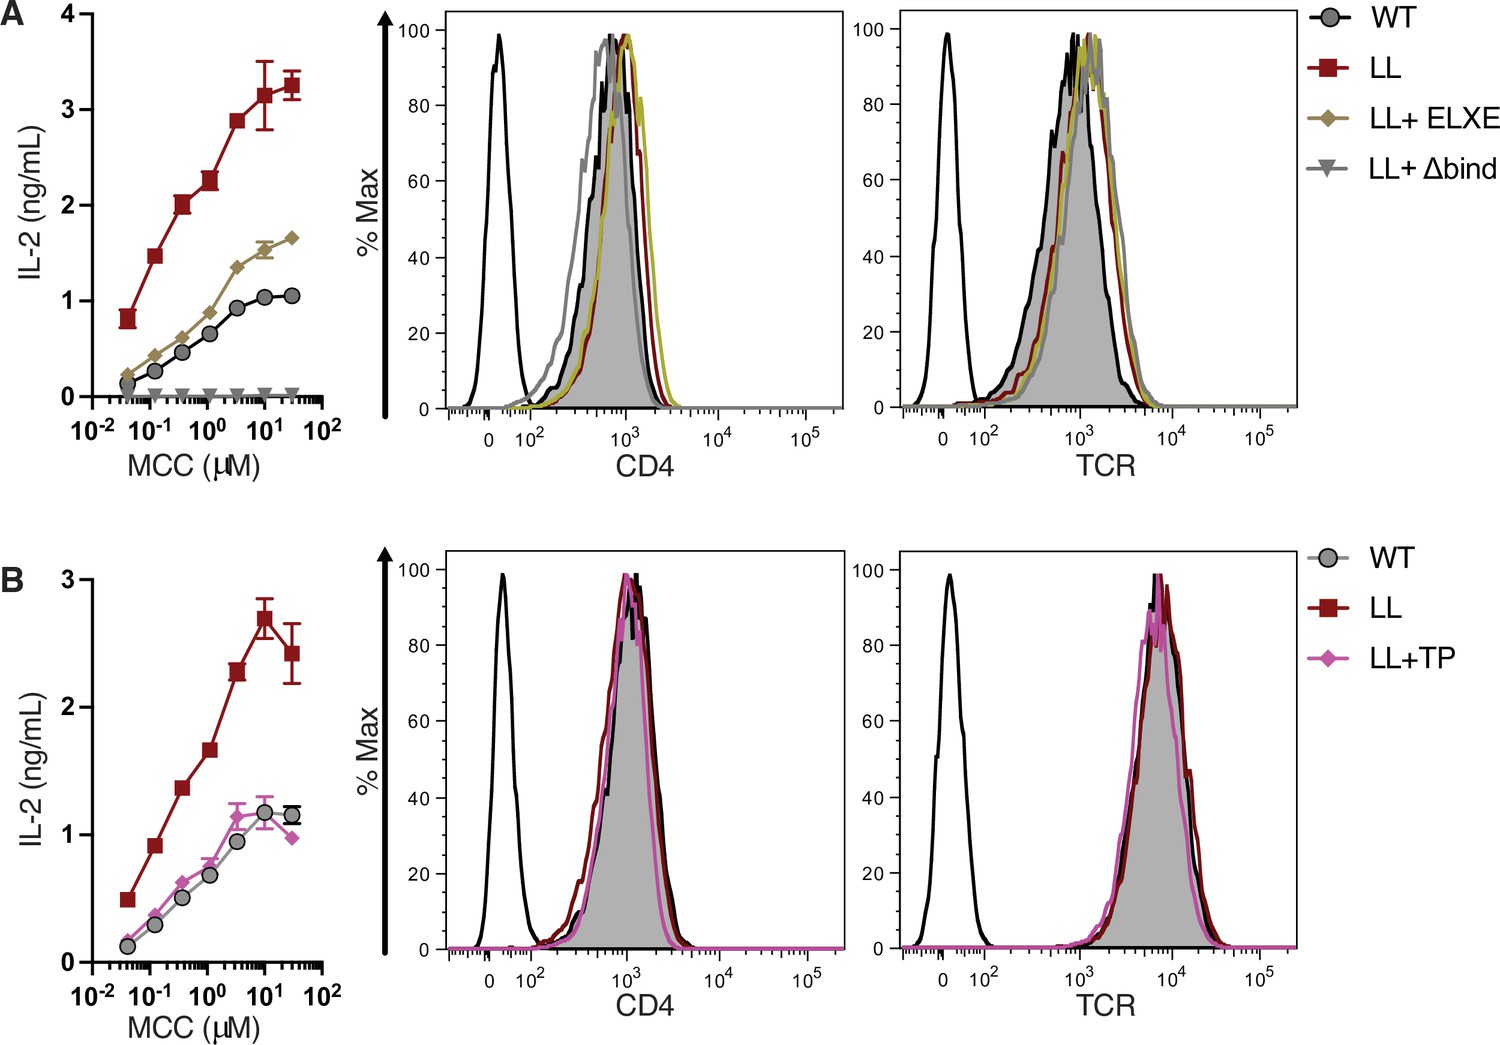
IL-2 production and surface expression.
(A) IL-2 production is shown in response to a titration of MCC peptide (left). Flow cytometry analysis of CD4 (center) and TCR (right) expression on 58α-β- cells. Parental 58α-β- cells served as negative control for surface expression (open black histogram trace). (B) IL-2 production is shown in response to a titration of MCC peptide (left). Flow cytometry analysis of CD4 (center) and TCR (right) expression on 58α-β- cells. Parental 58α-β- cells served as negative control for surface expression (open black histogram trace). For (A-B), the dose response represents one of three experiments showing the ± SEM of triplicate wells (technical replicates).
Figure 6 with 4 supplements
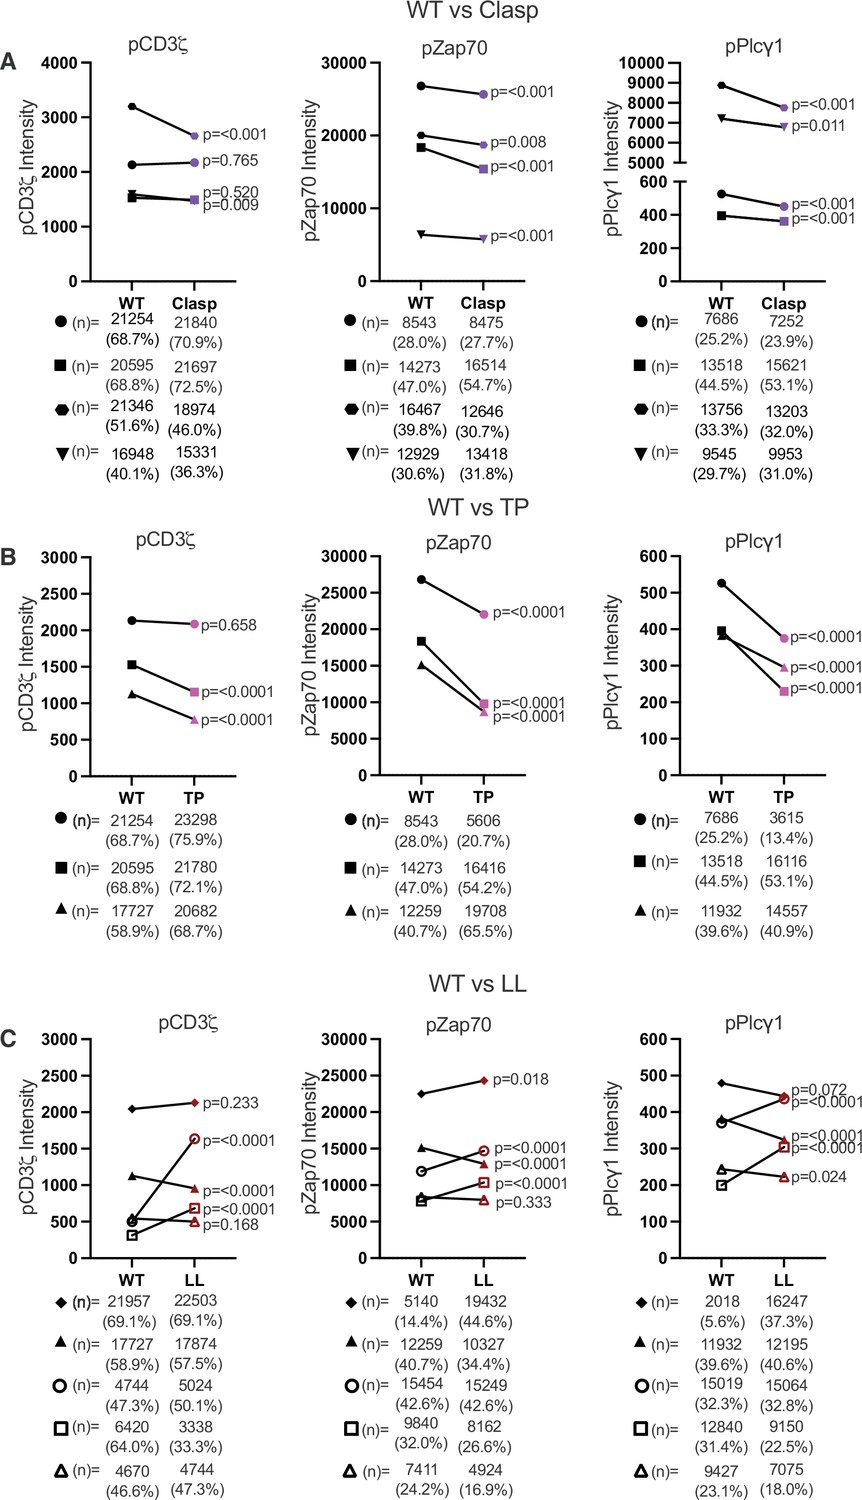
The CQC, GGXXG + CV+C, and IKRLL motifs differentially impact proximal TCR-CD3 signaling.
(A) Phosphorylation intensity for CD3ζ (left), Zap70 (center), and Plcγ1 (right) are shown for paired (connecting line) WT and Clasp mutant cell lines. Four independently generated cell lines were tested. (B) Phosphorylation intensity for CD3ζ (left), Zap70 (center), and Plcγ1 (right) are shown for paired (connecting line) WT and TP mutant cell lines. Three independently generated cell lines were tested. (C) Phosphorylation of CD3ζ (left), Zap70 (center), and Plcγ1 (right) are shown for paired (connecting line) WT and LL mutant cell lines. Five independently generated cell lines were tested. For (A–C), filled symbols represents the mean ± SEM of concatenated data for coupled cells from three independent experiments. 10,000 coupled cells were collected per experiment (technical replicates), resulting in the concatenation of 30,000 coupled cells total from the 3 independent biological replicates. For (C), the open symbols represent the mean and ± SEM for one single experiment (10,000 coupled cells analyzed). One-way ANOVA was performed with a Dunnett's posttest when the experiments involved multiple comparisons. Student's t-test were performed for when only WT and mutant pairs were analyzed in an experiment. The derived p values for each independent cell line comparing the mutant CD4 to its paired WT is shown. Next to each symbol the number of cells determined to have responded to stimuli are shown with the percentage of responding cells.
Figure 6—figure supplement 1

Proximal signaling analysis workflow.
Example of intracellular signaling analysis workflow. (A) Flow cytometry analysis of 58α-β-:M12 cell couples. Representative dot plots are shown for TCRβGFP+ CD4+ 58α-β- cells coupled to Tag-it Violet-labeled M12 cells expressing the indicated tethered pMCHII: Hb:I-Ek (left) and MCC:I-Ek (center). Representative histograms of 58α-β- cells coupled to M12 cells expressing the indicated tethered pMHCII is shown for pCD3ζ intensity. (B) A representative smoothed overlapping histogram of pCD3ζ intensity is shown for 58α-β- cells coupled to Hb:I-Ek (cyan) or MCC:I-Ek (black) expressing M12 cells. Histogram of pCD3ζ intensity for 58α-β-:MCC:I-Ek M12 cell couples subtracted from Hb:I-Ek M12 cell couples show the difference in pCD3ζ intensity on a bin-by-bin basis after stimulation with agonist MCC:I-Ek compared with null Hb:I-Ek for WT (left) and Clasp mutant (center) cells. Overlapping pCD3ζ histogram (right) of cells responding to MCC:I-Ek after Hb:I-Ek subtraction shows the responding populations for the WT and Clasp mutant cell lines. (C) Concatenated pCD3ζ average intensity ± SEM of WT and Clasp mutant cells (left) and the percent of responding WT and Clasp mutant cells (right).For pCD3ζ intensity in (C), one-way ANOVA was performed with a Dunnett’s posttest for comparison with the WT sample because other mutants were simultaneously analyzed in this experiment but are not shown.
Figure 6—figure supplement 2
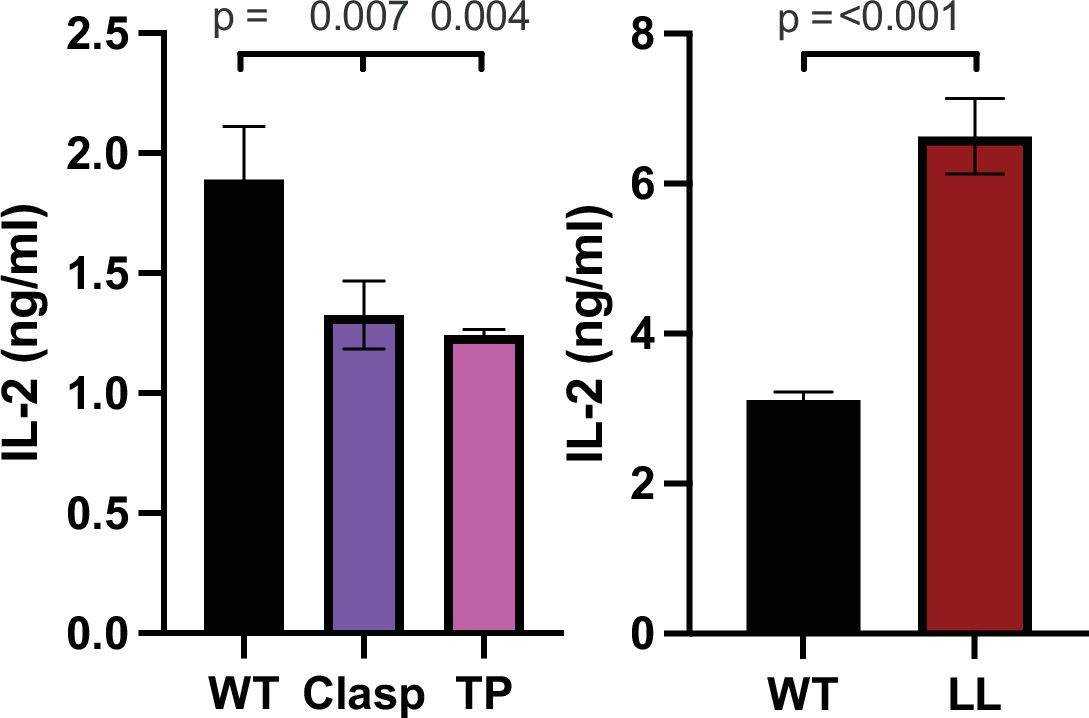
IL-2 production to agonist tethered pMHCII+ APCs.
IL-2 production is shown for cocultures of 5X10⁴ 58α-β- hybridomas expressing the CD4 WT or CD4 mutants of Clasp, TP, and LL with the 5c.c7 TCR and with 1X10⁵ M12 cells expressing agonist pMHCII, MCC:I-Ek for 16 hours. One-way ANOVA was performed with a Dunnett's posttest for comparison with WT samples because other mutants were simultaneously analyzed in this experiment but are not shown. Data are mean ± SEM of triplicate wells and representative of three experiments (biological replicates). Key: APC = Antigen Presenting Cell.
Figure 6—figure supplement 3
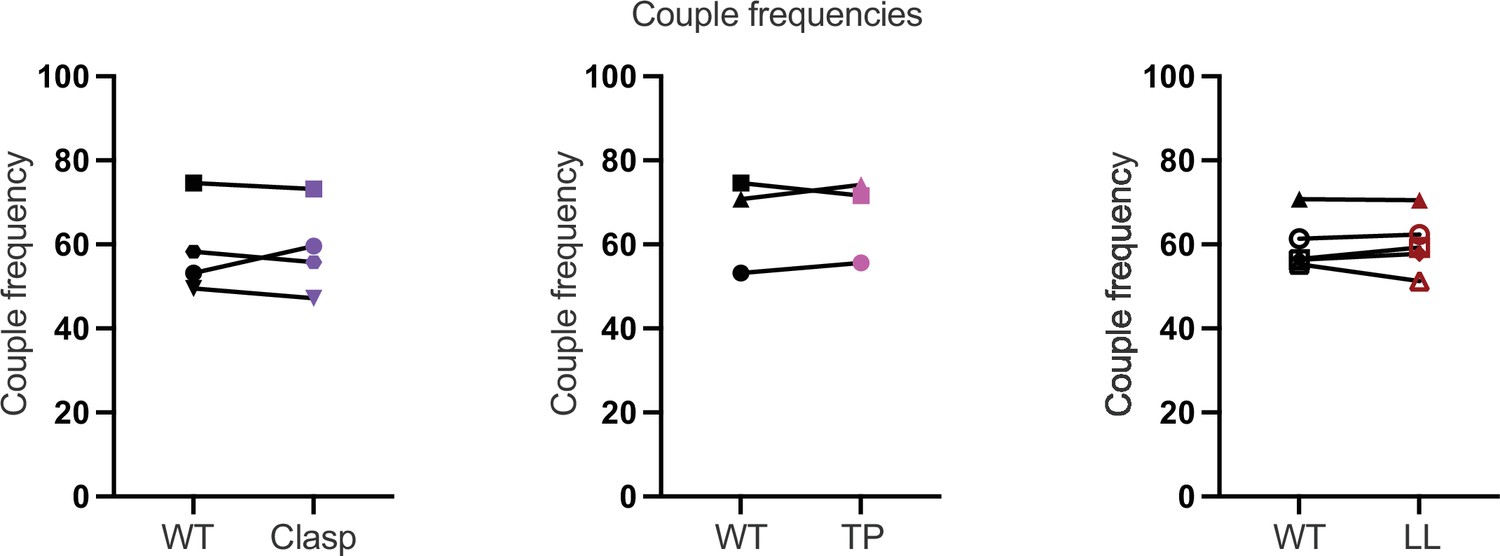
Coupling frequency.
Coupling frequencies are shown for the WT and mutant cells lines shown in Figure 6.
Figure 6—figure supplement 4

Proximal signaling and IL-2 production in response to weak agonist pMHCII for WT and Clasp mutant cell lines.
(A) Phosphorylation intensity for CD3ζ (left), Zap70 (center), and Plcγ1 (right) are shown for paired (connecting line) WT and Clasp mutant cell lines. Four independently generated cell lines were tested when engaged with T102S:IEk expressing M12 cells. (B) IL-2 production is shown for cocultures of 5X10⁴ 58α-β- hybridomas expressing the CD4 WT or Clasp with the with 1X10⁵ M12 cells expressing agonist pMHCII, T102S:I-Ek for 16 hours. Paired Student's t Test were performed for statistical comparisons. Key: APC = Antigen Presenting Cell.
Tables
Table 1
Motifs and mutants analyzed in this study.
| Motif location/known function | Mutant names | Mutated motif | Residue mutations |
|---|---|---|---|
| TMD/protein or cholesterol interactions | TMD | GGxxG | G403V, G406L |
| Juxtamembrane/palmitoylation | Palm | CV +C | C418S, C421S |
| TMD + palm/raft localization | TP | GGxxG, CV +C | G403V, G406L, C418S, C421S |
| ICD clasp/interact with Lck, Lat | Clasp | CQC | C444S, C446S |
| TMD + palm + clasp/raft, Lck, Lat interaction | TPC | GGxxG, CV +C, CQC | See TMD + palm + clasp above |
| Total ICD helix | H | Total helix mutation | aa430–442 (to NGPGGNPGGNAGG) |
| Total helix + clasp | HC | Total helix + CQC | aa430–442, C444S, C446S |
| Helix IKRLL only | LL | IKRLL | L437A, L438L |
| Helix serines only | SS | RMSQIKRLLSEKK | S432A, S439A |
| Phosphomimetic helix serines | pSS | RMSQIKRLLSEKK | S432D, S439D |
| Helix IKRLL + serines (does not express) | LL +SS | See LL and SS | L437A, L438L, S432A, S439A |
| Helix IKRLL + phosphomimetic serines | LL + pSS | See LL and pSS | L437A, L438L, S432D, S439D |
| C-terminally truncated CD4 | CD4-T1 | Ends at R422 | R422 is the last residue |
| Extracellular D3 domain nonpolar patch | D3Patch | PXLF | P228E, F231E |
| Extracellular D1 C″-strand (binds pMHCII) | Δbind | GKGVLIR | K68D, V70D, L71S, I72D, R73S |
| IKRLL + D3 nonpolar patch | LL + D3Patch | IKRLL +PXLF | L437A, L438L + P228E, F231E |
| IKRLL + Δbind | LL+ Δbind | See LL + Δbind | L437A, L438L + K68D, V70D, L71S, I72D, R73S |
Additional files
-
MDAR checklist
- https://cdn.elifesciences.org/articles/79508/elife-79508-mdarchecklist1-v2.docx
-
Supplementary file 1
Table 2.
- https://cdn.elifesciences.org/articles/79508/elife-79508-supp1-v2.xlsx
-
Supplementary file 2
Construct sequences.
- https://cdn.elifesciences.org/articles/79508/elife-79508-supp2-v2.docx
Download links
A two-part list of links to download the article, or parts of the article, in various formats.
Downloads (link to download the article as PDF)
Open citations (links to open the citations from this article in various online reference manager services)
Cite this article (links to download the citations from this article in formats compatible with various reference manager tools)
Enhancing and inhibitory motifs regulate CD4 activity
eLife 11:e79508.
https://doi.org/10.7554/eLife.79508


