Variation in ubiquitin system genes creates substrate-specific effects on proteasomal protein degradation
- Department of Genetics, Cell Biology, and Development, University of Minnesota, United States
Figures
Figure 1 with 2 supplements
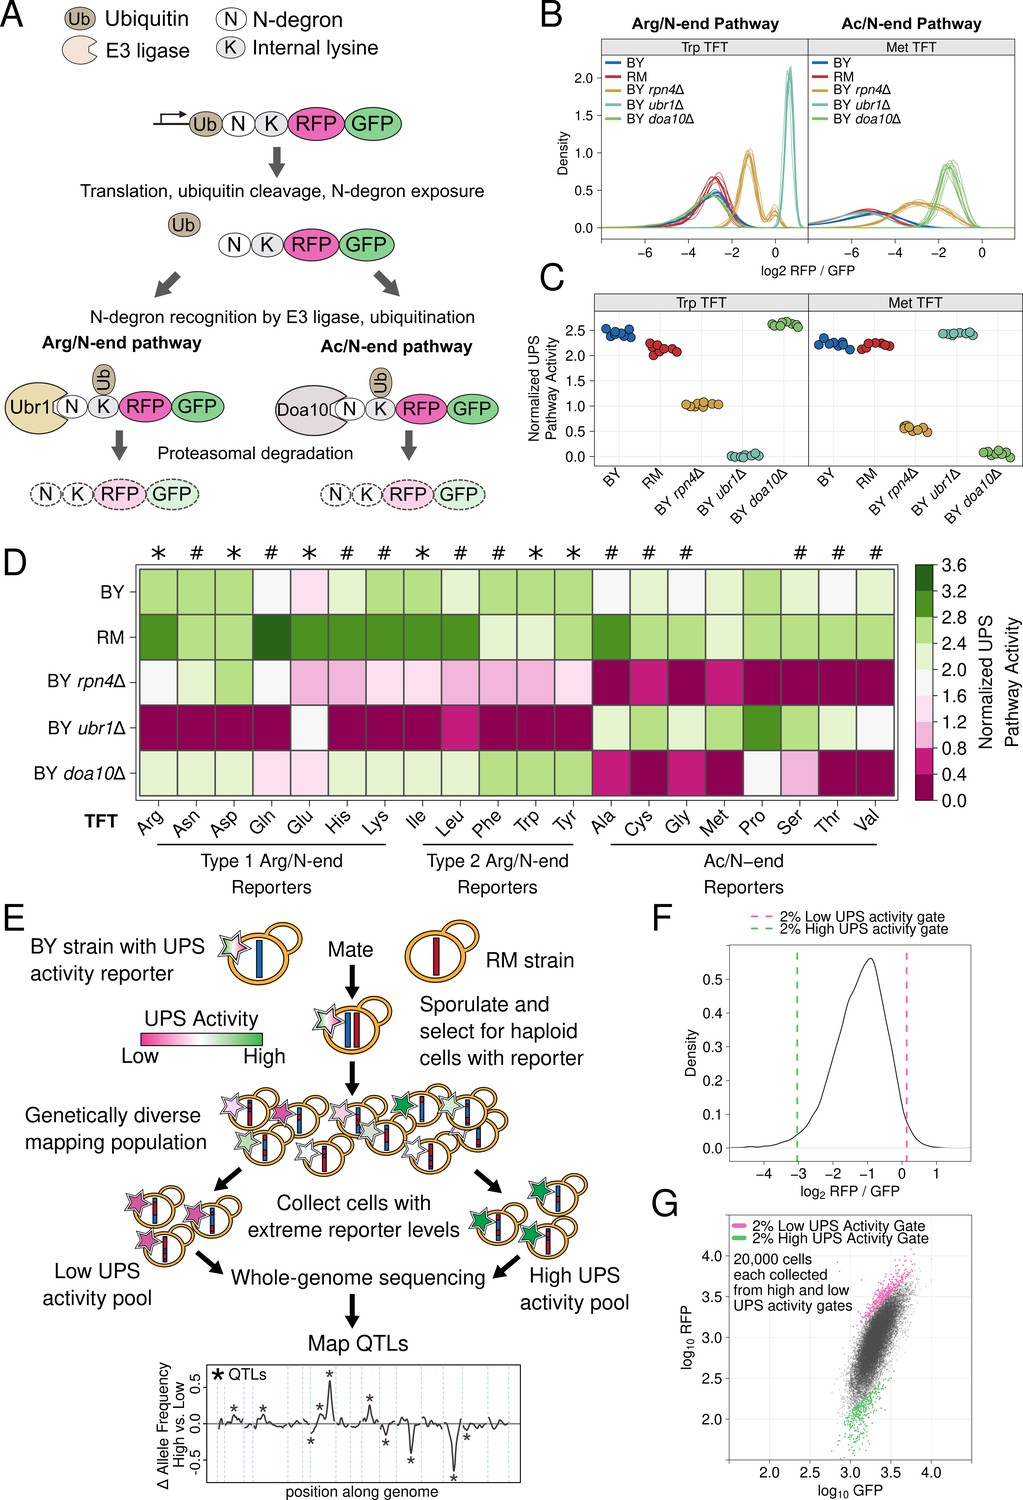
UPS N-end rule activity reporters and genetic mapping method.
(A) Schematic of the production and degradation of UPS activity reporters according to the UPS N-end rule. (B) Density plots of the log2 RFP / GFP ratio from 10,000 cells for each of 8 independent biological replicates per strain per reporter for representative Arg/N-end and Ac/N-end pathway reporters. "BY" and "RM" are genetically divergent yeast strains. "BY rpn4Δ", "BY ubr1Δ”, and "BY doa10Δ" carry the indicated gene deletions in the BY background and were used as reporter control strains. (C) The median from each biological replicate in B. was scaled, normalized, and plotted as a stripchart such that y axis values are directly proportional to UPS activity. (D). Heatmap for all strains and N-degrons using data generated as in C. Symbols above the heatmap denote significant UPS activity differences between BY and RM. "*" indicates 0.05 > Tukey HSD p > 1e-6; “#” indicates Tukey HSD p < 1e-6. (E) Schematic of the bulk segregant analysis genetic mapping method used to identify UPS activity QTLs. (F) Density plot of the UPS activity distribution for a genetically diverse mapping population harboring the tryptophan (Trp) N-degron reporter. Dashed vertical lines show the thresholds used to collect cells with extreme UPS activity, which correspond to the high and low UPS activity pools denoted in E. (G) Backplot of the cells collected in F. onto a scatter plot of GFP and RFP.
-
Figure 1—source data 1
Results of all between-strain comparisons for all N-degron TFTs.
- https://cdn.elifesciences.org/articles/79570/elife-79570-fig1-data1-v2.xlsx
Figure 1—figure supplement 1
Comparison of UPS activity between strains across N-degron reporters.
The -log2 RFP / GFP ratio value was extracted from 10,000 cells from each of 8 independent biological replicates per strain per reporter and converted to Z-scores. High values correspond to high UPS activity and low values correspond to low UPS activity. Tukey HSD p-values for each between strain comparison for each reporter are listed in Figure 1—source data 1.
Figure 1—figure supplement 2
Overview of the constructs and strain construction steps used to generate yeast strains harboring TFT UPS activity reporters.
Figure 2
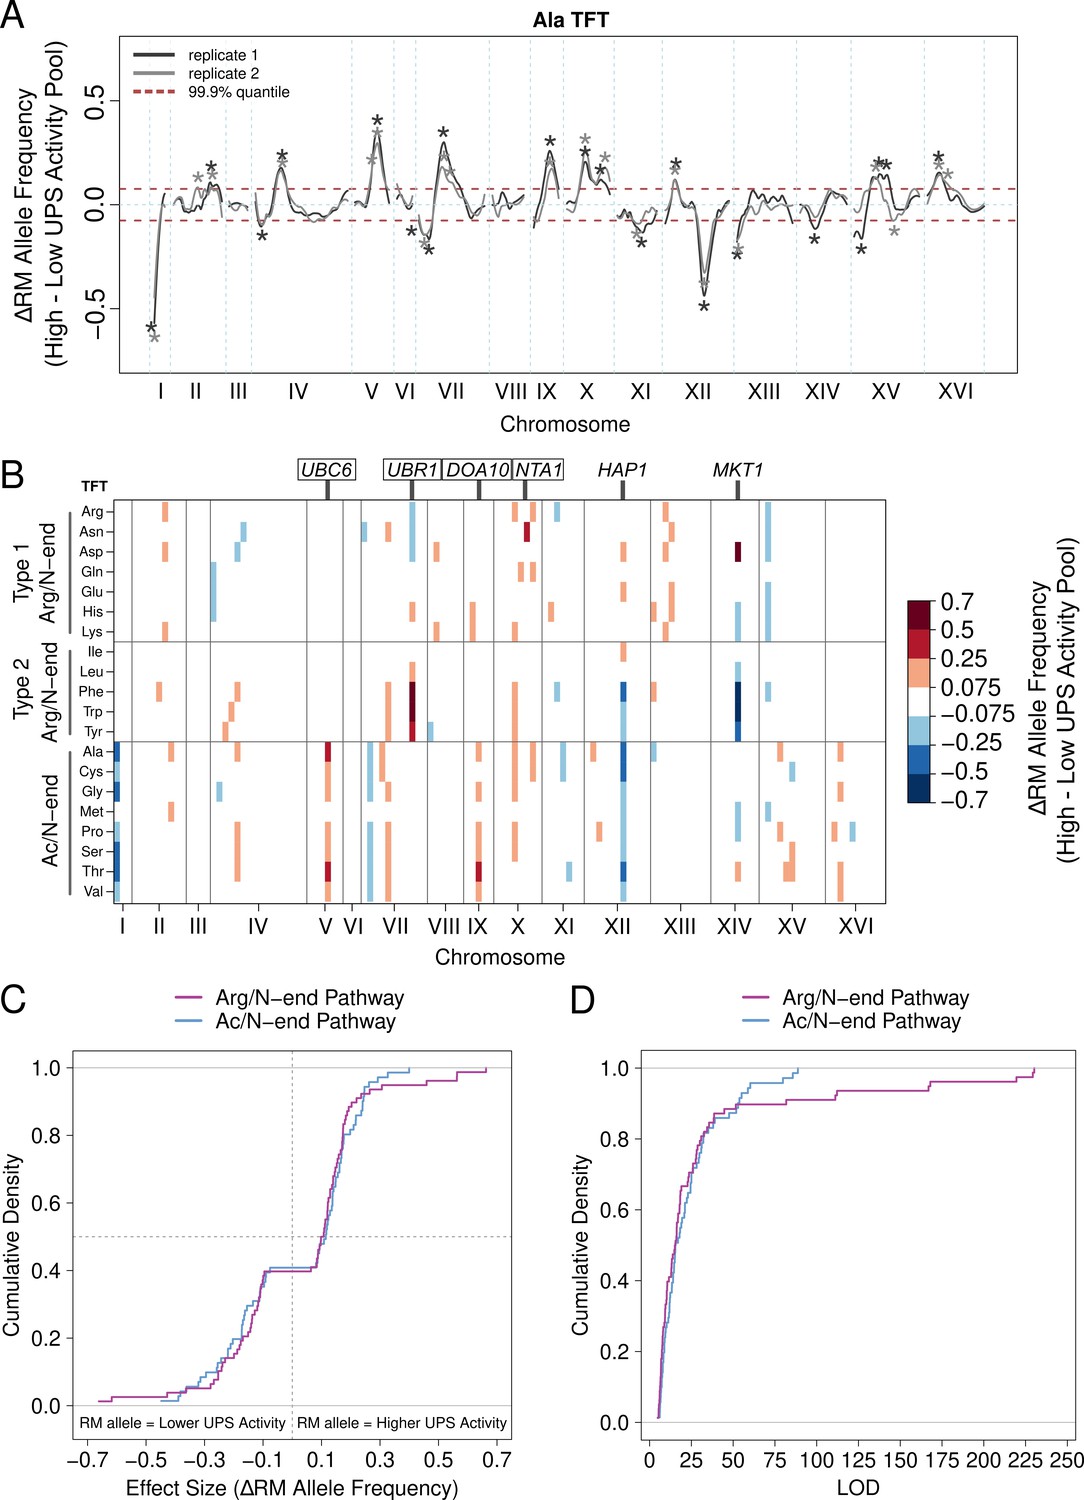
UPS activity QTL mapping results.
(A) Results from the alanine (Ala) N-degron reporter illustrate the results and reproducibility of the method. Asterisks denote QTLs, colored by biological replicate. (B) QTL mapping results for the 20 N-degrons. Colored blocks of 100 kb denote QTLs detected in each of two independent biological replicates, colored according to the direction and magnitude of the effect size (RM allele frequency difference between high and low UPS activity pools). Experimentally validated (boxed) and candidate (unboxed) causal genes for select QTLs are annotated above the plot. (C) Cumulative distributions of the effect size and direction for Arg/N-end and Ac/N-end QTLs. (D) Cumulative distribution of LOD scores for Arg/N-end and Ac/N-end QTLs.
-
Figure 2—source data 1
All N-end rule QTLs.
"chr" = chromosome, "LOD" = logarithm of the odds, "QTL_CI_left" = left index of QTL confidence interval, "QTL_peak" = peak position of QTL, "QTL_CI_right" = right index of QTL confidence interval.
- https://cdn.elifesciences.org/articles/79570/elife-79570-fig2-data1-v2.xlsx
-
Figure 2—source data 2
All distinct N-end rule QTL regions.
"chr" = chromosome, "QTL_CI_left" = left index of QTL confidence interval, "QTL_peak" = peak position of QTL, "QTL_right_CI" = right index of QTL confidence interval, "LOD" = logarithm of the odds, "RM_AFD" = RM allele frequency difference between high and low UPS activity pools.
- https://cdn.elifesciences.org/articles/79570/elife-79570-fig2-data2-v2.xlsx
Figure 3 with 3 supplements
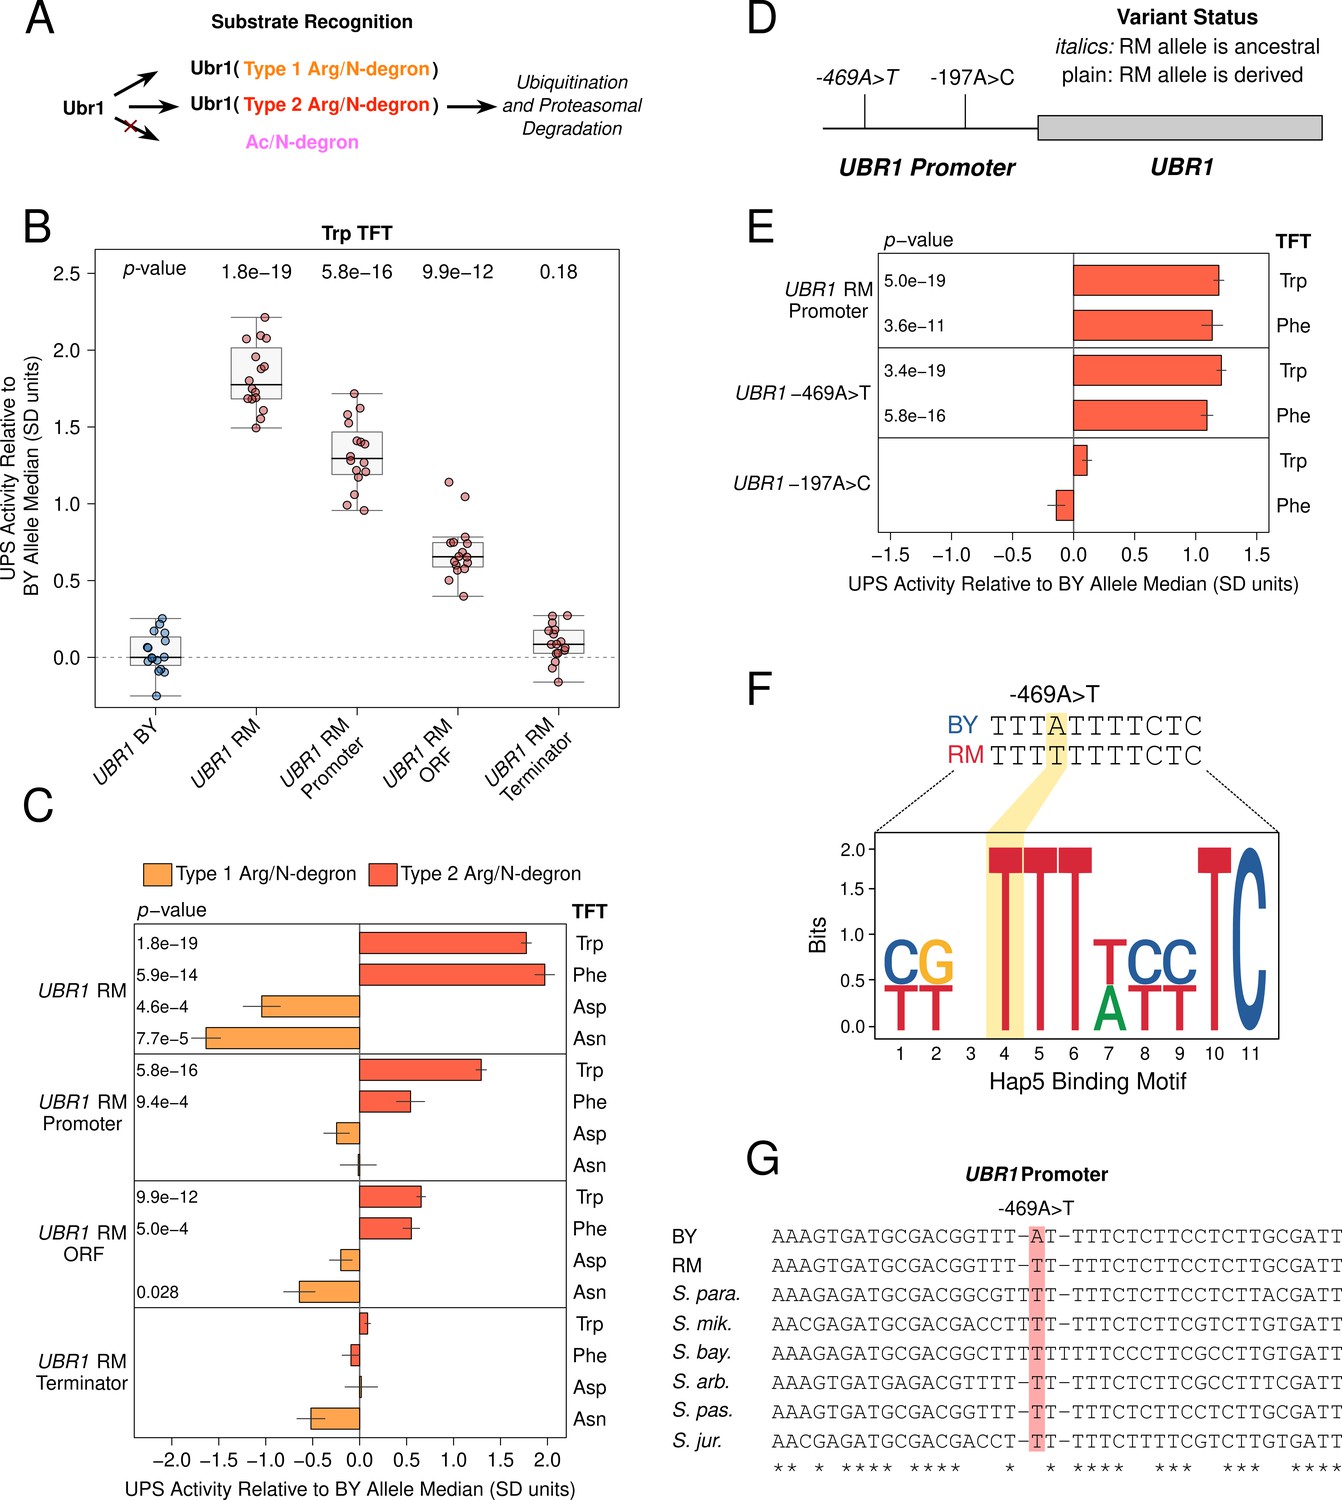
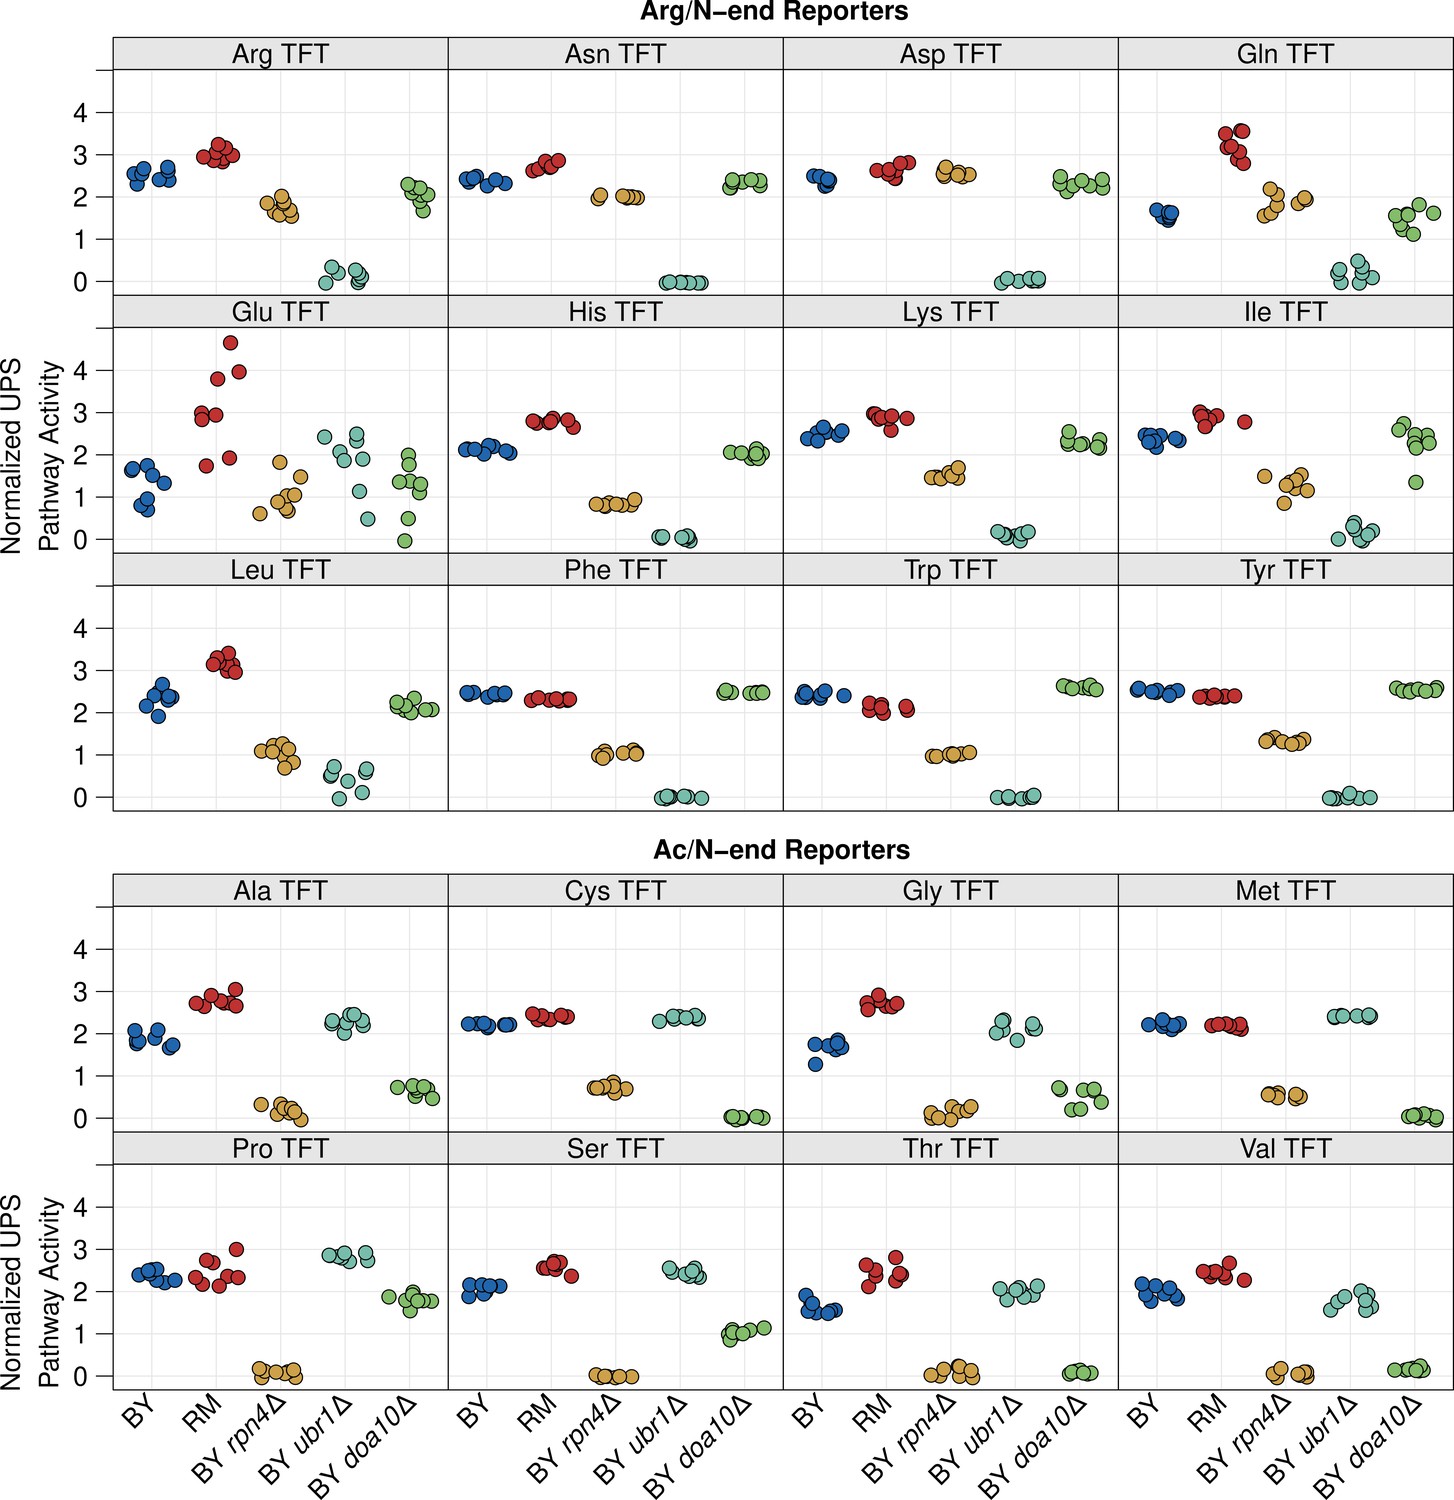
Substrate-specific effects of UBR1 variants on the degradation of Arg/N-degrons.
(A) Schematic illustrating Ubr1’s role in Arg/N-degron recognition. (B) Multiple causal DNA variants in UBR1 shape UPS activity towards the Trp N-degron. The BY strain was engineered to contain full or partial RM UBR1 alleles as indicated and UPS activity towards the Trp N-degron TFT was measured by flow cytometry. UPS activity was Z-score normalized and scaled relative to the median of a control BY strain engineered to contain the full BY UBR1 allele. Each point in the plot shows the median of 10,000 cells for each of 16 independent biological replicates per strain. p-values at the top of the plot display the Benjamini-Hochberg corrected p-value for the t-test of the indicated strain versus the strain with the BY UBR1 allele. Box plot center lines, box boundaries, and whiskers display the median, interquartile range, and 1.5 times the interquartile range, respectively. (C). Barchart summarizing the effects of RM UBR1 alleles on UPS activity towards the indicated Type 1 and 2 Arg/N-degrons using data generated as in B. p-values in the plot display the Benjamini-Hochberg corrected p-value for the t-test of the indicated strain versus the control strain engineered to contain the BY UBR1 allele. (D) Diagram of the individual BY / RM UBR1 promoter variants. (E) as in C., but for the RM UBR1 promoter and individual BY / RM UBR1 promoter variants. (F) Sequence logo of the Hap5 binding motif created by the causal –469A>T UBR1 promoter variant. (G) Multi-species alignment of the UBR1 promoter at the causal –469A>T variant. Abbreviations: ‘S. para.’, Saccharomyces paradoxus; ‘S. mik.’, Saccharomyces mikatae; ‘S. bay.’, Saccharomyces bayanus; ‘S. arb’, Saccharomyces arboricola; ‘S. pas.’, Saccharomyces pastorianus; ‘S. jur’, Saccharomyces jurei.
Figure 3—figure supplement 1
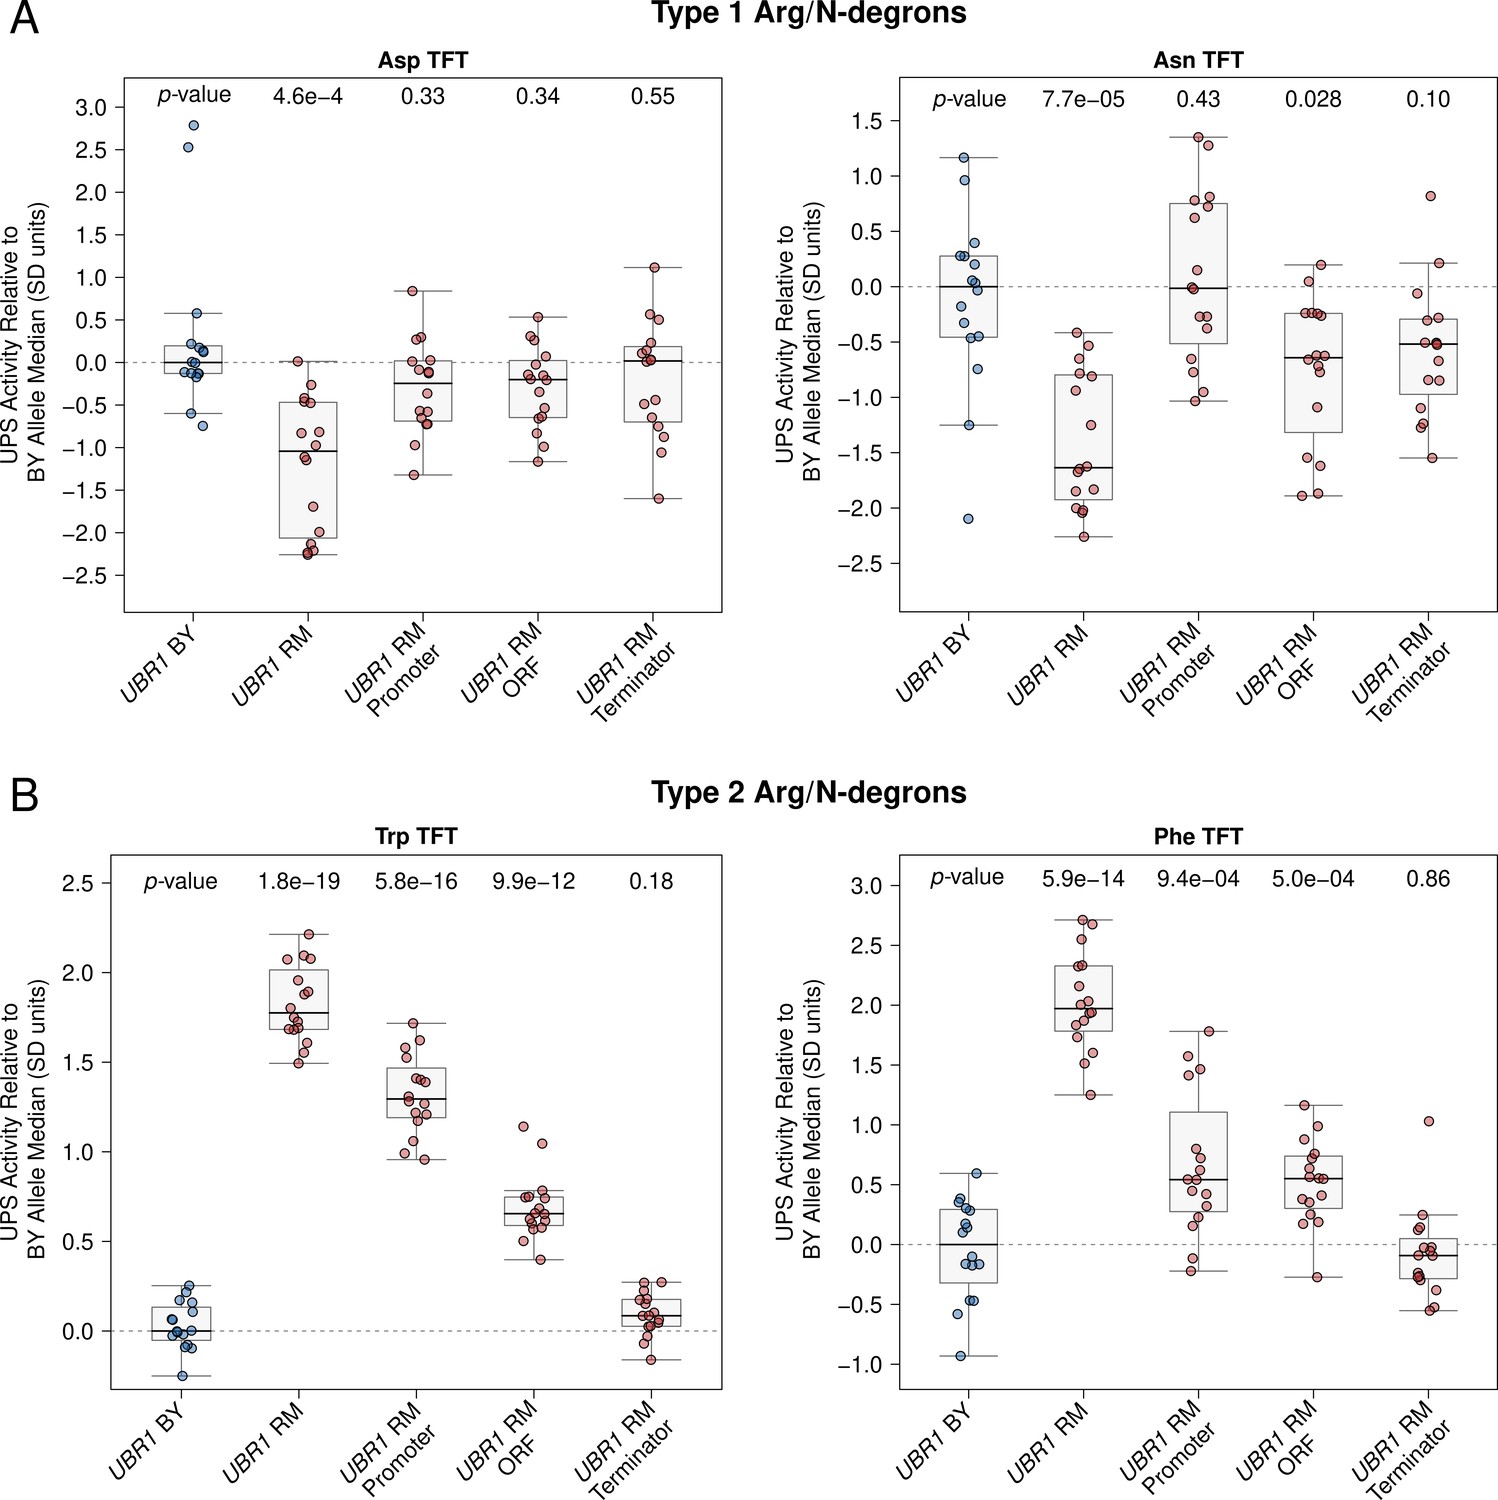
Raw UBR1 full gene fine-mapping data.
Raw UBR1 full gene fine-mapping results. The BY strain was engineered to contain full or partial RM UBR1 alleles as indicated and UPS activity towards the indicated Type 1 and Type 2 Arg/N-degron TFTs was measured by flow cytometry. UPS activity was Z-score normalized and scaled relative to the median of a control BY strain engineered to contain the full BY UBR1 allele. Each point in the plot shows the median of 10,000 cells for each of 16 independent biological replicates per strain per reporter. p-values at the top of the plot display the Benjamini-Hochberg-corrected p-value for the t-test of the indicated strain versus the strain with the BY UBR1 allele. Box plot center lines, box boundaries, and whiskers display the median, interquartile range, and 1.5 times the interquartile range, respectively. (A) UPS activity towards the indicated Type 1 Arg/N-degrons. (B) UPS activity towards the indicated Type 2 Arg/N-degrons.
Figure 3—figure supplement 2
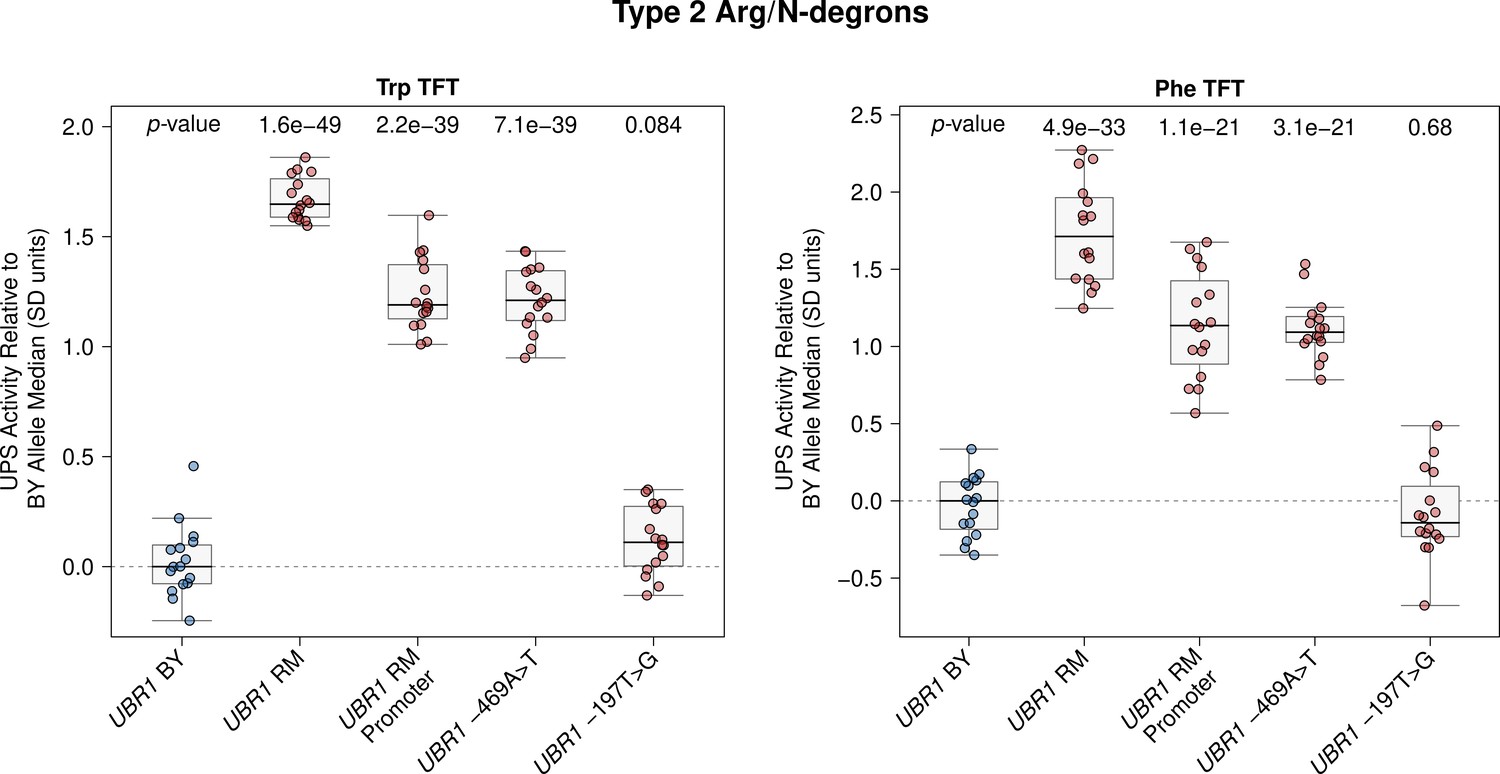
Raw UBR1 promoter fine-mapping data.
Fine-mapping the causal nucleotide in the UBR1 promoter. The BY strain was engineered to carry the RM UBR1 promoter or one of the two single nucleotide BY / RM UBR1 promoter variants as indicated and UPS activity towards the Trp and Phe Type 2 Arg/N-degrons was measured by flow cytometry. UPS activity was Z-score normalized and scaled relative to the median of a control BY strain engineered to contain the full BY UBR1 allele. Each point in the plot shows the median of 10,000 cells for each of 16 independent biological replicates per strain per reporter. p-values at the top of the plot display the Benjamini-Hochberg-corrected p-value for the t-test of the indicated strain versus the strain with the BY UBR1 allele. Box plot center lines, box boundaries, and whiskers display the median, interquartile range, and 1.5 times the interquartile range, respectively.
Figure 3—figure supplement 3

Population frequency and distribution of the causal UBR1 –469A>T variant.
Population frequencies and distribution of causal variants. Tree diagrams show genetic distance among a global panel of S. cerevisiae isolates with branches colored according to which allele a strain carries. Indicated clades with the BY allele for a causal DNA variant are outlined.
Figure 4 with 4 supplements
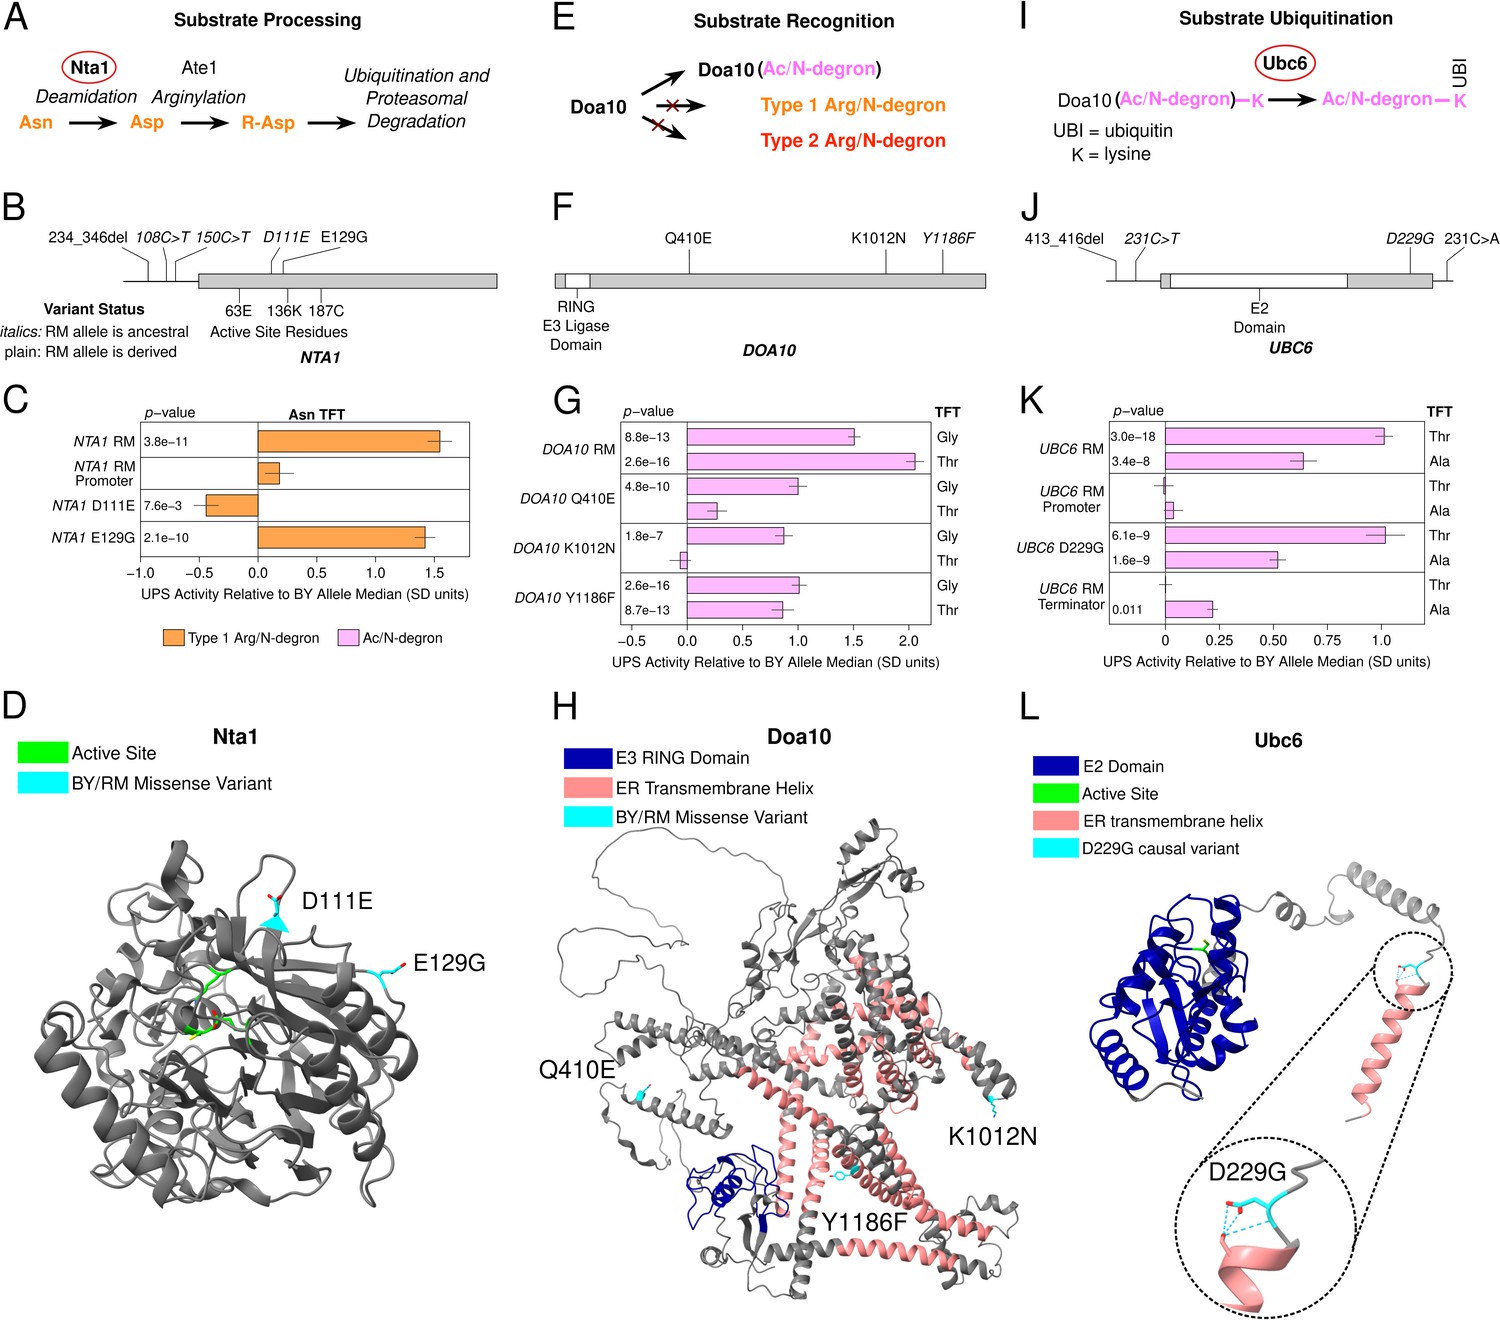
Identification of causal DNA variants for UPS activity in functionally diverse ubiquitin system genes.
(A, E, and I). Schematics showing the role of Nta1 (A), Doa10 (E), and Ubc6 (I) in UPS substrate processing, recognition, and ubiquitination, respectively. (B, F, and J). Location of regulatory and missense BY / RM variants, as well as active sites and functional domains in the proteins encoded by NTA1 (B), DOA10 (F), and UBC6 (J). C., G., and K. Fine-mapping results for NTA1 (C), DOA10 (G), and UBC6 (K). Benjamini-Hochberg corrected p-values are shown for the t-test of the indicated strain versus a control BY strain engineered to contain the BY allele of each gene. AlphaFold predicted protein structures for Nta1 (D), Doa10 (H), and Ubc6 (L) are shown with causal DNA variants, functional domains, active sites, and transmembrane helices highlighted. The inset in L. shows a predicted hydrogen bonding network at residue 229 in the BY Ubc6 protein.
Figure 4—figure supplement 1
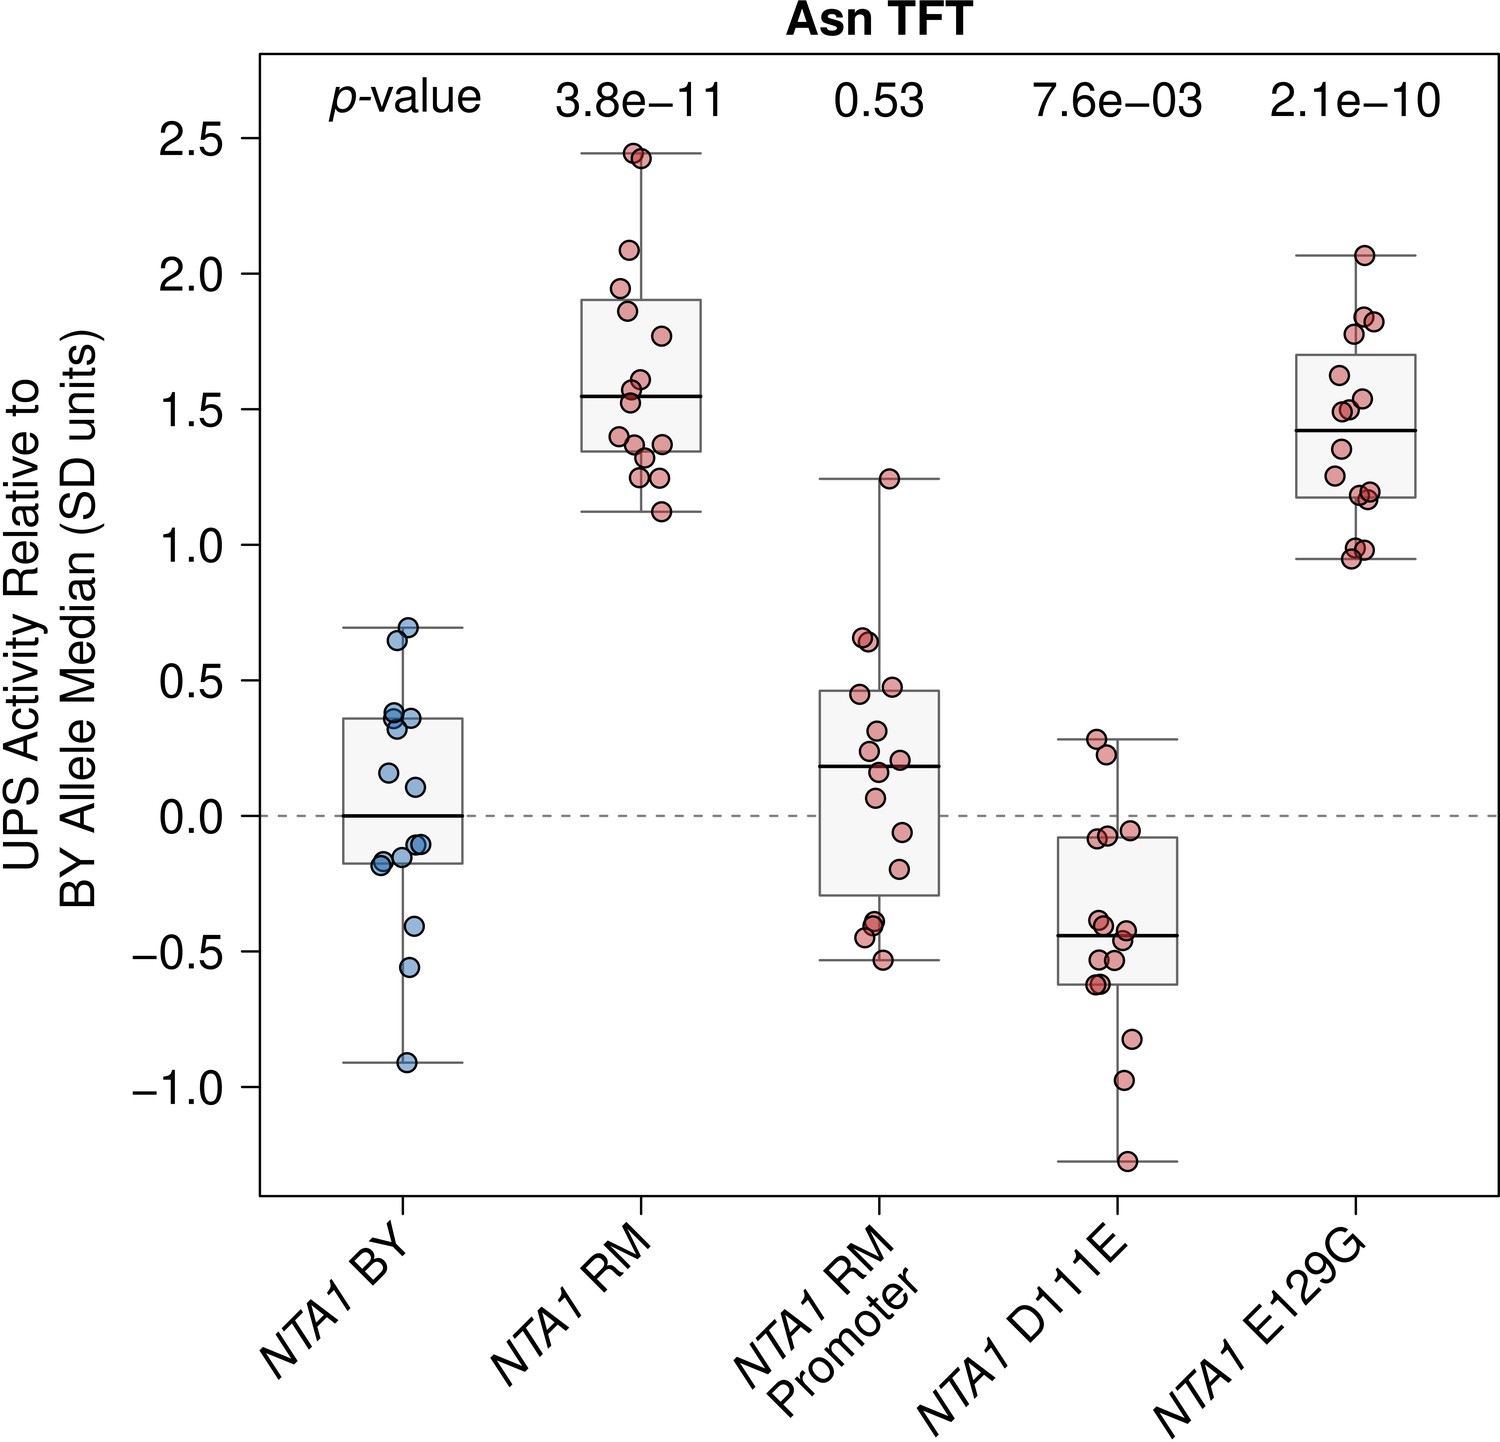
Raw NTA1 fine-mapping data.
The BY strain was engineered to contain full or partial RM NTA1 alleles as indicated and UPS activity towards the Asn Arg/N-degron was measured by flow cytometry. UPS activity was Z-score normalized and scaled relative to the median of a control BY strain engineered to contain the full BY NTA1 allele. Each point in the plot shows the median of 10,000 cells for each of 16 independent biological replicates per strain per reporter. p-values at the top of the plot display the Benjamini-Hochberg-corrected p-value for the t-test of the indicated strain versus the strain with the BY NTA1 allele. Box plot center lines, box boundaries, and whiskers display the median, interquartile range, and 1.5 times the interquartile range, respectively.
Figure 4—figure supplement 2
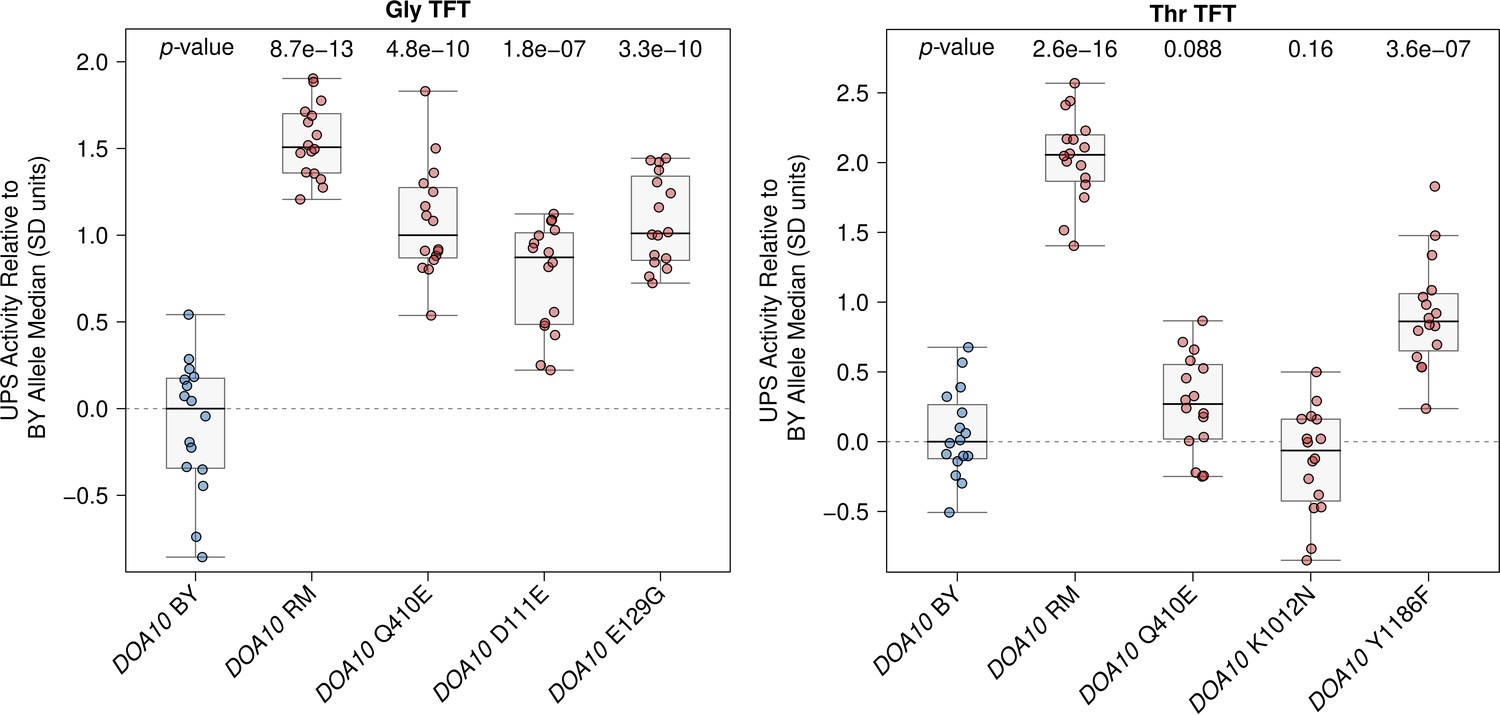
Raw DOA10 fine-mapping data.
The BY strain was engineered to contain full or partial RM DOA10 alleles as indicated and UPS activity towards the Gly and Thr Ac/N-degrons was measured by flow cytometry. UPS activity was Z-score normalized and scaled relative to the median of a control BY strain engineered to contain the full BY DOA10 allele. Each point in the plot shows the median of 10,000 cells for each of 16 independent biological replicates per strain per reporter. p-values at the top of the plot display the Benjamini-Hochberg-corrected p-value for the t-test of the indicated strain versus the strain with the BY DOA10 allele. Box plot center lines, box boundaries, and whiskers display the median, interquartile range, and 1.5 times the interquartile range, respectively.
Figure 4—figure supplement 3
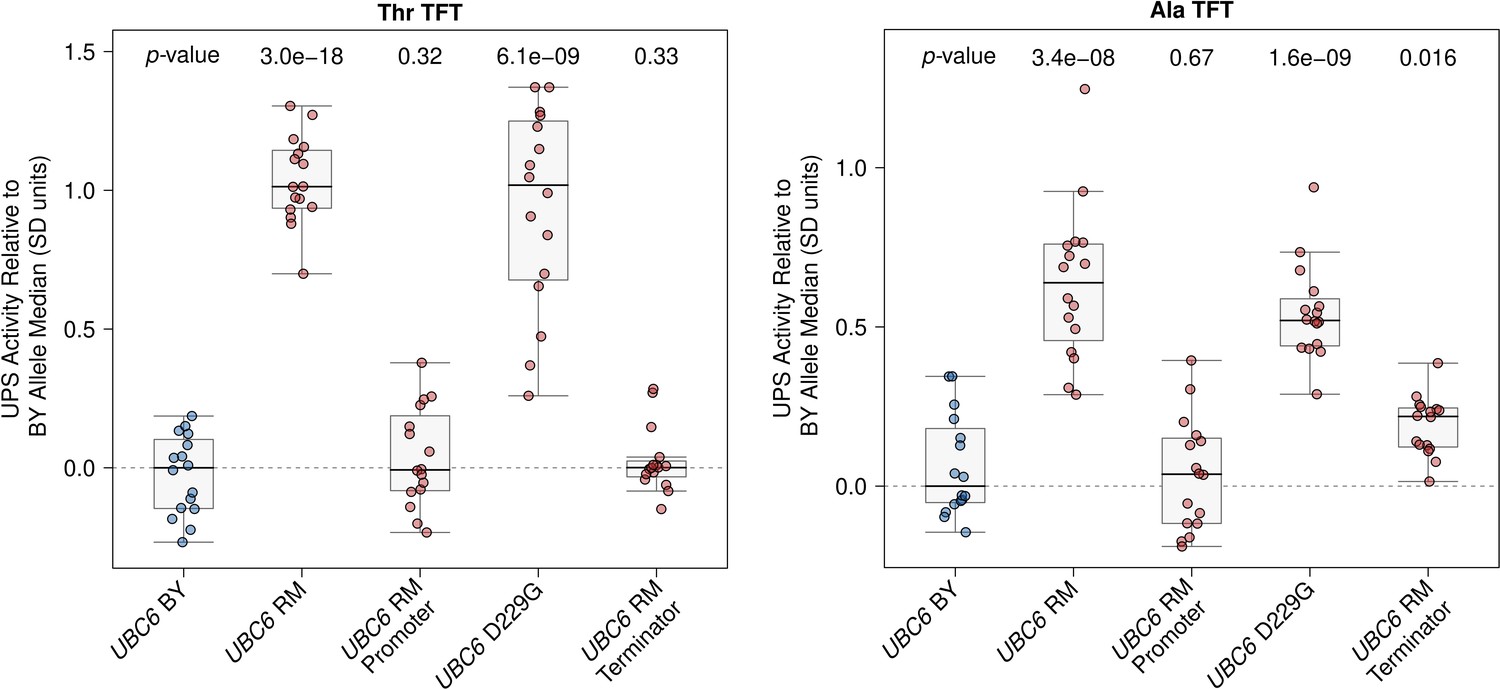
Raw UBC6 fine-mapping data.
The BY strain was engineered to contain full or partial RM UBC6 alleles as indicated and UPS activity towards the Thr and Ala Ac/N-degrons was measured by flow cytometry. UPS activity was Z-score normalized and scaled relative to the median of a control BY strain engineered to contain the full BY UBC6 allele. Each point in the plot shows the median of 10,000 cells for each of 16 independent biological replicates per strain per reporter. p-values at the top of the plot display the Benjamini-Hochberg-corrected p-value for the t-test of the indicated strain versus the strain with the BY UBC6 allele. Box plot center lines, box boundaries, and whiskers display the median, interquartile range, and 1.5 times the interquartile range, respectively.
Figure 4—figure supplement 4
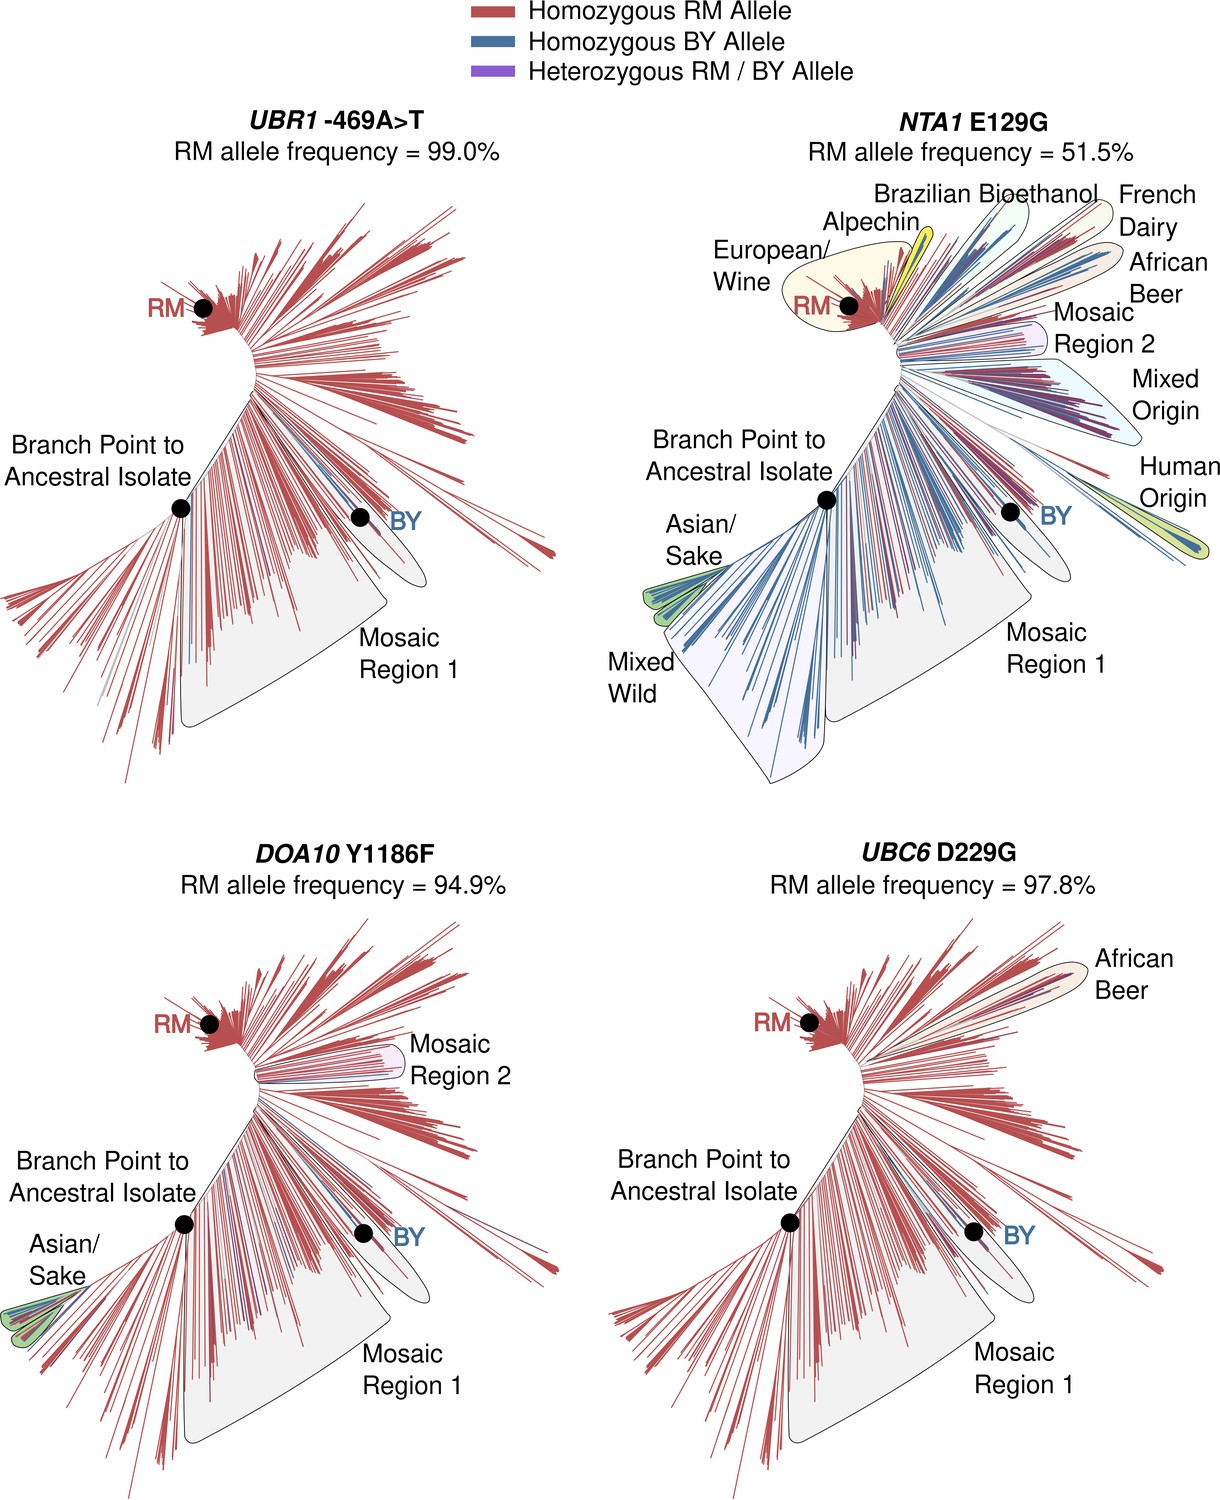
Population frequencies and distributions of causal variants.
Tree diagrams show genetic distance among a global panel of S. cerevisiae isolates with branches colored according to which allele a strain carries. Indicated clades with the BY allele for a causal DNA variant are outlined.
Figure 5 with 1 supplement
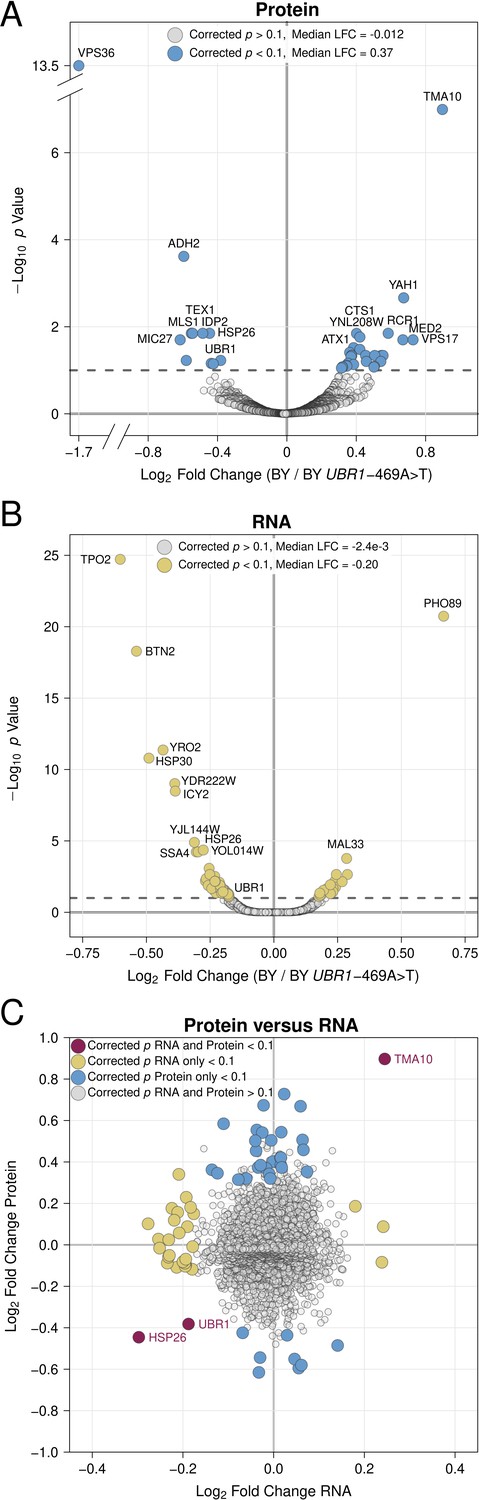
Proteomic and RNA-seq analysis of the effect of the UBR1 –469A>T promoter variant on gene expression.
(A) Protein fold-change versus statistical significance for BY versus BY UBR1 –469A>T for all detected proteins. Differentially abundant proteins are shown in blue. (B) RNA fold-change versus statistical significance for BY versus BY UBR1 –469A>T for all detected transcripts. Differentially expressed transcripts are shown in yellow. (C) Scatterplot comparing changes in protein and RNA abundance caused by UBR1 –469A>T. "LFC" = log2 fold change.
-
Figure 5—source data 1
Full proteomics results.
- https://cdn.elifesciences.org/articles/79570/elife-79570-fig5-data1-v2.xlsx
-
Figure 5—source data 2
Full RNA-seq results.
- https://cdn.elifesciences.org/articles/79570/elife-79570-fig5-data2-v2.xlsx
Figure 5—figure supplement 1
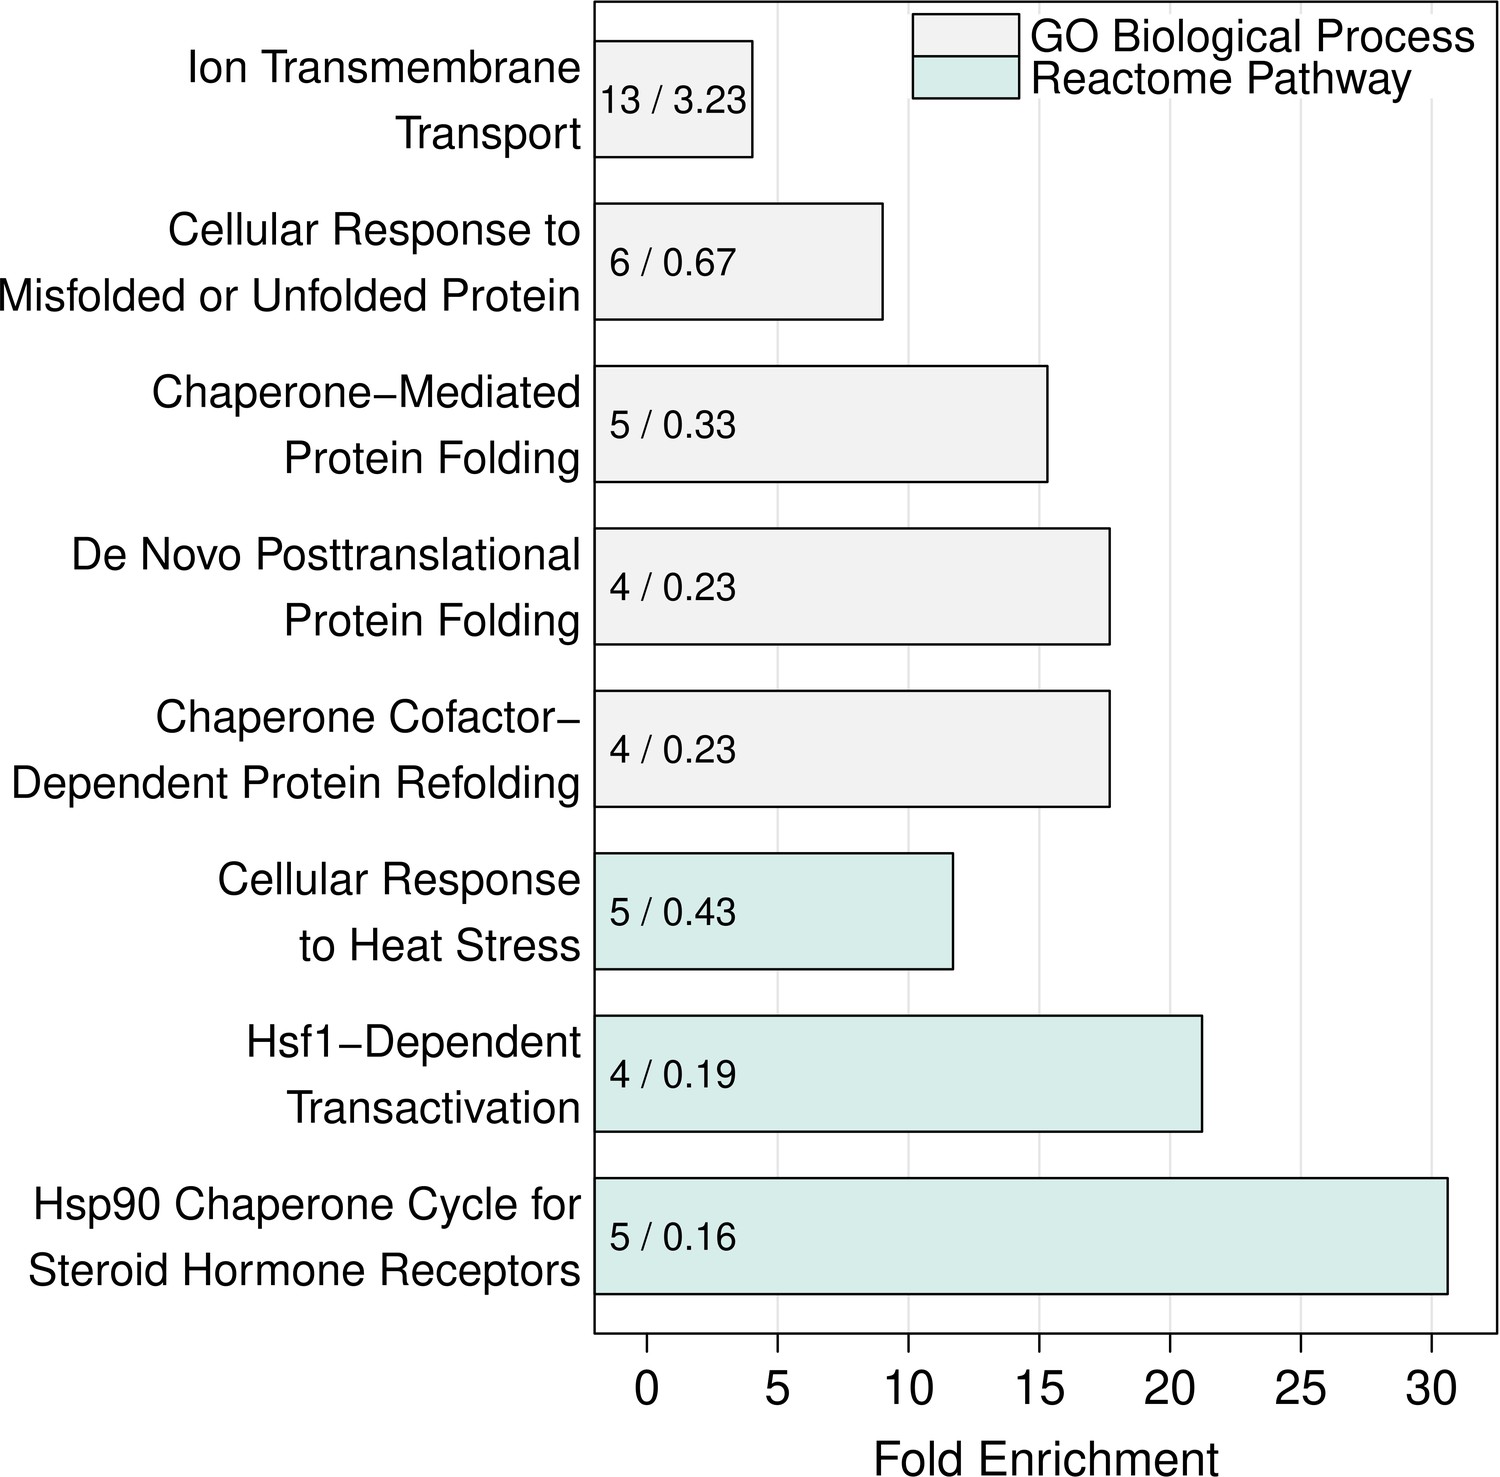
Over-represented GO biological processes and Reactome pathways in the set of differentially expressed transcripts.
Barchart of significantly over-represented Gene Ontology Biological Process and Reactome Pathway terms identified using the list of differentially expressed mRNA transcripts between the wild-type BY strain and BY UBR1 –469A>T. The numbers in the bars denote the observed (left) and expected (right) number of genes for a given process or pathway.
Author response image 1
Tables
Key resources table
| Reagent type (species) or resource | Designation | Source or reference | Identifiers | Additional information |
|---|---|---|---|---|
| Gene (Saccharomyces cerevisiae) | UBR1 | Saccharomyces Genome Database (SGD) | YGR184C | edited to contain alternative alleles / variants |
| Gene (S. cerevisiae) | DOA10 | SGD | YIL030C | edited to contain alternative alleles / variants |
| Gene (S. cerevisiae) | UBC6 | SGD | YER100W | edited to contain alternative alleles / variants |
| Gene (S. cerevisiae) | NTA1 | SGD | YJR062C | edited to contain alternative alleles / variants |
| Gene (S. cerevisiae) | HIS3 | SGD | YOR202W | selectable marker for genome engineering |
| Gene (S. cerevisiae) | LYP1 | SGD | YNL268W | selectable marker for genome engineering |
| Strain, strain background (S. cerevisiae) | BY4741 | Leonid Kruglyak | YFA0040 | Supplementary file 5 |
| Strain, strain background (S. cerevisiae) | RM11.1a | Leonid Kruglyak | YFA0039 | Supplementary file 5 |
| Strain, strain background (S. cerevisiae) | recombinant progeny of BY4741 x RM11.1a | this study | SFA- | Supplementary file 5 |
| Strain, strain background (S. cerevisiae) | strains with tandem fluorescent timer reporters | this study | YFA- | Supplementary file 5 |
| Strain, strain background (S. cerevisiae) | strains lacking individual ubiquitin-proteasome system genes | this study | YFA- | Supplementary file 5 |
| Strain, strain background (S. cerevisiae) | strains with alternative UPS gene alleles / variants | this study | YFA- | Supplementary file 5 |
| Strain, strain background (Escherichia coli) | DH5α | New England Biolabs | for plasmid cloning and propagation | |
| Recombinant DNA reagent | 23 plasmids | this study | PFA- | Supplementary file 4 |
| Recombinant DNA reagent | backbone plasmid | Addgene | 35121 | |
| Recombinant DNA reagent | backbone plasmid | Addgene | 41030 | |
| Recombinant DNA reagent | KanMX cassette | Wach et al., 1994; 10.1002/yea.320101310 | selectable marker for genome engineering | |
| Recombinant DNA reagent | NatMX cassette | Wach et al., 1994; 10.1002/yea.320101310 | selectable marker for genome engineering | |
| Sequence-based reagent | 102 oligonucleotides | Integrated DNA Techologies | OFA- | Supplementary file 3 |
| Commercial assay or kit | Nextera DNA Library Prep Kit | Illumina | FC-121– 1030 | |
| Commercial assay or kit | EB Ultra II Directional RNA library kit for Illumina | New England Biolabs | E7760 | |
| Commercial assay or kit | Monarch Gel Extraction kit | New England Biolabs | T1010L | |
| Commercial assay or kit | HiFi DNA Assembly Cloning Kit | New England Biolabs | E5520S | |
| Commercial assay or kit | TMT10plex Isobaric Label Reagent Set | ThermoFisher Scientific | 90110 | |
| Commercial assay or kit | ZR Fungal / Bacterial RNA Miniprep kit | Zymo Research | R2014 | |
| Commercial assay or kit | Quick-96 DNA Plus kit | Zymo Research 10.1093/bioinformatics/btp324 | D4070 | |
| Software, algorithm | MULTIPOOL | Edwards and Gifford, 2012; 10.1186/1471-2105-13-S6-S8 | ||
| Software, algorithm | trimmomatic | Bolger et al., 2014 10.1093/bioinformatics/btu170 | ||
| Software, algorithm | kallisto | Bray et al., 2016; 10.1038/nbt.3519 | ||
| Software, algorithm | PANTHER | Mi et al., 2021; 10.1093/nar/gkaa1106 | ||
| Software, algorithm | fastp | Chen et al., 2018; 10.1093/bioinformatics/bty560 | ||
| Software, algorithm | RSeQC | Wang et al., 2012; 10.1093/bioinformatics/bts356 | ||
| Software, algorithm | Scaffold | https://www.proteomesoftware.com/ | ||
| Software, algorithm | Proteome Discoverer | Thermo Scientific | ||
| Software, algorithm | AlphaFold | Jumper et al., 2021; 10.1038/s41586-021-03819-2 | ||
| Software, algorithm | Inkscape | https://inkscape.org | ||
| Other | LSR II Flow Cytometer | BD | flow cytometry | |
| Other | FACSAria II Cell Sorter | BD | cell sorting | |
| Other | Orbitrap Fusion Tribrid MS-MS instrument | Thermo Scientific | mass spectrometry | |
| Other | Next-Seq 550 | Illumina | DNA / RNAsequencing |
Table 1
Strain genotypes.
| Short Name | Genotype | Antibiotic Resistance | Auxotrophies |
|---|---|---|---|
| BY | MATa his3Δ hoΔ | histidine | |
| RM | MATα can1Δ::STE2pr-SpHIS5 | clonNAT, hygromycin | histidine |
| his3Δ::NatMX hoΔ::HphMX | |||
| BY rpn4Δ | MATa his3Δ hoΔ rpn4Δ::NatMX | clonNAT | histidine |
| BY ubr1Δ | MATa his3Δ hoΔ ubr1Δ::NatMX | clonNAT | histidine |
| BY doa10Δ | MATa his3Δ hoΔ doa10Δ::NatMX | clonNAT | histidine |
Table 2
Media formulations.
| Media Name | Abbreviation | Formulation |
|---|---|---|
| Yeast-Peptone-Dextrose | YPD | 10 g/L yeast extract |
| 20 g/L peptone | ||
| 20 g/L dextrose | ||
| Synthetic Complete | SC | 6.7 g/L yeast nitrogen base |
| 1.96 g/L amino acid mix -lys | ||
| 20 g/L dextrose | ||
| Haploid Selection | SGA | 6.7 g/L yeast nitrogen base |
| 1.74 g/L amino acid mix -his -lys -ura | ||
| 20 g/L dextrose | ||
| Sporulation | SPO | 1 g/L yeast extract |
| 10 g/L potassium acetate | ||
| 0.5 g/L dextrose |
Table 3
Flow cytometry and FACS settings.
| Parameter | Laser Line (nm) | Laser Setting (V) | Filter |
|---|---|---|---|
| forward scatter (FSC) | 488 | 500 | 488/10 |
| side scatter (SSC) | 488 | 275 | 488/10 |
| sfGFP | 488 | 500 | 525/50 |
| mCherry | 561 | 615 | 610/20 |
| mRuby | 561 | 615 | 610/20 |
Table 4
CRISPR-swap repair templates.
| Gene | Allele Name | Promoter | ORF | Terminator |
|---|---|---|---|---|
| UBR1 | UBR1 BY | BY | BY | BY |
| UBR1 | UBR1 RM | RM | RM | RM |
| UBR1 | UBR1 RM promoter | RM | BY | BY |
| UBR1 | UBR1 RM ORF | BY | RM | BY |
| UBR1 | UBR1 RM terminator | BY | BY | RM |
| UBR1 | UBR1 -469A>T | –469, RM; all other, BY | BY | BY |
| UBR1 | UBR1 -197T>G | –197, RM; all other, BY | BY | BY |
| DOA10 | DOA10 BY | BY | BY | BY |
| DOA10 | DOA10 RM | RM | RM | RM |
| DOA10 | DOA10 Q410E | BY | 1228, RM; all other, BY | BY |
| DOA10 | DOA10 K1012N | BY | 3036, RM; all other, BY | BY |
| DOA10 | DOA10 Y1186F | BY | 3557, RM; all other, BY | BY |
| NTA1 | NTA1 BY | BY | BY | BY |
| NTA1 | NTA1 RM | RM | RM | RM |
| NTA1 | NTA1 RM promoter | RM | BY | BY |
| NTA1 | NTA1 D111E | RM | 331, RM; all other, BY | BY |
| NTA1 | NTA1 E129G | RM | 386, RM; all other, BY | BY |
| UBC6 | UBC6 BY | BY | BY | BY |
| UBC6 | UBC6 RM | RM | RM | RM |
| UBC6 | UBC6 RM promoter | RM | BY | BY |
| UBC6 | UBC6 D229G | BY | 1686, RM; all other, BY | BY |
| UBC6 | UBC6 RM terminator | BY | BY | RM |
Author response table 1
Influence of LOD score significance threshold on the fraction of N-end rule pathway- and N-degron-specific QTLs.
| LOD 4.5 | LOD 3.5 | LOD 2.5 | |
|---|---|---|---|
| N-end Rule Pathway-specific QTLs | 23 / 35 (66%) | 19 / 35 (54%) | 16 / 35 (46%) |
| N-degron-specific QTLs | 5 / 35 (14%) | 3 / 35 (9%) | 3 / 35 (9%) |
Author response table 2
Shared QTL Regions and N-degrons Affected.
| N | QTL | chr | QTL_CI_left | QTL_peak | QTL_CI_right | LOD | RM_AFD | N. N-degrons Affected | N-degrons Affected | Pathway-Specific (LOD 4.5) | Pathway-Specific (LOD 3.5) | Pathway-Specific (LOD 2.5) | N-degron-Specific (LOD 4.5) | N-degron-Specific (LOD 3.5) | N-degron-Specific (LOD 2.5) |
|---|---|---|---|---|---|---|---|---|---|---|---|---|---|---|---|
| 1 | chr_1_a | 1 | 5021 | 39400 | 52122 | 45 | -0.325 | 7 | Ala, Cys, Gly, Pro, Ser, Thr, Val | Ac/N-end | Ac/N-end | Ac/N-end | no | no | no |
| 2 | chr_2_a | 2 | 473450 | 515516 | 573934 | 11.1 | 0.13 | 3 | Arg, Lys, Phe | Arg/N-end | Arg/N-end | no | no | no | no |
| 3 | chr_2_b | 2 | 534970 | 585630 | 640010 | 8.9 | 0.112 | 5 | Ala, Arg, Asp, Lys, Met | no | no | no | no | no | no |
| 4 | chr_4_a | 4 | 29500 | 87662 | 116525 | 7.3 | -0.108 | 4 | Gln, Glu, Gly, His | no | no | no | no | no | no |
| 5 | chr_4_b | 4 | 273175 | 327300 | 362600 | 17.5 | 0.152 | 2 | Trp, Tyr | Arg/N-end | Arg/N-end | no | no | no | no |
| 6 | chr_4_c | 4 | 376817 | 425550 | 463567 | 14.3 | 0.156 | 6 | Ala, Phe, Pro, Ser, Thr, Trp | no | no | no | no | no | no |
| 7 | chr_4_d | 4 | 392275 | 498200 | 557000 | 8.2 | -0.107 | 2 | Asn, Asp | Arg/N-end | Arg/N-end | Arg/N-end | no | no | no |
| 8 | chr_5_a | 5 | 351400 | 372136 | 396250 | 37.5 | 0.248 | 7 | Ala, Cys, Gly, Pro, Ser, Thr, Val | Ac/N-end | Ac/N-end | Ac/N-end | no | no | no |
| 13 | chr_7_a | 7 | 42075 | 62775 | 103225 | 12.5 | -0.155 | 2 | Asn, Thr | no | no | no | no | no | no |
| 9 | chr_7_b | 7 | 98178 | 132779 | 172279 | 14.3 | -0.156 | 7 | Ala, Cys, Gly, Pro, Ser, Thr, Val | Ac/N-end | no | no | no | no | no |
| 10 | chr_7_c | 7 | 389941 | 418641 | 451318 | 18 | 0.167 | 11 | Ala, Asn, Cys, Gly, Phe, Pro, Ser, Thr, Trp, Tyr, Val | no | no | no | no | no | no |
| 11 | chr_7_d | 7 | 841300 | 869700 | 899934 | 15.2 | -0.157 | 3 | Arg, Asn, Asp | Arg/N-end | Arg/N-end | Arg/N-end | no | no | no |
| 12 | chr_7_e | 7 | 856120 | 870980 | 883830 | 107.5 | 0.409 | 5 | His, Leu, Phe, Trp, Tyr | Arg/N-end | Arg/N-end | Arg/N-end | no | no | no |
| 15 | chr_8_a | 8 | 50150 | 98050 | 127300 | 6 | -0.101 | 1 | Tyr | Arg/N-end | Arg/N-end | Arg/N-end | Tyr | Tyr | Tyr |
| 14 | chr_8_b | 8 | 118875 | 148400 | 193675 | 8.4 | 0.104 | 2 | Asp, Lys | Arg/N-end | Arg/N-end | Arg/N-end | no | no | no |
| 17 | chr_9_a | 9 | 94550 | 130775 | 168000 | 5.1 | 0.099 | 2 | His, Lys | Arg/N-end | Arg/N-end | Arg/N-end | no | no | no |
| 16 | chr_9_b | 9 | 267641 | 291492 | 315417 | 23.5 | 0.195 | 6 | Ala, Gly, Pro, Ser, Thr, Val | Ac/N-end | Ac/N-end | Ac/N-end | no | no | no |
| 18 | chr_10_a | 10 | 323900 | 345482 | 371186 | 21.9 | 0.182 | 11 | Ala, Arg, Cys, Gln, Gly, Lys, Phe, Pro, Ser, Trp, Tyr | no | no | no | no | no | no |
| 19 | chr_10_b | 10 | 589770 | 615660 | 641600 | 25.1 | 0.192 | 5 | Ala, Arg, Asn, Cys, Gln | no | no | no | no | no | no |
| 21 | chr_11_a | 11 | 118750 | 156450 | 173600 | 16 | 0.152 | 1 | His | Arg/N-end | Arg/N-end | Arg/N-end | His | no | no |
| 20 | chr_11_b | 11 | 291030 | 339790 | 388750 | 8.4 | -0.106 | 5 | Ala, Arg, Cys, Phe, Thr | no | no | no | no | no | no |
| 22 | chr_12_a | 12 | 157200 | 197050 | 226850 | 8.2 | 0.126 | 2 | Ala, Pro | Ac/N-end | no | no | no | no | no |
| 23 | chr_12_b | 12 | 644414 | 657241 | 674723 | 42.1 | -0.25 | 11 | Ala, Cys, Gly, Met, Phe, Pro, Ser, Thr, Trp, Tyr, Val | no | no | no | no | no | no |
| 24 | chr_12_c | 12 | 639637 | 674125 | 702650 | 9.7 | 0.108 | 4 | Asp, Gly, His, Ile | Arg/N-end | Arg/N-end | Arg/N-end | no | no | no |
| 25 | chr_13_a | 13 | 0 | 24650 | 58950 | 9.6 | -0.162 | 1 | Ala | Ac/N-end | Ac/N-end | no | Ala | no | no |
| 27 | chr_13_b | 13 | 31800 | 56525 | 77675 | 14.9 | 0.145 | 2 | His, Phe | Arg/N-end | Arg/N-end | Arg/N-end | no | no | no |
| 26 | chr_13_c | 13 | 265350 | 296167 | 331584 | 16.5 | 0.17 | 6 | Arg, Asn, Asp, Glu, His, Lys | Arg/N-end | no | no | no | no | no |
| 29 | chr_14_a | 14 | 450731 | 465394 | 482912 | 89.3 | -0.342 | 8 | His, Leu, Lys, Met, Phe, Pro, Trp, Tyr | no | no | no | no | no | no |
| 28 | chr_14_b | 14 | 449725 | 470850 | 504025 | 86.7 | 0.336 | 2 | Asp, Thr | no | no | no | no | no | no |
| 31 | chr_15_a | 15 | 133625 | 163862 | 184831 | 20.2 | -0.183 | 8 | Arg, Asn, Asp, Glu, His, Lys, Met, Phe | no | no | no | no | no | no |
| 30 | chr_15_b | 15 | 342850 | 388050 | 431300 | 10.1 | 0.116 | 3 | Ala, Pro, Thr | Ac/N-end | no | no | no | no | no |
| 32 | chr_15_c | 15 | 525200 | 561525 | 591775 | 10.6 | 0.128 | 2 | Ser, Thr | Ac/N-end | Ac/N-end | Ac/N-end | no | no | no |
| 33 | chr_15_d | 15 | 518550 | 569750 | 594650 | 8.8 | -0.096 | 1 | Cys | Ac/N-end | Ac/N-end | Ac/N-end | Cys | Cys | Cys |
| 34 | chr_16_a | 16 | 166030 | 194830 | 222070 | 11.6 | 0.121 | 5 | Ala, Gly, Pro, Thr, Val | Ac/N-end | Ac/N-end | Ac/N-end | no | no | no |
| 35 | chr_16_b | 16 | 375050 | 403350 | 428950 | 24.5 | -0.22 | 1 | Pro | Ac/N-end | Ac/N-end | Ac/N-end | Pro | Pro | Pro |
-
Abbreviations: "chr": chromosome, "CI": confidence interval, "RM_AFD": RM allele frequency difference (high – low UPS activity pools)
Author response table 3
Variance Explained by Causal Alleles and Variants.
| Gene | Allele | N-degron | Variance Explained |
|---|---|---|---|
| DOA10 | K1012N | Thr | 0.04 |
| DOA10 | Q410E | Thr | 0.075 |
| DOA10 | RM_full | Thr | 0.911 |
| DOA10 | Y1186F | Thr | 0.597 |
| DOA10 | K1012N | Gly | 0.608 |
| DOA10 | Q410E | Gly | 0.74 |
| DOA10 | RM_full | Gly | 0.879 |
| DOA10 | Y1186F | Gly | 0.77 |
| NTA1 | D111E | Asn | 0.204 |
| NTA1 | E129G | Asn | 0.764 |
| NTA1 | RM_full | Asn | 0.789 |
| NTA1 | RM_pr | Asn | -0.014 |
| UBC6 | D229G | Ala | 0.717 |
| UBC6 | RM_full | Ala | 0.666 |
| UBC6 | RM_pr | Ala | -0.027 |
| UBC6 | RM_term | Ala | 0.183 |
| UBC6 | D229G | Thr | 0.762 |
| UBC6 | RM_full | Thr | 0.928 |
| UBC6 | RM_pr | Thr | 0.008 |
| UBC6 | RM_term | Thr | 0.006 |
| UBR1 | RM_causal | Phe | 0.9 |
| UBR1 | RM_full | Phe | 0.917 |
| UBR1 | RM_non | Phe | -0.019 |
| UBR1 | RM_pr | Phe | 0.818 |
| UBR1 | RM_causal | Trp | 0.937 |
| UBR1 | RM_full | Trp | 0.975 |
| UBR1 | RM_non | Trp | 0.059 |
| UBR1 | RM_pr | Trp | 0.934 |
| UBR1 | RM_full | Asn | 0.438 |
| UBR1 | RM_ORF | Asn | 0.134 |
| UBR1 | RM_pr | Asn | -0.012 |
| UBR1 | RM_term | Asn | 0.064 |
| UBR1 | RM_full | Asp | 0.403 |
| UBR1 | RM_ORF | Asp | 0.101 |
| UBR1 | RM_pr | Asp | 0.097 |
| UBR1 | RM_term | Asp | 0.048 |
| UBR1 | RM_full | Phe | 0.866 |
| UBR1 | RM_ORF | Phe | 0.343 |
| UBR1 | RM_pr | Phe | 0.316 |
| UBR1 | RM_term | Phe | -0.031 |
| UBR1 | RM_full | Trp | 0.964 |
| UBR1 | RM_ORF | Trp | 0.813 |
| UBR1 | RM_pr | Trp | 0.928 |
| UBR1 | RM_term | Trp | 0.028 |
Author response table 4
Results of the Sign Test for Lineage-Specific Selection Applied to All BY / RM eQTLs.
| LOD | n_eQTLs | n_genes | n_pairs | reinf_BY_up | reinf_RM_up | oppos_BY_up | oppos_RM_up | excess_reinforcing_pairs | chi_sq_p |
|---|---|---|---|---|---|---|---|---|---|
| 2.4 | 36498 | 5643 | 2845 | 627 | 757 | 952 | 509 | –14 | 0.818 |
| 5 | 19694 | 5372 | 2081 | 449 | 577 | 698 | 357 | 19 | 0.701 |
| 10 | 9379 | 4514 | 1124 | 225 | 320 | 404 | 175 | 4.63 | 0.934 |
| 15 | 6125 | 3686 | 745 | 154 | 202 | 279 | 110 | 2.24 | 0.992 |
| 20 | 4452 | 3076 | 480 | 108 | 128 | 179 | 65 | 18.2 | 0.431 |
| 25 | 3458 | 2609 | 336 | 73 | 95 | 127 | 41 | 20.6 | 0.276 |
| 30 | 2788 | 2224 | 230 | 54 | 65 | 85 | 26 | 22.6 | 0.145 |
| 35 | 2310 | 1912 | 178 | 44 | 48 | 68 | 18 | 20 | 0.144 |
| 40 | 1963 | 1664 | 140 | 35 | 41 | 53 | 11 | 24.3 | 0.0375 |
| 45 | 1706 | 1474 | 110 | 28 | 33 | 42 | 7 | 22.9 | 0.0261 |
| 50 | 1475 | 1299 | 85 | 21 | 27 | 31 | 6 | 17.9 | 0.0569 |
Author response table 5
Results of Gene Ontology Enrichment of All cis / trans eQTL pairs.
| GOBPID | p_value | OddsRatio | ExpCount | Count | Term | category | LOD |
|---|---|---|---|---|---|---|---|
| GO:0032197 | 2.8E-05 | 3 | 15.06 | 30 | transposition; RNA-mediated | all_reinforcing | 2.426606803 |
| GO:0015074 | 0.00046 | 3.1 | 9.87 | 20 | DNA integration | all_reinforcing | 2.426606803 |
| GO:0006487 | 0.00077 | 2.7 | 11.6 | 22 | protein N-linked glycosylation | all_reinforcing | 2.426606803 |
| GO:0046513 | 0.0012 | 10.7 | 2.22 | 7 | ceramide biosynthetic process | all_reinforcing | 2.426606803 |
| GO:0006458 | 0.0029 | 3.3 | 6.17 | 13 | 'de novo' protein folding | all_reinforcing | 2.426606803 |
| GO:0018904 | 0.0037 | Inf | 0.99 | 4 | ether metabolic process | all_reinforcing | 2.426606803 |
| GO:0051131 | 0.0039 | 9.2 | 1.97 | 6 | chaperone-mediated protein complex assembly | all_reinforcing | 2.426606803 |
| GO:1901135 | 0.0045 | 1.4 | 92.08 | 114 | carbohydrate derivative metabolic process | all_reinforcing | 2.426606803 |
| GO:0070085 | 0.0063 | 1.8 | 21.23 | 32 | glycosylation | all_reinforcing | 2.426606803 |
| GO:0061077 | 0.0068 | 3.9 | 3.95 | 9 | chaperone-mediated protein folding | all_reinforcing | 2.426606803 |
| GO:0006672 | 0.007 | 5.4 | 2.72 | 7 | ceramide metabolic process | all_reinforcing | 2.426606803 |
| GO:0009101 | 0.007 | 1.8 | 19.75 | 30 | glycoprotein biosynthetic process | all_reinforcing | 2.426606803 |
| GO:0016226 | 0.0089 | 3.1 | 5.43 | 11 | iron-sulfur cluster assembly | all_reinforcing | 2.426606803 |
| GO:0031070 | 0.0093 | 6.1 | 2.22 | 6 | intronic snoRNA processing | all_reinforcing | 2.426606803 |
| GO:0034965 | 0.0093 | 6.1 | 2.22 | 6 | intronic box C/D snoRNA processing | all_reinforcing | 2.426606803 |
| GO:0032197 | 4E-06 | 3.5 | 11.51 | 27 | transposition; RNA-mediated | all_reinforcing | 5 |
| GO:0015074 | 0.00011 | 3.7 | 7.48 | 18 | DNA integration | all_reinforcing | 5 |
| GO:0006458 | 0.001 | 3.9 | 4.79 | 12 | 'de novo' protein folding | all_reinforcing | 5 |
| GO:0061077 | 0.0011 | 5.5 | 3.07 | 9 | chaperone-mediated protein folding | all_reinforcing | 5 |
| GO:0006487 | 0.0013 | 2.7 | 8.82 | 18 | protein N-linked glycosylation | all_reinforcing | 5 |
| GO:0018904 | 0.0013 | Inf | 0.77 | 4 | ether metabolic process | all_reinforcing | 5 |
| GO:0046513 | 0.0024 | 8.5 | 1.73 | 6 | ceramide biosynthetic process | all_reinforcing | 5 |
| GO:0070525 | 0.0024 | 8.5 | 1.73 | 6 | tRNA threonylcarbamoyladenosine metabolic process | all_reinforcing | 5 |
| GO:0051131 | 0.0038 | 10.6 | 1.34 | 5 | chaperone-mediated protein complex assembly | all_reinforcing | 5 |
| GO:0032259 | 0.0045 | 1.8 | 21.29 | 33 | methylation | all_reinforcing | 5 |
| GO:0046165 | 0.0052 | 2.2 | 11.32 | 20 | alcohol biosynthetic process | all_reinforcing | 5 |
| GO:0044281 | 0.0063 | 1.3 | 150.75 | 177 | small molecule metabolic process | all_reinforcing | 5 |
| GO:0006662 | 0.007 | Inf | 0.58 | 3 | glycerol ether metabolic process | all_reinforcing | 5 |
| GO:0002949 | 0.007 | Inf | 0.58 | 3 | tRNA threonylcarbamoyladenosine modification | all_reinforcing | 5 |
| GO:0033215 | 0.007 | Inf | 0.58 | 3 | iron assimilation by reduction and transport | all_reinforcing | 5 |
| GO:0046131 | 0.0083 | 3.8 | 3.26 | 8 | pyrimidine ribonucleoside metabolic process | all_reinforcing | 5 |
| GO:0019509 | 0.0086 | 7.1 | 1.53 | 5 | L-methionine salvage from methylthioadenosine | all_reinforcing | 5 |
| GO:0006694 | 0.0086 | 2.4 | 8.06 | 15 | steroid biosynthetic process | all_reinforcing | 5 |
| GO:0006696 | 0.0089 | 2.7 | 5.95 | 12 | ergosterol biosynthetic process | all_reinforcing | 5 |
| GO:0006672 | 0.0094 | 5.1 | 2.11 | 6 | ceramide metabolic process | all_reinforcing | 5 |
| GO:0019856 | 0.0094 | 5.1 | 2.11 | 6 | pyrimidine nucleobase biosynthetic process | all_reinforcing | 5 |
| GO:1902652 | 0.0098 | 2.5 | 6.71 | 13 | secondary alcohol metabolic process | all_reinforcing | 5 |
| GO:0032197 | 1.5E-06 | 4.5 | 6.44 | 20 | transposition; RNA-mediated | all_reinforcing | 10 |
| GO:0015074 | 7.7E-05 | 4.3 | 4.62 | 14 | DNA integration | all_reinforcing | 10 |
| GO:0018904 | 0.00022 | Inf | 0.49 | 4 | ether metabolic process | all_reinforcing | 10 |
| GO:0006662 | 0.0018 | Inf | 0.36 | 3 | glycerol ether metabolic process | all_reinforcing | 10 |
| GO:0006278 | 0.0021 | 2.7 | 6.8 | 15 | RNA-dependent DNA biosynthetic process | all_reinforcing | 10 |
| GO:1902047 | 0.0022 | 9.1 | 1.09 | 5 | polyamine transmembrane transport | all_reinforcing | 10 |
| GO:0046165 | 0.0041 | 2.6 | 6.56 | 14 | alcohol biosynthetic process | all_reinforcing | 10 |
| GO:0043605 | 0.0056 | 9.7 | 0.85 | 4 | cellular amide catabolic process | all_reinforcing | 10 |
| GO:0019509 | 0.0056 | 9.7 | 0.85 | 4 | L-methionine salvage from methylthioadenosine | all_reinforcing | 10 |
| GO:0072488 | 0.006 | 4.9 | 1.82 | 6 | ammonium transmembrane transport | all_reinforcing | 10 |
| GO:0015846 | 0.0064 | 6.1 | 1.34 | 5 | polyamine transport | all_reinforcing | 10 |
| GO:0006833 | 0.0065 | 21.8 | 0.49 | 3 | water transport | all_reinforcing | 10 |
| GO:0042044 | 0.0065 | 21.8 | 0.49 | 3 | fluid transport | all_reinforcing | 10 |
| GO:1902652 | 0.007 | 2.9 | 4.25 | 10 | secondary alcohol metabolic process | all_reinforcing | 10 |
| GO:0002098 | 0.007 | 3.9 | 2.43 | 7 | tRNA wobble uridine modification | all_reinforcing | 10 |
| GO:0006400 | 0.008 | 2.3 | 7.05 | 14 | tRNA modification | all_reinforcing | 10 |
| GO:0009067 | 0.0086 | 2.5 | 5.71 | 12 | aspartate family amino acid biosynthetic process | all_reinforcing | 10 |
| GO:0006696 | 0.0092 | 3 | 3.77 | 9 | ergosterol biosynthetic process | all_reinforcing | 10 |
| GO:0006694 | 0.0096 | 2.6 | 5.1 | 11 | steroid biosynthetic process | all_reinforcing | 10 |
| GO:0034220 | 0.0096 | 1.6 | 25.27 | 37 | ion transmembrane transport | all_reinforcing | 10 |
| GO:0032259 | 0.01 | 1.9 | 11.66 | 20 | methylation | all_reinforcing | 10 |
| GO:0015074 | 3.3E-05 | 5 | 3.71 | 13 | DNA integration | all_reinforcing | 15 |
| GO:0032197 | 6.2E-05 | 4 | 4.98 | 15 | transposition; RNA-mediated | all_reinforcing | 15 |
| GO:0046165 | 9.3E-05 | 4 | 4.59 | 14 | alcohol biosynthetic process | all_reinforcing | 15 |
| GO:0006278 | 0.00031 | 3.5 | 5.07 | 14 | RNA-dependent DNA biosynthetic process | all_reinforcing | 15 |
| GO:1902652 | 0.0011 | 3.9 | 3.32 | 10 | secondary alcohol metabolic process | all_reinforcing | 15 |
| GO:0019509 | 0.0011 | 18.7 | 0.59 | 4 | L-methionine salvage from methylthioadenosine | all_reinforcing | 15 |
| GO:0070525 | 0.0011 | 18.7 | 0.59 | 4 | tRNA threonylcarbamoyladenosine metabolic process | all_reinforcing | 15 |
| GO:0006696 | 0.0016 | 4 | 2.93 | 9 | ergosterol biosynthetic process | all_reinforcing | 15 |
| GO:0009086 | 0.0016 | 4 | 2.93 | 9 | methionine biosynthetic process | all_reinforcing | 15 |
| GO:0071267 | 0.0025 | 12.5 | 0.68 | 4 | L-methionine salvage | all_reinforcing | 15 |
| GO:0043102 | 0.0025 | 12.5 | 0.68 | 4 | amino acid salvage | all_reinforcing | 15 |
| GO:0043605 | 0.0025 | 12.5 | 0.68 | 4 | cellular amide catabolic process | all_reinforcing | 15 |
| GO:0016128 | 0.0033 | 3.5 | 3.22 | 9 | phytosteroid metabolic process | all_reinforcing | 15 |
| GO:0006811 | 0.0034 | 1.7 | 27.81 | 42 | ion transport | all_reinforcing | 15 |
| GO:0070900 | 0.0034 | 28 | 0.39 | 3 | mitochondrial tRNA modification | all_reinforcing | 15 |
| GO:1900864 | 0.0034 | 28 | 0.39 | 3 | mitochondrial RNA modification | all_reinforcing | 15 |
| GO:0006694 | 0.0049 | 3 | 4 | 10 | steroid biosynthetic process | all_reinforcing | 15 |
| GO:0009066 | 0.005 | 2.6 | 5.95 | 13 | aspartate family amino acid metabolic process | all_reinforcing | 15 |
| GO:0044107 | 0.0051 | 3.3 | 3.42 | 9 | cellular alcohol metabolic process | all_reinforcing | 15 |
| GO:0016125 | 0.0063 | 2.7 | 4.78 | 11 | sterol metabolic process | all_reinforcing | 15 |
| GO:1902047 | 0.0075 | 7.5 | 0.88 | 4 | polyamine transmembrane transport | all_reinforcing | 15 |
| GO:0006531 | 0.0079 | 14 | 0.49 | 3 | aspartate metabolic process | all_reinforcing | 15 |
| GO:0090646 | 0.0079 | 14 | 0.49 | 3 | mitochondrial tRNA processing | all_reinforcing | 15 |
| GO:0015804 | 0.0082 | 5.2 | 1.37 | 5 | neutral amino acid transport | all_reinforcing | 15 |
| GO:0016226 | 0.0082 | 5.2 | 1.37 | 5 | iron-sulfur cluster assembly | all_reinforcing | 15 |
| GO:0098655 | 0.0093 | 1.9 | 12.29 | 21 | cation transmembrane transport | all_reinforcing | 15 |
| GO:0015840 | 0.0095 | Inf | 0.2 | 2 | urea transport | all_reinforcing | 15 |
| GO:0034311 | 0.0095 | Inf | 0.2 | 2 | diol metabolic process | all_reinforcing | 15 |
| GO:0034312 | 0.0095 | Inf | 0.2 | 2 | diol biosynthetic process | all_reinforcing | 15 |
| GO:0019755 | 0.0095 | Inf | 0.2 | 2 | one-carbon compound transport | all_reinforcing | 15 |
| GO:0042883 | 0.0095 | Inf | 0.2 | 2 | cysteine transport | all_reinforcing | 15 |
| GO:0090502 | 0.0096 | 2.2 | 7.12 | 14 | RNA phosphodiester bond hydrolysis; endonucleolytic | all_reinforcing | 15 |
| GO:0015074 | 1.8E-06 | 6.8 | 2.87 | 13 | DNA integration | all_reinforcing | 20 |
| GO:0032197 | 2.8E-06 | 5.4 | 3.88 | 15 | transposition; RNA-mediated | all_reinforcing | 20 |
| GO:0006278 | 4.4E-05 | 4.6 | 3.73 | 13 | RNA-dependent DNA biosynthetic process | all_reinforcing | 20 |
| GO:0070525 | 0.00047 | 24.2 | 0.47 | 4 | tRNA threonylcarbamoyladenosine metabolic process | all_reinforcing | 20 |
| GO:0090502 | 0.0006 | 3.3 | 4.73 | 13 | RNA phosphodiester bond hydrolysis; endonucleolytic | all_reinforcing | 20 |
| GO:0034654 | 0.0017 | 1.6 | 41.44 | 59 | nucleobase-containing compound biosynthetic process | all_reinforcing | 20 |
| GO:0006551 | 0.0017 | 36.1 | 0.31 | 3 | leucine metabolic process | all_reinforcing | 20 |
| GO:0070900 | 0.0017 | 36.1 | 0.31 | 3 | mitochondrial tRNA modification | all_reinforcing | 20 |
| GO:1900864 | 0.0017 | 36.1 | 0.31 | 3 | mitochondrial RNA modification | all_reinforcing | 20 |
| GO:0015804 | 0.0021 | 7.6 | 1.01 | 5 | neutral amino acid transport | all_reinforcing | 20 |
| GO:0016226 | 0.0021 | 7.6 | 1.01 | 5 | iron-sulfur cluster assembly | all_reinforcing | 20 |
| GO:0001302 | 0.0029 | 3.9 | 2.56 | 8 | replicative cell aging | all_reinforcing | 20 |
| GO:0044249 | 0.0039 | 1.5 | 91.27 | 111 | cellular biosynthetic process | all_reinforcing | 20 |
| GO:1901576 | 0.004 | 1.5 | 92.28 | 112 | organic substance biosynthetic process | all_reinforcing | 20 |
| GO:0090646 | 0.0041 | 18 | 0.39 | 3 | mitochondrial tRNA processing | all_reinforcing | 20 |
| GO:0009083 | 0.0041 | 18 | 0.39 | 3 | branched-chain amino acid catabolic process | all_reinforcing | 20 |
| GO:0006310 | 0.005 | 2.2 | 8.69 | 17 | DNA recombination | all_reinforcing | 20 |
| GO:0015840 | 0.006 | Inf | 0.16 | 2 | urea transport | all_reinforcing | 20 |
| GO:0019755 | 0.006 | Inf | 0.16 | 2 | one-carbon compound transport | all_reinforcing | 20 |
| GO:0042883 | 0.006 | Inf | 0.16 | 2 | cysteine transport | all_reinforcing | 20 |
| GO:0043605 | 0.0077 | 12 | 0.47 | 3 | cellular amide catabolic process | all_reinforcing | 20 |
| GO:0019509 | 0.0077 | 12 | 0.47 | 3 | L-methionine salvage from methylthioadenosine | all_reinforcing | 20 |
| GO:0070880 | 0.0077 | 12 | 0.47 | 3 | fungal-type cell wall beta-glucan biosynthetic process | all_reinforcing | 20 |
| GO:0070879 | 0.0077 | 12 | 0.47 | 3 | fungal-type cell wall beta-glucan metabolic process | all_reinforcing | 20 |
| GO:0044283 | 0.0098 | 1.7 | 21.19 | 32 | small molecule biosynthetic process | all_reinforcing | 20 |
| GO:0015074 | 1.7E-06 | 7.4 | 2.4 | 12 | DNA integration | all_reinforcing | 25 |
| GO:0006278 | 1.7E-05 | 5.6 | 2.92 | 12 | RNA-dependent DNA biosynthetic process | all_reinforcing | 25 |
| GO:0032197 | 2.7E-05 | 5.2 | 3.05 | 12 | transposition; RNA-mediated | all_reinforcing | 25 |
| GO:0090502 | 9.7E-05 | 4.5 | 3.44 | 12 | RNA phosphodiester bond hydrolysis; endonucleolytic | all_reinforcing | 25 |
| GO:0034654 | 0.0014 | 1.8 | 29.54 | 45 | nucleobase-containing compound biosynthetic process | all_reinforcing | 25 |
| GO:0001302 | 0.002 | 4.7 | 1.88 | 7 | replicative cell aging | all_reinforcing | 25 |
| GO:0044249 | 0.003 | 1.6 | 64.61 | 82 | cellular biosynthetic process | all_reinforcing | 25 |
| GO:0015804 | 0.0039 | 8.4 | 0.71 | 4 | neutral amino acid transport | all_reinforcing | 25 |
| GO:0006310 | 0.004 | 2.5 | 6.43 | 14 | DNA recombination | all_reinforcing | 25 |
| GO:1901576 | 0.004 | 1.6 | 65.19 | 82 | organic substance biosynthetic process | all_reinforcing | 25 |
| GO:0015840 | 0.0042 | Inf | 0.13 | 2 | urea transport | all_reinforcing | 25 |
| GO:0019755 | 0.0042 | Inf | 0.13 | 2 | one-carbon compound transport | all_reinforcing | 25 |
| GO:0070525 | 0.0046 | 14.6 | 0.39 | 3 | tRNA threonylcarbamoyladenosine metabolic process | all_reinforcing | 25 |
| GO:0007568 | 0.0063 | 3.3 | 2.86 | 8 | aging | all_reinforcing | 25 |
| GO:0090305 | 0.0087 | 2.3 | 6.3 | 13 | nucleic acid phosphodiester bond hydrolysis | all_reinforcing | 25 |
| GO:0006696 | 0.0093 | 3.9 | 1.88 | 6 | ergosterol biosynthetic process | all_reinforcing | 25 |
| GO:0015074 | 2E-07 | 9.3 | 1.99 | 12 | DNA integration | all_reinforcing | 30 |
| GO:0006278 | 1.6E-06 | 7.2 | 2.37 | 12 | RNA-dependent DNA biosynthetic process | all_reinforcing | 30 |
| GO:0032197 | 3.5E-06 | 6.6 | 2.53 | 12 | transposition; RNA-mediated | all_reinforcing | 30 |
| GO:0090502 | 4.5E-06 | 6.4 | 2.58 | 12 | RNA phosphodiester bond hydrolysis; endonucleolytic | all_reinforcing | 30 |
| GO:0006310 | 0.00028 | 3.4 | 4.95 | 14 | DNA recombination | all_reinforcing | 30 |
| GO:0090305 | 0.0019 | 3 | 4.68 | 12 | nucleic acid phosphodiester bond hydrolysis | all_reinforcing | 30 |
| GO:1902047 | 0.0045 | 13.5 | 0.38 | 3 | polyamine transmembrane transport | all_reinforcing | 30 |
| GO:0044249 | 0.0046 | 1.7 | 45 | 59 | cellular biosynthetic process | all_reinforcing | 30 |
| GO:0034654 | 0.0047 | 1.8 | 20.59 | 32 | nucleobase-containing compound biosynthetic process | all_reinforcing | 30 |
| GO:1901576 | 0.0059 | 1.6 | 45.43 | 59 | organic substance biosynthetic process | all_reinforcing | 30 |
| GO:0015846 | 0.007 | 10.8 | 0.43 | 3 | polyamine transport | all_reinforcing | 30 |
| GO:1903008 | 0.0092 | 4.6 | 1.34 | 5 | organelle disassembly | all_reinforcing | 30 |
| GO:0015074 | 3.7E-08 | 11.2 | 1.74 | 12 | DNA integration | all_reinforcing | 35 |
| GO:0032197 | 4.5E-07 | 8.4 | 2.12 | 12 | transposition; RNA-mediated | all_reinforcing | 35 |
| GO:0006278 | 4.5E-07 | 8.4 | 2.12 | 12 | RNA-dependent DNA biosynthetic process | all_reinforcing | 35 |
| GO:0090502 | 5.9E-07 | 8.1 | 2.17 | 12 | RNA phosphodiester bond hydrolysis; endonucleolytic | all_reinforcing | 35 |
| GO:0006310 | 0.00012 | 4 | 4.05 | 13 | DNA recombination | all_reinforcing | 35 |
| GO:0090305 | 0.00021 | 4 | 3.71 | 12 | nucleic acid phosphodiester bond hydrolysis | all_reinforcing | 35 |
| GO:0044249 | 0.00062 | 2.1 | 34.67 | 50 | cellular biosynthetic process | all_reinforcing | 35 |
| GO:0034654 | 0.00077 | 2.3 | 15.62 | 28 | nucleobase-containing compound biosynthetic process | all_reinforcing | 35 |
| GO:1901576 | 0.0008 | 2 | 35.01 | 50 | organic substance biosynthetic process | all_reinforcing | 35 |
| GO:1902047 | 0.0033 | 15.3 | 0.34 | 3 | polyamine transmembrane transport | all_reinforcing | 35 |
| GO:0015846 | 0.0051 | 12.2 | 0.39 | 3 | polyamine transport | all_reinforcing | 35 |
| GO:0043457 | 0.0067 | 40.3 | 0.14 | 2 | regulation of cellular respiration | all_reinforcing | 35 |
| GO:0006696 | 0.0095 | 4.5 | 1.35 | 5 | ergosterol biosynthetic process | all_reinforcing | 35 |
| GO:0015074 | 1.8E-08 | 12.2 | 1.64 | 12 | DNA integration | all_reinforcing | 40 |
| GO:0090502 | 1.7E-07 | 9.4 | 1.96 | 12 | RNA phosphodiester bond hydrolysis; endonucleolytic | all_reinforcing | 40 |
| GO:0032197 | 2.2E-07 | 9.1 | 2.01 | 12 | transposition; RNA-mediated | all_reinforcing | 40 |
| GO:0006278 | 2.2E-07 | 9.1 | 2.01 | 12 | RNA-dependent DNA biosynthetic process | all_reinforcing | 40 |
| GO:0006310 | 3.1E-05 | 4.8 | 3.61 | 13 | DNA recombination | all_reinforcing | 40 |
| GO:0090305 | 6.7E-05 | 4.7 | 3.33 | 12 | nucleic acid phosphodiester bond hydrolysis | all_reinforcing | 40 |
| GO:0015846 | 0.0017 | 21.7 | 0.27 | 3 | polyamine transport | all_reinforcing | 40 |
| GO:1902047 | 0.0017 | 21.7 | 0.27 | 3 | polyamine transmembrane transport | all_reinforcing | 40 |
| GO:0044249 | 0.0027 | 2 | 28.87 | 41 | cellular biosynthetic process | all_reinforcing | 40 |
| GO:0034654 | 0.0053 | 2.1 | 12.88 | 22 | nucleobase-containing compound biosynthetic process | all_reinforcing | 40 |
| GO:0008610 | 0.0063 | 3.1 | 3.47 | 9 | lipid biosynthetic process | all_reinforcing | 40 |
| GO:0006696 | 0.0064 | 5 | 1.23 | 5 | ergosterol biosynthetic process | all_reinforcing | 40 |
| GO:0015804 | 0.0087 | 9.3 | 0.46 | 3 | neutral amino acid transport | all_reinforcing | 40 |
| GO:0015074 | 6.3E-08 | 12.3 | 1.5 | 11 | DNA integration | all_reinforcing | 45 |
| GO:0090502 | 3.7E-07 | 9.9 | 1.7 | 11 | RNA phosphodiester bond hydrolysis; endonucleolytic | all_reinforcing | 45 |
| GO:0006278 | 3.7E-07 | 9.9 | 1.7 | 11 | RNA-dependent DNA biosynthetic process | all_reinforcing | 45 |
| GO:0032197 | 6.3E-07 | 9.3 | 1.8 | 11 | transposition; RNA-mediated | all_reinforcing | 45 |
| GO:0006310 | 2.8E-05 | 5.3 | 3.1 | 12 | DNA recombination | all_reinforcing | 45 |
| GO:0090305 | 7.6E-05 | 5.1 | 2.9 | 11 | nucleic acid phosphodiester bond hydrolysis | all_reinforcing | 45 |
| GO:0044249 | 0.00039 | 2.5 | 22.9 | 36 | cellular biosynthetic process | all_reinforcing | 45 |
| GO:1901576 | 0.0005 | 2.5 | 23.2 | 36 | organic substance biosynthetic process | all_reinforcing | 45 |
| GO:1901360 | 0.0018 | 2.2 | 20.7 | 32 | organic cyclic compound metabolic process | all_reinforcing | 45 |
| GO:0034654 | 0.0024 | 2.4 | 10 | 19 | nucleobase-containing compound biosynthetic process | all_reinforcing | 45 |
| GO:0006696 | 0.0029 | 6.2 | 1 | 5 | ergosterol biosynthetic process | all_reinforcing | 45 |
| GO:0016128 | 0.0048 | 5.4 | 1.2 | 5 | phytosteroid metabolic process | all_reinforcing | 45 |
| GO:0044107 | 0.0056 | 5.2 | 1.2 | 5 | cellular alcohol metabolic process | all_reinforcing | 45 |
| GO:1902652 | 0.0056 | 5.2 | 1.2 | 5 | secondary alcohol metabolic process | all_reinforcing | 45 |
| GO:0055114 | 0.0075 | 2.4 | 7.1 | 14 | oxidation-reduction process | all_reinforcing | 45 |
| GO:0006694 | 0.0075 | 4.8 | 1.3 | 5 | steroid biosynthetic process | all_reinforcing | 45 |
| GO:0046165 | 0.0087 | 4.6 | 1.3 | 5 | alcohol biosynthetic process | all_reinforcing | 45 |
| GO:0006644 | 0.0099 | 4.4 | 1.4 | 5 | phospholipid metabolic process | all_reinforcing | 45 |
| GO:0015074 | 2.5E-05 | 8.8 | 1.32 | 8 | DNA integration | all_reinforcing | 50 |
| GO:0006278 | 5.6E-05 | 7.7 | 1.47 | 8 | RNA-dependent DNA biosynthetic process | all_reinforcing | 50 |
| GO:0090502 | 6.8E-05 | 7.5 | 1.5 | 8 | RNA phosphodiester bond hydrolysis; endonucleolytic | all_reinforcing | 50 |
| GO:0032197 | 0.00012 | 6.8 | 1.61 | 8 | transposition; RNA-mediated | all_reinforcing | 50 |
| GO:0006310 | 0.00052 | 4.7 | 2.49 | 9 | DNA recombination | all_reinforcing | 50 |
| GO:0006696 | 0.0011 | 8.1 | 0.84 | 5 | ergosterol biosynthetic process | all_reinforcing | 50 |
| GO:0016128 | 0.002 | 6.9 | 0.95 | 5 | phytosteroid metabolic process | all_reinforcing | 50 |
| GO:0090305 | 0.002 | 4.2 | 2.42 | 8 | nucleic acid phosphodiester bond hydrolysis | all_reinforcing | 50 |
| GO:0044107 | 0.0023 | 6.6 | 0.99 | 5 | cellular alcohol metabolic process | all_reinforcing | 50 |
| GO:1902652 | 0.0023 | 6.6 | 0.99 | 5 | secondary alcohol metabolic process | all_reinforcing | 50 |
| GO:0006694 | 0.0033 | 6 | 1.06 | 5 | steroid biosynthetic process | all_reinforcing | 50 |
| GO:0046165 | 0.0038 | 5.8 | 1.1 | 5 | alcohol biosynthetic process | all_reinforcing | 50 |
| GO:0016125 | 0.0075 | 4.8 | 1.28 | 5 | sterol metabolic process | all_reinforcing | 50 |
| GO:1901362 | 0.0094 | 2.4 | 8.21 | 15 | organic cyclic compound biosynthetic process | all_reinforcing | 50 |
Author response table 6
Results of the Sign Test for Lineage-Specific Selection Applied to UPS Gene BY / RM eQTLs.
| LOD | n_eQTLs | n_genes | n_pairs | reinf_by_up | reinf_rm_up | oppos_by_up | oppos_rm_up | excess_reinforcing_pairs | chi_sq_p | gene_set |
|---|---|---|---|---|---|---|---|---|---|---|
| 2.4 | 1128 | 186 | 95 | 16 | 30 | 29 | 20 | –4.21 | 0.815 | all_UPS_genes |
| 5 | 587 | 176 | 72 | 13 | 23 | 23 | 13 | 0 | 1 | all_UPS_genes |
| 10 | 250 | 142 | 29 | 2 | 12 | 8 | 7 | –4.41 | 0.428 | all_UPS_genes |
| 15 | 162 | 105 | 19 | 1 | 8 | 7 | 3 | –2.74 | 0.619 | all_UPS_genes |
| 20 | 115 | 85 | 10 | 0 | 4 | 4 | 2 | –3.2 | 0.472 | all_UPS_genes |
| 25 | 90 | 72 | 8 | 0 | 3 | 3 | 2 | -3 | 0.475 | all_UPS_genes |
| 30 | 63 | 56 | 5 | 0 | 2 | 2 | 1 | –1.6 | 1 | all_UPS_genes |
| 35 | 52 | 47 | 4 | 0 | 1 | 2 | 1 | -2 | 1 | all_UPS_genes |
| 40 | 37 | 34 | 3 | 0 | 1 | 2 | 0 | 0 | NaN | all_UPS_genes |
| 45 | 32 | 30 | 2 | 0 | 1 | 1 | 0 | 0 | NaN | all_UPS_genes |
| 2.4 | 242 | 33 | 14 | 3 | 3 | 2 | 6 | –0.857 | 1 | proteasome_genes |
| 5 | 146 | 32 | 12 | 3 | 2 | 2 | 5 | –1.33 | 1 | proteasome_genes |
| 10 | 62 | 30 | 4 | 0 | 0 | 0 | 4 | 0 | NaN | proteasome_genes |
| 15 | 32 | 19 | 2 | 0 | 0 | 0 | 2 | 0 | NaN | proteasome_genes |
| 20 | 18 | 14 | 1 | 0 | 0 | 0 | 1 | 0 | NaN | proteasome_genes |
| 25 | 11 | 9 | 1 | 0 | 0 | 0 | 1 | 0 | NaN | proteasome_genes |
| 2.4 | 829 | 145 | 76 | 13 | 23 | 25 | 15 | -4 | 0.812 | ubiquitin_system_genes |
| 5 | 410 | 137 | 57 | 10 | 18 | 20 | 9 | 0 | 1 | ubiquitin_system_genes |
| 10 | 173 | 105 | 24 | 2 | 11 | 7 | 4 | -1 | 1 | ubiquitin_system_genes |
| 15 | 118 | 80 | 17 | 1 | 7 | 7 | 2 | –1.65 | 1 | ubiquitin_system_genes |
| 20 | 88 | 65 | 8 | 0 | 3 | 4 | 1 | -2 | 1 | ubiquitin_system_genes |
| 25 | 73 | 58 | 6 | 0 | 2 | 3 | 1 | -2 | 1 | ubiquitin_system_genes |
| 30 | 54 | 48 | 4 | 0 | 1 | 2 | 1 | -2 | 1 | ubiquitin_system_genes |
| 35 | 44 | 40 | 3 | 0 | 0 | 2 | 1 | –2.67 | 0.324 | ubiquitin_system_genes |
| 40 | 31 | 29 | 2 | 0 | 0 | 2 | 0 | 0 | NaN | ubiquitin_system_genes |
| 45 | 26 | 25 | 1 | 0 | 0 | 1 | 0 | 0 | NaN | ubiquitin_system_genes |
| 2.4 | 618 | 111 | 56 | 11 | 16 | 19 | 10 | -1 | 1 | E3_ligase_genes |
| 5 | 300 | 103 | 39 | 8 | 12 | 14 | 5 | 2.67 | 0.909 | E3_ligase_genes |
| 10 | 129 | 79 | 15 | 2 | 7 | 4 | 2 | 1.6 | 1 | E3_ligase_genes |
| 15 | 83 | 56 | 9 | 1 | 4 | 4 | 0 | 1.78 | 1 | E3_ligase_genes |
| 20 | 64 | 46 | 5 | 0 | 2 | 3 | 0 | 0 | NaN | E3_ligase_genes |
| 25 | 49 | 39 | 3 | 0 | 1 | 2 | 0 | 0 | NaN | E3_ligase_genes |
| 30 | 37 | 33 | 3 | 0 | 1 | 2 | 0 | 0 | NaN | E3_ligase_genes |
| 35 | 30 | 28 | 2 | 0 | 0 | 2 | 0 | 0 | NaN | E3_ligase_genes |
| 40 | 22 | 20 | 2 | 0 | 0 | 2 | 0 | 0 | NaN | E3_ligase_genes |
| 45 | 18 | 17 | 1 | 0 | 0 | 1 | 0 | 0 | NaN | E3_ligase_genes |
| 2.4 | 57 | 9 | 6 | 0 | 4 | 2 | 0 | 0 | NaN | proteasome_chaperone_genes |
| 5 | 31 | 8 | 4 | 0 | 3 | 1 | 0 | 0 | NaN | proteasome_chaperone_genes |
| 10 | 15 | 8 | 2 | 0 | 1 | 1 | 0 | 0 | NaN | proteasome_chaperone_genes |
| 15 | 12 | 7 | 1 | 0 | 1 | 0 | 0 | 0 | NaN | proteasome_chaperone_genes |
| 20 | 9 | 6 | 1 | 0 | 1 | 0 | 0 | 0 | NaN | proteasome_chaperone_genes |
| 25 | 6 | 5 | 1 | 0 | 1 | 0 | 0 | 0 | NaN | proteasome_chaperone_genes |
| 30 | 5 | 4 | 1 | 0 | 1 | 0 | 0 | 0 | NaN | proteasome_chaperone_genes |
| 35 | 4 | 3 | 1 | 0 | 1 | 0 | 0 | 0 | NaN | proteasome_chaperone_genes |
| 40 | 4 | 3 | 1 | 0 | 1 | 0 | 0 | 0 | NaN | proteasome_chaperone_genes |
| 45 | 4 | 3 | 1 | 0 | 1 | 0 | 0 | 0 | NaN | proteasome_chaperone_genes |
Author response table 7
Results of Binomial Enrichment Test Applied to QTLs for Individual N-degrons.
| N-degron | N_QTLs | N_RM_up | N_BY_up | p_value |
|---|---|---|---|---|
| Ala | 15 | 10 | 5 | 0.30 |
| Arg | 7 | 4 | 3 | 1.00 |
| Asn | 7 | 3 | 4 | 1.00 |
| Asp | 8 | 5 | 3 | 0.73 |
| Cys | 9 | 4 | 5 | 1.00 |
| Gln | 3 | 2 | 1 | 1.00 |
| Glu | 4 | 2 | 2 | 1.00 |
| Gly | 9 | 5 | 4 | 1.00 |
| His | 9 | 6 | 3 | 0.51 |
| Ile | 1 | 1 | 0 | 1.00 |
| Leu | 2 | 1 | 1 | 1.00 |
| Lys | 7 | 5 | 2 | 0.45 |
| Met | 4 | 1 | 3 | 0.63 |
| Phe | 10 | 6 | 4 | 0.75 |
| Pro | 13 | 8 | 5 | 0.58 |
| Ser | 9 | 6 | 3 | 0.51 |
| Thr | 12 | 8 | 4 | 0.39 |
| Trp | 6 | 4 | 2 | 0.69 |
| Tyr | 7 | 4 | 3 | 1.00 |
| Val | 7 | 4 | 3 | 1.00 |
Additional files
-
Supplementary file 1
Allele frequency difference and LOD score traces from QTL mapping experiments.
The plots show the loess-smoothed RM allele frequency difference (high UPS activity pool minus low UPS activity pool) and LOD score traces for the 20 N-degrons. QTLs are marked with asterisks, which are colored by biological replicate.
- https://cdn.elifesciences.org/articles/79570/elife-79570-supp1-v2.pdf
-
Supplementary file 2
Influence of LOD score significance threshold on QTL pathway specificity.
The LOD score and RM allele frequency difference (QTL effect direction) traces for two independent biological replicates of each N-degron are shown for each of 23 pathway-specific QTL regions. Dashed lines at distinct LOD scores illustrate how changing the significance threshold changes the pathway-specificity of a given QTL region.
- https://cdn.elifesciences.org/articles/79570/elife-79570-supp2-v2.pdf
-
Supplementary file 3
Oligonucleotides.
Table listing oligonucleotides used in this study.
- https://cdn.elifesciences.org/articles/79570/elife-79570-supp3-v2.xlsx
-
Supplementary file 4
Plasmids.
Table of plasmids used in this study.
- https://cdn.elifesciences.org/articles/79570/elife-79570-supp4-v2.xlsx
-
Supplementary file 5
Yeast strains.
Table listing all yeast strains used in the study.
- https://cdn.elifesciences.org/articles/79570/elife-79570-supp5-v2.xlsx
-
MDAR checklist
- https://cdn.elifesciences.org/articles/79570/elife-79570-mdarchecklist1-v2.docx
Download links
A two-part list of links to download the article, or parts of the article, in various formats.
Downloads (link to download the article as PDF)
Open citations (links to open the citations from this article in various online reference manager services)
Cite this article (links to download the citations from this article in formats compatible with various reference manager tools)
Variation in ubiquitin system genes creates substrate-specific effects on proteasomal protein degradation
eLife 11:e79570.
https://doi.org/10.7554/eLife.79570


