Variation in ubiquitin system genes creates substrate-specific effects on proteasomal protein degradation
- Department of Genetics, Cell Biology, and Development, University of Minnesota, United States
Peer review process
This article was accepted for publication as part of eLife's original publishing model.
History
- Version of Record published
- Accepted Manuscript published
- Accepted
- Received
- Preprint posted
Decision letter
-
Magnus NordborgReviewing Editor; Gregor Mendel Institute, Austria
-
David RonSenior Editor; University of Cambridge, United Kingdom
-
Magnus NordborgReviewer; Gregor Mendel Institute, Austria
Our editorial process produces two outputs: (i) public reviews designed to be posted alongside the preprint for the benefit of readers; (ii) feedback on the manuscript for the authors, including requests for revisions, shown below. We also include an acceptance summary that explains what the editors found interesting or important about the work.
Decision letter after peer review:
Thank you for submitting your article "Variation in Ubiquitin System Genes Creates Substrate-Specific Effects on Proteasomal Protein Degradation" for consideration by eLife. Your article has been reviewed by 4 peer reviewers, , including Magnus Nordborg as the Reviewing Editor and Reviewer #1 and the evaluation has been overseen by David Ron as the Senior Editor.
The reviewers have discussed their reviews with one another and agreed this work is elegant, and absolutely deserves to be published. The Reviewing Editor has drafted this to help you prepare a revised submission – please also see the individual reviews for further suggestions for improvements.
There is an overall need to quantify several statements (see individual reviews). This should be straightforward and requires no additional experiments.
In addition, we would like to encourage you to put a bit more thought into the evolutionary analysis. For example, the issue of pleiotropy could be discussed further (as noted by Reviewer 1), and so could the persistent shifts in effect between the strains (Reviewer 4). It may be worth considering Hunter Fraser's use of sign tests to detect selection, e.g.,
https://www.pnas.org/doi/10.1073/pnas.0912245107 in this context.
Reviewer #1 (Recommendations for the authors):
I trust more mechanistic reviewers to comment on your experiments. From my point of view, I have only a few suggestions for improvements:
1) You argue (in connection with Figure 2)1 that "many QTLs were found only for individual pathways", but this is surely sensitive to significance thresholds. A more sophisticated analysis of pleiotropy would be in order.
2) You never quantify how much of the total variation your QTL explains.
3) You never quantify how much of each QTL your identified causal SNPs explain.
4) When dissecting your UBR1 alleles, would be nice to pay homage to this classic:
Laurie-Ahlberg, C. C., and L. F. Stam. 1987. "Use of P-Element-Mediated Transformation to Identify the Molecular Basis of Naturally Occurring Variants Affecting Adh Expression in Drosophila melanogaster." Genetics 115 (1): 129-40.
Reviewer #2 (Recommendations for the authors):
The only thing I would have appreciated is the validation of some of their findings using orthogonal approaches. There are a lot of readily established biochemical assays they can use to support their claims.
Reviewer #3 (Recommendations for the authors):
1. Figure 1 was super helpful in explaining the question and the methods used in this paper.
2. In this sentence, I am not sure that the second portion follows from the first: "These results are consistent with our observation that RM had higher UPS activity for 15 of 20 N-degrons (Figure 1D, Supplementary Table 1), suggesting that the QTLs we have mapped underlie a substantial portion of the heritable UPS activity difference between BY and RM." Maybe you missed the majority of the genetic variation that influences UPS activity, but you got lucky and the portion you detected just happened to be consistent with the overall trend. I think the authors need a different type of analysis to draw a conclusion about whether they sampled "a substantial portion" of heritable differences or whether there is missing heritability here. Can the authors use their data to calculate the narrow sense heritability and then report how much of that heritability is explained by the detected variants?
3. Perhaps reconsider using the term N-degron in the abstract. It's a bit specific. The intro and figures do a great job at defining an N-degron.
4. I did not know that each of the 20 amino acids is dealt with by one of two UPS systems. This was eventually clear in figure 1B where it seems Trp and Met N-degrons are degraded by different systems. Perhaps make this clearer in the text where N-degrons are described and defined.
5. I was mildly confused by the "italics vs plain" statement in figure 3D. Is it intended for only this panel or for the whole figure, or for the whole paper?
6. Some of the focus of the manuscript might be shifted away from general "straw man" questions, like whether this trait is mendelian and controlled by large effect variants (intro lines 55 – 66). The discovery of smaller effect variants is presented as a major finding, but it seems obvious that these exist. Perhaps instead focus on a more quantitative analysis of the power of the current study. How much heritability is explained by previously known genes or variants, and how much additional heritability is explained by the previously unknown genes/variants detected here? Even if a heritability analysis is not feasible, it think a shift in focus from a qualitative statement – we detect small effect variants – to a more quantitative or nuanced statement, would be appropriate.
Reviewer #4 (Recommendations for the authors):
I'm interested in the overall pattern that BY seems to have systematically lower UPS activity than RM. BY carries a rare allele at 3 out of the 4 examples in Figure S5, which hints that perhaps there has been an adaptation of BY for lower UPS. It would be interesting to explore this hypothesis further, or at least to discuss it. Has there been an overall adaptation for BY to be less transcriptionally active, coupled with lower degradation rates? Perhaps this might be explored using the previous data sets on mRNA in these lines – presumably, changes in transcription under this model could be either cis or trans. (That analysis is distinct from the analysis reported at L312, which focuses on specific trans-effects of the UPS variants.) And perhaps the authors may have other ideas as well to explore the evolutionary questions.
The paper reports 149 loci, but if I am reading this correctly it looks like this may double-count shared loci. It would be nice to discuss a bit more about likely sharing (ie pleiotropy) of the hits. (It's also a bit hard to see from 2B which of these are likely shared.)
L143: it should be possible to make this statement quantitative.
Para 303, 312: It seems likely that you may be looking for an effect that is small at individual genes but widespread. I would suggest looking more carefully at the overall distribution: eg in the protein data is there an upward shift in the mean? You could also use a more sophisticated method like ashR to study the distribution of changes. For Figure 5 you could also consider adding information about global patterns in means and correlations, which are difficult to read from these plots.
https://doi.org/10.7554/eLife.79570.sa1Author response
Reviewer #1 (Recommendations for the authors):
I trust more mechanistic reviewers to comment on your experiments. From my point of view, I have only a few suggestions for improvements:
1) You argue (in connection with Figure 2)1 that "many QTLs were found only for individual pathways", but this is surely sensitive to significance thresholds. A more sophisticated analysis of pleiotropy would be in order.
The revised manuscript includes an expanded analysis of pleiotropy and how the significance threshold used for QTL detection influences QTL pathway specificity. The high degree of QTL pathway specificity we observed was robust to these additional analyses.
As described in the revised manuscript (pg. 6, para. 3, line 180), we considered a QTL's effect common to multiple N-degrons when QTL peaks for distinct N-degrons were within 100 kb of each other and had the same direction of effect. Using these criteria, the 149 QTLs detected for the 20 N-degrons correspond to 35 distinct QTL regions that each affect between 1 and 11 N-degrons. At the LOD score threshold of 4.5 used in the manuscript, 23 of these 35 QTL regions specifically affected N-degrons from an individual pathway in the N-end Rule, with 11 regions affecting only Ac/N-degrons and 12 regions affecting only Arg/N-degrons. Five of the 23 distinct, pathway-specific QTL regions exclusively affected individual N-degrons. The remaining 12 of the 35 distinct QTL regions have the same direction of effect for at least one reporter each from the Arg/N-end and Ac/N-end pathways. The revised manuscript includes additional text in the Results section (pg. 6, para. 3) discussing pleiotropy among QTLs and a new table (Figure 2—figure supplement 2), which provides detailed information on the 35 distinct QTL regions, including their pathway- and N-degron specificity.
To understand the influence of significance threshold on these results, we analyzed how relaxing the LOD score threshold affected the number of pathway- or N-degron-specific QTL regions. The results of this analysis are summarized in Author response table 1. Supplementary file 2 shows the LOD score and allele frequency difference traces for all 20 N-degrons at the 23 N-end Rule pathway- or N-degron-specific QTL regions at multiple significance thresholds. Author response table 2 and Supplementary file 2 provide detailed information on how the N-end Rule pathway- and N-degron-specificity of each of the 35 distinct QTL regions is influenced by LOD score threshold.
Author response table 1
Influence of LOD score significance threshold on the fraction of N-end rule pathway- and N-degron-specific QTLs.
| LOD 4.5 | LOD 3.5 | LOD 2.5 | |
|---|---|---|---|
| N-end Rule Pathway-specific QTLs | 23 / 35 (66%) | 19 / 35 (54%) | 16 / 35 (46%) |
| N-degron-specific QTLs | 5 / 35 (14%) | 3 / 35 (9%) | 3 / 35 (9%) |
Author response table 2
Shared QTL Regions and N-degrons Affected.
| N | QTL | chr | QTL_CI_left | QTL_peak | QTL_CI_right | LOD | RM_AFD | N. N-degrons Affected | N-degrons Affected | Pathway-Specific (LOD 4.5) | Pathway-Specific (LOD 3.5) | Pathway-Specific (LOD 2.5) | N-degron-Specific (LOD 4.5) | N-degron-Specific (LOD 3.5) | N-degron-Specific (LOD 2.5) |
|---|---|---|---|---|---|---|---|---|---|---|---|---|---|---|---|
| 1 | chr_1_a | 1 | 5021 | 39400 | 52122 | 45 | -0.325 | 7 | Ala, Cys, Gly, Pro, Ser, Thr, Val | Ac/N-end | Ac/N-end | Ac/N-end | no | no | no |
| 2 | chr_2_a | 2 | 473450 | 515516 | 573934 | 11.1 | 0.13 | 3 | Arg, Lys, Phe | Arg/N-end | Arg/N-end | no | no | no | no |
| 3 | chr_2_b | 2 | 534970 | 585630 | 640010 | 8.9 | 0.112 | 5 | Ala, Arg, Asp, Lys, Met | no | no | no | no | no | no |
| 4 | chr_4_a | 4 | 29500 | 87662 | 116525 | 7.3 | -0.108 | 4 | Gln, Glu, Gly, His | no | no | no | no | no | no |
| 5 | chr_4_b | 4 | 273175 | 327300 | 362600 | 17.5 | 0.152 | 2 | Trp, Tyr | Arg/N-end | Arg/N-end | no | no | no | no |
| 6 | chr_4_c | 4 | 376817 | 425550 | 463567 | 14.3 | 0.156 | 6 | Ala, Phe, Pro, Ser, Thr, Trp | no | no | no | no | no | no |
| 7 | chr_4_d | 4 | 392275 | 498200 | 557000 | 8.2 | -0.107 | 2 | Asn, Asp | Arg/N-end | Arg/N-end | Arg/N-end | no | no | no |
| 8 | chr_5_a | 5 | 351400 | 372136 | 396250 | 37.5 | 0.248 | 7 | Ala, Cys, Gly, Pro, Ser, Thr, Val | Ac/N-end | Ac/N-end | Ac/N-end | no | no | no |
| 13 | chr_7_a | 7 | 42075 | 62775 | 103225 | 12.5 | -0.155 | 2 | Asn, Thr | no | no | no | no | no | no |
| 9 | chr_7_b | 7 | 98178 | 132779 | 172279 | 14.3 | -0.156 | 7 | Ala, Cys, Gly, Pro, Ser, Thr, Val | Ac/N-end | no | no | no | no | no |
| 10 | chr_7_c | 7 | 389941 | 418641 | 451318 | 18 | 0.167 | 11 | Ala, Asn, Cys, Gly, Phe, Pro, Ser, Thr, Trp, Tyr, Val | no | no | no | no | no | no |
| 11 | chr_7_d | 7 | 841300 | 869700 | 899934 | 15.2 | -0.157 | 3 | Arg, Asn, Asp | Arg/N-end | Arg/N-end | Arg/N-end | no | no | no |
| 12 | chr_7_e | 7 | 856120 | 870980 | 883830 | 107.5 | 0.409 | 5 | His, Leu, Phe, Trp, Tyr | Arg/N-end | Arg/N-end | Arg/N-end | no | no | no |
| 15 | chr_8_a | 8 | 50150 | 98050 | 127300 | 6 | -0.101 | 1 | Tyr | Arg/N-end | Arg/N-end | Arg/N-end | Tyr | Tyr | Tyr |
| 14 | chr_8_b | 8 | 118875 | 148400 | 193675 | 8.4 | 0.104 | 2 | Asp, Lys | Arg/N-end | Arg/N-end | Arg/N-end | no | no | no |
| 17 | chr_9_a | 9 | 94550 | 130775 | 168000 | 5.1 | 0.099 | 2 | His, Lys | Arg/N-end | Arg/N-end | Arg/N-end | no | no | no |
| 16 | chr_9_b | 9 | 267641 | 291492 | 315417 | 23.5 | 0.195 | 6 | Ala, Gly, Pro, Ser, Thr, Val | Ac/N-end | Ac/N-end | Ac/N-end | no | no | no |
| 18 | chr_10_a | 10 | 323900 | 345482 | 371186 | 21.9 | 0.182 | 11 | Ala, Arg, Cys, Gln, Gly, Lys, Phe, Pro, Ser, Trp, Tyr | no | no | no | no | no | no |
| 19 | chr_10_b | 10 | 589770 | 615660 | 641600 | 25.1 | 0.192 | 5 | Ala, Arg, Asn, Cys, Gln | no | no | no | no | no | no |
| 21 | chr_11_a | 11 | 118750 | 156450 | 173600 | 16 | 0.152 | 1 | His | Arg/N-end | Arg/N-end | Arg/N-end | His | no | no |
| 20 | chr_11_b | 11 | 291030 | 339790 | 388750 | 8.4 | -0.106 | 5 | Ala, Arg, Cys, Phe, Thr | no | no | no | no | no | no |
| 22 | chr_12_a | 12 | 157200 | 197050 | 226850 | 8.2 | 0.126 | 2 | Ala, Pro | Ac/N-end | no | no | no | no | no |
| 23 | chr_12_b | 12 | 644414 | 657241 | 674723 | 42.1 | -0.25 | 11 | Ala, Cys, Gly, Met, Phe, Pro, Ser, Thr, Trp, Tyr, Val | no | no | no | no | no | no |
| 24 | chr_12_c | 12 | 639637 | 674125 | 702650 | 9.7 | 0.108 | 4 | Asp, Gly, His, Ile | Arg/N-end | Arg/N-end | Arg/N-end | no | no | no |
| 25 | chr_13_a | 13 | 0 | 24650 | 58950 | 9.6 | -0.162 | 1 | Ala | Ac/N-end | Ac/N-end | no | Ala | no | no |
| 27 | chr_13_b | 13 | 31800 | 56525 | 77675 | 14.9 | 0.145 | 2 | His, Phe | Arg/N-end | Arg/N-end | Arg/N-end | no | no | no |
| 26 | chr_13_c | 13 | 265350 | 296167 | 331584 | 16.5 | 0.17 | 6 | Arg, Asn, Asp, Glu, His, Lys | Arg/N-end | no | no | no | no | no |
| 29 | chr_14_a | 14 | 450731 | 465394 | 482912 | 89.3 | -0.342 | 8 | His, Leu, Lys, Met, Phe, Pro, Trp, Tyr | no | no | no | no | no | no |
| 28 | chr_14_b | 14 | 449725 | 470850 | 504025 | 86.7 | 0.336 | 2 | Asp, Thr | no | no | no | no | no | no |
| 31 | chr_15_a | 15 | 133625 | 163862 | 184831 | 20.2 | -0.183 | 8 | Arg, Asn, Asp, Glu, His, Lys, Met, Phe | no | no | no | no | no | no |
| 30 | chr_15_b | 15 | 342850 | 388050 | 431300 | 10.1 | 0.116 | 3 | Ala, Pro, Thr | Ac/N-end | no | no | no | no | no |
| 32 | chr_15_c | 15 | 525200 | 561525 | 591775 | 10.6 | 0.128 | 2 | Ser, Thr | Ac/N-end | Ac/N-end | Ac/N-end | no | no | no |
| 33 | chr_15_d | 15 | 518550 | 569750 | 594650 | 8.8 | -0.096 | 1 | Cys | Ac/N-end | Ac/N-end | Ac/N-end | Cys | Cys | Cys |
| 34 | chr_16_a | 16 | 166030 | 194830 | 222070 | 11.6 | 0.121 | 5 | Ala, Gly, Pro, Thr, Val | Ac/N-end | Ac/N-end | Ac/N-end | no | no | no |
| 35 | chr_16_b | 16 | 375050 | 403350 | 428950 | 24.5 | -0.22 | 1 | Pro | Ac/N-end | Ac/N-end | Ac/N-end | Pro | Pro | Pro |
-
Abbreviations: "chr": chromosome, "CI": confidence interval, "RM_AFD": RM allele frequency difference (high – low UPS activity pools)
Generally, altering the significance threshold does not affect the conclusions that at least half of the detected QTLs are specific to an individual N-end Rule pathway and that approximately 10% of QTLs are specific to individual N-degrons. In the revised Results section (pg. 6, para. 3, line 18), the qualitative statement mentioned by the reviewer is replaced with the quantitative information in Author response table 1 for the 4.5 LOD threshold column.
We note that N-end Rule pathway-specificity for 3 QTL regions (IVb, IXa, and XVc) is subject to the following considerations that may not be immediately obvious from reviewing Supplementary file 2.
The Arg/N-end-specific chromosome IVb and IXa QTL regions overlap the leftmost shoulders of QTLs detected with Ac/N-degrons, creating the appearance that these QTLs are not Arg/N-degron-specific when plotted as in Supplementary file 2. However, the peaks of these Arg/N-degron and Ac/N-degron QTLs are not within 100 kb and their confidence intervals do not overlap. We therefore interpret their effects as pathway-specific.
The Ac/N-degron-specific chromosome XVc QTL contains peaks from both glutamate Arg/N-degron replicates. However, the direction of effect of these two peaks is not consistent between replicates (the only such instance in our dataset). Because we could not unambiguously assign a direction of effect for the glutamate N-degron at this region, we do not include it in our set of QTLs and the chromosome XVc region is deemed to be Ac/N-degron-specific. In the revised manuscript, we report the chromosome IVb, IXa, and XVc QTL regions as pathway-specific.
We also note that the pathway-specific QTL regions displayed on pages 7 and 8 (QTL regions containing UBR1) as well as 20 and 21 of Supplementary file 2 are highly overlapping. However, these overlapping regions have opposing directions of effect on the sets of reporters they affect. We, therefore, continue to report these QTL regions as distinct in the revised manuscript, an interpretation supported by our fine-mapping data (see e.g., Figure 3C).
2) You never quantify how much of the total variation your QTL explains.
Our bulk segregant analysis QTL mapping method is based on comparing allele frequencies obtained from whole-genome sequencing pools of cells with extreme phenotypes. The genotypes of individual segregants, which would be needed for calculating explained variance, are not ascertained using this approach. Thus, it is not readily possible to calculate the proportion of variance explained by our QTLs.
3) You never quantify how much of each QTL your identified causal SNPs explain.
Author response table 3 displays the variance in ubiquitin-proteasome system (UPS) activity explained by each tested causal gene allele and variant.
Author response table 3
Variance Explained by Causal Alleles and Variants.
| Gene | Allele | N-degron | Variance Explained |
|---|---|---|---|
| DOA10 | K1012N | Thr | 0.04 |
| DOA10 | Q410E | Thr | 0.075 |
| DOA10 | RM_full | Thr | 0.911 |
| DOA10 | Y1186F | Thr | 0.597 |
| DOA10 | K1012N | Gly | 0.608 |
| DOA10 | Q410E | Gly | 0.74 |
| DOA10 | RM_full | Gly | 0.879 |
| DOA10 | Y1186F | Gly | 0.77 |
| NTA1 | D111E | Asn | 0.204 |
| NTA1 | E129G | Asn | 0.764 |
| NTA1 | RM_full | Asn | 0.789 |
| NTA1 | RM_pr | Asn | -0.014 |
| UBC6 | D229G | Ala | 0.717 |
| UBC6 | RM_full | Ala | 0.666 |
| UBC6 | RM_pr | Ala | -0.027 |
| UBC6 | RM_term | Ala | 0.183 |
| UBC6 | D229G | Thr | 0.762 |
| UBC6 | RM_full | Thr | 0.928 |
| UBC6 | RM_pr | Thr | 0.008 |
| UBC6 | RM_term | Thr | 0.006 |
| UBR1 | RM_causal | Phe | 0.9 |
| UBR1 | RM_full | Phe | 0.917 |
| UBR1 | RM_non | Phe | -0.019 |
| UBR1 | RM_pr | Phe | 0.818 |
| UBR1 | RM_causal | Trp | 0.937 |
| UBR1 | RM_full | Trp | 0.975 |
| UBR1 | RM_non | Trp | 0.059 |
| UBR1 | RM_pr | Trp | 0.934 |
| UBR1 | RM_full | Asn | 0.438 |
| UBR1 | RM_ORF | Asn | 0.134 |
| UBR1 | RM_pr | Asn | -0.012 |
| UBR1 | RM_term | Asn | 0.064 |
| UBR1 | RM_full | Asp | 0.403 |
| UBR1 | RM_ORF | Asp | 0.101 |
| UBR1 | RM_pr | Asp | 0.097 |
| UBR1 | RM_term | Asp | 0.048 |
| UBR1 | RM_full | Phe | 0.866 |
| UBR1 | RM_ORF | Phe | 0.343 |
| UBR1 | RM_pr | Phe | 0.316 |
| UBR1 | RM_term | Phe | -0.031 |
| UBR1 | RM_full | Trp | 0.964 |
| UBR1 | RM_ORF | Trp | 0.813 |
| UBR1 | RM_pr | Trp | 0.928 |
| UBR1 | RM_term | Trp | 0.028 |
We note that these estimates are obtained from experiments in near-isogenic strains that differ only at the tested causal gene allele or variant. The fraction of variance explained is thus inflated relative to what would be observed in the segregant populations used for QTL mapping and should not be used to estimate the variance explained by a QTL region. Therefore, we do not include these estimates in the revised manuscript.
4) When dissecting your UBR1 alleles, would be nice to pay homage to this classic: Laurie-Ahlberg, C. C., and L. F. Stam. 1987. "Use of P-Element-Mediated Transformation to Identify the Molecular Basis of Naturally Occurring Variants Affecting Adh Expression in Drosophila melanogaster." Genetics 115 (1): 129-40.
We thank the reviewer for the suggestion to include this important work on identifying causal variants for enzyme activity in highly polymorphic genomic regions. The work appears as reference 62 (pg. 8, para 3, line 218) in the revised manuscript.
Reviewer #2 (Recommendations for the authors): The only thing I would have appreciated is the validation of some of their findings using orthogonal approaches. There are a lot of readily established biochemical assays they can use to support their claims.
Previously published theoretical and empirical observations have demonstrated that tandem fluorescent timers (TFTs) provide precise and sensitive measures of protein degradation kinetics. In particular, the TFT system has been extensively used to measure differences in the degradation rate of UPS N-end Rule substrates (Khmelinskii et al., 2012, Khmelinskii and Knop, 2014, Kats et al., 2018). Given the well-established validity of the TFT system for measuring N-end Rule activity and the comparatively lower precision, sensitivity, and throughput of conventional biochemical measurements of protein degradation (in particular, pulse-chase Western blotting and cycloheximide chase analysis [Kong et al., 2021]), we argue that further experimentation is not needed to establish the claims made in our work.
Reviewer #3 (Recommendations for the authors):
1. Figure 1 was super helpful in explaining the question and the methods used in this paper.
Thank you!
2. In this sentence, I am not sure that the second portion follows from the first: "These results are consistent with our observation that RM had higher UPS activity for 15 of 20 N-degrons (Figure 1D, Supplementary Table 1), suggesting that the QTLs we have mapped underlie a substantial portion of the heritable UPS activity difference between BY and RM." Maybe you missed the majority of the genetic variation that influences UPS activity, but you got lucky and the portion you detected just happened to be consistent with the overall trend. I think the authors need a different type of analysis to draw a conclusion about whether they sampled "a substantial portion" of heritable differences or whether there is missing heritability here. Can the authors use their data to calculate the narrow sense heritability and then report how much of that heritability is explained by the detected variants?
As noted in our response to Reviewer 1, because of the pooled nature of our genetic mapping method, it is not readily possible to calculate heritability from our QTL mapping data. Author response table 3 presents the variance explained by the tested causal alleles and variants. However, as noted in our response to Reviewer 1, these estimates are inflated because they are derived from near-isogenic cell populations that differ only at the tested alleles / variants. Given these considerations, the second clause in the sentence mentioned by the reviewer has been removed from the revised manuscript.
3. Perhaps reconsider using the term N-degron in the abstract. It's a bit specific. The intro and figures do a great job at defining an N-degron.
The term “N-degron” has been removed from the abstract and replaced with more general terms.
4. I did not know that each of the 20 amino acids is dealt with by one of two UPS systems. This was eventually clear in figure 1B where it seems Trp and Met N-degrons are degraded by different systems. Perhaps make this clearer in the text where N-degrons are described and defined.
We thank the reviewer for this suggestion to improve the manuscript’s clarity. The revised introduction indicates that the N-end Rule contains two distinct targeting complexes when introducing the N-end Rule (pg. 3, para. 2, line 105) and references Figure 1, which illustrates the two pathways of the N-end rule.
5. I was mildly confused by the "italics vs plain" statement in figure 3D. Is it intended for only this panel or for the whole figure, or for the whole paper?
The “italics vs. plain” statement is intended only for panels 3D and 4B/F/J. To improve clarity, we have added additional annotation to these panels.
6. Some of the focus of the manuscript might be shifted away from general "straw man" questions, like whether this trait is mendelian and controlled by large effect variants (intro lines 55 – 66). The discovery of smaller effect variants is presented as a major finding, but it seems obvious that these exist. Perhaps instead focus on a more quantitative analysis of the power of the current study. How much heritability is explained by previously known genes or variants, and how much additional heritability is explained by the previously unknown genes/variants detected here? Even if a heritability analysis is not feasible, it think a shift in focus from a qualitative statement – we detect small effect variants – to a more quantitative or nuanced statement, would be appropriate.
The revised manuscript provides a more nuanced introduction to the genetics of UPS activity, in particular, emphasizing the expectation that UPS activity, like most traits, is genetically complex. We agree with the reviewer that the relative contributions of individual QTLs to the heritability of UPS activity would be an interesting and informative analysis. However, as noted in our response to Reviewer 1, it is not readily feasible to perform such an analysis. Instead, as suggested by the reviewer, several qualitative statements have been replaced by quantitative descriptions. In particular, the qualitative statement mentioned by the reviewer is replaced with a quantitative statement regarding QTL effect sizes (pg. 6, para. 1, line 164).
Reviewer #4 (Recommendations for the authors):
Specific comments:
I'm interested in the overall pattern that BY seems to have systematically lower UPS activity than RM. BY carries a rare allele at 3 out of the 4 examples in Figure S5, which hints that perhaps there has been an adaptation of BY for lower UPS. It would be interesting to explore this hypothesis further, or at least to discuss it. Has there been an overall adaptation for BY to be less transcriptionally active, coupled with lower degradation rates? Perhaps this might be explored using the previous data sets on mRNA in these lines – presumably, changes in transcription under this model could be either cis or trans. (That analysis is distinct from the analysis reported at L312, which focuses on specific trans-effects of the UPS variants.) And perhaps the authors may have other ideas as well to explore the evolutionary questions.
We thank the reviewer for these interesting suggestions, which we have addressed with a series of new analyses. In brief, we did not detect evidence for lineage-specific selection on UPS gene expression using eQTL data or on individual N-end reporters.
To explore whether the consistent differences in UPS activity between the BY and RM strains might reflect adaptive changes in these lineages, we performed several additional analyses. We first applied the sign test (Fraser et al., 2010; https://doi.org/10.1073/pnas.0912245107) to a recent comprehensive BY / RM eQTL mapping dataset, which became available after the original sign test publication. This newer eQTL dataset comprises 36,498 eQTLs mapped for 5,643 genes in a panel of 1,000 recombinant offspring from the BY / RM cross (Albert et al., 2018; https://doi.org/10.7554/eLife.35471). The results of this analysis are presented in Author response table 4. We performed the analysis at 11 different LOD thresholds (ranging from 2.5 to 50) to examine the influence of QTL effect size on the results. Across all genes, we do not find evidence for lineage-specific selection except at LOD thresholds of 40 and 45. Given the large fraction of eQTLs that are excluded at these high thresholds (94.6% and 95.3%), the large fraction of genes excluded (70.5% and 73.8%), and especially the marginally significant p-values (0.038 and 0.026) obtained at these two thresholds, we conclude that there is, at best, limited evidence from the sign test for lineage-specific selection on overall mRNA transcript abundance in the BY / RM cross. Future work is needed to reconcile discrepancies in the results of the sign test as obtained in different eQTL datasets from the same cross.
Author response table 4
Results of the Sign Test for Lineage-Specific Selection Applied to All BY / RM eQTLs.
| LOD | n_eQTLs | n_genes | n_pairs | reinf_BY_up | reinf_RM_up | oppos_BY_up | oppos_RM_up | excess_reinforcing_pairs | chi_sq_p |
|---|---|---|---|---|---|---|---|---|---|
| 2.4 | 36498 | 5643 | 2845 | 627 | 757 | 952 | 509 | –14 | 0.818 |
| 5 | 19694 | 5372 | 2081 | 449 | 577 | 698 | 357 | 19 | 0.701 |
| 10 | 9379 | 4514 | 1124 | 225 | 320 | 404 | 175 | 4.63 | 0.934 |
| 15 | 6125 | 3686 | 745 | 154 | 202 | 279 | 110 | 2.24 | 0.992 |
| 20 | 4452 | 3076 | 480 | 108 | 128 | 179 | 65 | 18.2 | 0.431 |
| 25 | 3458 | 2609 | 336 | 73 | 95 | 127 | 41 | 20.6 | 0.276 |
| 30 | 2788 | 2224 | 230 | 54 | 65 | 85 | 26 | 22.6 | 0.145 |
| 35 | 2310 | 1912 | 178 | 44 | 48 | 68 | 18 | 20 | 0.144 |
| 40 | 1963 | 1664 | 140 | 35 | 41 | 53 | 11 | 24.3 | 0.0375 |
| 45 | 1706 | 1474 | 110 | 28 | 33 | 42 | 7 | 22.9 | 0.0261 |
| 50 | 1475 | 1299 | 85 | 21 | 27 | 31 | 6 | 17.9 | 0.0569 |
Abbreviations: “LOD”: LOD score threshold for calling cis / trans eQTL pairs, "n_eQTLs": number of eQTLs, "n_genes": number of genes with an eQTL, "n_pairs": number of cis / trans eQTL pairs, "reinf_BY_up": number of cis / trans eQTLs where the BY allele of the cis and trans eQTLs increases expression (reinforcing pairs), "reinf_RM_up": number of cis / trans eQTLs where the RM allele of the cis and trans eQTLs increases expression (reinforcing pairs), "oppos_BY_up": number of cis / trans eQTLs where the BY allele of the cis eQTL increases expression and the RM allele of the trans eQTL increases expression (opposing pairs), "oppos_RM_up": number of cis / trans eQTLs where the RM allele of the cis eQTL increases expression and the BY allele of the trans eQTL increases expression (opposing pairs), "excess_reinforcing_pairs", the number of excess reinforcing eQTL pairs calculated as in Fraser et al., 2010, "chi_sq_p": p-value of the chi-square test for enrichment of reinforcing pairs.
As in the original manuscript sign test manuscript, we performed a gene ontology (GO) enrichment analysis on the sets of reinforcing cis / trans eQTL pairs from the set of eQTLs to determine whether such pairs are enriched for UPS genes. We were able to replicate the previously-described enrichment for genes of the ergosterol biosynthesis pathway (Fraser et al., 2010, Author response table 5). However, there was no enrichment for ubiquitin system or proteasome GO terms in the sets of reinforcing eQTL pairs at any of the tested LOD score thresholds (Author response table 5).
Author response table 5
Results of Gene Ontology Enrichment of All cis / trans eQTL pairs.
| GOBPID | p_value | OddsRatio | ExpCount | Count | Term | category | LOD |
|---|---|---|---|---|---|---|---|
| GO:0032197 | 2.8E-05 | 3 | 15.06 | 30 | transposition; RNA-mediated | all_reinforcing | 2.426606803 |
| GO:0015074 | 0.00046 | 3.1 | 9.87 | 20 | DNA integration | all_reinforcing | 2.426606803 |
| GO:0006487 | 0.00077 | 2.7 | 11.6 | 22 | protein N-linked glycosylation | all_reinforcing | 2.426606803 |
| GO:0046513 | 0.0012 | 10.7 | 2.22 | 7 | ceramide biosynthetic process | all_reinforcing | 2.426606803 |
| GO:0006458 | 0.0029 | 3.3 | 6.17 | 13 | 'de novo' protein folding | all_reinforcing | 2.426606803 |
| GO:0018904 | 0.0037 | Inf | 0.99 | 4 | ether metabolic process | all_reinforcing | 2.426606803 |
| GO:0051131 | 0.0039 | 9.2 | 1.97 | 6 | chaperone-mediated protein complex assembly | all_reinforcing | 2.426606803 |
| GO:1901135 | 0.0045 | 1.4 | 92.08 | 114 | carbohydrate derivative metabolic process | all_reinforcing | 2.426606803 |
| GO:0070085 | 0.0063 | 1.8 | 21.23 | 32 | glycosylation | all_reinforcing | 2.426606803 |
| GO:0061077 | 0.0068 | 3.9 | 3.95 | 9 | chaperone-mediated protein folding | all_reinforcing | 2.426606803 |
| GO:0006672 | 0.007 | 5.4 | 2.72 | 7 | ceramide metabolic process | all_reinforcing | 2.426606803 |
| GO:0009101 | 0.007 | 1.8 | 19.75 | 30 | glycoprotein biosynthetic process | all_reinforcing | 2.426606803 |
| GO:0016226 | 0.0089 | 3.1 | 5.43 | 11 | iron-sulfur cluster assembly | all_reinforcing | 2.426606803 |
| GO:0031070 | 0.0093 | 6.1 | 2.22 | 6 | intronic snoRNA processing | all_reinforcing | 2.426606803 |
| GO:0034965 | 0.0093 | 6.1 | 2.22 | 6 | intronic box C/D snoRNA processing | all_reinforcing | 2.426606803 |
| GO:0032197 | 4E-06 | 3.5 | 11.51 | 27 | transposition; RNA-mediated | all_reinforcing | 5 |
| GO:0015074 | 0.00011 | 3.7 | 7.48 | 18 | DNA integration | all_reinforcing | 5 |
| GO:0006458 | 0.001 | 3.9 | 4.79 | 12 | 'de novo' protein folding | all_reinforcing | 5 |
| GO:0061077 | 0.0011 | 5.5 | 3.07 | 9 | chaperone-mediated protein folding | all_reinforcing | 5 |
| GO:0006487 | 0.0013 | 2.7 | 8.82 | 18 | protein N-linked glycosylation | all_reinforcing | 5 |
| GO:0018904 | 0.0013 | Inf | 0.77 | 4 | ether metabolic process | all_reinforcing | 5 |
| GO:0046513 | 0.0024 | 8.5 | 1.73 | 6 | ceramide biosynthetic process | all_reinforcing | 5 |
| GO:0070525 | 0.0024 | 8.5 | 1.73 | 6 | tRNA threonylcarbamoyladenosine metabolic process | all_reinforcing | 5 |
| GO:0051131 | 0.0038 | 10.6 | 1.34 | 5 | chaperone-mediated protein complex assembly | all_reinforcing | 5 |
| GO:0032259 | 0.0045 | 1.8 | 21.29 | 33 | methylation | all_reinforcing | 5 |
| GO:0046165 | 0.0052 | 2.2 | 11.32 | 20 | alcohol biosynthetic process | all_reinforcing | 5 |
| GO:0044281 | 0.0063 | 1.3 | 150.75 | 177 | small molecule metabolic process | all_reinforcing | 5 |
| GO:0006662 | 0.007 | Inf | 0.58 | 3 | glycerol ether metabolic process | all_reinforcing | 5 |
| GO:0002949 | 0.007 | Inf | 0.58 | 3 | tRNA threonylcarbamoyladenosine modification | all_reinforcing | 5 |
| GO:0033215 | 0.007 | Inf | 0.58 | 3 | iron assimilation by reduction and transport | all_reinforcing | 5 |
| GO:0046131 | 0.0083 | 3.8 | 3.26 | 8 | pyrimidine ribonucleoside metabolic process | all_reinforcing | 5 |
| GO:0019509 | 0.0086 | 7.1 | 1.53 | 5 | L-methionine salvage from methylthioadenosine | all_reinforcing | 5 |
| GO:0006694 | 0.0086 | 2.4 | 8.06 | 15 | steroid biosynthetic process | all_reinforcing | 5 |
| GO:0006696 | 0.0089 | 2.7 | 5.95 | 12 | ergosterol biosynthetic process | all_reinforcing | 5 |
| GO:0006672 | 0.0094 | 5.1 | 2.11 | 6 | ceramide metabolic process | all_reinforcing | 5 |
| GO:0019856 | 0.0094 | 5.1 | 2.11 | 6 | pyrimidine nucleobase biosynthetic process | all_reinforcing | 5 |
| GO:1902652 | 0.0098 | 2.5 | 6.71 | 13 | secondary alcohol metabolic process | all_reinforcing | 5 |
| GO:0032197 | 1.5E-06 | 4.5 | 6.44 | 20 | transposition; RNA-mediated | all_reinforcing | 10 |
| GO:0015074 | 7.7E-05 | 4.3 | 4.62 | 14 | DNA integration | all_reinforcing | 10 |
| GO:0018904 | 0.00022 | Inf | 0.49 | 4 | ether metabolic process | all_reinforcing | 10 |
| GO:0006662 | 0.0018 | Inf | 0.36 | 3 | glycerol ether metabolic process | all_reinforcing | 10 |
| GO:0006278 | 0.0021 | 2.7 | 6.8 | 15 | RNA-dependent DNA biosynthetic process | all_reinforcing | 10 |
| GO:1902047 | 0.0022 | 9.1 | 1.09 | 5 | polyamine transmembrane transport | all_reinforcing | 10 |
| GO:0046165 | 0.0041 | 2.6 | 6.56 | 14 | alcohol biosynthetic process | all_reinforcing | 10 |
| GO:0043605 | 0.0056 | 9.7 | 0.85 | 4 | cellular amide catabolic process | all_reinforcing | 10 |
| GO:0019509 | 0.0056 | 9.7 | 0.85 | 4 | L-methionine salvage from methylthioadenosine | all_reinforcing | 10 |
| GO:0072488 | 0.006 | 4.9 | 1.82 | 6 | ammonium transmembrane transport | all_reinforcing | 10 |
| GO:0015846 | 0.0064 | 6.1 | 1.34 | 5 | polyamine transport | all_reinforcing | 10 |
| GO:0006833 | 0.0065 | 21.8 | 0.49 | 3 | water transport | all_reinforcing | 10 |
| GO:0042044 | 0.0065 | 21.8 | 0.49 | 3 | fluid transport | all_reinforcing | 10 |
| GO:1902652 | 0.007 | 2.9 | 4.25 | 10 | secondary alcohol metabolic process | all_reinforcing | 10 |
| GO:0002098 | 0.007 | 3.9 | 2.43 | 7 | tRNA wobble uridine modification | all_reinforcing | 10 |
| GO:0006400 | 0.008 | 2.3 | 7.05 | 14 | tRNA modification | all_reinforcing | 10 |
| GO:0009067 | 0.0086 | 2.5 | 5.71 | 12 | aspartate family amino acid biosynthetic process | all_reinforcing | 10 |
| GO:0006696 | 0.0092 | 3 | 3.77 | 9 | ergosterol biosynthetic process | all_reinforcing | 10 |
| GO:0006694 | 0.0096 | 2.6 | 5.1 | 11 | steroid biosynthetic process | all_reinforcing | 10 |
| GO:0034220 | 0.0096 | 1.6 | 25.27 | 37 | ion transmembrane transport | all_reinforcing | 10 |
| GO:0032259 | 0.01 | 1.9 | 11.66 | 20 | methylation | all_reinforcing | 10 |
| GO:0015074 | 3.3E-05 | 5 | 3.71 | 13 | DNA integration | all_reinforcing | 15 |
| GO:0032197 | 6.2E-05 | 4 | 4.98 | 15 | transposition; RNA-mediated | all_reinforcing | 15 |
| GO:0046165 | 9.3E-05 | 4 | 4.59 | 14 | alcohol biosynthetic process | all_reinforcing | 15 |
| GO:0006278 | 0.00031 | 3.5 | 5.07 | 14 | RNA-dependent DNA biosynthetic process | all_reinforcing | 15 |
| GO:1902652 | 0.0011 | 3.9 | 3.32 | 10 | secondary alcohol metabolic process | all_reinforcing | 15 |
| GO:0019509 | 0.0011 | 18.7 | 0.59 | 4 | L-methionine salvage from methylthioadenosine | all_reinforcing | 15 |
| GO:0070525 | 0.0011 | 18.7 | 0.59 | 4 | tRNA threonylcarbamoyladenosine metabolic process | all_reinforcing | 15 |
| GO:0006696 | 0.0016 | 4 | 2.93 | 9 | ergosterol biosynthetic process | all_reinforcing | 15 |
| GO:0009086 | 0.0016 | 4 | 2.93 | 9 | methionine biosynthetic process | all_reinforcing | 15 |
| GO:0071267 | 0.0025 | 12.5 | 0.68 | 4 | L-methionine salvage | all_reinforcing | 15 |
| GO:0043102 | 0.0025 | 12.5 | 0.68 | 4 | amino acid salvage | all_reinforcing | 15 |
| GO:0043605 | 0.0025 | 12.5 | 0.68 | 4 | cellular amide catabolic process | all_reinforcing | 15 |
| GO:0016128 | 0.0033 | 3.5 | 3.22 | 9 | phytosteroid metabolic process | all_reinforcing | 15 |
| GO:0006811 | 0.0034 | 1.7 | 27.81 | 42 | ion transport | all_reinforcing | 15 |
| GO:0070900 | 0.0034 | 28 | 0.39 | 3 | mitochondrial tRNA modification | all_reinforcing | 15 |
| GO:1900864 | 0.0034 | 28 | 0.39 | 3 | mitochondrial RNA modification | all_reinforcing | 15 |
| GO:0006694 | 0.0049 | 3 | 4 | 10 | steroid biosynthetic process | all_reinforcing | 15 |
| GO:0009066 | 0.005 | 2.6 | 5.95 | 13 | aspartate family amino acid metabolic process | all_reinforcing | 15 |
| GO:0044107 | 0.0051 | 3.3 | 3.42 | 9 | cellular alcohol metabolic process | all_reinforcing | 15 |
| GO:0016125 | 0.0063 | 2.7 | 4.78 | 11 | sterol metabolic process | all_reinforcing | 15 |
| GO:1902047 | 0.0075 | 7.5 | 0.88 | 4 | polyamine transmembrane transport | all_reinforcing | 15 |
| GO:0006531 | 0.0079 | 14 | 0.49 | 3 | aspartate metabolic process | all_reinforcing | 15 |
| GO:0090646 | 0.0079 | 14 | 0.49 | 3 | mitochondrial tRNA processing | all_reinforcing | 15 |
| GO:0015804 | 0.0082 | 5.2 | 1.37 | 5 | neutral amino acid transport | all_reinforcing | 15 |
| GO:0016226 | 0.0082 | 5.2 | 1.37 | 5 | iron-sulfur cluster assembly | all_reinforcing | 15 |
| GO:0098655 | 0.0093 | 1.9 | 12.29 | 21 | cation transmembrane transport | all_reinforcing | 15 |
| GO:0015840 | 0.0095 | Inf | 0.2 | 2 | urea transport | all_reinforcing | 15 |
| GO:0034311 | 0.0095 | Inf | 0.2 | 2 | diol metabolic process | all_reinforcing | 15 |
| GO:0034312 | 0.0095 | Inf | 0.2 | 2 | diol biosynthetic process | all_reinforcing | 15 |
| GO:0019755 | 0.0095 | Inf | 0.2 | 2 | one-carbon compound transport | all_reinforcing | 15 |
| GO:0042883 | 0.0095 | Inf | 0.2 | 2 | cysteine transport | all_reinforcing | 15 |
| GO:0090502 | 0.0096 | 2.2 | 7.12 | 14 | RNA phosphodiester bond hydrolysis; endonucleolytic | all_reinforcing | 15 |
| GO:0015074 | 1.8E-06 | 6.8 | 2.87 | 13 | DNA integration | all_reinforcing | 20 |
| GO:0032197 | 2.8E-06 | 5.4 | 3.88 | 15 | transposition; RNA-mediated | all_reinforcing | 20 |
| GO:0006278 | 4.4E-05 | 4.6 | 3.73 | 13 | RNA-dependent DNA biosynthetic process | all_reinforcing | 20 |
| GO:0070525 | 0.00047 | 24.2 | 0.47 | 4 | tRNA threonylcarbamoyladenosine metabolic process | all_reinforcing | 20 |
| GO:0090502 | 0.0006 | 3.3 | 4.73 | 13 | RNA phosphodiester bond hydrolysis; endonucleolytic | all_reinforcing | 20 |
| GO:0034654 | 0.0017 | 1.6 | 41.44 | 59 | nucleobase-containing compound biosynthetic process | all_reinforcing | 20 |
| GO:0006551 | 0.0017 | 36.1 | 0.31 | 3 | leucine metabolic process | all_reinforcing | 20 |
| GO:0070900 | 0.0017 | 36.1 | 0.31 | 3 | mitochondrial tRNA modification | all_reinforcing | 20 |
| GO:1900864 | 0.0017 | 36.1 | 0.31 | 3 | mitochondrial RNA modification | all_reinforcing | 20 |
| GO:0015804 | 0.0021 | 7.6 | 1.01 | 5 | neutral amino acid transport | all_reinforcing | 20 |
| GO:0016226 | 0.0021 | 7.6 | 1.01 | 5 | iron-sulfur cluster assembly | all_reinforcing | 20 |
| GO:0001302 | 0.0029 | 3.9 | 2.56 | 8 | replicative cell aging | all_reinforcing | 20 |
| GO:0044249 | 0.0039 | 1.5 | 91.27 | 111 | cellular biosynthetic process | all_reinforcing | 20 |
| GO:1901576 | 0.004 | 1.5 | 92.28 | 112 | organic substance biosynthetic process | all_reinforcing | 20 |
| GO:0090646 | 0.0041 | 18 | 0.39 | 3 | mitochondrial tRNA processing | all_reinforcing | 20 |
| GO:0009083 | 0.0041 | 18 | 0.39 | 3 | branched-chain amino acid catabolic process | all_reinforcing | 20 |
| GO:0006310 | 0.005 | 2.2 | 8.69 | 17 | DNA recombination | all_reinforcing | 20 |
| GO:0015840 | 0.006 | Inf | 0.16 | 2 | urea transport | all_reinforcing | 20 |
| GO:0019755 | 0.006 | Inf | 0.16 | 2 | one-carbon compound transport | all_reinforcing | 20 |
| GO:0042883 | 0.006 | Inf | 0.16 | 2 | cysteine transport | all_reinforcing | 20 |
| GO:0043605 | 0.0077 | 12 | 0.47 | 3 | cellular amide catabolic process | all_reinforcing | 20 |
| GO:0019509 | 0.0077 | 12 | 0.47 | 3 | L-methionine salvage from methylthioadenosine | all_reinforcing | 20 |
| GO:0070880 | 0.0077 | 12 | 0.47 | 3 | fungal-type cell wall beta-glucan biosynthetic process | all_reinforcing | 20 |
| GO:0070879 | 0.0077 | 12 | 0.47 | 3 | fungal-type cell wall beta-glucan metabolic process | all_reinforcing | 20 |
| GO:0044283 | 0.0098 | 1.7 | 21.19 | 32 | small molecule biosynthetic process | all_reinforcing | 20 |
| GO:0015074 | 1.7E-06 | 7.4 | 2.4 | 12 | DNA integration | all_reinforcing | 25 |
| GO:0006278 | 1.7E-05 | 5.6 | 2.92 | 12 | RNA-dependent DNA biosynthetic process | all_reinforcing | 25 |
| GO:0032197 | 2.7E-05 | 5.2 | 3.05 | 12 | transposition; RNA-mediated | all_reinforcing | 25 |
| GO:0090502 | 9.7E-05 | 4.5 | 3.44 | 12 | RNA phosphodiester bond hydrolysis; endonucleolytic | all_reinforcing | 25 |
| GO:0034654 | 0.0014 | 1.8 | 29.54 | 45 | nucleobase-containing compound biosynthetic process | all_reinforcing | 25 |
| GO:0001302 | 0.002 | 4.7 | 1.88 | 7 | replicative cell aging | all_reinforcing | 25 |
| GO:0044249 | 0.003 | 1.6 | 64.61 | 82 | cellular biosynthetic process | all_reinforcing | 25 |
| GO:0015804 | 0.0039 | 8.4 | 0.71 | 4 | neutral amino acid transport | all_reinforcing | 25 |
| GO:0006310 | 0.004 | 2.5 | 6.43 | 14 | DNA recombination | all_reinforcing | 25 |
| GO:1901576 | 0.004 | 1.6 | 65.19 | 82 | organic substance biosynthetic process | all_reinforcing | 25 |
| GO:0015840 | 0.0042 | Inf | 0.13 | 2 | urea transport | all_reinforcing | 25 |
| GO:0019755 | 0.0042 | Inf | 0.13 | 2 | one-carbon compound transport | all_reinforcing | 25 |
| GO:0070525 | 0.0046 | 14.6 | 0.39 | 3 | tRNA threonylcarbamoyladenosine metabolic process | all_reinforcing | 25 |
| GO:0007568 | 0.0063 | 3.3 | 2.86 | 8 | aging | all_reinforcing | 25 |
| GO:0090305 | 0.0087 | 2.3 | 6.3 | 13 | nucleic acid phosphodiester bond hydrolysis | all_reinforcing | 25 |
| GO:0006696 | 0.0093 | 3.9 | 1.88 | 6 | ergosterol biosynthetic process | all_reinforcing | 25 |
| GO:0015074 | 2E-07 | 9.3 | 1.99 | 12 | DNA integration | all_reinforcing | 30 |
| GO:0006278 | 1.6E-06 | 7.2 | 2.37 | 12 | RNA-dependent DNA biosynthetic process | all_reinforcing | 30 |
| GO:0032197 | 3.5E-06 | 6.6 | 2.53 | 12 | transposition; RNA-mediated | all_reinforcing | 30 |
| GO:0090502 | 4.5E-06 | 6.4 | 2.58 | 12 | RNA phosphodiester bond hydrolysis; endonucleolytic | all_reinforcing | 30 |
| GO:0006310 | 0.00028 | 3.4 | 4.95 | 14 | DNA recombination | all_reinforcing | 30 |
| GO:0090305 | 0.0019 | 3 | 4.68 | 12 | nucleic acid phosphodiester bond hydrolysis | all_reinforcing | 30 |
| GO:1902047 | 0.0045 | 13.5 | 0.38 | 3 | polyamine transmembrane transport | all_reinforcing | 30 |
| GO:0044249 | 0.0046 | 1.7 | 45 | 59 | cellular biosynthetic process | all_reinforcing | 30 |
| GO:0034654 | 0.0047 | 1.8 | 20.59 | 32 | nucleobase-containing compound biosynthetic process | all_reinforcing | 30 |
| GO:1901576 | 0.0059 | 1.6 | 45.43 | 59 | organic substance biosynthetic process | all_reinforcing | 30 |
| GO:0015846 | 0.007 | 10.8 | 0.43 | 3 | polyamine transport | all_reinforcing | 30 |
| GO:1903008 | 0.0092 | 4.6 | 1.34 | 5 | organelle disassembly | all_reinforcing | 30 |
| GO:0015074 | 3.7E-08 | 11.2 | 1.74 | 12 | DNA integration | all_reinforcing | 35 |
| GO:0032197 | 4.5E-07 | 8.4 | 2.12 | 12 | transposition; RNA-mediated | all_reinforcing | 35 |
| GO:0006278 | 4.5E-07 | 8.4 | 2.12 | 12 | RNA-dependent DNA biosynthetic process | all_reinforcing | 35 |
| GO:0090502 | 5.9E-07 | 8.1 | 2.17 | 12 | RNA phosphodiester bond hydrolysis; endonucleolytic | all_reinforcing | 35 |
| GO:0006310 | 0.00012 | 4 | 4.05 | 13 | DNA recombination | all_reinforcing | 35 |
| GO:0090305 | 0.00021 | 4 | 3.71 | 12 | nucleic acid phosphodiester bond hydrolysis | all_reinforcing | 35 |
| GO:0044249 | 0.00062 | 2.1 | 34.67 | 50 | cellular biosynthetic process | all_reinforcing | 35 |
| GO:0034654 | 0.00077 | 2.3 | 15.62 | 28 | nucleobase-containing compound biosynthetic process | all_reinforcing | 35 |
| GO:1901576 | 0.0008 | 2 | 35.01 | 50 | organic substance biosynthetic process | all_reinforcing | 35 |
| GO:1902047 | 0.0033 | 15.3 | 0.34 | 3 | polyamine transmembrane transport | all_reinforcing | 35 |
| GO:0015846 | 0.0051 | 12.2 | 0.39 | 3 | polyamine transport | all_reinforcing | 35 |
| GO:0043457 | 0.0067 | 40.3 | 0.14 | 2 | regulation of cellular respiration | all_reinforcing | 35 |
| GO:0006696 | 0.0095 | 4.5 | 1.35 | 5 | ergosterol biosynthetic process | all_reinforcing | 35 |
| GO:0015074 | 1.8E-08 | 12.2 | 1.64 | 12 | DNA integration | all_reinforcing | 40 |
| GO:0090502 | 1.7E-07 | 9.4 | 1.96 | 12 | RNA phosphodiester bond hydrolysis; endonucleolytic | all_reinforcing | 40 |
| GO:0032197 | 2.2E-07 | 9.1 | 2.01 | 12 | transposition; RNA-mediated | all_reinforcing | 40 |
| GO:0006278 | 2.2E-07 | 9.1 | 2.01 | 12 | RNA-dependent DNA biosynthetic process | all_reinforcing | 40 |
| GO:0006310 | 3.1E-05 | 4.8 | 3.61 | 13 | DNA recombination | all_reinforcing | 40 |
| GO:0090305 | 6.7E-05 | 4.7 | 3.33 | 12 | nucleic acid phosphodiester bond hydrolysis | all_reinforcing | 40 |
| GO:0015846 | 0.0017 | 21.7 | 0.27 | 3 | polyamine transport | all_reinforcing | 40 |
| GO:1902047 | 0.0017 | 21.7 | 0.27 | 3 | polyamine transmembrane transport | all_reinforcing | 40 |
| GO:0044249 | 0.0027 | 2 | 28.87 | 41 | cellular biosynthetic process | all_reinforcing | 40 |
| GO:0034654 | 0.0053 | 2.1 | 12.88 | 22 | nucleobase-containing compound biosynthetic process | all_reinforcing | 40 |
| GO:0008610 | 0.0063 | 3.1 | 3.47 | 9 | lipid biosynthetic process | all_reinforcing | 40 |
| GO:0006696 | 0.0064 | 5 | 1.23 | 5 | ergosterol biosynthetic process | all_reinforcing | 40 |
| GO:0015804 | 0.0087 | 9.3 | 0.46 | 3 | neutral amino acid transport | all_reinforcing | 40 |
| GO:0015074 | 6.3E-08 | 12.3 | 1.5 | 11 | DNA integration | all_reinforcing | 45 |
| GO:0090502 | 3.7E-07 | 9.9 | 1.7 | 11 | RNA phosphodiester bond hydrolysis; endonucleolytic | all_reinforcing | 45 |
| GO:0006278 | 3.7E-07 | 9.9 | 1.7 | 11 | RNA-dependent DNA biosynthetic process | all_reinforcing | 45 |
| GO:0032197 | 6.3E-07 | 9.3 | 1.8 | 11 | transposition; RNA-mediated | all_reinforcing | 45 |
| GO:0006310 | 2.8E-05 | 5.3 | 3.1 | 12 | DNA recombination | all_reinforcing | 45 |
| GO:0090305 | 7.6E-05 | 5.1 | 2.9 | 11 | nucleic acid phosphodiester bond hydrolysis | all_reinforcing | 45 |
| GO:0044249 | 0.00039 | 2.5 | 22.9 | 36 | cellular biosynthetic process | all_reinforcing | 45 |
| GO:1901576 | 0.0005 | 2.5 | 23.2 | 36 | organic substance biosynthetic process | all_reinforcing | 45 |
| GO:1901360 | 0.0018 | 2.2 | 20.7 | 32 | organic cyclic compound metabolic process | all_reinforcing | 45 |
| GO:0034654 | 0.0024 | 2.4 | 10 | 19 | nucleobase-containing compound biosynthetic process | all_reinforcing | 45 |
| GO:0006696 | 0.0029 | 6.2 | 1 | 5 | ergosterol biosynthetic process | all_reinforcing | 45 |
| GO:0016128 | 0.0048 | 5.4 | 1.2 | 5 | phytosteroid metabolic process | all_reinforcing | 45 |
| GO:0044107 | 0.0056 | 5.2 | 1.2 | 5 | cellular alcohol metabolic process | all_reinforcing | 45 |
| GO:1902652 | 0.0056 | 5.2 | 1.2 | 5 | secondary alcohol metabolic process | all_reinforcing | 45 |
| GO:0055114 | 0.0075 | 2.4 | 7.1 | 14 | oxidation-reduction process | all_reinforcing | 45 |
| GO:0006694 | 0.0075 | 4.8 | 1.3 | 5 | steroid biosynthetic process | all_reinforcing | 45 |
| GO:0046165 | 0.0087 | 4.6 | 1.3 | 5 | alcohol biosynthetic process | all_reinforcing | 45 |
| GO:0006644 | 0.0099 | 4.4 | 1.4 | 5 | phospholipid metabolic process | all_reinforcing | 45 |
| GO:0015074 | 2.5E-05 | 8.8 | 1.32 | 8 | DNA integration | all_reinforcing | 50 |
| GO:0006278 | 5.6E-05 | 7.7 | 1.47 | 8 | RNA-dependent DNA biosynthetic process | all_reinforcing | 50 |
| GO:0090502 | 6.8E-05 | 7.5 | 1.5 | 8 | RNA phosphodiester bond hydrolysis; endonucleolytic | all_reinforcing | 50 |
| GO:0032197 | 0.00012 | 6.8 | 1.61 | 8 | transposition; RNA-mediated | all_reinforcing | 50 |
| GO:0006310 | 0.00052 | 4.7 | 2.49 | 9 | DNA recombination | all_reinforcing | 50 |
| GO:0006696 | 0.0011 | 8.1 | 0.84 | 5 | ergosterol biosynthetic process | all_reinforcing | 50 |
| GO:0016128 | 0.002 | 6.9 | 0.95 | 5 | phytosteroid metabolic process | all_reinforcing | 50 |
| GO:0090305 | 0.002 | 4.2 | 2.42 | 8 | nucleic acid phosphodiester bond hydrolysis | all_reinforcing | 50 |
| GO:0044107 | 0.0023 | 6.6 | 0.99 | 5 | cellular alcohol metabolic process | all_reinforcing | 50 |
| GO:1902652 | 0.0023 | 6.6 | 0.99 | 5 | secondary alcohol metabolic process | all_reinforcing | 50 |
| GO:0006694 | 0.0033 | 6 | 1.06 | 5 | steroid biosynthetic process | all_reinforcing | 50 |
| GO:0046165 | 0.0038 | 5.8 | 1.1 | 5 | alcohol biosynthetic process | all_reinforcing | 50 |
| GO:0016125 | 0.0075 | 4.8 | 1.28 | 5 | sterol metabolic process | all_reinforcing | 50 |
| GO:1901362 | 0.0094 | 2.4 | 8.21 | 15 | organic cyclic compound biosynthetic process | all_reinforcing | 50 |
Abbreviations: "GOBPID": gene ontology biological process ID, "ExpCount": expected number of genes for a given GOBPID, "LOD": LOD score threshold for including a gene with a cis / trans eQTL pair.
Because the results of our GO enrichment could be affected by the reference gene set (the list of all genes with at least one cis and one trans eQTL), we devised a complementary strategy to test for lineage-specific selection on UPS gene expression. Using the same set of BY / RM eQTLs, we applied the sign test to the sets of UPS genes, proteasome genes, ubiquitin system genes, E3 ligases, and proteasome chaperone genes. We did not detect lineage-specific selection in any of these gene sets (Author response table 6).
Author response table 6
Results of the Sign Test for Lineage-Specific Selection Applied to UPS Gene BY / RM eQTLs.
| LOD | n_eQTLs | n_genes | n_pairs | reinf_by_up | reinf_rm_up | oppos_by_up | oppos_rm_up | excess_reinforcing_pairs | chi_sq_p | gene_set |
|---|---|---|---|---|---|---|---|---|---|---|
| 2.4 | 1128 | 186 | 95 | 16 | 30 | 29 | 20 | –4.21 | 0.815 | all_UPS_genes |
| 5 | 587 | 176 | 72 | 13 | 23 | 23 | 13 | 0 | 1 | all_UPS_genes |
| 10 | 250 | 142 | 29 | 2 | 12 | 8 | 7 | –4.41 | 0.428 | all_UPS_genes |
| 15 | 162 | 105 | 19 | 1 | 8 | 7 | 3 | –2.74 | 0.619 | all_UPS_genes |
| 20 | 115 | 85 | 10 | 0 | 4 | 4 | 2 | –3.2 | 0.472 | all_UPS_genes |
| 25 | 90 | 72 | 8 | 0 | 3 | 3 | 2 | -3 | 0.475 | all_UPS_genes |
| 30 | 63 | 56 | 5 | 0 | 2 | 2 | 1 | –1.6 | 1 | all_UPS_genes |
| 35 | 52 | 47 | 4 | 0 | 1 | 2 | 1 | -2 | 1 | all_UPS_genes |
| 40 | 37 | 34 | 3 | 0 | 1 | 2 | 0 | 0 | NaN | all_UPS_genes |
| 45 | 32 | 30 | 2 | 0 | 1 | 1 | 0 | 0 | NaN | all_UPS_genes |
| 2.4 | 242 | 33 | 14 | 3 | 3 | 2 | 6 | –0.857 | 1 | proteasome_genes |
| 5 | 146 | 32 | 12 | 3 | 2 | 2 | 5 | –1.33 | 1 | proteasome_genes |
| 10 | 62 | 30 | 4 | 0 | 0 | 0 | 4 | 0 | NaN | proteasome_genes |
| 15 | 32 | 19 | 2 | 0 | 0 | 0 | 2 | 0 | NaN | proteasome_genes |
| 20 | 18 | 14 | 1 | 0 | 0 | 0 | 1 | 0 | NaN | proteasome_genes |
| 25 | 11 | 9 | 1 | 0 | 0 | 0 | 1 | 0 | NaN | proteasome_genes |
| 2.4 | 829 | 145 | 76 | 13 | 23 | 25 | 15 | -4 | 0.812 | ubiquitin_system_genes |
| 5 | 410 | 137 | 57 | 10 | 18 | 20 | 9 | 0 | 1 | ubiquitin_system_genes |
| 10 | 173 | 105 | 24 | 2 | 11 | 7 | 4 | -1 | 1 | ubiquitin_system_genes |
| 15 | 118 | 80 | 17 | 1 | 7 | 7 | 2 | –1.65 | 1 | ubiquitin_system_genes |
| 20 | 88 | 65 | 8 | 0 | 3 | 4 | 1 | -2 | 1 | ubiquitin_system_genes |
| 25 | 73 | 58 | 6 | 0 | 2 | 3 | 1 | -2 | 1 | ubiquitin_system_genes |
| 30 | 54 | 48 | 4 | 0 | 1 | 2 | 1 | -2 | 1 | ubiquitin_system_genes |
| 35 | 44 | 40 | 3 | 0 | 0 | 2 | 1 | –2.67 | 0.324 | ubiquitin_system_genes |
| 40 | 31 | 29 | 2 | 0 | 0 | 2 | 0 | 0 | NaN | ubiquitin_system_genes |
| 45 | 26 | 25 | 1 | 0 | 0 | 1 | 0 | 0 | NaN | ubiquitin_system_genes |
| 2.4 | 618 | 111 | 56 | 11 | 16 | 19 | 10 | -1 | 1 | E3_ligase_genes |
| 5 | 300 | 103 | 39 | 8 | 12 | 14 | 5 | 2.67 | 0.909 | E3_ligase_genes |
| 10 | 129 | 79 | 15 | 2 | 7 | 4 | 2 | 1.6 | 1 | E3_ligase_genes |
| 15 | 83 | 56 | 9 | 1 | 4 | 4 | 0 | 1.78 | 1 | E3_ligase_genes |
| 20 | 64 | 46 | 5 | 0 | 2 | 3 | 0 | 0 | NaN | E3_ligase_genes |
| 25 | 49 | 39 | 3 | 0 | 1 | 2 | 0 | 0 | NaN | E3_ligase_genes |
| 30 | 37 | 33 | 3 | 0 | 1 | 2 | 0 | 0 | NaN | E3_ligase_genes |
| 35 | 30 | 28 | 2 | 0 | 0 | 2 | 0 | 0 | NaN | E3_ligase_genes |
| 40 | 22 | 20 | 2 | 0 | 0 | 2 | 0 | 0 | NaN | E3_ligase_genes |
| 45 | 18 | 17 | 1 | 0 | 0 | 1 | 0 | 0 | NaN | E3_ligase_genes |
| 2.4 | 57 | 9 | 6 | 0 | 4 | 2 | 0 | 0 | NaN | proteasome_chaperone_genes |
| 5 | 31 | 8 | 4 | 0 | 3 | 1 | 0 | 0 | NaN | proteasome_chaperone_genes |
| 10 | 15 | 8 | 2 | 0 | 1 | 1 | 0 | 0 | NaN | proteasome_chaperone_genes |
| 15 | 12 | 7 | 1 | 0 | 1 | 0 | 0 | 0 | NaN | proteasome_chaperone_genes |
| 20 | 9 | 6 | 1 | 0 | 1 | 0 | 0 | 0 | NaN | proteasome_chaperone_genes |
| 25 | 6 | 5 | 1 | 0 | 1 | 0 | 0 | 0 | NaN | proteasome_chaperone_genes |
| 30 | 5 | 4 | 1 | 0 | 1 | 0 | 0 | 0 | NaN | proteasome_chaperone_genes |
| 35 | 4 | 3 | 1 | 0 | 1 | 0 | 0 | 0 | NaN | proteasome_chaperone_genes |
| 40 | 4 | 3 | 1 | 0 | 1 | 0 | 0 | 0 | NaN | proteasome_chaperone_genes |
| 45 | 4 | 3 | 1 | 0 | 1 | 0 | 0 | 0 | NaN | proteasome_chaperone_genes |
Abbreviations: “LOD”: LOD score threshold for calling cis / trans eQTL pairs, "n_eQTLs": number of eQTLs, "n_genes": number of genes with an eQTL, "n_pairs": number of cis / trans eQTL pairs, "reinf_BY_up": number of cis / trans eQTLs where the BY allele of the cis and trans eQTLs increases expression (reinforcing pairs), "reinf_RM_up": number of cis / trans eQTLs where the RM allele of the cis and trans eQTLs increases expression (reinforcing pairs), "oppos_BY_up": number of cis / trans eQTLs where the BY allele of the cis eQTL increases expression and the RM allele of the trans eQTL increases expression (opposing pairs), "oppos_RM_up": number of cis / trans eQTLs where the RM allele of the cis eQTL increases expression and the BY allele of the trans eQTL increases expression (opposing pairs), "excess reinforcing pairs" the number of excess reinforcing pairs, calculated as in Fraser et al., 2010, "chi_sq_p": p-value of the chi-square test for enrichment of reinforcing pairs.
Although we did not detect lineage-specific selection on global or UPS gene mRNA abundance, we note that these analyses do not detect lineage-specific selection on factors other than transcript abundance. For example, lineage-specific selection may occur through causal missense variants, such as the ones we identified here. For example, the DOA10 and NTA1 genes each contain multiple causal missense variants that alter UPS activity, but neither gene's transcript abundance is affected by a local eQTL. Integration of the effects of missense variants with those that alter gene expression in selection tests remains an interesting avenue for future work.
We note that the significant excess of UPS QTLs at which the RM allele increases UPS activity (pg. 6, para. 2, line 170) provides evidence that N-end Rule activity could have been subject to lineage-specific selection. To test whether this result was due to a strong enrichment of RM alleles at certain individual reporters, we applied this analysis to the sets of QTLs obtained for the 20 individual N-degrons. We did not detect an enrichment of any of the individual N-degrons, suggesting that the enrichment of RM QTLs that increase UPS activity is a general effect (Author response table 7).
Author response table 7
Results of Binomial Enrichment Test Applied to QTLs for Individual N-degrons.
| N-degron | N_QTLs | N_RM_up | N_BY_up | p_value |
|---|---|---|---|---|
| Ala | 15 | 10 | 5 | 0.30 |
| Arg | 7 | 4 | 3 | 1.00 |
| Asn | 7 | 3 | 4 | 1.00 |
| Asp | 8 | 5 | 3 | 0.73 |
| Cys | 9 | 4 | 5 | 1.00 |
| Gln | 3 | 2 | 1 | 1.00 |
| Glu | 4 | 2 | 2 | 1.00 |
| Gly | 9 | 5 | 4 | 1.00 |
| His | 9 | 6 | 3 | 0.51 |
| Ile | 1 | 1 | 0 | 1.00 |
| Leu | 2 | 1 | 1 | 1.00 |
| Lys | 7 | 5 | 2 | 0.45 |
| Met | 4 | 1 | 3 | 0.63 |
| Phe | 10 | 6 | 4 | 0.75 |
| Pro | 13 | 8 | 5 | 0.58 |
| Ser | 9 | 6 | 3 | 0.51 |
| Thr | 12 | 8 | 4 | 0.39 |
| Trp | 6 | 4 | 2 | 0.69 |
| Tyr | 7 | 4 | 3 | 1.00 |
| Val | 7 | 4 | 3 | 1.00 |
Abbreviations: "N_QTLs": Number of QTLs for the indicated N-degron, "N_RM_up": Number of QTLs where the RM allele increases UPS activity for the indicated N-degron, "N_BY_up": Number of QTLs where the BY allele increases UPS activity for the indicated N-degron. "p_value": p-value of the binomial test for the set of QTLs for the indicated N-degron.
The paper reports 149 loci, but if I am reading this correctly it looks like this may double-count shared loci. It would be nice to discuss a bit more about likely sharing (ie pleiotropy) of the hits. (It's also a bit hard to see from 2B which of these are likely shared.)
The reviewer is correct. As described in our response to Reviewer 1, the revised manuscript now indicates that the 149 instances of QTL detection correspond to 35 distinct QTL regions (pg. 6, para. 3, line 185). Figure 2—figure supplement 2 provides detailed information on these regions, including which reporters each region affects. The revised manuscript includes an extended discussion of pleiotropy among the set of N-end Rule QTLs (pg. 6, para. 3).
L143: it should be possible to make this statement quantitative.
As noted in our response to Reviewer 1, it is not readily possible to calculate the amount of variance explained by each QTL due to the pooled nature of our bulk segregant analysis QTL mapping method. Accordingly, we have removed the statement mentioned by the reviewer from the revised Results section.
Para 303, 312: It seems likely that you may be looking for an effect that is small at individual genes but widespread. I would suggest looking more carefully at the overall distribution: eg in the protein data is there an upward shift in the mean? You could also use a more sophisticated method like ashR to study the distribution of changes.
We appreciate the reviewer’s suggestion, which we suspect may have been prompted by our wording of the following sentence from the Results section (page 23, paragraph 2, lines 307-310 of the original manuscript):
“This result is consistent with recent observations that suggest that altering UBR1 expression exerts broad effects on protein degradation or related processes controlling protein abundance and that protein sequences, rather than function or subcellular localization, are the primary determinants of degradation rates.”
Our intent was to convey that substrates of E3 ligases such as Ubr1 are more likely to share sequence features than they are to share a function or subcellular localization. In other words, E3 ligases typically target sets of proteins that are functionally diverse but that share common sequence features, e.g., an N-degron. The wording of this sentence may have unintentionally suggested that the causal UBR1 promoter variant should affect the abundance of many proteins. However, E3 ligases influence the abundance of distinct sets of dozens to several hundred proteins (Kong et al., 2021, Christiano et al., 2020). The moderate effect of the causal UBR1 promoter variant on UBR1 expression is, therefore, not expected to create widespread effects on the proteome but instead to affect a small subset of Ubr1 substrates and related proteins. We have revised this section to more clearly articulate these ideas. We have also re-analysed our data as described below.
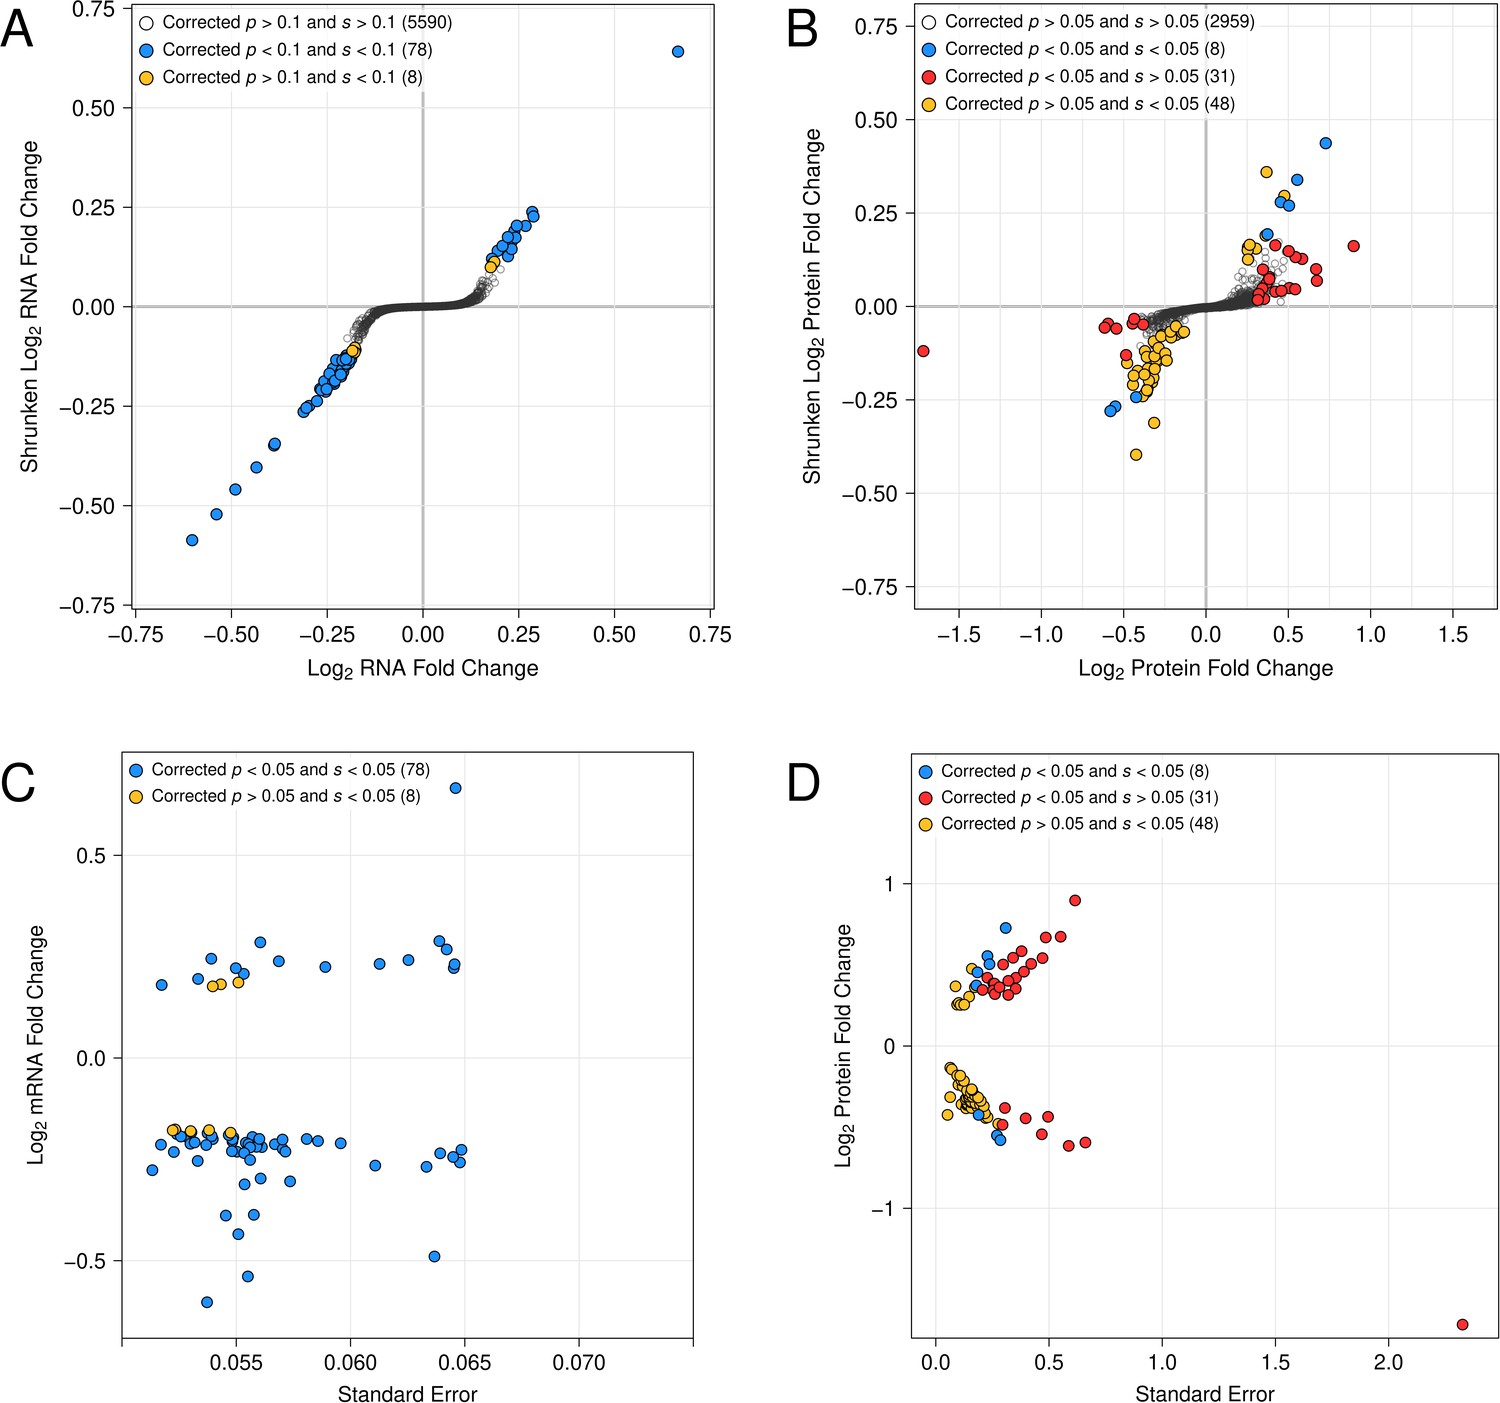
The causal UBR1 variant significantly altered the abundance of 39 of 3,047 detected proteins at a 0.1 false discovery rate (FDR) threshold. Following the reviewer’s suggestion, we computed the overall median log2 fold change and found that it was -0.012 for all 3,047 detected proteins (that is, very close to zero) and 0.37 for the set of 39 differentially abundant proteins (that is, an average increase for proteins with significantly different abundance). The number of differentially abundant proteins, the average upward shift in log2 fold change for differentially abundant proteins, and the significant fraction of differentially abundant proteins exhibiting increased abundance (28 / 39, 72%, binomial p = 9.5e-3) are all consistent with the causal variant’s moderate effect on UBR1 expression.
The causal variant also did not have widespread effects on the transcriptome (median log2 fold change = -0.0024 [again, very close to zero]). As reported in our initial submission, 78 genes were differentially expressed at an FDR of 0.1. For these genes, the overall effect of the causal BY allele, which decreases UBR1 expression, was to decrease transcript abundance (median log2 fold change = -0.18, 60 / 78 decreased expression [77%, binomial p = 2e-6]).
Following the reviewer’s suggestion, we used ashr to explore how using the false sign rate (FSR, Stephens, 2017; https://doi.org/10.1093/biostatistics/kxw041) to call differentially expressed genes influenced our analysis of the causal UBR1 variant’s effects. Using an FSR threshold of 0.1, we detected 86 genes with altered mRNA transcript abundance. For these genes, the BY allele tended to decrease transcript abundance (median log2 fold change = -0.2, 65 / 86 [76%, binomial p = 2e-6]). All differentially expressed genes detected using the FDR were also detected using the FSR. Eight additional differentially expressed genes were detected using the FSR, but not the FDR. Each of these eight genes had lower absolute log2 fold changes than the 78 differentially expressed genes detected using the FDR. Therefore, we conclude that while the FSR is slightly more permissive, the FDR and FSR both capture the same global patterns of effects in our RNA-seq data.
In contrast to these consistent results in RNA-seq, ashr produced different results than the FDR when applied to our proteomics data. As reported in our initial submission, a 0.1 FDR threshold applied to abundance differences reported by the Proteome Discoverer software results in 39 differentially abundant proteins. The derived BY UBR1 allele increased the abundance of 28 of these 39 (72%, binomial p = 9.5e-3) differentially abundant proteins. At a 0.1 FSR threshold, we identified 56 differentially abundant proteins, with the BY allele increasing the abundance of 13 / 56 (23%, binomial p = 7.3e-5).This difference arises from the fact that there are considerable discrepancies among the sets of differentially abundant proteins called by FDR and FSR. We note that of the 39 differentially abundant proteins reported by Proteome Discoverer, 12 were estimated to have large absolute fold changes (>= 0.5, the 99th percentile observed in our data) but were not reported as significant by FSR (Author response image 1). Notably, these 12 genes included the known Ubr1-regulated proteins Tma10 and Adh2 (Kong et al., 2021, Christiano et al., 2020). For 8 of these 12 proteins, the BY allele increased protein abundance. These 12 proteins had relatively high standard errors and, as expected, their fold changes were considerably lower following the adaptive shrinkage that is part of ashr (Author response image 1). Second, ashr identified an additional 48 differentially abundant proteins. The BY allele decreases the abundance of 41 of these 48 proteins (Author response image 1).
Given that ashr strongly depends on correctly estimated standard errors, its application to mass-spectrometry data with a small sample size could be potentially problematic in a manner that does not seem to apply to RNA-seq, which, particularly at the very high sequencing depth used here, produces more accurate estimates of the standard error. We have therefore elected to continue to use the FDR applied to p-values reported by Proteome Discoverer to call differentially expressed genes at the protein and RNA levels. We note that our general conclusion that the causal UBR1 promoter variant affects the expression of dozens of genes at the protein and RNA levels remains unchanged irrespective of the method used to call differentially expressed genes.
Author response image 1
For Figure 5 you could also consider adding information about global patterns in means and correlations, which are difficult to read from these plots.
The revised Figure 5 contains the median log2 fold changes for our proteomics and RNA-seq data (pg. 14). The revised Results section reports the correlation in log2 fold change for genes detected in both our proteomics (pg. 13, para. 4, line 362) and RNA-seq data (pg. 13, para. 5, line 377).
https://doi.org/10.7554/eLife.79570.sa2Download links
A two-part list of links to download the article, or parts of the article, in various formats.
Downloads (link to download the article as PDF)
Open citations (links to open the citations from this article in various online reference manager services)
Cite this article (links to download the citations from this article in formats compatible with various reference manager tools)
Variation in ubiquitin system genes creates substrate-specific effects on proteasomal protein degradation
eLife 11:e79570.
https://doi.org/10.7554/eLife.79570


