Notch signaling functions in noncanonical juxtacrine manner in platelets to amplify thrombogenicity
- Center for Advanced Research on Platelet Signaling and Thrombosis Biology, Department of Biochemistry, Institute of Medical Sciences, Banaras Hindu University, India
Figures
Figure 1 with 2 supplements
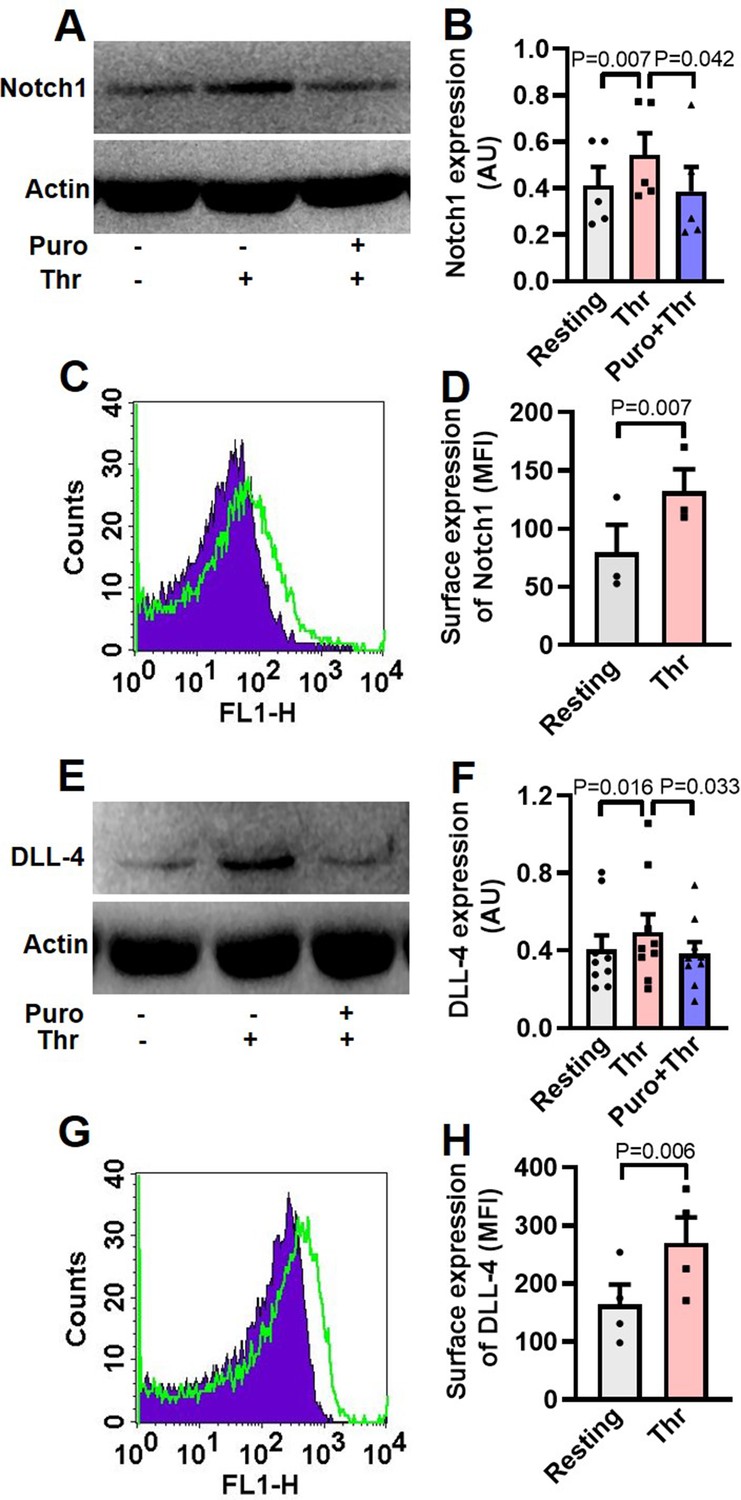
Human platelets express Notch1 and DLL-4.
(A) Immunoblot demonstrating expression of Notch1 in platelets pre-treated with or without puromycin (Puro, 10 mM), followed by stimulation with thrombin (Thr, 1 U/ml, for 5 min at 37 °C). (B) Corresponding densitometric analysis of Notch1 normalised with β-actin (n=5). (C) Flow cytometric analysis of platelets treated with (unshaded) or without (shaded) thrombin (1 U/ml) for 5 min at 37 °C, followed by staining with anti-Notch1 antibody and Alexa Fluor 488-labelled secondary antibody. (D) Corresponding mean fluorescence intensity (MFI) of Notch1 expression on platelets as indicated (n=3). (E) Immunoblot showing synthesis of DLL-4 in thrombin-stimulated platelets. (F) Corresponding densitometric analysis of DLL-4 normalised with β-actin (n=9). (G) Histogram showing expression of DLL-4 on surface of human platelets pre-treated with (unshaded) or without (shaded) thrombin (1 U/ml) for 5 min at 37 °C, followed by incubation with anti-DLL-4 antibody and Alexa Fluor 488-labelled secondary antibody. (H) Corresponding mean fluorescence intensity of DLL-4 expression on platelets as indicated (n=4). Data are presented as mean ± SEM of at least three different experiments. Analyzed by either Student’s paired t-test (D and H) or RM one-way ANOVA with Dunnett’s multiple comparisons test (B and F).
-
Figure 1—source data 1
Excel sheet shows numerical data of Figure 1.
- https://cdn.elifesciences.org/articles/79590/elife-79590-fig1-data1-v2.xlsx
-
Figure 1—source data 2
Unedited and labelled blots of Figure 1.
- https://cdn.elifesciences.org/articles/79590/elife-79590-fig1-data2-v2.zip
-
Figure 1—source data 3
Unedited and unlabelled blots of Figure 1.
- https://cdn.elifesciences.org/articles/79590/elife-79590-fig1-data3-v2.zip
Figure 1—figure supplement 1
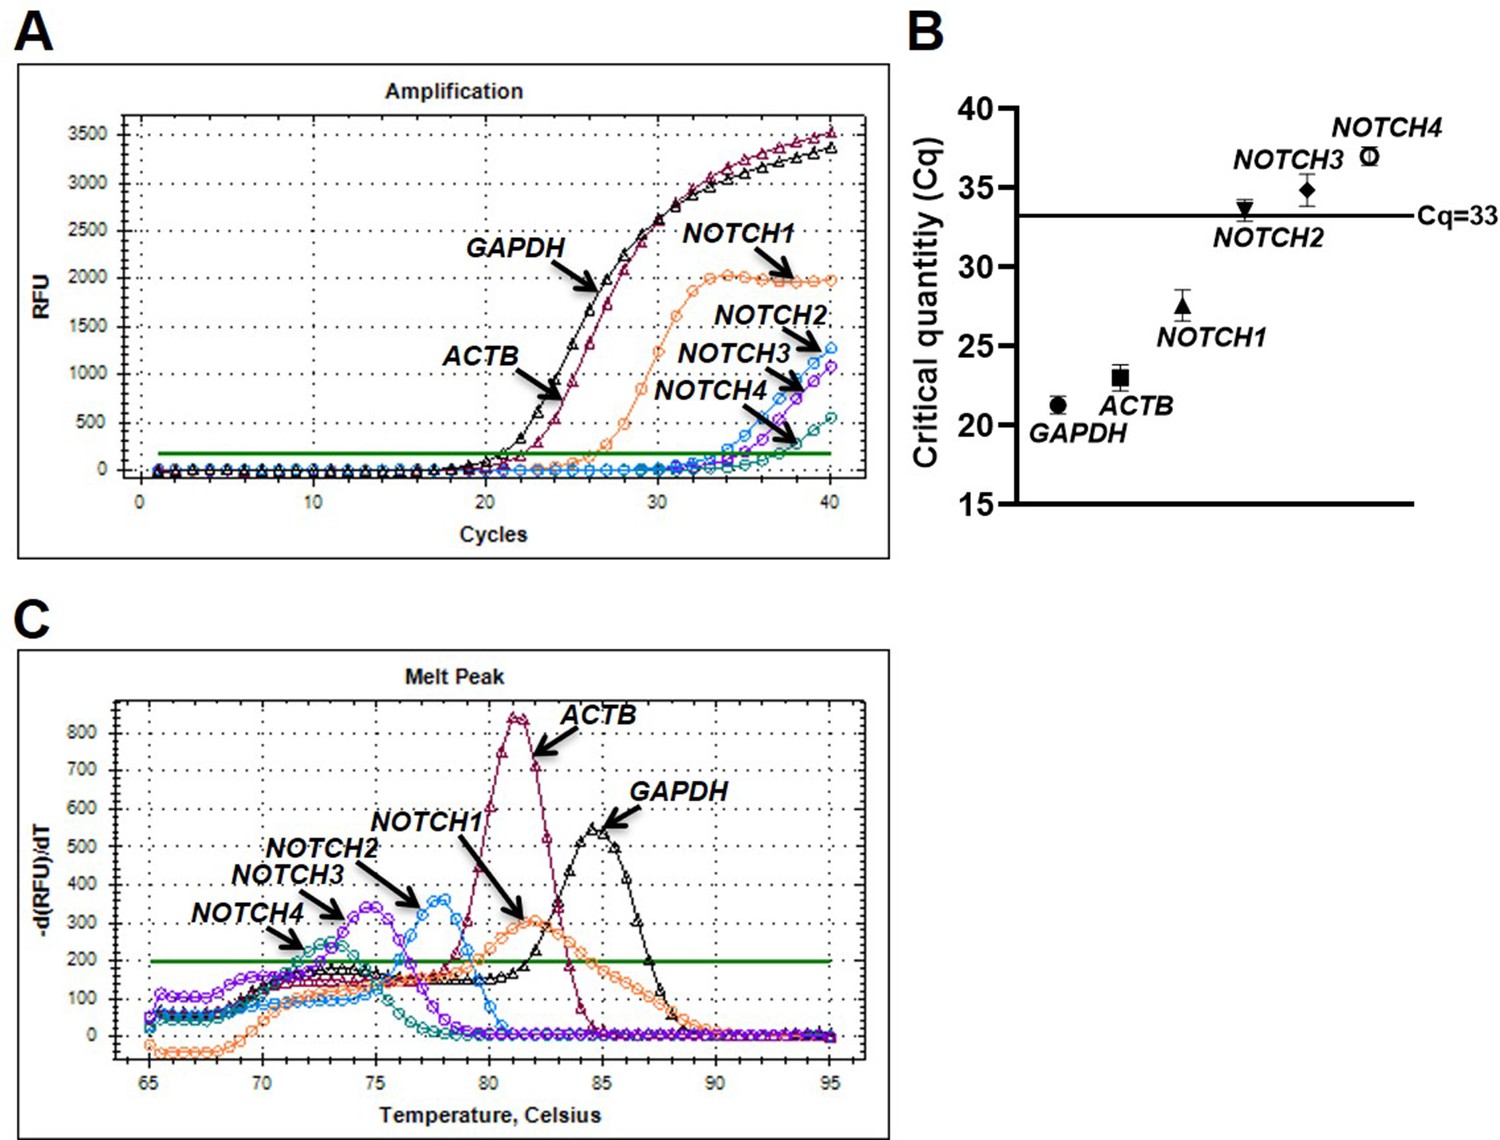
Human platelets abundantly express NOTCH1 mRNA.
Amplification chart (A) and dot plot (B) representing Cq of mRNAs in platelets as indicated. (C) Melt peak analysis to rule out formation of by-products during amplification reactions. Figures are representative of seven individual experiments (n=7). Data are presented as mean ± SEM.
-
Figure 1—figure supplement 1—source data 1
Excel sheet shows critical quantity (Cq) values of Figure 1—figure supplement 1.
- https://cdn.elifesciences.org/articles/79590/elife-79590-fig1-figsupp1-data1-v2.xlsx
Figure 1—figure supplement 2
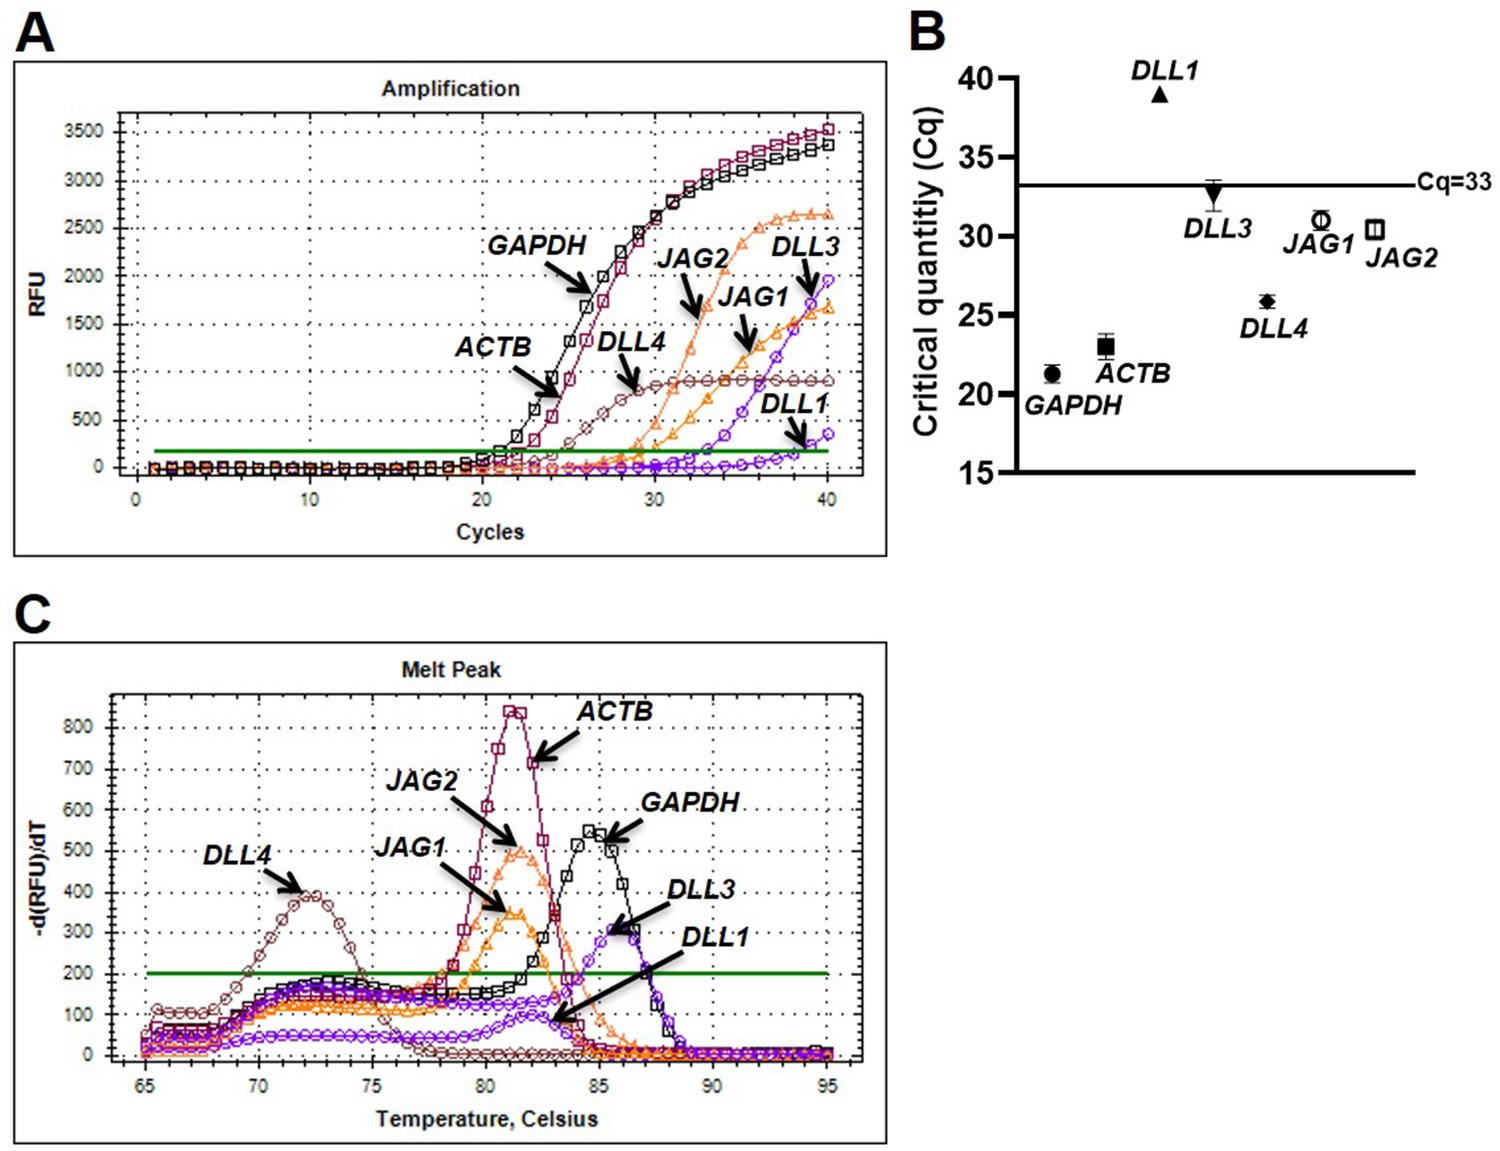
Human platelets abundantly express DLL4 mRNA.
(A and B) Amplification chart and dot plot, respectively, representing Cq of mRNAs in platelets as indicated. (C) Melt peak analysis indicative of lack of formation of by-products during amplification reactions. Figures are representative of seven individual experiments (n=7). Data are presented as mean ± SEM.
-
Figure 1—figure supplement 2—source data 1
Excel sheet shows critical quantity (Cq) values of Figure 1—figure supplement 2.
- https://cdn.elifesciences.org/articles/79590/elife-79590-fig1-figsupp2-data1-v2.xlsx
Figure 2

Expression of NICD in human platelets.
(A) Immunoblot showing expression of NICD in DLL-4 (15 µg/ml for 10 min)-treated platelets in absence or presence of either DAPT (10 µM) or DBZ (10 µM) or vehicle. (B) Corresponding densitometric analysis of NICD normalised with β-actin (n=6). (C, D and E) Immunoblot of NICD expression in either stored or A23187 (1 µM)-treated platelets under conditions as indicated. Data are represented as mean ± SEM of at least three individual experiments and analyzed by RM one-way ANOVA with Dunnett’s multiple comparisons test.
-
Figure 2—source data 1
Excel sheet shows numerical data of Figure 2.
- https://cdn.elifesciences.org/articles/79590/elife-79590-fig2-data1-v2.xlsx
-
Figure 2—source data 2
Unedited and labelled blots of Figure 2.
- https://cdn.elifesciences.org/articles/79590/elife-79590-fig2-data2-v2.zip
-
Figure 2—source data 3
Unedited and unlabelled blots of Figure 2.
- https://cdn.elifesciences.org/articles/79590/elife-79590-fig2-data3-v2.zip
Figure 3 with 3 supplements
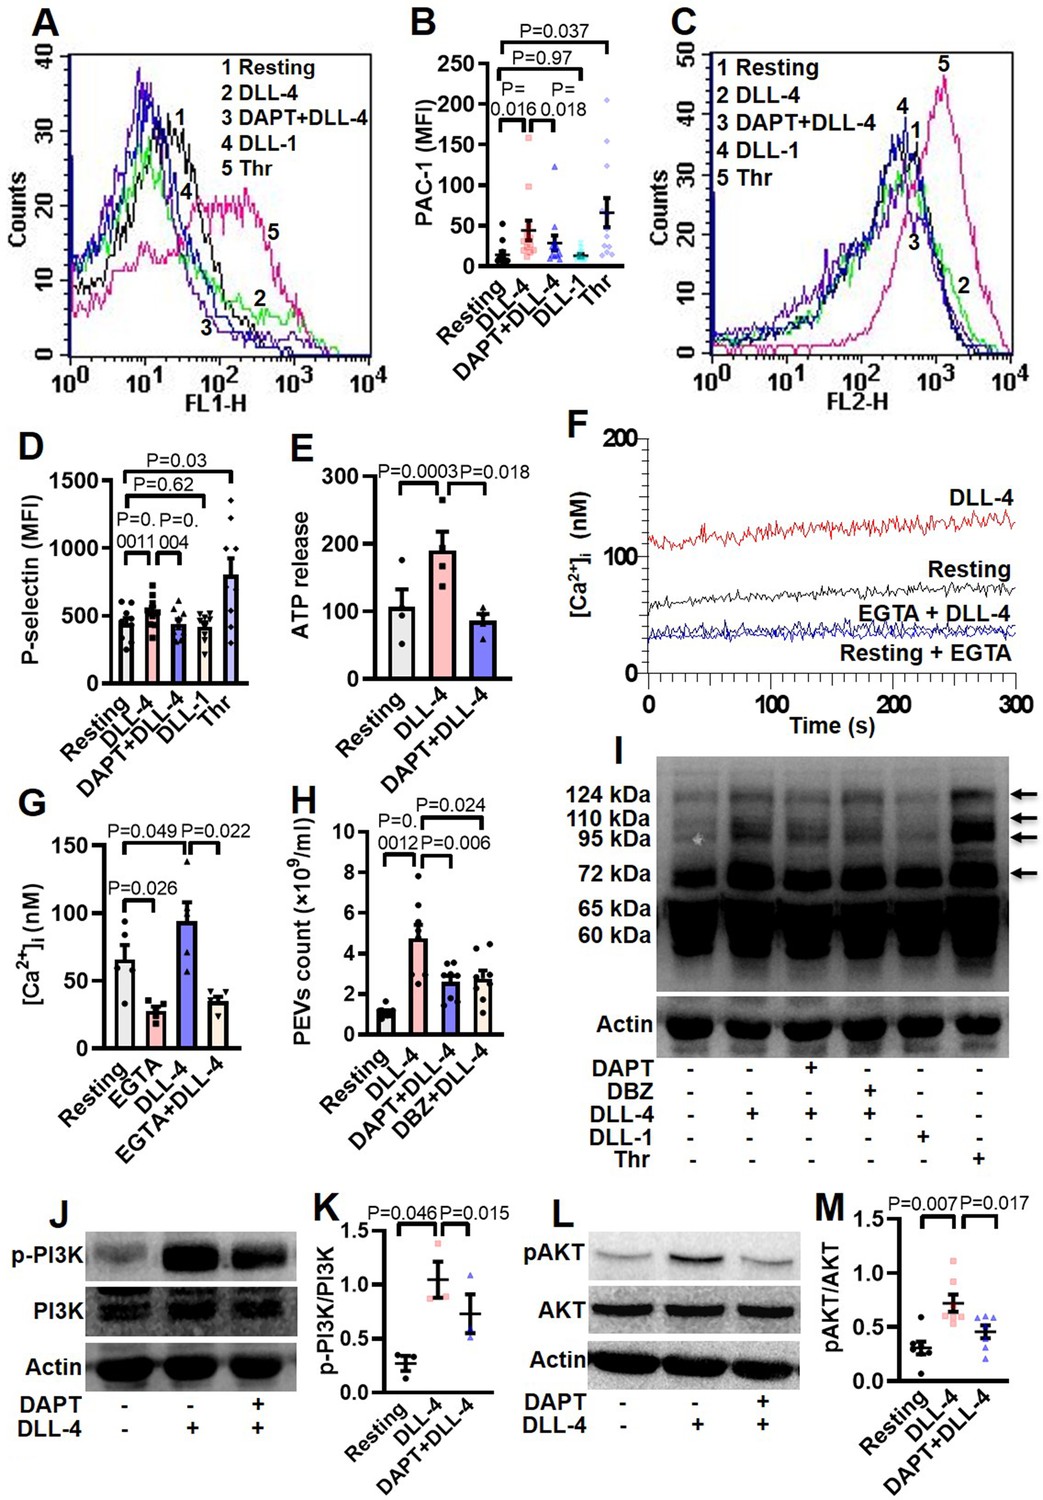
DLL-4 induces integrin activation, P-selectin externalization, ATP release, extracellular vesicle shedding, rise in intracellular Ca2+ and increase in tyrosine phosphoproteome in human platelets.
(A and C) Histograms showing binding of PAC-1 (A) and anti-P-selectin antibody (C) to platelets pre-incubated with either DAPT (10 µM) or vehicle for 10 min at RT followed by treatment with either DLL-4 (15 µg/ml) or DLL-1 (15 µg/ml) for 10 min, or with thrombin (Thr, 1 U/ml) for 5 min at 37 °C as indicated. (B and D) Ccorresponding mean fluorescence intensities of PAC-1 (n=12) and anti-P-selectin antibody (n=9) binding to platelets, respectively. (E) Bar diagram representing ATP secretion from platelet dense granules pre-incubated with either DAPT (10 µM) or vehicle for 10 min at RT followed by treatment with DLL-4 for 10 min (n=4). (F) Fura-2-loaded platelets were pre-treated for 5 min either with calcium (1 mM) or EGTA (1 mM) followed by incubation with DLL-4 (15 µg/ml) for 15 min and intracellular Ca2+ was measured. (G) Corresponding bar diagram representing mean concentration of intracellular Ca2+ over 300 sec of measurement (n=5). (H) Platelets were pre-treated with either DAPT (10 µM) or DBZ (10 µM) or vehicle for 10 min at RT followed by treatment with DLL-4 (15 µg/ml) for 10 min at RT. PEVs were isolated and analyzed with Nanoparticle Tracking Analyzer (n=8). (I) Immunoblot showing profile of tyrosine phosphorylated proteins in platelets pre-treated with either DAPT (10 µM) or DBZ (10 µM) or vehicle for 10 min at RT followed by treatment with either DLL-4 (15 µg/ml) for 10 min at RT or DLL-1 (15 µg/ml) for 10 min at RT or with thrombin (1 U/ml) for 5 min at 37 °C as indicated (n=4). Arrows indicate position of peptides whose intensity increased in presence of DLL-4. (J and L) Immunoblots showing expression of p-PI3K and pAKT in DLL-4 (15 µg/ml for 10 min)-treated platelets in absence or presence of either DAPT (10 µM) or vehicle. (K and M) Corresponding densitometric analyses normalised with PI3K (n=3) and AKT (n=7), respectively. Data are presented as mean ± SEM of at least three different experiments. Results were analyzed by RM one-way ANOVA with either Dunnett’s multiple comparisons test (E, H, K and M) or Sidak’s multiple comparisons test (B, D and G).
-
Figure 3—source data 1
Excel sheet shows numerical data of Figure 3.
- https://cdn.elifesciences.org/articles/79590/elife-79590-fig3-data1-v2.xlsx
-
Figure 3—source data 2
Unedited and labelled blots of Figure 3.
- https://cdn.elifesciences.org/articles/79590/elife-79590-fig3-data2-v2.zip
-
Figure 3—source data 3
Unedited and unlabelled blots of Figure 3.
- https://cdn.elifesciences.org/articles/79590/elife-79590-fig3-data3-v2.zip
Figure 3—figure supplement 1

DLL-4 induces fibrinogen binding to human platelets.
(A) Histogram showing binding of Alexa Fluor 488-labelled fibrinogen (10 µg/ml) to platelets pre-incubated with either DAPT (10 µM) or vehicle for 10 min at RT followed by treatment with either DLL-4 (15 µg/ml) or DLL-1 (15 µg/ml) for 10 min, or with thrombin (1 U/ml) for 5 min at 37 °C as indicated. (B) Corresponding mean fluorescence intensity of fibrinogen binding to platelets presented as mean ± SEM. Data are representative of nine (n=9) different experiments-and analysed by RM one-way ANOVA with Sidak’s multiple comparisons test.
-
Figure 3—figure supplement 1—source data 1
Excel sheet shows numerical data of Figure 3—figure supplement 1.
- https://cdn.elifesciences.org/articles/79590/elife-79590-fig3-figsupp1-data1-v2.xlsx
Figure 3—figure supplement 2

DLL-4 induces platelet-leukocyte aggregate formation.
(A and B) Flow cytometric analysis of platelet-neutrophil aggregates (A) and platelet-monocyte aggregates (B) in whole blood stained with anti-CD41a-APC (specific for platelets) and anti-CD14-FITC (specific for neutrophils/monocytes) followed by treatment with DLL-4 (15 µg/ml) in presence or absence of DAPT (40 µM), as indicated. C (n=8) and D (n=8), corresponding bar diagrams quantifying mean percent platelet-neutrophil and platelet-monocyte aggregates, respectively. Data are representative of eight different experiments and presented as mean ± SEM. Analysed by RM one-way ANOVA with Dunnett’s multiple comparisons test.
-
Figure 3—figure supplement 2—source data 1
Excel sheet shows numerical data of Figure 3—figure supplement 2.
- https://cdn.elifesciences.org/articles/79590/elife-79590-fig3-figsupp2-data1-v2.xlsx
Figure 3—figure supplement 3
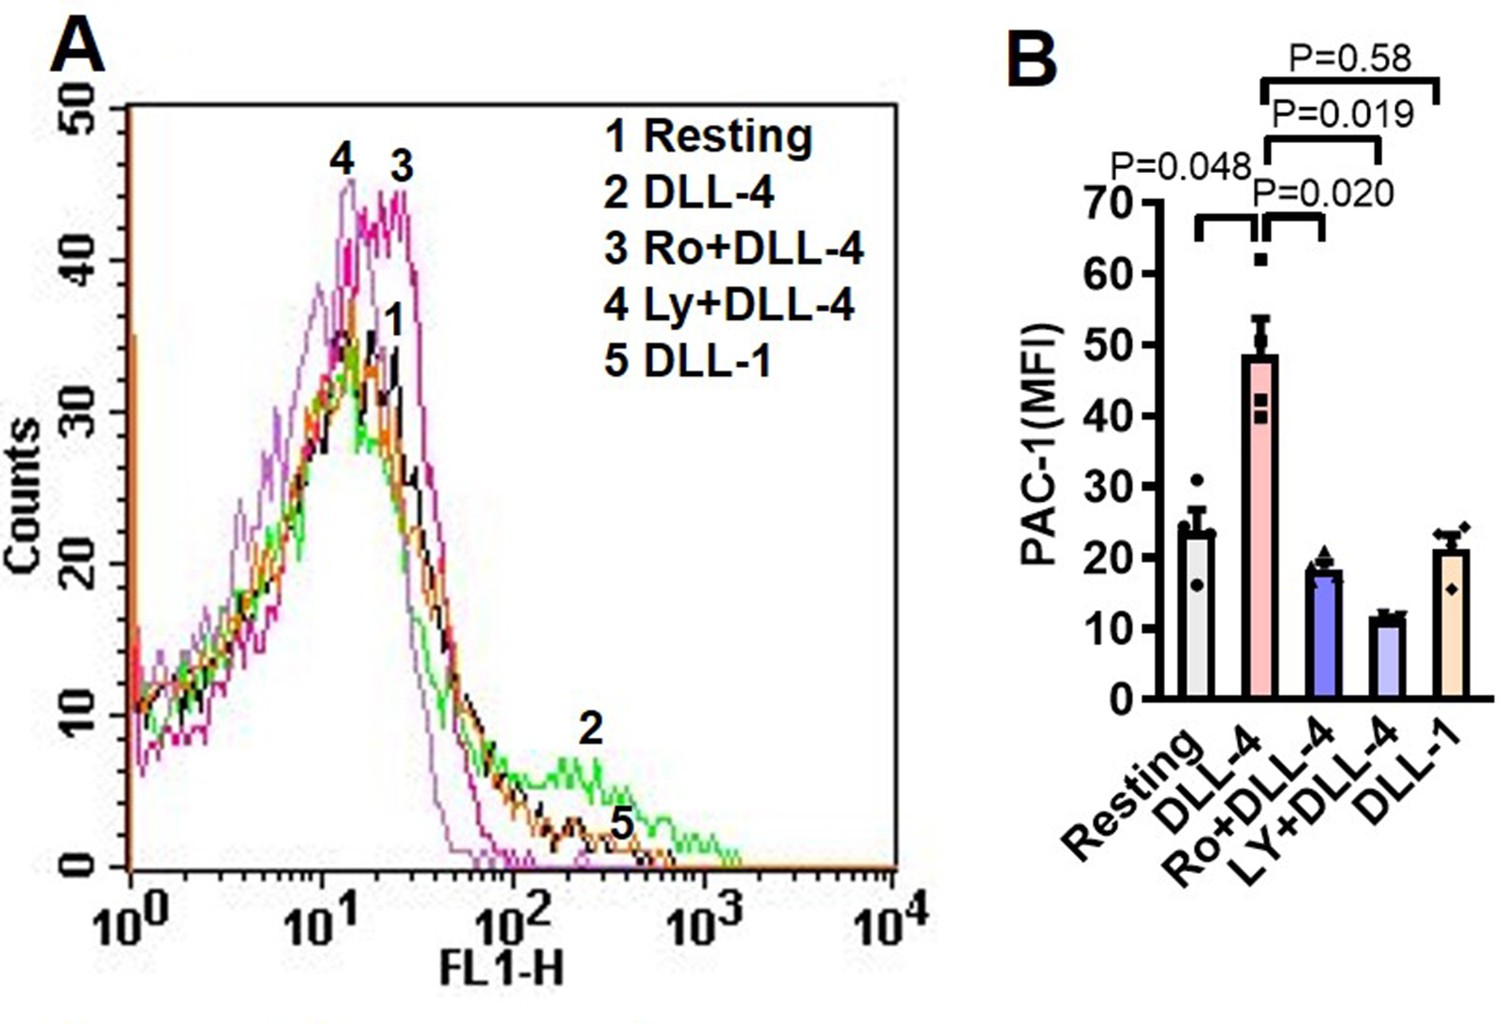
Inhibitors of PI3K and PKC prevent PAC-1 binding to DLL-4-induced human platelets.
(A) Histogram shows PAC-1-FITC binding to platelets pre-incubated with either LY-294002 (80 µM) or Ro-31–8425 (20 µM) or vehicle for 10 min at RT followed by exposure to DLL-4 (15 µg/ml) for 10 min at RT. (B) Corresponding mean fluorescence intensity of four (n=4) different experiments representing PAC-1 binding. Data are presented as as mean ± SEM and analysed by RM one-way ANOVA with Sidak’s multiple comparisons test.
-
Figure 3—figure supplement 3—source data 1
Excel sheet shows numerical data of Figure 3—figure supplement 3.
- https://cdn.elifesciences.org/articles/79590/elife-79590-fig3-figsupp3-data1-v2.xlsx
Figure 4 with 1 supplement
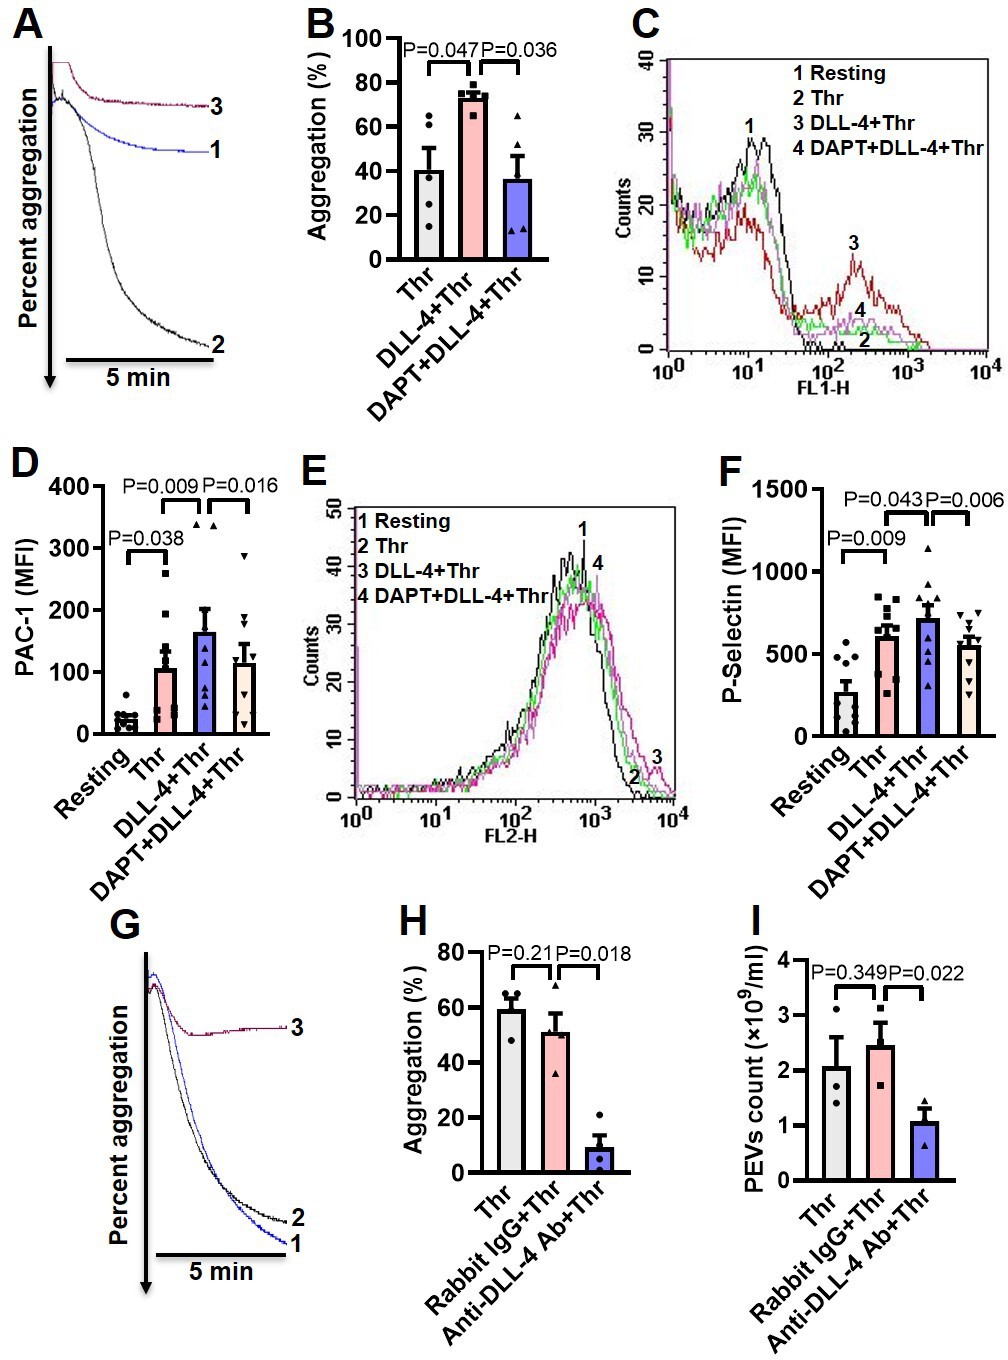
DLL-4 operates in a juxtacrine manner to potentiate thrombin-mediated platelet activation.
(A) Aggregation of washed human platelets induced by thrombin (Thr, 0.1 U/ml) either in presence of vehicle (tracing 1) or DLL-4 (15 µg/ml, tracing 2). Tracing 3 represents cells pre-incubated with DAPT (20 µM) for 10 min at RT followed by addition of DLL-4 and thrombin. (B) Corresponding bar chart representing mean platelet aggregation (n=5). (C and E) Histograms representing PAC-1 binding (C) and surface expression of P-selectin (E) in platelets pre-treated with DLL-4 (7.5 µg/ml) for 10 min followed by stimulation with thrombin (0.1 U/ml) as indicated. Tracings 4 of C and E represent cells pre-incubated with DAPT (10 µM) for 10 min at RT followed by addition of DLL-4 and thrombin. (D and F) corresponding mean fluorescence intensity of PAC-1 binding (n=9) and surface expression of P-selectin (n=10), respectively. (G) Aggregation of washed human platelets induced by thrombin (0.1 U/ml) following pre-treatment with either rabbit-IgG (20 µg/ml) for 5 min (tracing 2), or anti-DLL-4 antibody (20 µg/ml) for 5 min (tracing 3) or vehicle (tracing 1). (H) Corresponding bar chart representing mean platelet aggregation (n=4). (I) Platelets were pre-treated with either anti-DLL-4 antibody (20 µg/ml) or rabbit IgG (20 µg/ml) or vehicle for 5 min at RT followed by aggregation induced by thrombin (0.1 U/ml) for 5 min at 37°C. EVs were isolated from aggregated platelets and analyzed with Nanoparticle Tracking Analyzer (n=3). Data are representative of at least three different experiments and presented as mean ± SEM. Analyzed by RM one-way ANOVA with either Dunnett’s multiple comparisons test (B, H, and I) or Sidak’s multiple comparisons test (D and F).
-
Figure 4—source data 1
Excel sheet shows numerical data of Figure 4.
- https://cdn.elifesciences.org/articles/79590/elife-79590-fig4-data1-v2.xlsx
Figure 4—figure supplement 1
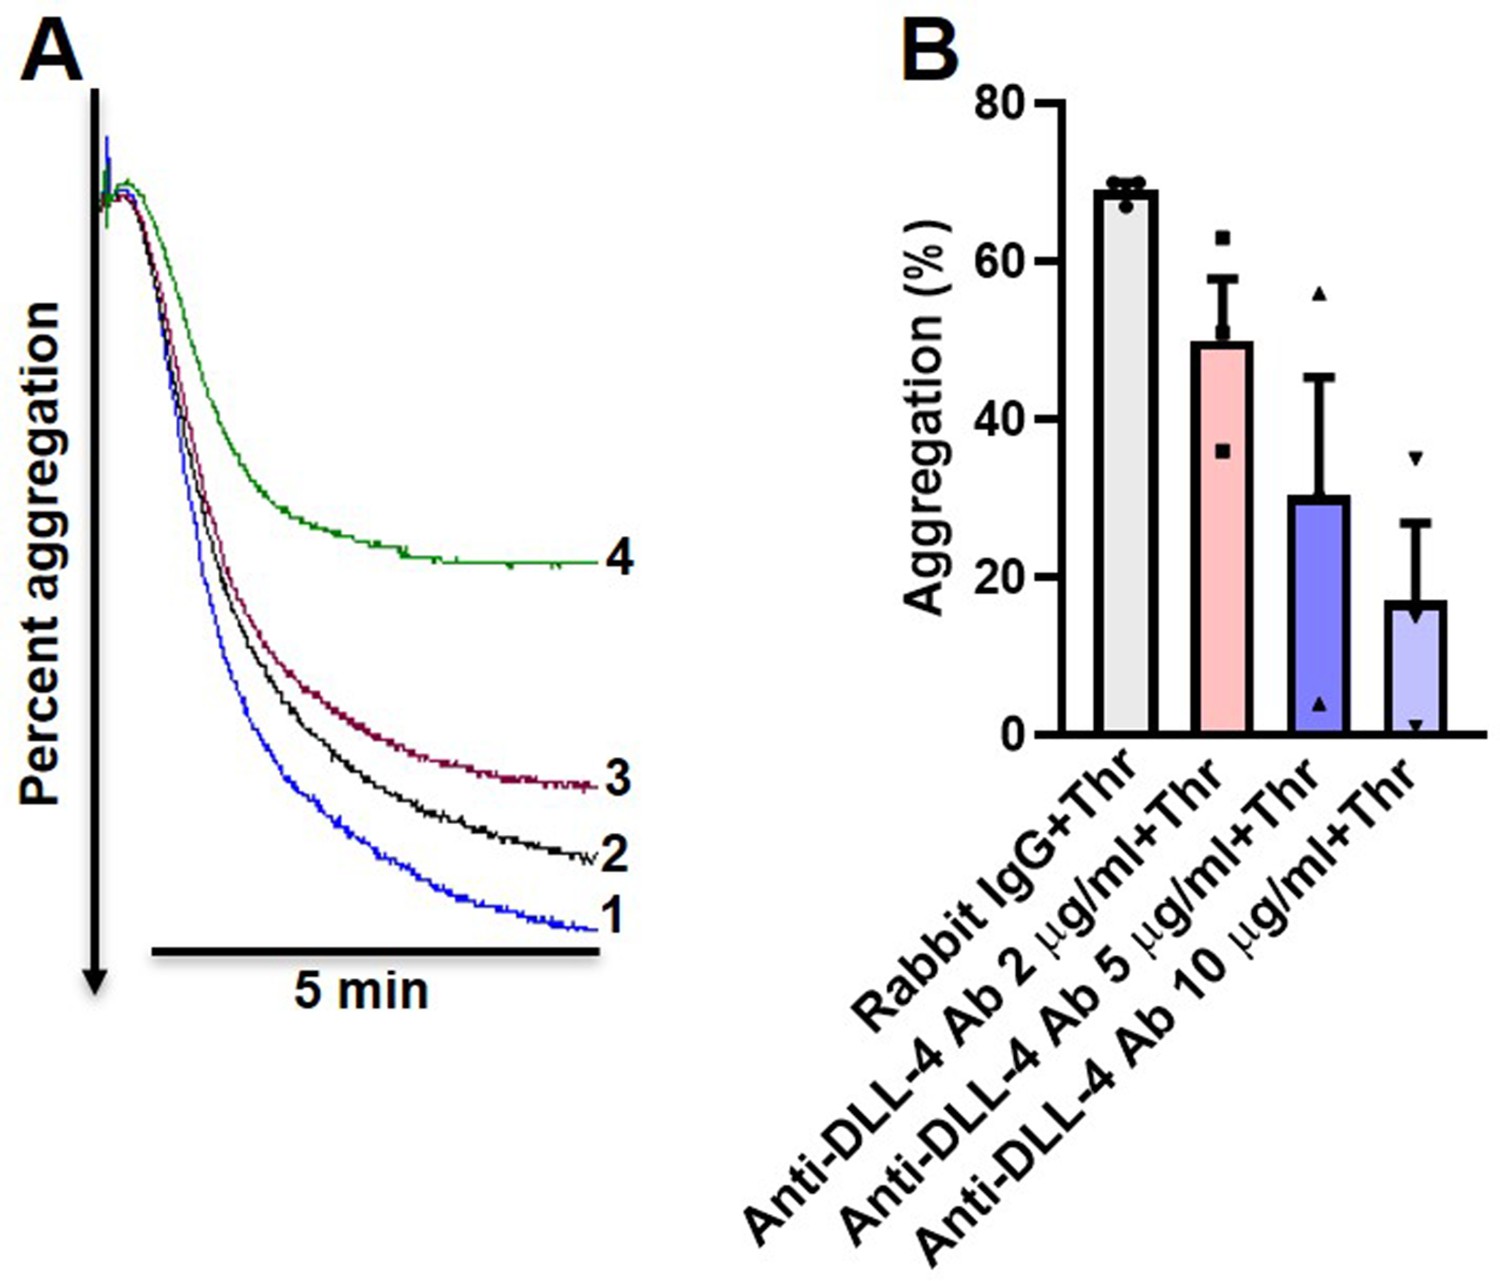
Anit-DLL-4 antibody inhibits thrombin-mediated platelet aggregation in a dose-dependent manner.
(A) Thrombin (0.1 U/ml)-induced aggregation of washed human platelets pre-incubated for 5 min with either rabbit-IgG (10 µg/ml) (tracing 1), or anti-DLL-4 antibody (2, 5, and 10 µg/ml) (tracings 2, 3, and 4, respectively). (B) Corresponding bar chart representing mean platelet aggregation (n=3). Data are presented as mean ± SEM.
-
Figure 4—figure supplement 1—source data 1
Excel sheet shows numerical data of Figure 4—figure supplement 1.
- https://cdn.elifesciences.org/articles/79590/elife-79590-fig4-figsupp1-data1-v2.xlsx
Figure 5 with 4 supplements
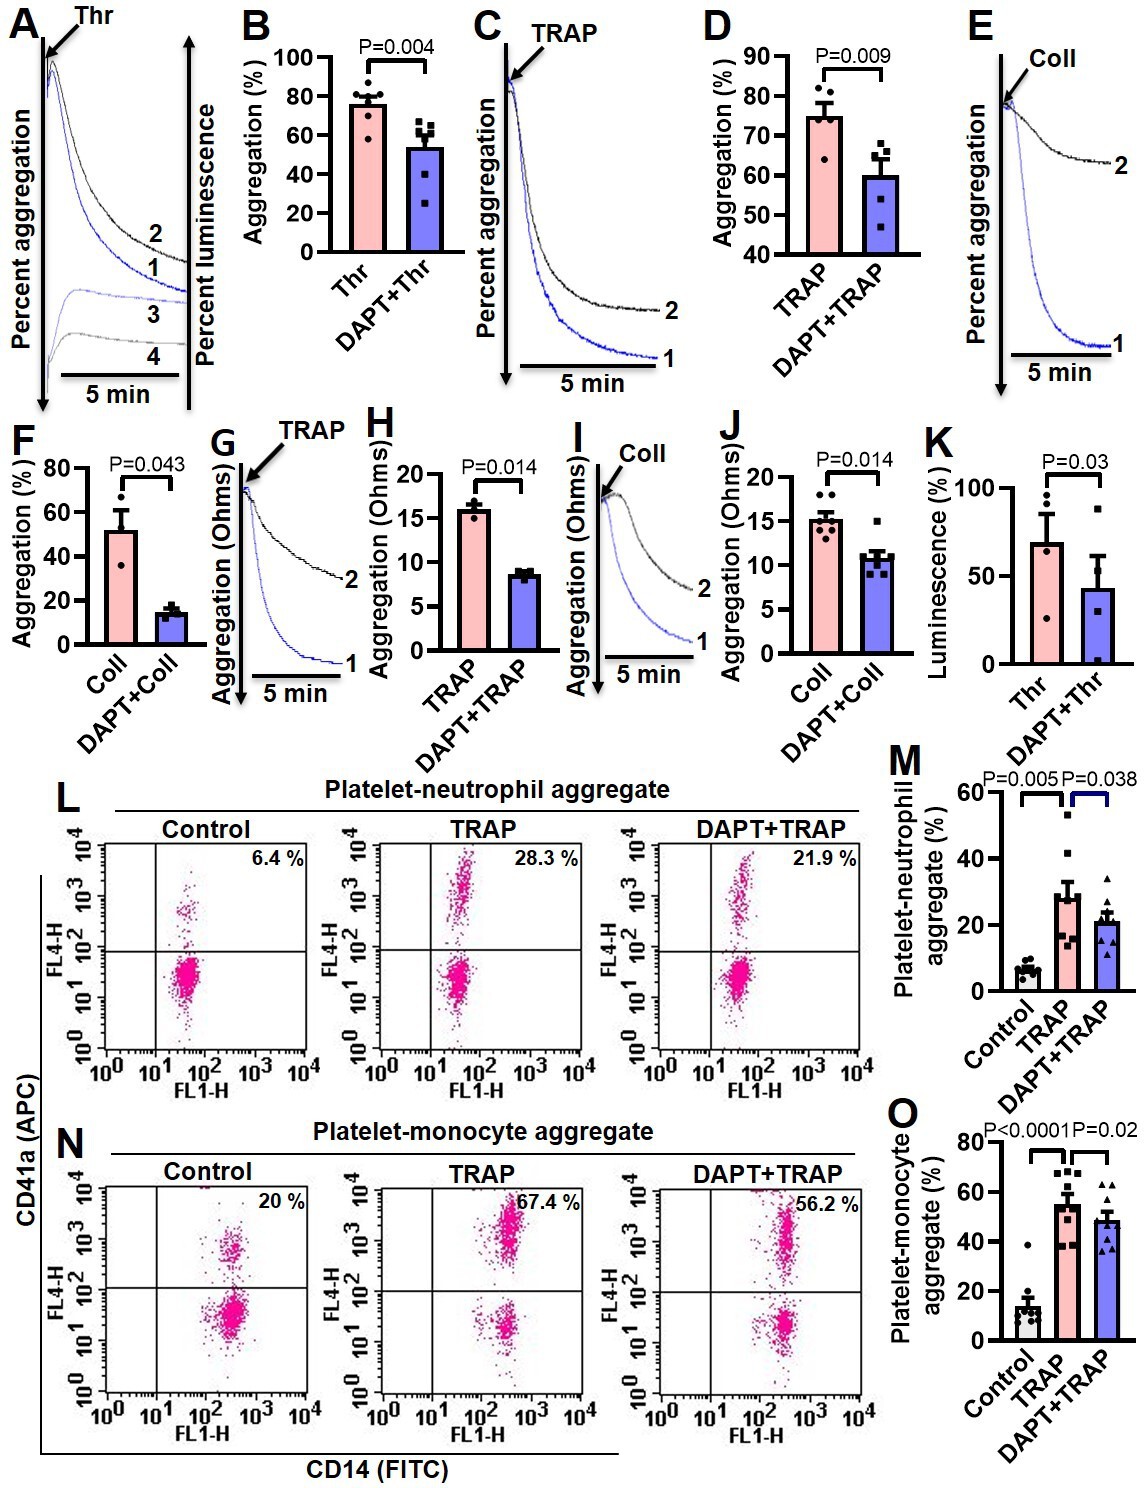
Inhibition of γ-secretase attenuates agonist-induced platelet responses.
(A, C and E) Aggregation of washed human platelets induced by thrombin (Thr, 0.25 U/ml), TRAP (2.5 µM), or collagen (Coll, 2.5 µg/ml) in absence (tracing 1) or presence (tracing 2) of DAPT (20 µM) recorded as percent light transmitted. Tracings 3 and 4 in panel A represent secretion of ATP from thrombin-stimulated platelets either in absence or presence of DAPT, respectively. (G and I) Platelet aggregation in whole blood induced by either TRAP (2 µM) or collagen (2 µg/ml) in absence (tracing 1) or presence (tracing 2) of DAPT (40 µM) recorded as change in electrical resistance (impedance). B (n=7), D (n=5), F (n=3), H (n=3), and J (n=3), corresponding bar chart representing mean platelet aggregation. K, bar diagram representing mean ATP secretion from platelet dense granules (n=4). (L and N) Flow cytometric analysis of platelet-neutrophil aggregates (L) and platelet-monocyte aggregates (N) in whole blood stained with anti-CD41a-APC (specific for platelets) and anti-CD14-FITC (specific for neutrophils/monocytes) followed by treatment with TRAP (2 µM) in presence or absence of DAPT (40 µM), as indicated. Amorphous gates were drawn for monocyte (high fluorescence and low SSC) and neutrophil (low fluorescence and high SSC) populations. M (n=8) and O (n=9), bar diagrams showing percentage of platelet-neutrophil and platelet-monocyte aggregate formation, respectively. Data are representative of at least three different experiments and presented as mean ± SEM. Analyzed by either Student’s paired t-test (B, D, F, H, J, and K) or RM one-way ANOVA with Dunnett’s multiple comparisons test (M and O).
-
Figure 5—source data 1
Excel sheet shows numerical data of Figure 5.
- https://cdn.elifesciences.org/articles/79590/elife-79590-fig5-data1-v2.xlsx
Figure 5—figure supplement 1
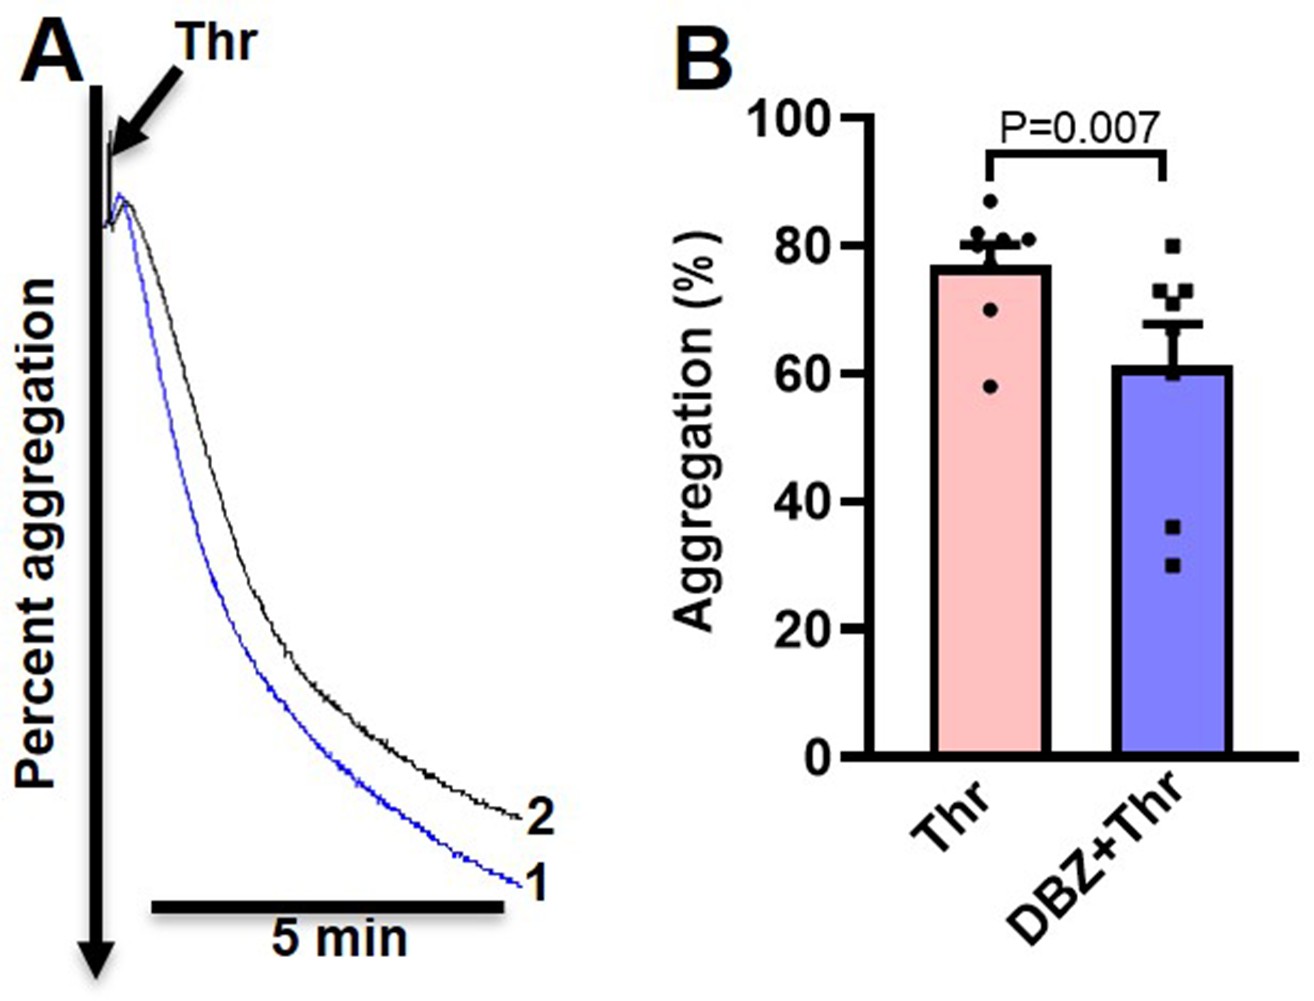
Inhibition of γ-secretase attenuates thrombin-induced platelet aggregation.
(A) Aggregation of washed human platelets induced by thrombin (Thr, 0.25 U/ml), in absence (tracing 1) or presence (tracing 2) of DBZ (30 µM) recorded as percent light transmitted. (B) Corresponding bar chart representing mean platelet aggregation (n=8). Data are presented as mean ± SEM and analysed by Student’s paired t-test.
-
Figure 5—figure supplement 1—source data 1
Excel sheet shows numerical data of Figure 5—figure supplement 1.
- https://cdn.elifesciences.org/articles/79590/elife-79590-fig5-figsupp1-data1-v2.xlsx
Figure 5—figure supplement 2
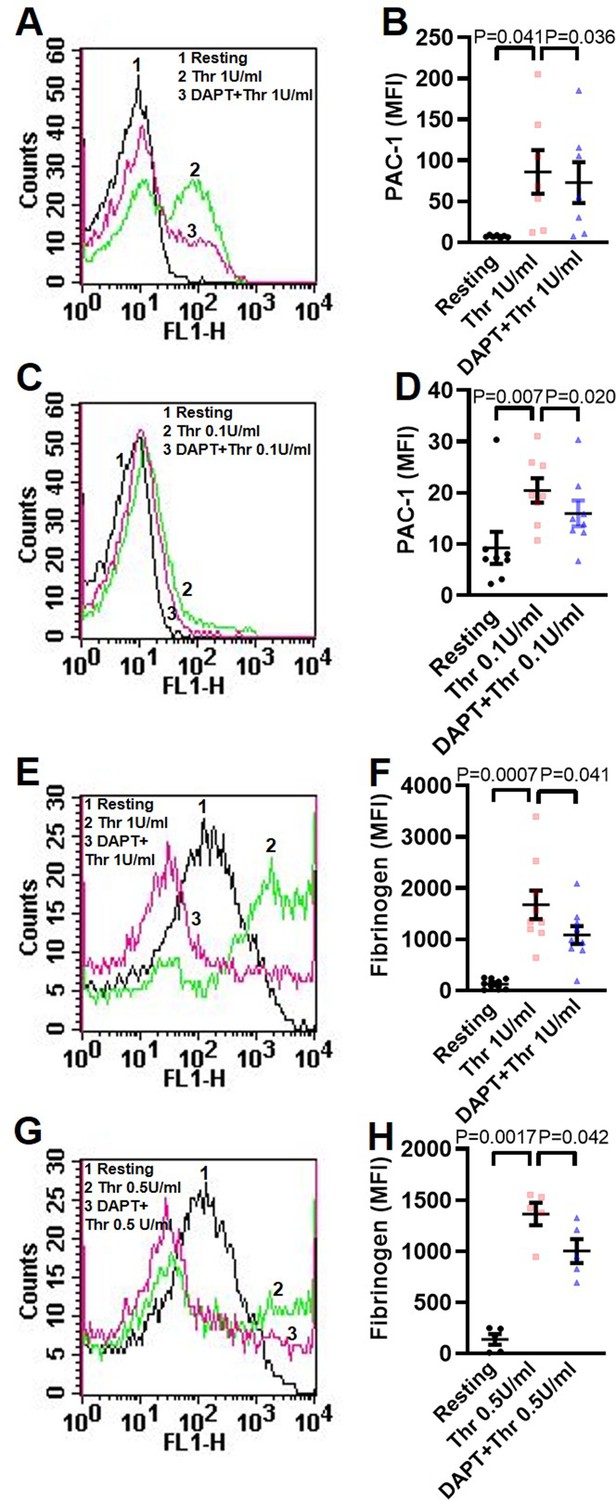
Inhibition of γ-secretase attenuates thrombin-induced integrin activation.
(A, C, E and G) Histograms representing binding of PAC-1 (A and C) and fibrinogen (E and G) to platelets pre-treated with DAPT (10 µM) for 10 min, followed by treatment with thrombin (0.1, 0.5, or 1 U/ml) for 5 min as indicated. B (n=7), D (n=8), F (n=9), and H (n=5), bar diagrams representing corresponding mean fluorescence intensities for binding of PAC-1 (B and D) and fibrinogen (F and H), respectively. Data are representative of at least five different experiments and presented as mean ± SEM. Analysed by RM one-way ANOVA with Dunnett’s multiple comparisons test.
-
Figure 5—figure supplement 2—source data 1
Excel sheet shows numerical data of Figure 5—figure supplement 2.
- https://cdn.elifesciences.org/articles/79590/elife-79590-fig5-figsupp2-data1-v2.xlsx
Figure 5—figure supplement 3

Inhibition of γ-secretase attenuates thrombin-induced P-selectin externalization.
(A and C) Histograms representing surface expression of P-selectin in platelets pre-treated with DAPT (10 µM) for 10 min followed by treatment with thrombin (0.1 or 1 U/ml) for 5 min at 37 °C ͦ as indicated. B (n=9) and D (n=6), bar diagram representing corresponding mean fluorescence intensity of surface expression of P-selectin. Data are representative of at least six different experiments and presented as mean ± SEM. Analysed by RM one-way ANOVA with Dunnett’s multiple comparisons test.
-
Figure 5—figure supplement 3—source data 1
Excel sheet shows numerical data of Figure 5—figure supplement 3.
- https://cdn.elifesciences.org/articles/79590/elife-79590-fig5-figsupp3-data1-v2.xlsx
Figure 5—figure supplement 4
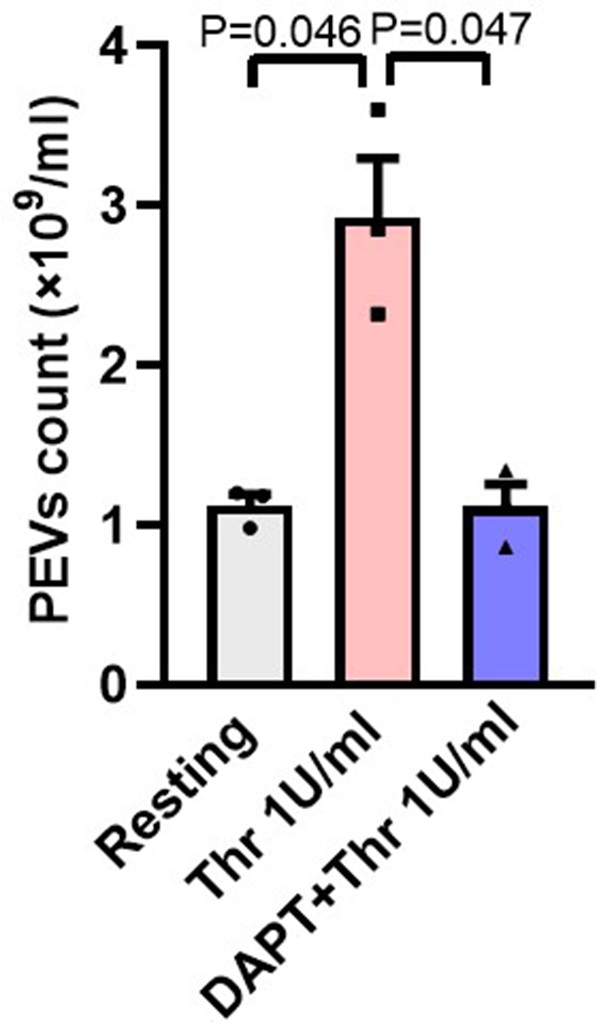
Inhibition of γ-secretase attenuates thrombin-induced extracellular vesicle release form human platelets.
Platelets were pre-treated with either DAPT (10 µM) or vehicle for 10 min at RT followed by treatment with thrombin (Thr, 1 U/ml) for 5 min at 37 °C. ͦ PEVs were isolated and analysed with Nanoparticle Tracking Analyzer (n=3). Data are presented as mean ± SEM and analysed by RM one-way ANOVA with Dunnett’s multiple comparisons test.
-
Figure 5—figure supplement 4—source data 1
Excel sheet shows numerical data of Figure 5—figure supplement 4.
- https://cdn.elifesciences.org/articles/79590/elife-79590-fig5-figsupp4-data1-v2.xlsx
Figure 6 with 1 supplement
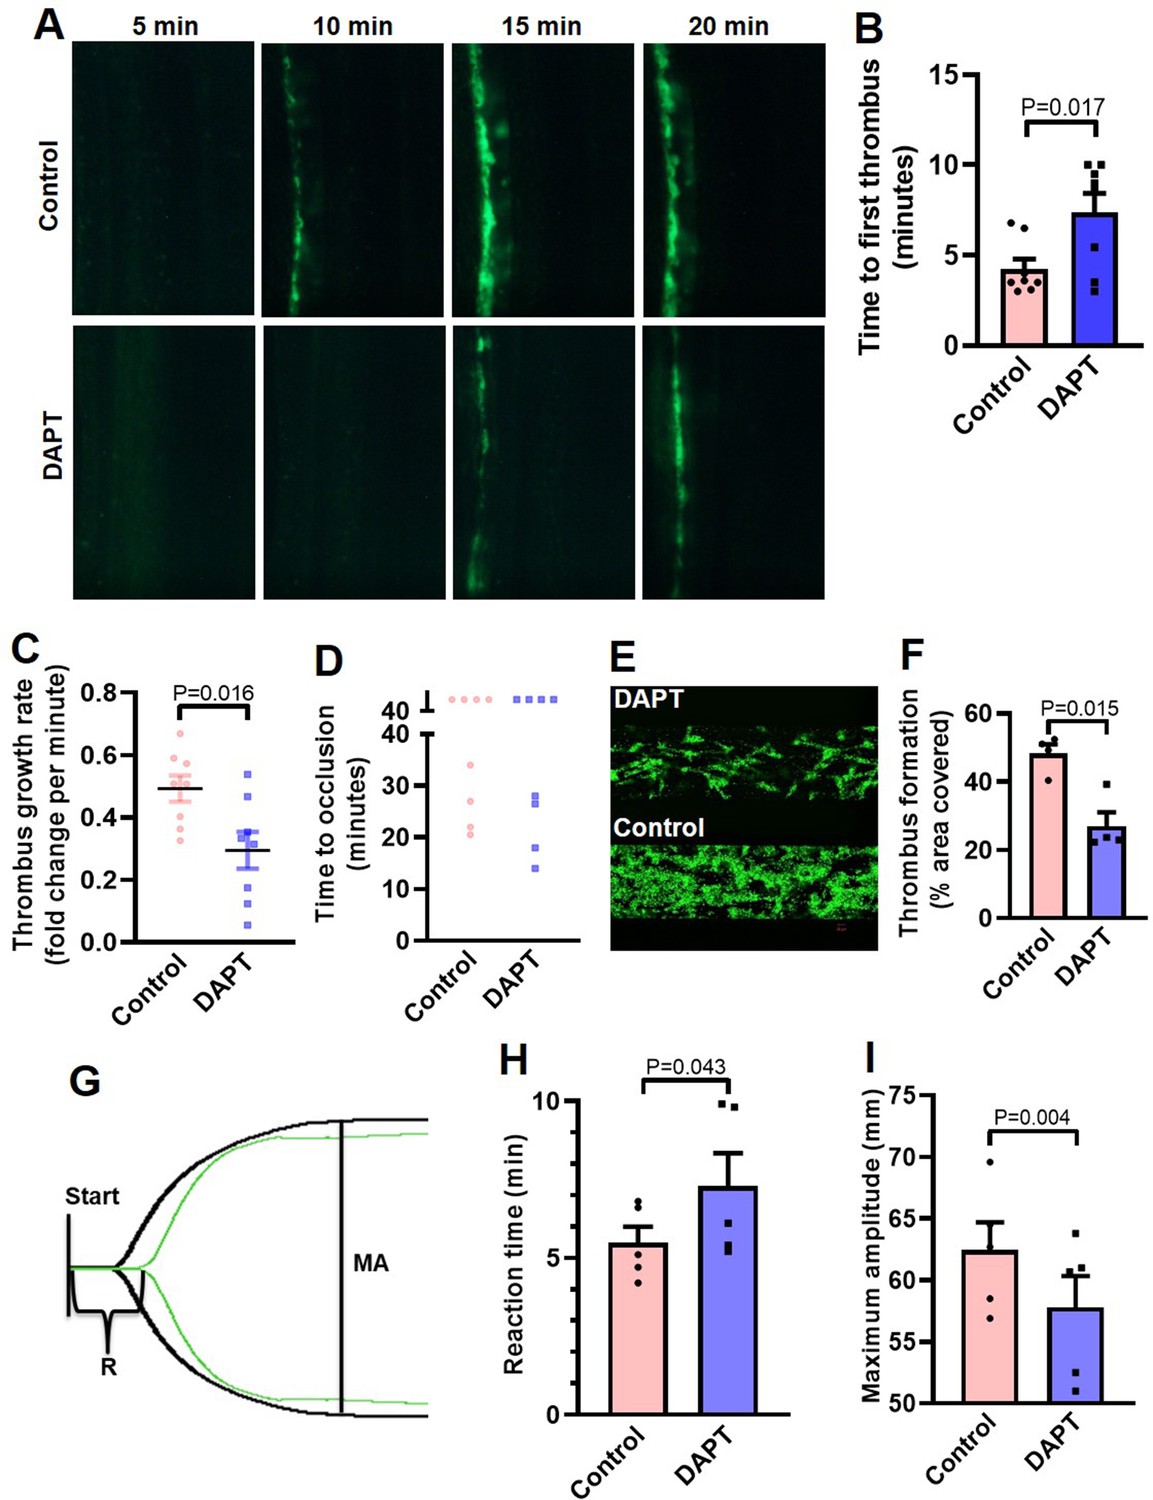
Inhibition of γ-secretase precludes arterial thrombosis in mice and platelet thrombus generation in ex vivo.
(A) Representative time-lapse images showing mesenteric arteriolar thrombosis in mice, pre-administered with either vehicle (control) or DAPT (50 mg/kg) captured 5, 10, 15 or 20 min after ferric chloride-induced injury of the mesenteric arterioles. (B-D) Bar diagrams showing time to first thrombus formation (B), thrombus growth rate (C) and time to occlusion (D) (n=8). (E) Representative image of platelet accumulation after 5 min of perfusion of human platelets pre-treated with either DAPT (20 µM) or vehicle. (F) Corresponding bar diagram representing average surface area covered by platelet thrombi after 5 min of perfusion on collagen matrix (n=4). (G) Thromboelastogram of kaolin-stimulated citrated whole blood pre-incubated with (green tracing) or without DAPT (black tracing). (H and I) Bar diagram representing reaction time (R) and maximum amplitude (MA) of the clot, respectively (n=5). Data are representative of at least four individual experiments and presented as mean ± SEM. Analyzed by either unpaired (B and C) or paired (F, H, and I) Student’s t-test (unpaired for in vivo and paired for in vitro and ex vivo).
-
Figure 6—source data 1
Excel sheet shows numerical data of Figure 6.
- https://cdn.elifesciences.org/articles/79590/elife-79590-fig6-data1-v2.xlsx
Figure 6—figure supplement 1
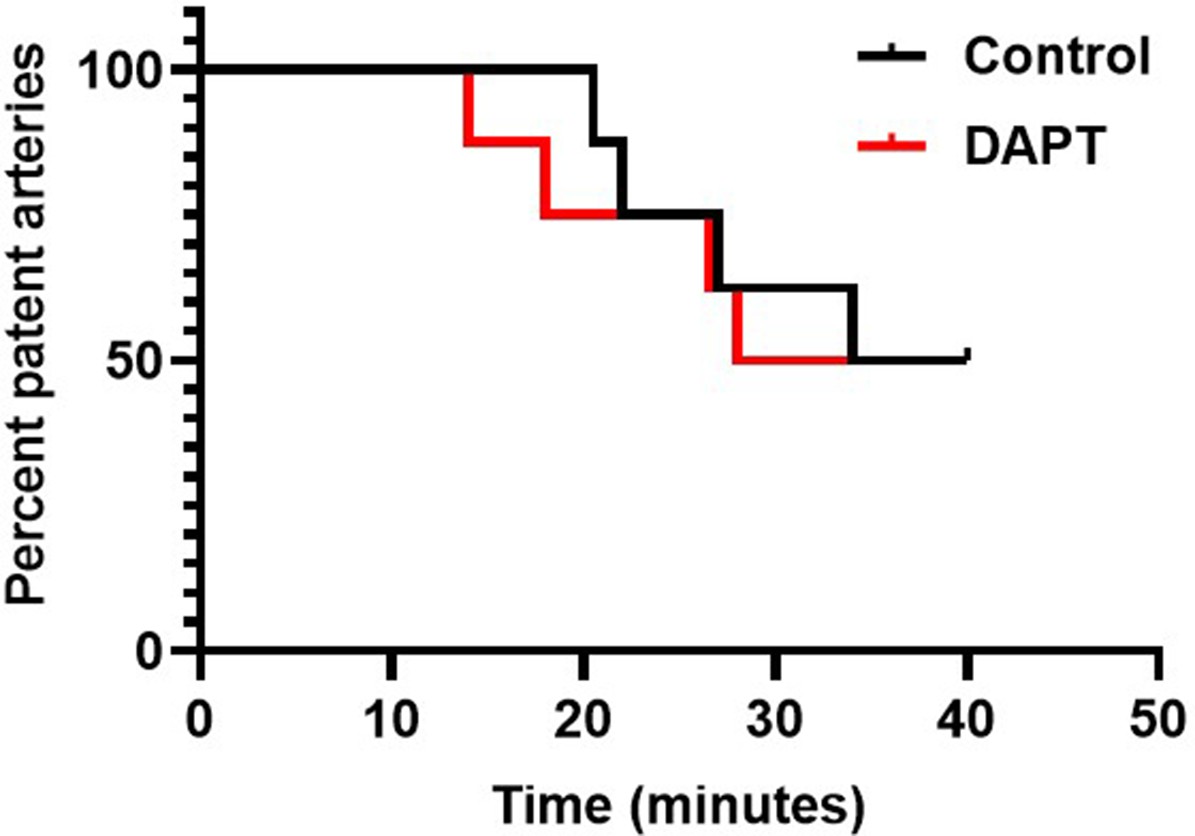
Kaplan-Meier curve representing percent of occluded mesenteric arteries at varying time points in mice pre-administered with either vehicle (control) or DAPT (50 mg/kg), as indicated (n=8).
-
Figure 6—figure supplement 1—source data 1
Excel sheet shows numerical data of Figure 6—figure supplement 1.
- https://cdn.elifesciences.org/articles/79590/elife-79590-fig6-figsupp1-data1-v2.xlsx
Figure 7
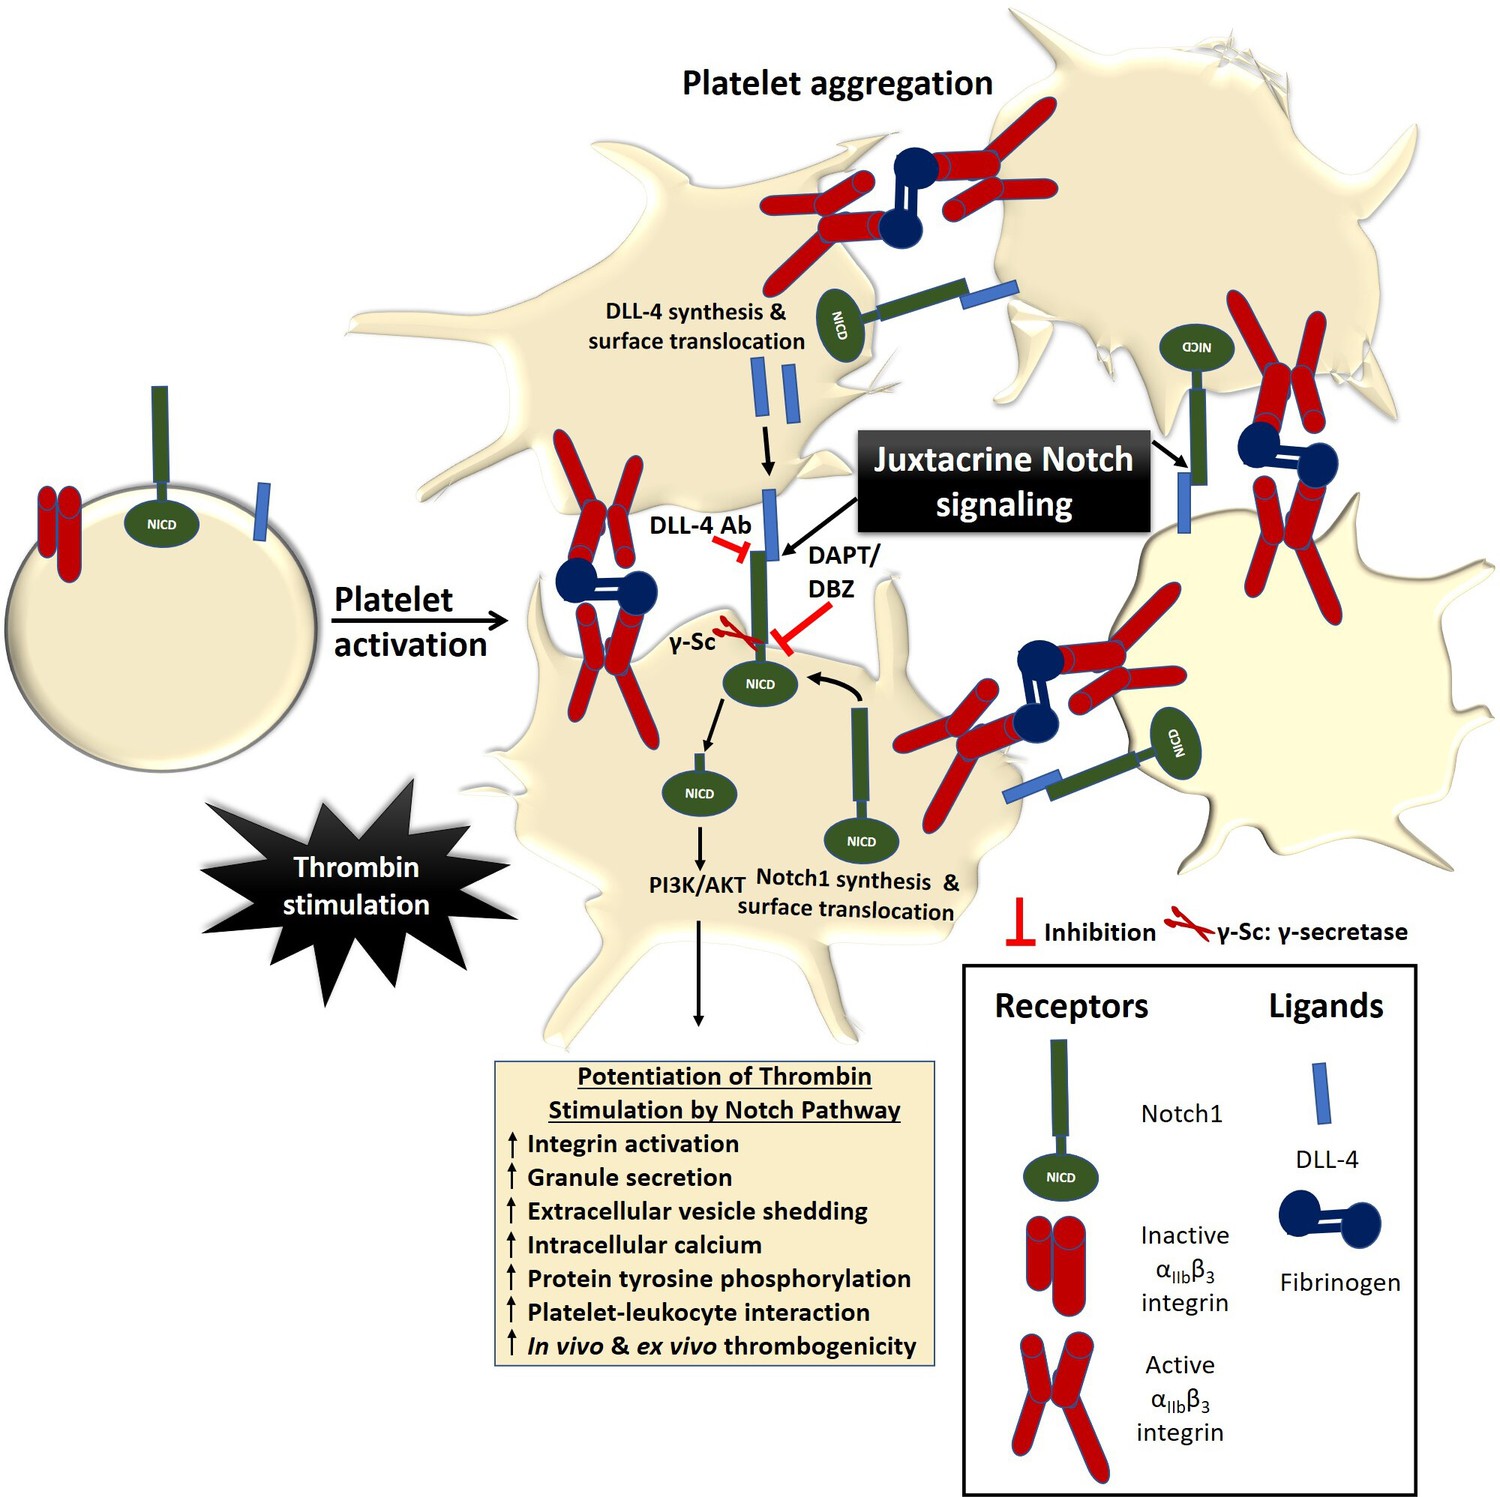
Scheme depicting the role of Notch signaling in potentiating agonist-induced platelet stimulation.
Juxtacrine interaction between DLL-4 and Notch1 expressed on surfaces of agonist-stimulated platelets that remain in close proximity within platelet aggregates, leading to potentiation of thrombin signaling and consolidation of thrombus. The juxtacrine responses are blocked by employing either anti-DLL-4 antibody (blocking antibody) or inhibitors of γ-secretase.
Videos
Video 1
Ferric chloride-induced mesenteric arteriolar thrombosis in mice pre-administered with DAPT (50 mg/kg).
Platelets were fluorescently labelled with DyLight 488 anti-GPIbβ antibody (0.1 µg/g body weight).
Video 2
Ferric chloride-induced mesenteric arteriolar thrombosis in mice pre-administered with vehicle (control).
Platelets were fluorescently labelled with DyLight 488 anti-GPIbβ antibody (0.1 µg/g body weight).
Tables
Key resources table
| Reagent type (species) or resource | Designation | Source or reference | Identifiers | Additional information |
|---|---|---|---|---|
| Antibody | Rabbit monoclonal anti-Notch1 | Cell Signaling Technology | 4380 | WB 1:1000 FC 1:100 |
| Antibody | Rabbit polyclonal anti-DLL4 | Novus Biologicals | NB600 892 | WB 1:1000 FC 1:500 Aggregation 2–20 µg/ml |
| Antibody | Rabbit monoclonal anti- cleaved Notch1 | Cell Signaling Technology | 4147 | WB 1:1000 |
| Antibody | Mouse monoclonal anti-phospho(Ser473)-AKT | Cell Signaling Technology | 4051 | WB 1:1000 |
| Antibody | Rabbit polyclonal anti-AKT | Cell Signaling Technology | 9272 | WB 1:1000 |
| Antibody | Rabbit polyclonal anti-phospho( Tyr467)-PI3K | Elabscience | E-AB-20966 | WB 1:1000 |
| Antibody | Mouse monoclonal anti-PI3K | Santa Cruz Biotechnology | sc-1637 | WB 1:500 |
| Antibody | Mouse monoclonal anti-p-Tyr | Santa Cruz Biotechnology | sc-7020 | WB 1:5000 |
| Antibody | Rabbit polyclonal anti-actin | Sigma-Aldrich | A2066 | WB 1:5000 |
| Antibody | PE-Mouse anti-human CD62P | BD Biosciences | 550561 | 5 µl |
| Antibody | FITC-Mouse anti-human PAC-1 | BD Biosciences | 340507 | 5 µl |
| Antibody | FITC-Mouse anti-human CD14 | BD Biosciences | 555397 | 10 µl |
| Antibody | APC-Mouse anti-human CD41a | BD Biosciences | 559777 | 10 µl |
| Antibody | DyLight 488-Rat anti-mouse GPIbβ | Emfret Analytics | X488 | 0.1 µg/g body weight |
| Antibody | IgG from rabbit serum | Sigma-Aldrich | I5006 | 10–20 µg/ml |
| Antibody | Alexa Fluor 488-Goat anti-rabbit IgG | Invitrogen | A11008 | 1:100 (Notch1) 1:200 (DLL-4) |
| Antibody | HRP-Goat anti-rabbit IgG | Bangalore Genei | 114038001 A | See Methods- Western analysis |
| Antibody | HRP-Goat anti-mouse IgG | Bangalore Genei | 114068001 A | See Methods- Western analysis |
| Peptide, recombinant protein | DLL-1 | Sino Biological | 11635-H08H | 15 µg/ml |
| Peptide, recombinant protein | DLL-4 | Sino Biological | 10171-H02H | 7.5–15 µg/ml |
| Peptide, recombinant protein | Thrombin receptor-activating peptide (TRAP) | Sigma-Aldrich | S1820 | 2–2.5 µM |
| Peptide, recombinant protein | Bovine serum albumin (BSA) | VWR Life Science | 0332–500 G | |
| Peptide, recombinant protein | Thrombin | Sigma-Aldrich | T6884 | 0.1–1 U/ml |
| Peptide, recombinant protein | Collagen | Chrono-log | 385 | 2–2.5 µg/ml |
| Chemical compound/Inhibitor | N-(N-(3, 5-difluorophenacetyl)-L-alanyl)-S-phenyl-glycine t-butyl ester (DAPT) | Sigma-Aldrich | D5942 | 10–40 µM |
| Chemical compound/Inhibitor | Dibenzazepine (DBZ) | Selleckchem | YO-01027 | 10–30 µM |
| Chemical compound/Inhibitor | LY-294002 | Sigma-Aldrich | L9908 | 80 µM |
| Chemical compound/Inhibitor | Ro-31–8425 | Calbiochem | 557514 | 20 µM |
| Chemical compound/Inhibitor | Puromycin | Calbiochem | 540222 | 10 mM |
| Chemical compound/Inhibitor | Prostaglandin E1 | Sigma-Aldrich | P5515 | |
| Chemical compound/reagent | Dimethyl sulfoxide (DMSO) | Sigma-Aldrich | D5879 | |
| Chemical compound/reagent | Diethylpyrocarbonate (DEPC) | Amresco | E174 | |
| Chemical compound/reagent | Ethylene glycol tetraacetic acid (EGTA) | Sigma-Aldrich | E-4378 | |
| Chemical compound/reagent | Ethylenediaminetetraacetic acid (EDTA) | Sigma-Aldrich | E9884 | |
| Chemical compound/reagent | MnCl2 | Sigma-Aldrich | M3634 | |
| Chemical compound/reagent | Xylazine | Sigma-Aldrich | X1251 | |
| Chemical compound/reagent | Kaolin | Haemonetics | 6300 | |
| Commercial assay or Kit | Cell Titer-Glo Luminescent Cell Viability Assay Kit | Promega | G7570 | |
| Commercial assay or Kit | Chrono-lume luciferin luciferase reagent | Chrono-log | 395 | |
| Commercial assay or Kit | High-capacity reverse transcription kit | Applied Biosystems | 4368814 | |
| Other | Calcein AM | Invitrogen | C3100MP | Cell-permeable dye (2 µg/ml) |
| Other | Fura-2 AM | Calbiochem | 344905 | Cell-permeable dye (2 µM) |
| Other | SYBR Green SuperMix | Bio-Rad | 170–8882 | Dye; see Methods- Quantitative Real-Time PCR |
| Other | TRIzol | Invitrogen | 15596026 | See Methods- RNA extraction |
| Other | Fibrinogen (Alexa Fluor 488-conjugated) | Invitrogen | F13191 | 10 µg/ml |
| Other | Polyvinylidene fluoride (PVDF) membrane | Millipore | IPVH00010 | See Methods- Western analysis |
| Other | Immobilon western chemiluminescent HRP substrate | Millipore | WBKLS0100 | See Methods- Western analysis |
| Other | BD FACS Lysing Solution | BD Biosciences | 349202 | See Methods- Study of platelet-leukocyte interaction |
| Other | Restore Western blot stripping buffer | Thermo Fisher Scientific | 21059 | See Methods- Western analysis |
| Other | Skimmed milk powder | Millipore | 70166 | See Methods- Western analysis |
Table 1
Details of primers employed in amplification reactions.
| Genes | Forward Primers (5’ to 3’) | Reverse Primers (5’ to 3’) | Amplicon Size (bp) | Annealing Temp (°C) |
|---|---|---|---|---|
| GAPDH | GAAGGTGAAGGTCGGAGTC | GAAGATGGTGATGGGATTTC | 226 | 57 |
| ACTB | AAATCTGGCACCACACCTTC | AGCACAGCCTGGATAGCAAC | 160 | 59 |
| NOTCH1 | TCAGCGGGATCCACTGTGAG | ACACAGGCAGGTGAACGAGTTG | 104 | 62 |
| NOTCH2 | TGCCAAGCTCAGTGGTGTTGTA | TGCTAGGCTTTGTGGGATTCAG | 132 | 60 |
| NOTCH3 | GGTTCCCAGTGAGCACCCTTAC | GTGGATTCGGACCAGTCTGAGAG | 100 | 60 |
| NOTCH4 | CGGCCTCGGACTCAGTCA | CAACTCCATCCTCATCAACTTCTG | 112 | 60 |
| DLL1 | TGTGTGACGAACACTACTACGGAG | GTGAAGTGGCCGAAGGCA | 76 | 65 |
| DLL3 | GAGACACCCAGGTCCTTTGA | CAGTGGCAGATGTAGGCAGA | 61 | 65 |
| DLL4 | CCAGGAAAGTTTCCCCACAGT | CCGACACTCTGGCTTTTCACT | 82 | 65 |
| JAG1 | GCTGGCAAGGCCTGTACTG | ACTGCCAGGGCTCATTACAGA | 78 | 65 |
| JAG2 | CACCGAGGTCAAGGTGGAGA | ACGCTGAAGGCACCACACA | 84 | 65 |
Additional files
-
Supplementary file 1
Thromboelastogram of kaolin-stimulated citrated whole blood pre-treated with or without DAPT.
Data are representative of five individual experiments and presented as mean ± SEM, analyzed by Student’s paired t-test.
- https://cdn.elifesciences.org/articles/79590/elife-79590-supp1-v2.docx
-
MDAR checklist
- https://cdn.elifesciences.org/articles/79590/elife-79590-mdarchecklist1-v2.docx
Download links
A two-part list of links to download the article, or parts of the article, in various formats.
Downloads (link to download the article as PDF)
Open citations (links to open the citations from this article in various online reference manager services)
Cite this article (links to download the citations from this article in formats compatible with various reference manager tools)
Notch signaling functions in noncanonical juxtacrine manner in platelets to amplify thrombogenicity
eLife 11:e79590.
https://doi.org/10.7554/eLife.79590


