Coupling to short linear motifs creates versatile PME-1 activities in PP2A holoenzyme demethylation and inhibition
- McArdle Laboratory for Cancer Research, Department of Oncology, University of Wisconsin at Madison, School of Medicine and Public Health, United States
- Biophysics program, University of Wisconsin at Madison, United States
- Department of Chemistry – BMC, Uppsala University, Sweden
- Department of Neuroscience and Pharmacology, University of Iowa, United States
- Environmental Molecular Sciences Laboratory, Pacific Northwest National Laboratory, United States
Figures
Figure 1 with 1 supplement
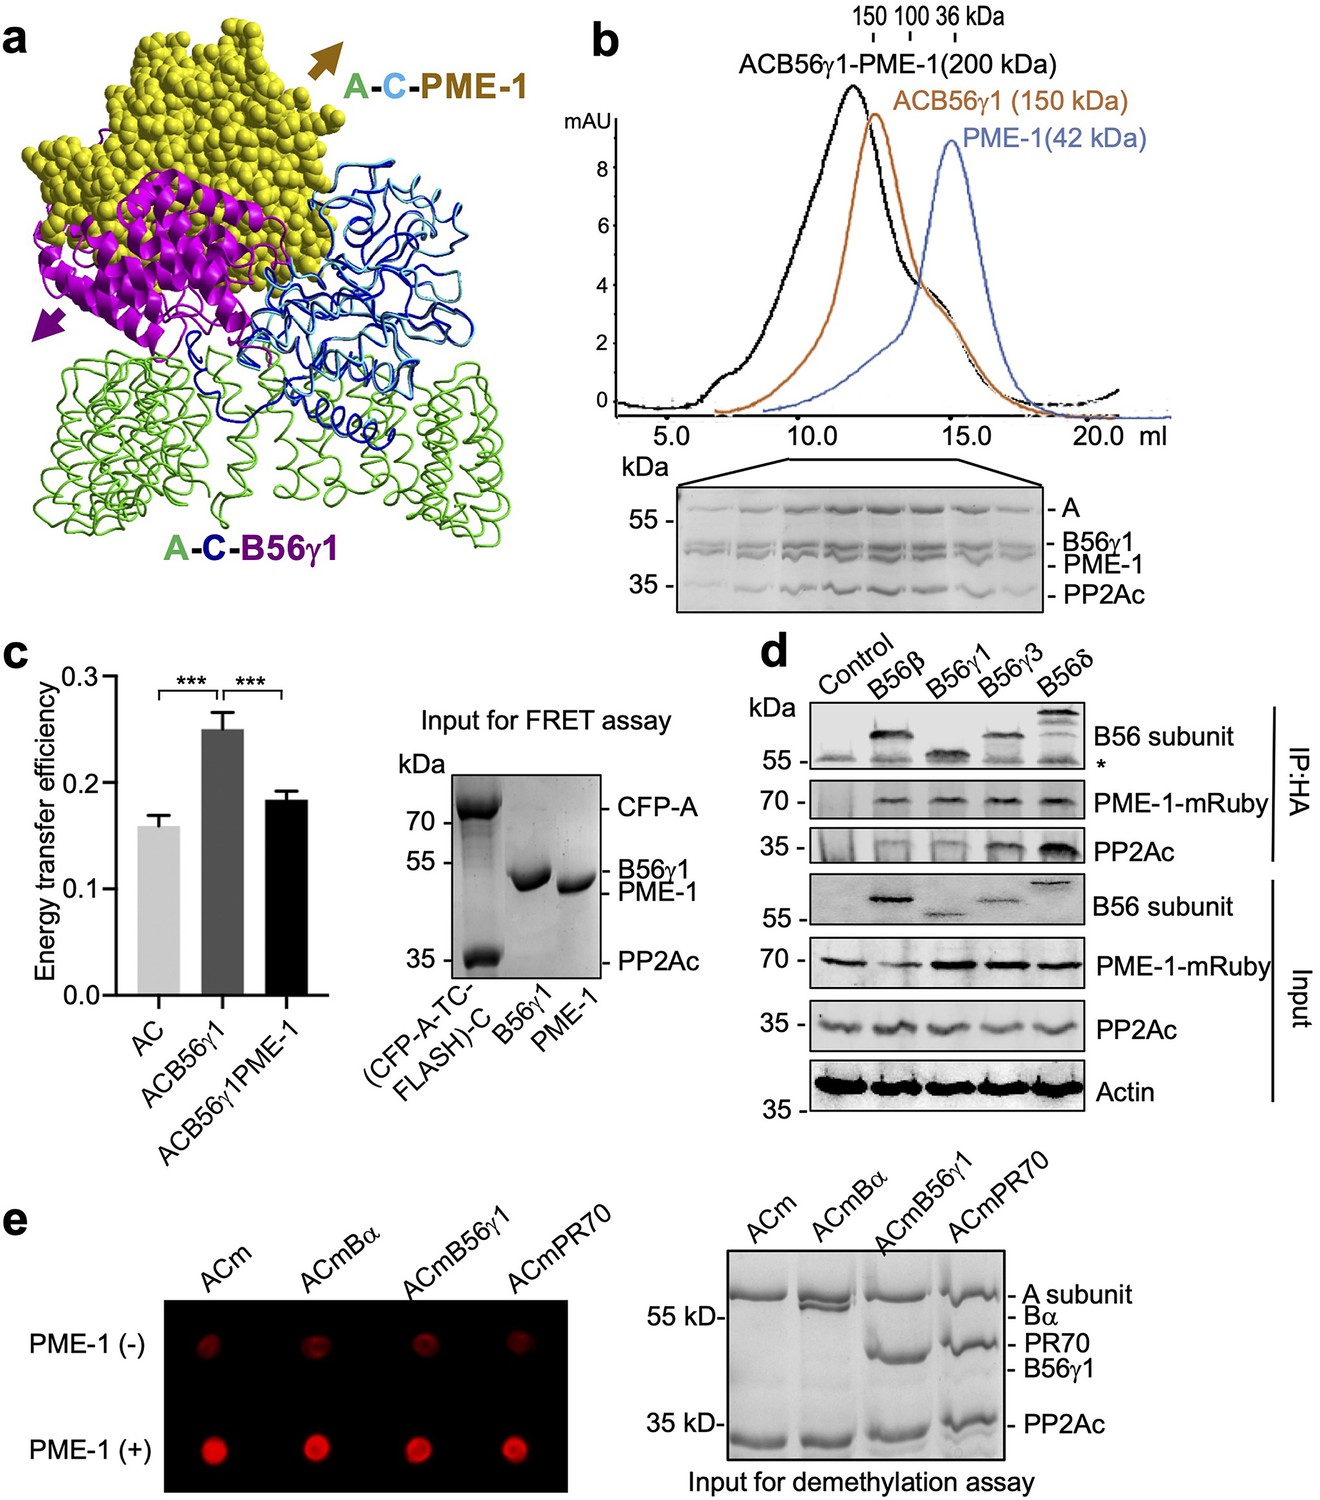
PP2A methylesterase 1 (PME-1) directly interacts with and demethylates protein phosphatase 2A (PP2A) holoenzymes.
(a) Structural overlay of the PP2A-B56γ1 holoenzyme (PDB code: 2NPP) to the PP2A core enzyme–PME-1 complex (PDB code: 3C5W) aligned via PP2Ac (c) and the C-terminal five huntingtin-elongation-A-subunit-TOR (HEAT) repeats of the A-subunit. Arrows indicate the directions of movements of PME-1 and B56γ1 needed to avoid clashes in the overlaid structures. (b) The overlaid gel filtration profiles of the PP2A-B56γ1 holoenzyme with PME-1 (black), PP2A core enzyme (AC) with B56γ1(orange), and PME-1 alone (blue). The sodium dodecyl sulfate–polyacrylamide gel electrophoresis (SDS–PAGE) data examining protein fractions for the PP2A-B56γ1 holoenzyme with PME-1 were provided below. The molecular weight standards for gel filtration chromatography were generated using the PP2A free catalytic subunit (36 kDa), the PP2A core enzyme (100 kDa), and the PP2A-B56γ1 holoenzyme (150 kDa). (c) Fluorescence resonance energy transfer (FRET) assay measured changes in the distance between the A-subunit N- and C-termini in the PP2A core enzyme before and after the addition of B56γ1 with and without PME-1 (left). Representative results were shown with mean ± standard deviation (SD) calculated from three experimental repeats. One-way analysis of variance (ANOVA) with Tukey’s multiple comparisons was used to determine the difference between independent groups (***p < 0.001). Protein inputs used in FRET assay were examined by SDS–PAGE and visualized by Coomassie blue staining (right). (d) Co-immunoprecipitation (co-IP) of PME-1-mRuby and PP2Ac by HA-tagged B56 (B56β, B56γ1, B56γ3, and B56δ) recombinantly expressed in HEK 293T cells. The band with * is the heavy chain of anti-HA antibody. (e) PME-1 catalyzes demethylation of methylated core enzyme and holoenzymes in vitro. The level of demethylation was determined by 4b7 antibody that specifically recognizes the unmethylated PP2Ac (left). Inputs of PP2A complexes were examined as in c (right).
-
Figure 1—source data 1
Source data for Figure 1b.
- https://cdn.elifesciences.org/articles/79736/elife-79736-fig1-data1-v2.zip
-
Figure 1—source data 2
Source data for Figure 1c.
- https://cdn.elifesciences.org/articles/79736/elife-79736-fig1-data2-v2.zip
-
Figure 1—source data 3
Source data for Figure 1d.
- https://cdn.elifesciences.org/articles/79736/elife-79736-fig1-data3-v2.zip
-
Figure 1—source data 4
Source data for Figure 1e.
- https://cdn.elifesciences.org/articles/79736/elife-79736-fig1-data4-v2.zip
Figure 1—figure supplement 1
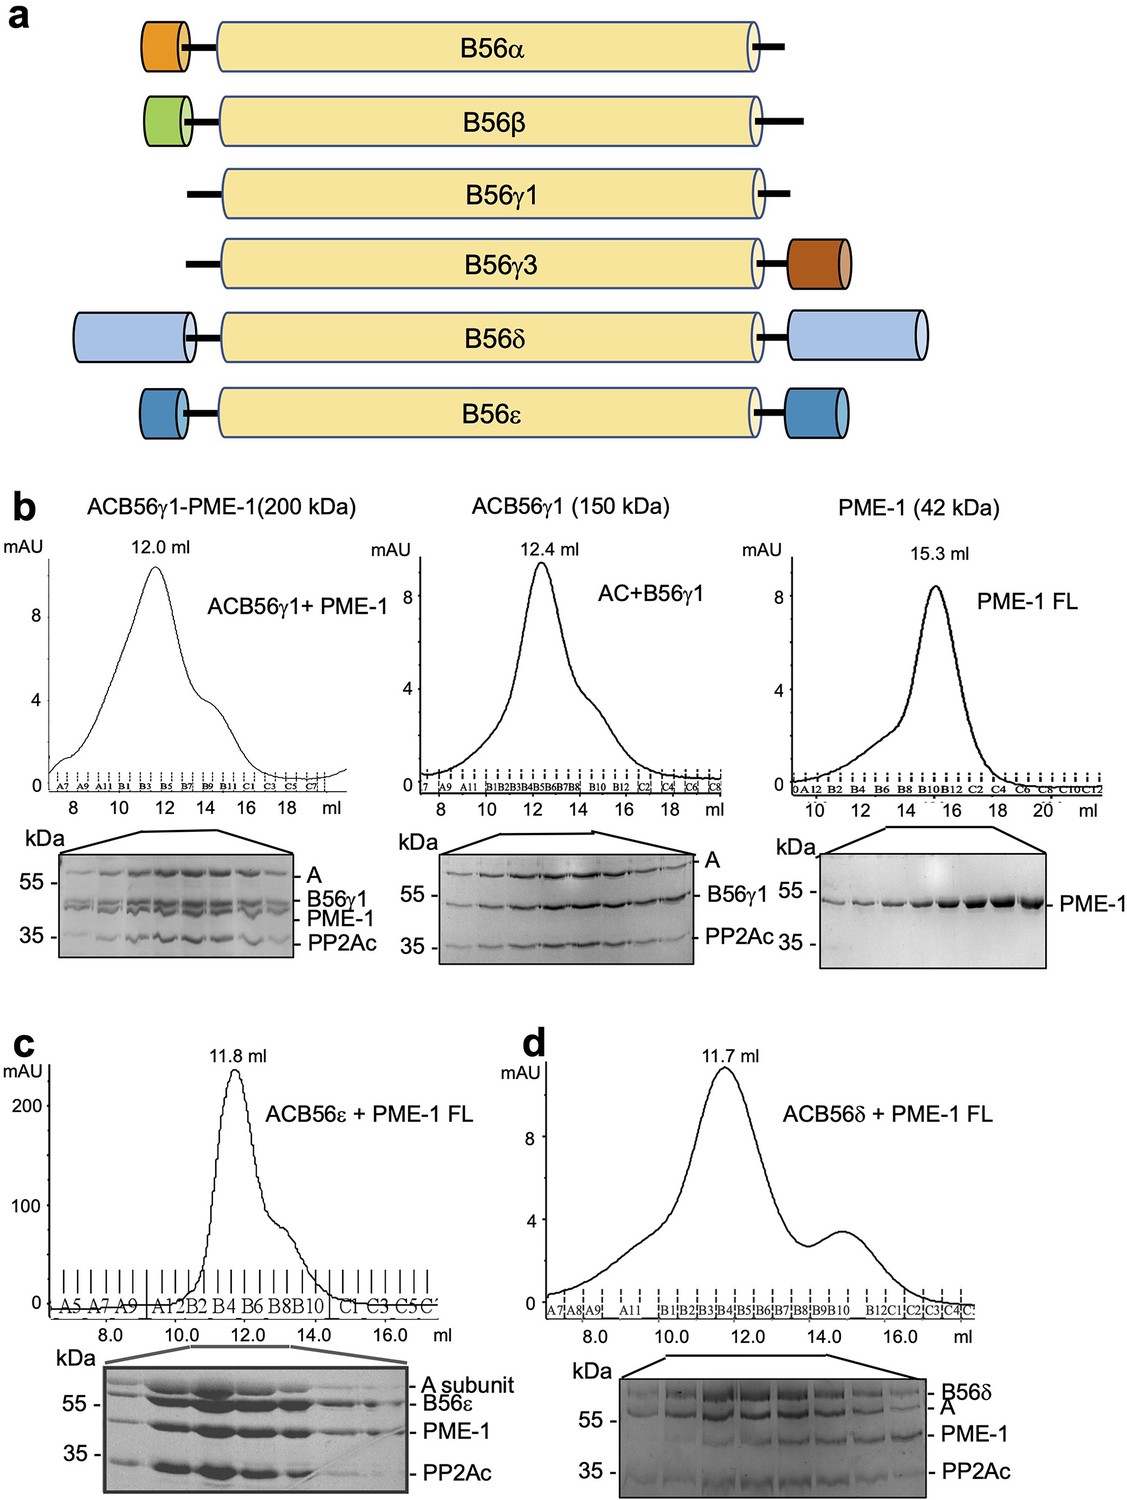
PP2A methylesterase 1 (PME-1) interactions with different B56 family members, likely via the conserved B56 common core.
(a) Domain structures of regulatory subunits in the B56 family. The conserved common core in B56 subunits is colored yellow. Other family members have distinct N- and C-terminal extensions. B56δ has the longest N/C-extensions. (b) Comigration of PME-1 with the protein phosphatase 2A (PP2A)-B56γ1 holoenzyme (left) over gel filtration chromatography. The PP2A core enzyme (AC) mixed with B56γ1 (middle) and PME-1 alone (right) were used as controls. Protein fractions were examined on sodium dodecyl sulfate–polyacrylamide gel electrophoresis (SDS–PAGE) and visualized by Coomassie blue Staining. Comigration of PME-1 with the PP2A-B56ε holoenzyme (c) and the PP2A-B56δ holoenzyme (d) were investigated as in (b).
-
Figure 1—figure supplement 1—source data 1
Source data for Figure 2—figure supplement 1b.
- https://cdn.elifesciences.org/articles/79736/elife-79736-fig1-figsupp1-data1-v2.zip
-
Figure 1—figure supplement 1—source data 2
Source data for Figure 2—figure supplement 1c.
- https://cdn.elifesciences.org/articles/79736/elife-79736-fig1-figsupp1-data2-v2.zip
-
Figure 1—figure supplement 1—source data 3
Source data for Figure 2—figure supplement 1d.
- https://cdn.elifesciences.org/articles/79736/elife-79736-fig1-figsupp1-data3-v2.zip
Figure 2 with 3 supplements
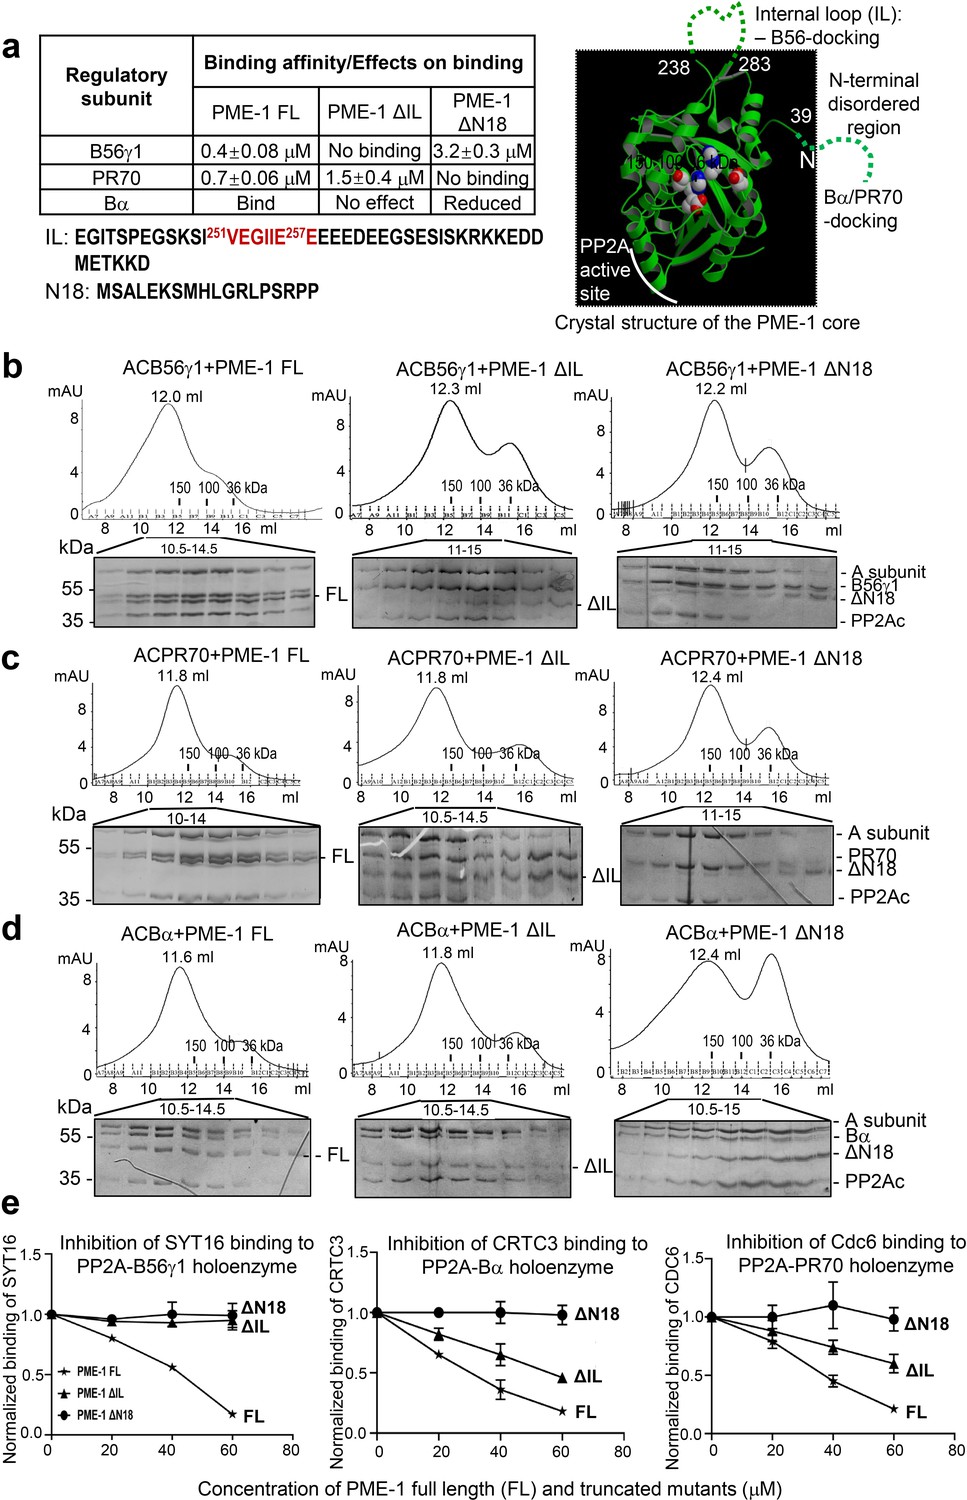
Mapping of PP2A methylesterase 1 (PME-1) interactions with protein phosphatase 2A (PP2A) regulatory subunits and holoenzymes.
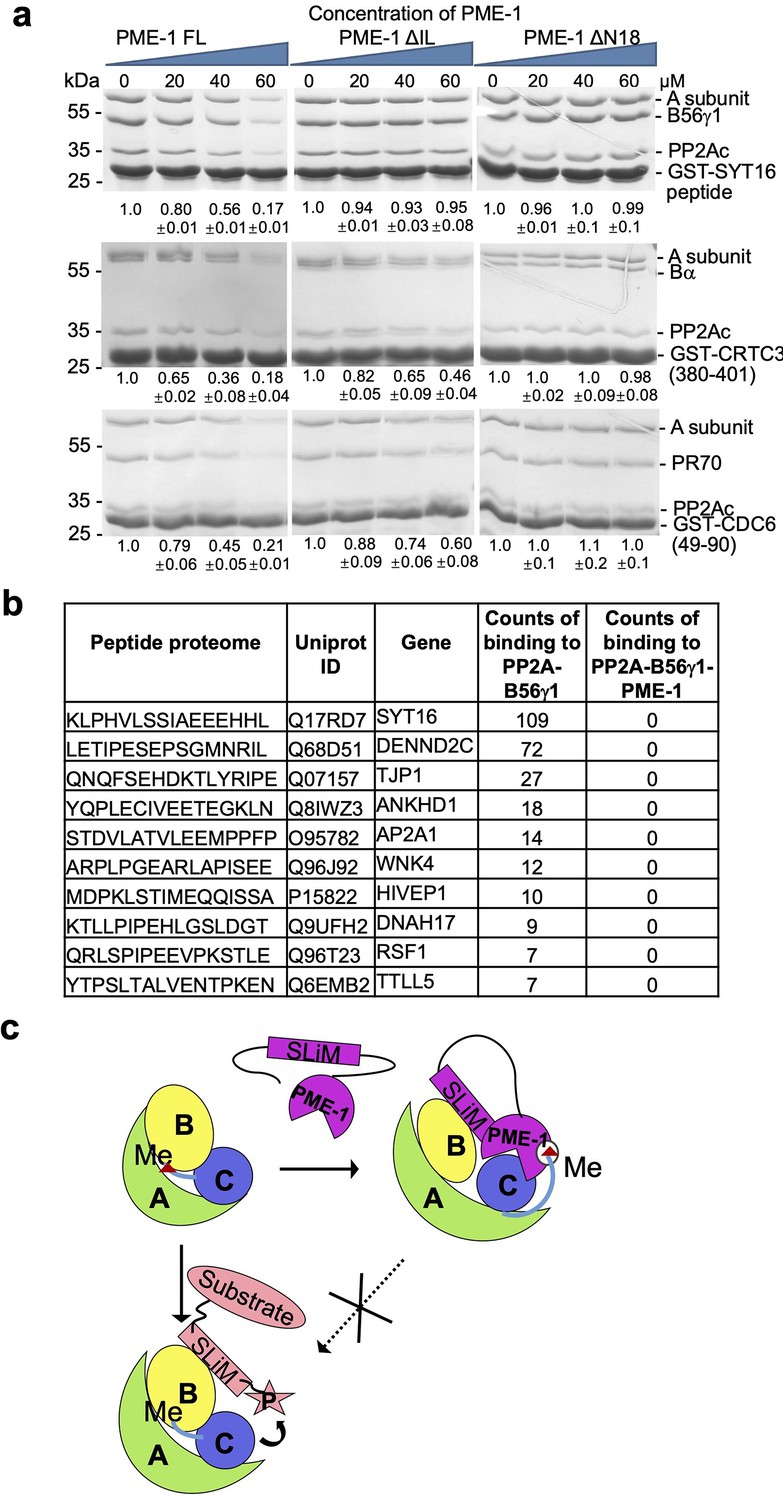
(a) Summary of mapping results (Figure 2—figure supplement 1) on the roles of PME-1 disordered regions in interactions with different PP2A regulatory subunits (left) and illustration of disordered regions (dashed lines) and their contributions on the crystal structure of the apo-PME-1 structured core (PDB code: 3C5V) (right). Sequences of PME-1 internal loop (IL) and N-terminal 18 residues (N18) were shown, highlighting a substrate-mimicking B56 short linear motif (SLiM) in IL (lower left). The boundary residue numbers for the disordered regions are labeled, and the PME-1 active site residues are highlighted in spheres (right). Comigration of PP2A-B56γ1 (b), PP2A-PR70 (c), or PP2A-Bα (d) holoenzymes with PME-1 FL, ΔIL, or ΔN18 over gel filtration chromatography. Protein fractions with the indicated ranges of elution volumes were analyzed by sodium dodecyl sulfate–polyacrylamide gel electrophoresis (SDS–PAGE) and visualized by Coomassie blue staining. The molecular weight standards for gel filtration chromatography are generated as in Figure 1b. (e) PME-1 concentration-dependent inhibition of substrate peptide binding to specific holoenzymes. Inhibition curves against GST-SYT16 (132KLPHVLSSIAEEEHH147L) binding to PP2A-B56γ1 (left), GST-CRTC3 (380SGPSRRRQPPVSPLTLSPGPE401A) binding to PP2A-Bα (middle), and GST-Cdc6 (49KALPLSPRKRLG DDNLCNTPHLPPCSPPKQGK KENGPPHSH90T) to PP2A-PR70 (right) by PME-1 FL, ΔN18, or ΔIL were generated from competitive pulldown data in Figure 2—figure supplement 3a. Values for all data points on the inhibition curves are mean ± standard deviation (SD) from three experimental repeats.
-
Figure 2—source data 1
Source data for Figure 2b.
- https://cdn.elifesciences.org/articles/79736/elife-79736-fig2-data1-v2.zip
-
Figure 2—source data 2
Source data for Figure 2c.
- https://cdn.elifesciences.org/articles/79736/elife-79736-fig2-data2-v2.zip
-
Figure 2—source data 3
Source data for Figure 2d.
- https://cdn.elifesciences.org/articles/79736/elife-79736-fig2-data3-v2.zip
-
Figure 2—source data 4
Source data for Figure 2e.
- https://cdn.elifesciences.org/articles/79736/elife-79736-fig2-data4-v2.zip
Figure 2—figure supplement 1
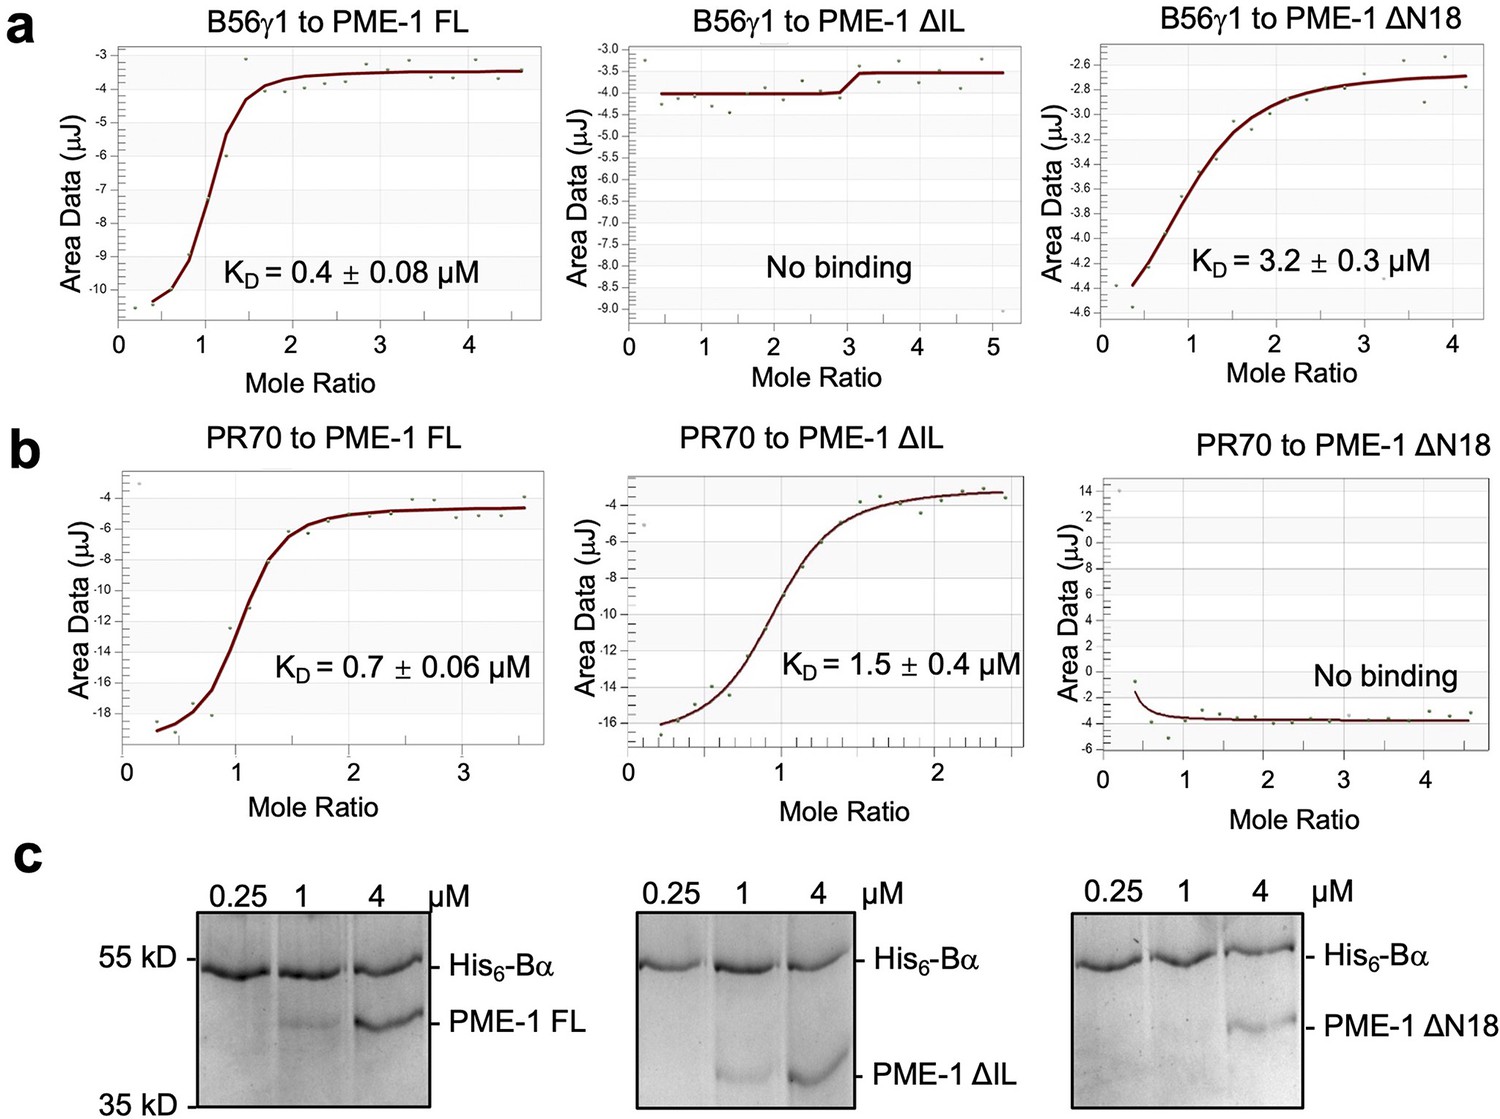
PP2A methylesterase 1 (PME-1) interactions with Bα and PR70 regulatory subunits and holoenzymes.
(a) Isothermal titration calorimetry (ITC) measured the binding affinities of B56γ1 to PME-1 FL, ΔIL, or ΔN18. (b) ITC measured the binding affinities of PR70 to PME-1 FL, ΔIL, or ΔN18. (c) Pulldown of PME-1 FL, ΔIL, or ΔN18 by His6-tagged Bα immobilized on Ni-NTA resin. The interaction was reduced by the truncation of N terminal 18 residues of PME-1.
-
Figure 2—figure supplement 1—source data 1
Source data for Figure 2—figure supplement 1c.
- https://cdn.elifesciences.org/articles/79736/elife-79736-fig2-figsupp1-data1-v2.zip
Figure 2—figure supplement 2
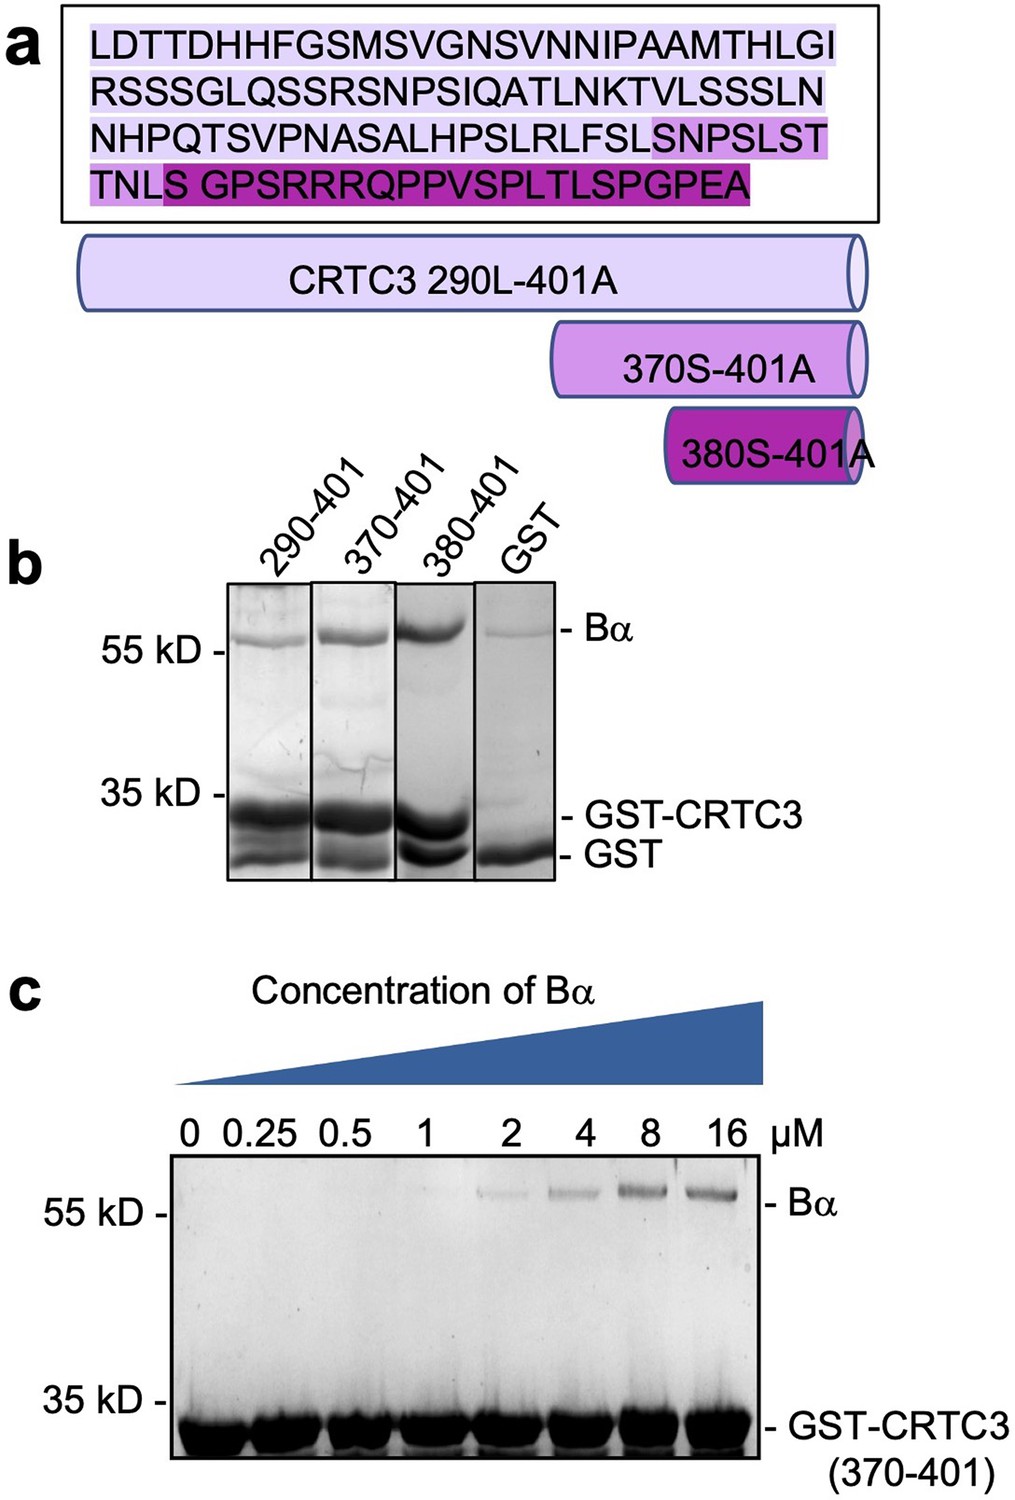
Mapping and characterization of CRTC3 peptide motif that interacts with Bα regulatory subunit.
(a) Amino acid sequence of CRTC3 290–401 and illustration of truncated fragments. (b) Pulldown of Bα by GST-tagged CRTC3 fragments. GST was used as control. The shortest fragment, GST-CRTC3 380–401, gives the best binding. (c) Pulldown of titrated concentrations of Bα by GST-tagged CRTC3 370–401 assessed the binding affinity between CRTC3 and Bα to be around 3 μM.
-
Figure 2—figure supplement 2—source data 1
Source data for Figure 2—figure supplement 2b.
- https://cdn.elifesciences.org/articles/79736/elife-79736-fig2-figsupp2-data1-v2.zip
-
Figure 2—figure supplement 2—source data 2
Source data for Figure 2—figure supplement 2c.
- https://cdn.elifesciences.org/articles/79736/elife-79736-fig2-figsupp2-data2-v2.zip
Figure 2—figure supplement 3
PP2A methylesterase 1 (PME-1) inhibits substrate binding to protein phosphatase 2A (PP2A) holoenzymes.
(a) Pulldown of PP2A-B6γ1 (top), PP2A-Bα (middle), and PP2A-PR70 (bottom) holoenzymes via GST-tagged substrate peptides (GST-SYT16, GST-CRTC3, and GST-Cdc6) in the present and absence of increasing concentrations of PME-1 FL, ΔN18, or ΔIL. Proteins associated with Glutathione-Sepharose 4B (GS4B) resins were examined by sodium dodecyl sulfate–polyacrylamide gel electrophoresis (SDS–PAGE) and visualized by Coomassie blue staining. The intensity of the regulatory subunits in the bound holoenzyme was normalized to the GST-tagged substrate peptide, followed by normalization to the value in the absence of PME-1. Mean ± standard deviation (SD) were calculated from three independent experiments. Quantification using the scaffold A-subunit in the bound holoenzyme gave similar results. (b) Frequency of disordered motifs bound to the PP2A-B56γ1 holoenzyme in the presence and absence of PME-1 identified by peptide phage display of disordered human proteome. (c) A model illustrating how the substrate-mimicking short linear motif (SLiM) in PME-1 engages in holoenzyme interactions and blocks substrate recognition.
-
Figure 2—figure supplement 3—source data 1
Source data for Figure 2—figure supplement 3a.
- https://cdn.elifesciences.org/articles/79736/elife-79736-fig2-figsupp3-data1-v2.zip
Figure 3 with 4 supplements
Cryoelectron microscopy (cryo-EM) structure of the protein phosphatase 2A (PP2A)-B56γ1–PP2A methylesterase 1 (PME-1) complex.
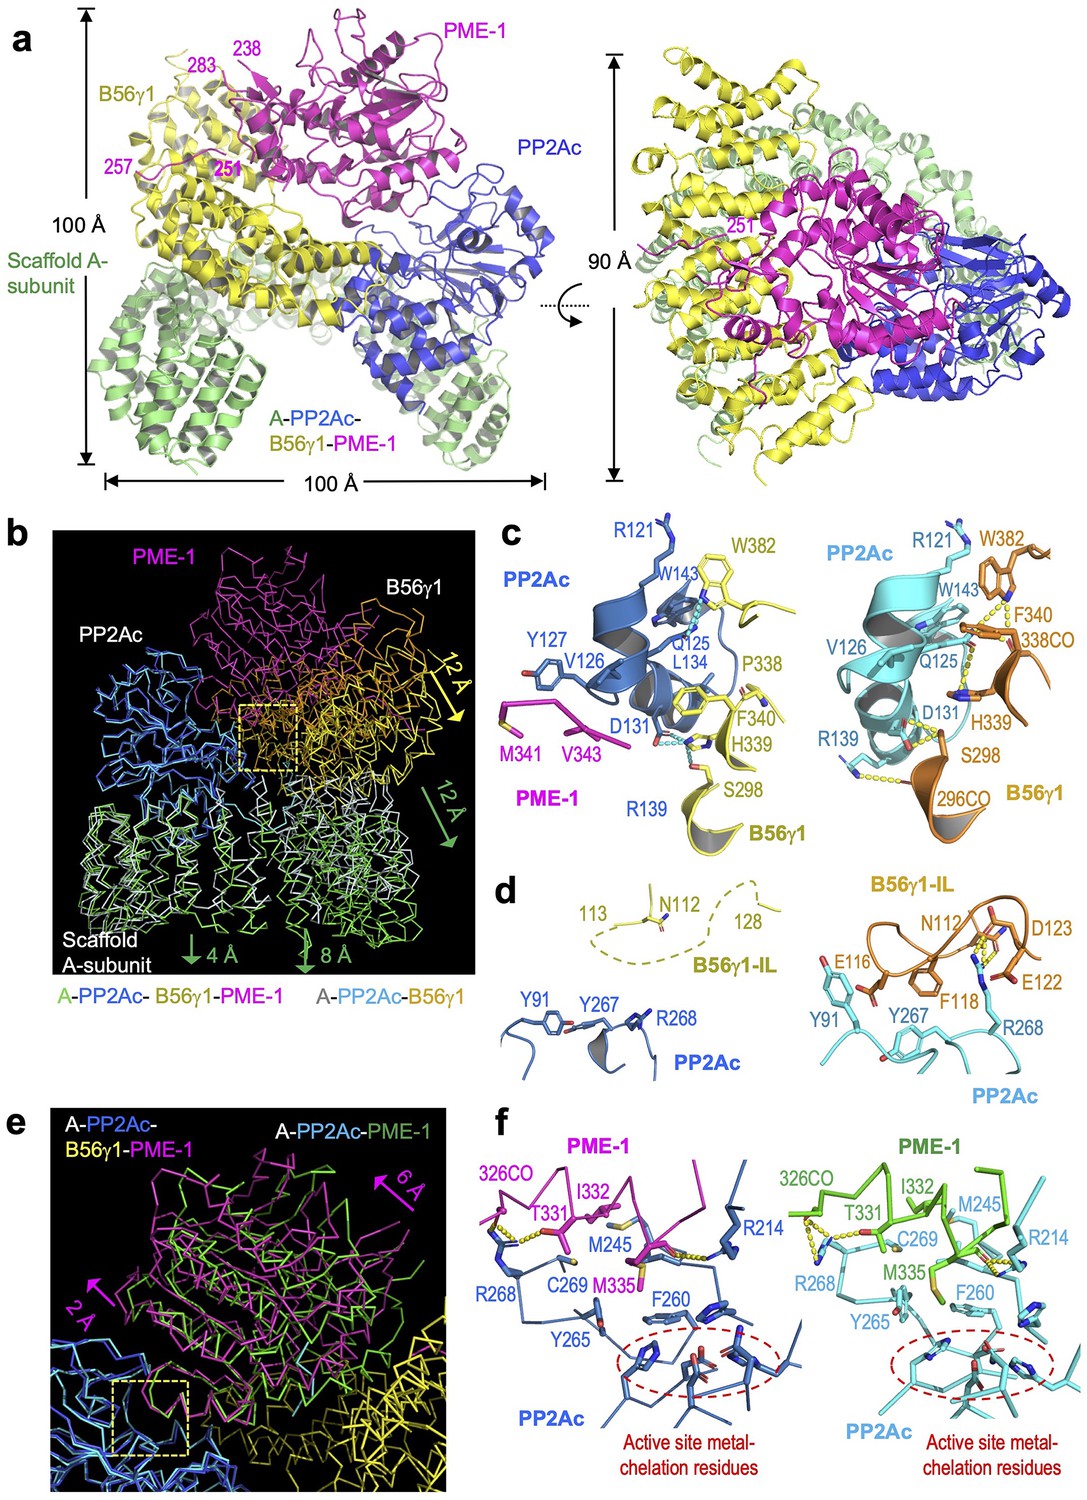
(a) Overall structure of the PP2A-B56γ1–PME-1 complex. Two perpendicular views are shown. The A-subunit, PP2Ac, B56γ1, and PME-1 are shown in cartoon and colored green, blue, yellow, and magenta, respectively. The boundary residue numbers of the disorderd PME-1 internal loop (238 and 283) and the visible B56 short linear motif (SLiM) within it (251 and 257) were labeled. (b) Structural comparison of the PP2A-B56γ1–PME-1 complex and the PP2A-B56γ1 holoenzyme (PDB code: 2NPP), showing the overall structures overlaid via PP2Ac. (c, d) Side-by-side closeup views of the B56γ1/PP2Ac interfaces for the B56γ1 core and internal loop, respectively. (e) Structural comparison of the PP2A-B56γ1–PME-1 complex and the PP2A core enzyme–PME-1 complex (PDB code: 3C5W), showing the overall structures overlaid via PP2Ac. (f) Side-by-side closeup views of the PP2A active site–PME-1 interfaces. For b–f, models are shown in ribbon for overall structures and cartoon with residues in stick for closeup views. The PP2A-B56γ1–PME-1 complex is colored as in a. The A-subunit, PP2Ac, and B56γ1 in the holoenzyme are colored helium, cyan, and orange, respectively. PP2Ac and PME-1 in the PP2A core enzyme–PME-1 complex are colored cyan and green, respectively.
Figure 3—figure supplement 1

Cryoelectron microscopy (cryo-EM) data processing and model building.
(a) Representative micrograph. (b) 2D classes selected for model building. (c) Gold-standard Fourier shell correlation (FSC) curves of the final 3D reconstruction from CryoSPARC. (d) Final reconstructions colored based on local resolution estimated by CryoSPARC. (e) Flow chart of cryo-EM data processing and model building.
Figure 3—figure supplement 2
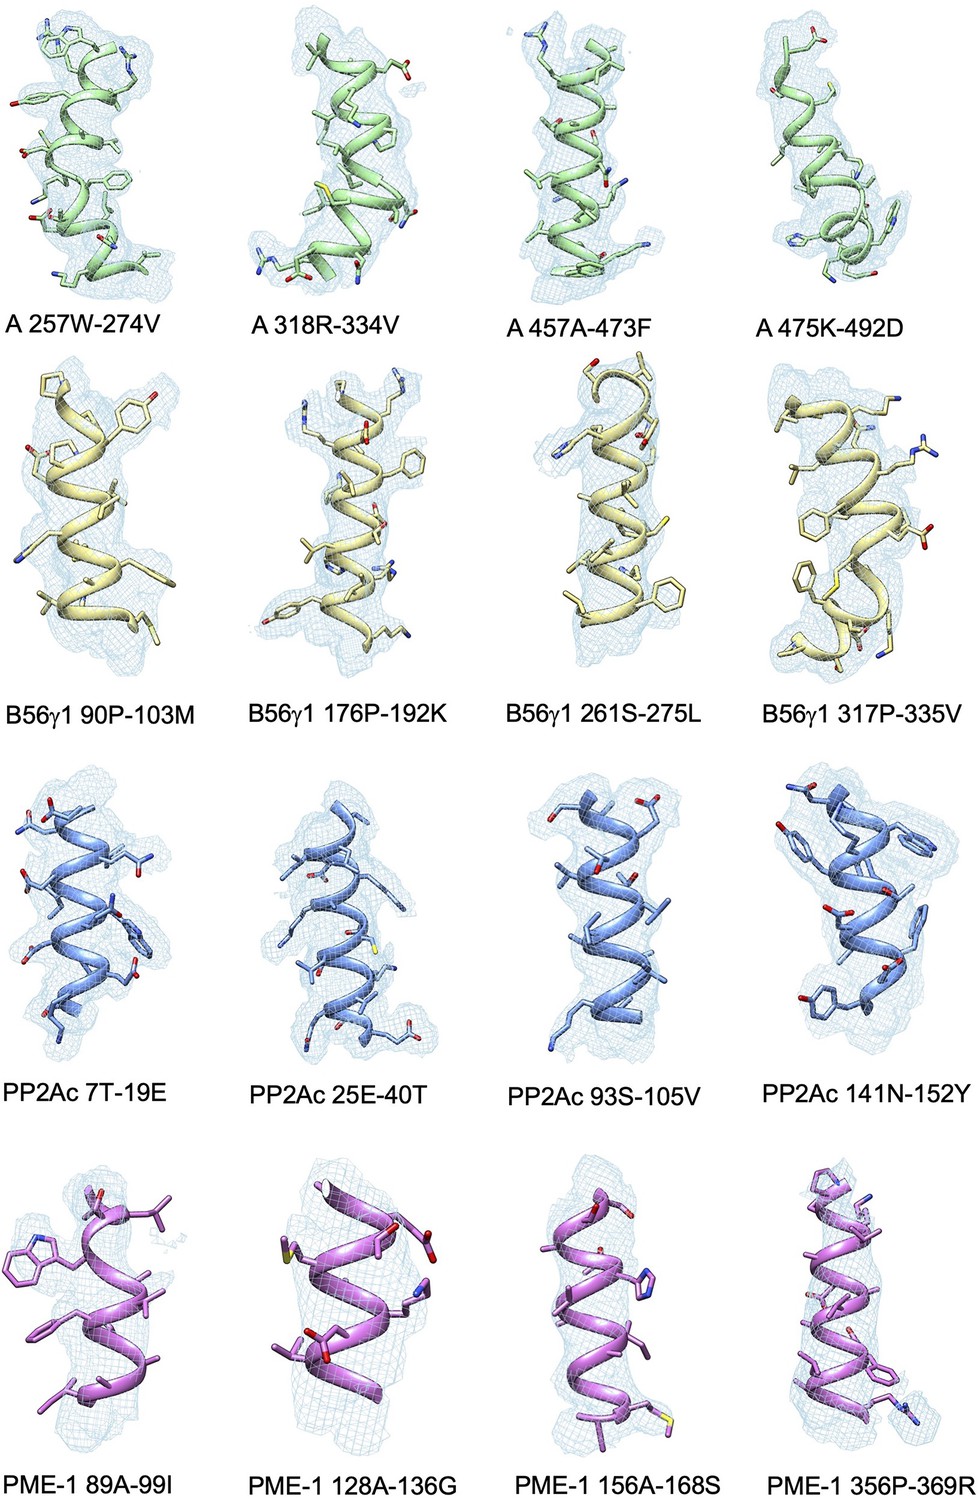
Representative cryoelectron microscopy (cryo-EM) density maps for the structural fragments in the A-subunit, B56γ1, PP2Ac, and PP2A methylesterase 1 (PME-1) of the protein phosphatase 2A (PP2A)-B56γ1–PME complex.
Figure 3—figure supplement 3
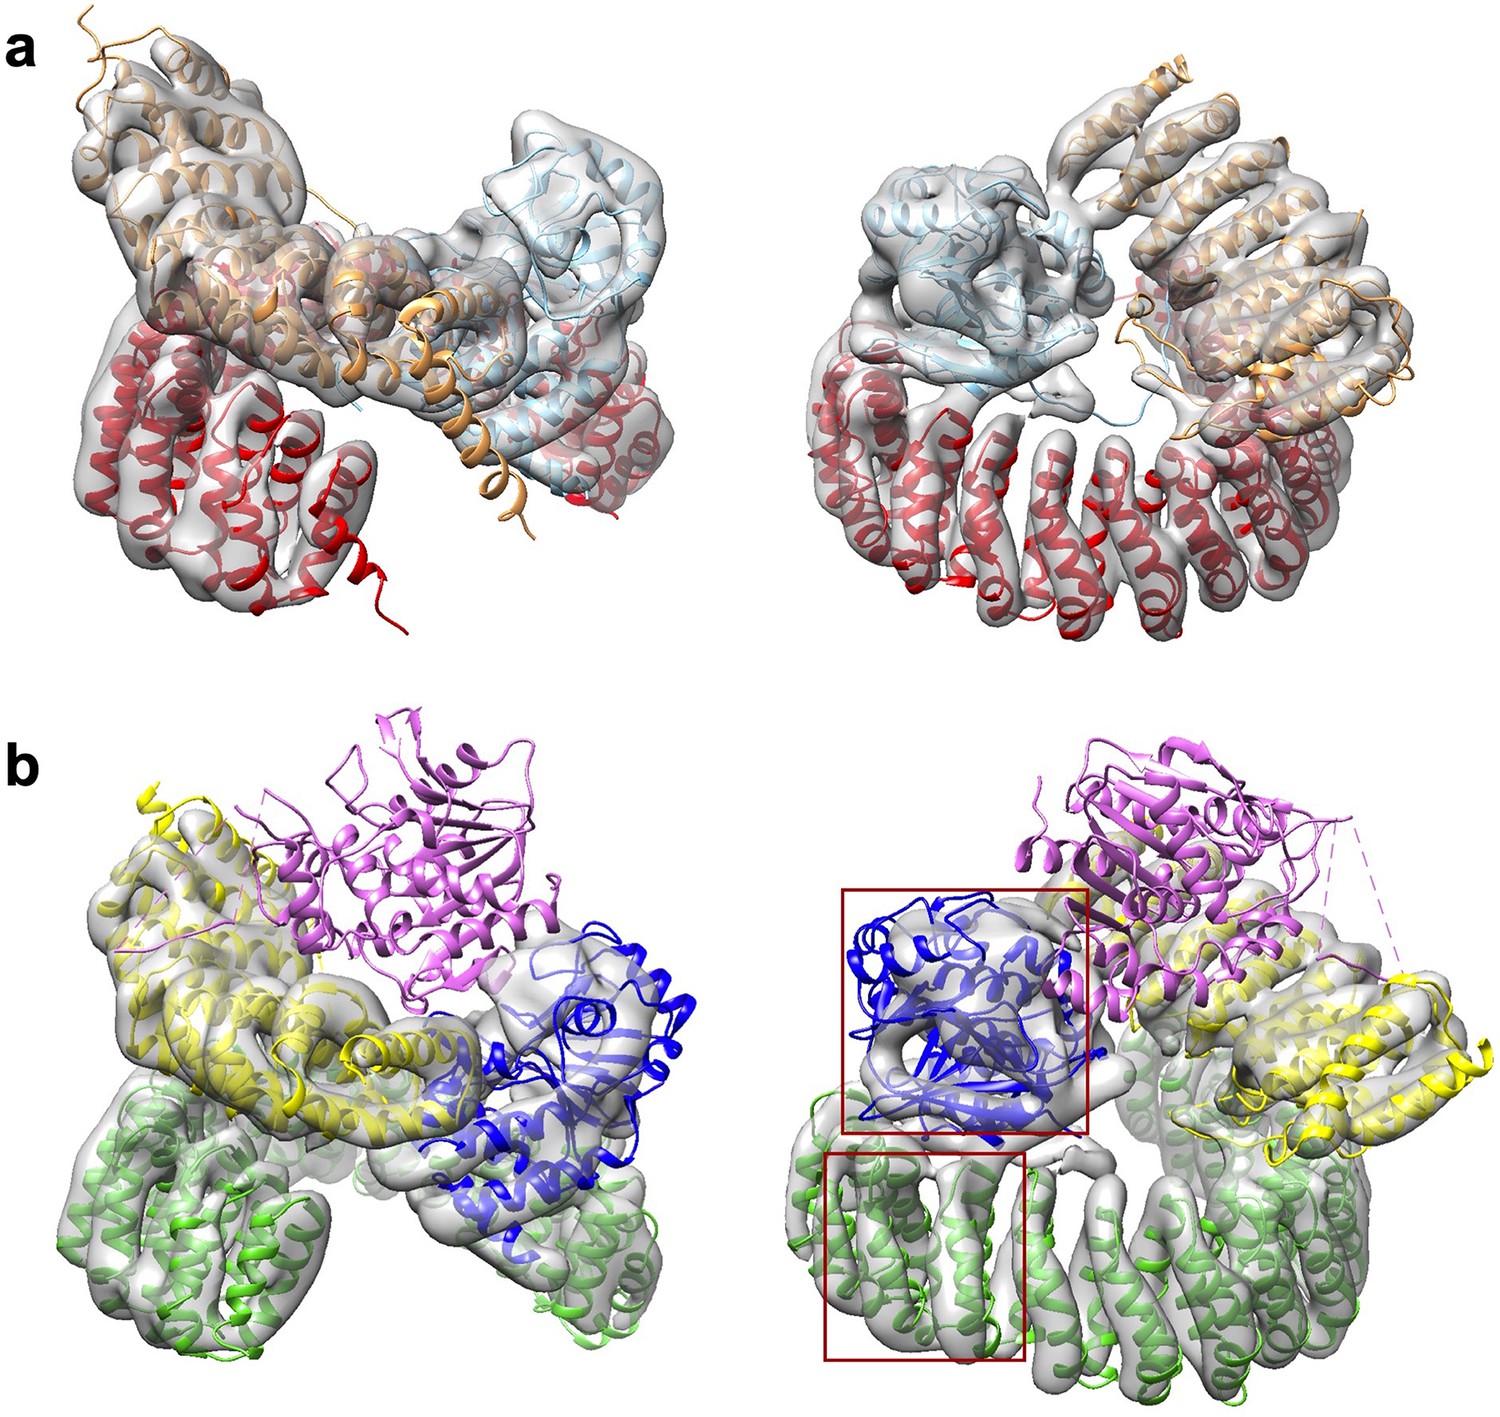
A minor 3D class gives a low-resolution model for the protein phosphatase 2A (PP2A)-B56γ1 holoenzyme.
(a) Model fit of the PP2A-B56γ1 holoenzyme (PDB code: 2NPP) to the map. The scaffold A-subunit, PP2Ac, and B56γ1 are colored red, cyan, and orange, respectively. (b) Poor model fit of the PP2A-B56γ1–PP2A methylesterase 1 (PME-1) complex to the map. The density for PME-1 is missing. The poor fitting of the A-subunit and PP2Ac is highlighted in red squares. The scaffold A-subunit, PP2Ac, B56γ1, and PME-1 are colored green, blue, yellow, and magenta, respectively. For a, b, structural models are in cartoon and are shown in side (left) and top (right) views. The map is colored gray and shown in transparent contour.
Figure 3—figure supplement 4
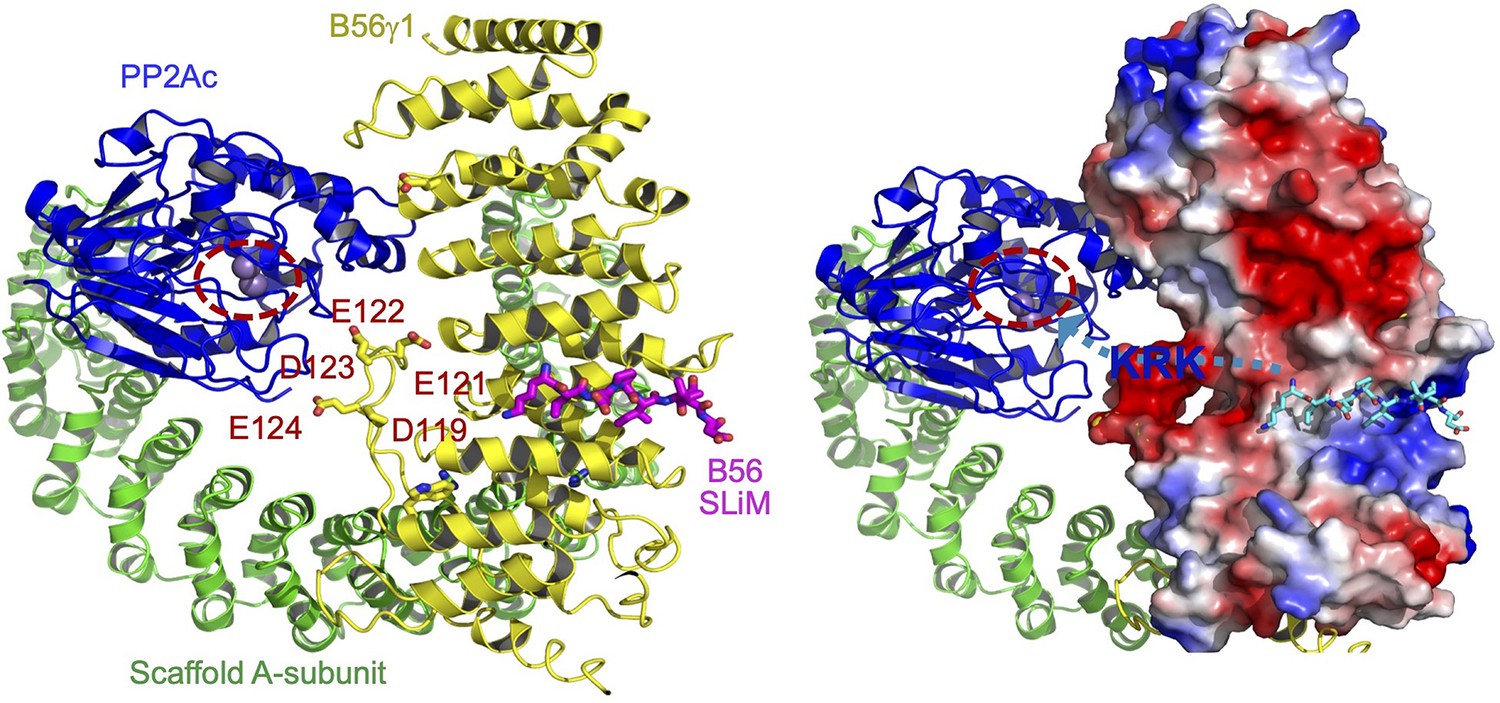
Illustration of the role of B56 internal loop in facilitating substrate entry to the holoenzyme active site.
The structural model of protein phosphatase 2A (PP2A)-B56 holoenzyme bound to B56 short linear motif (SLiM) (left) highlighted the negatively charged residues in the internal loop of B56γ1 near the phosphatase active site. The A-subunit, PP2Ac, and B56γ1 are shown in cartoon and colored green, blue, and yellow, respectively. B56 SLiM is shown in sticks and colored magenta. The phosphatase active site is highlighted by dashed circle. In the model on the right shows the electrostatic potential of B56γ1. B56 SLiM is colored cyan for a better contrast. The path for substrate entry is shown by a cyan dashed line with an arrow pointing to the phosphatase active site. The positive patch (KRK as an example in blue fond) between B56 SLiM and the phosphorylation site would interact with the negatively charged surface defined by the B56 internal loop and help orient the phosphorylation site toward the holoenzyme active site.
Figure 4
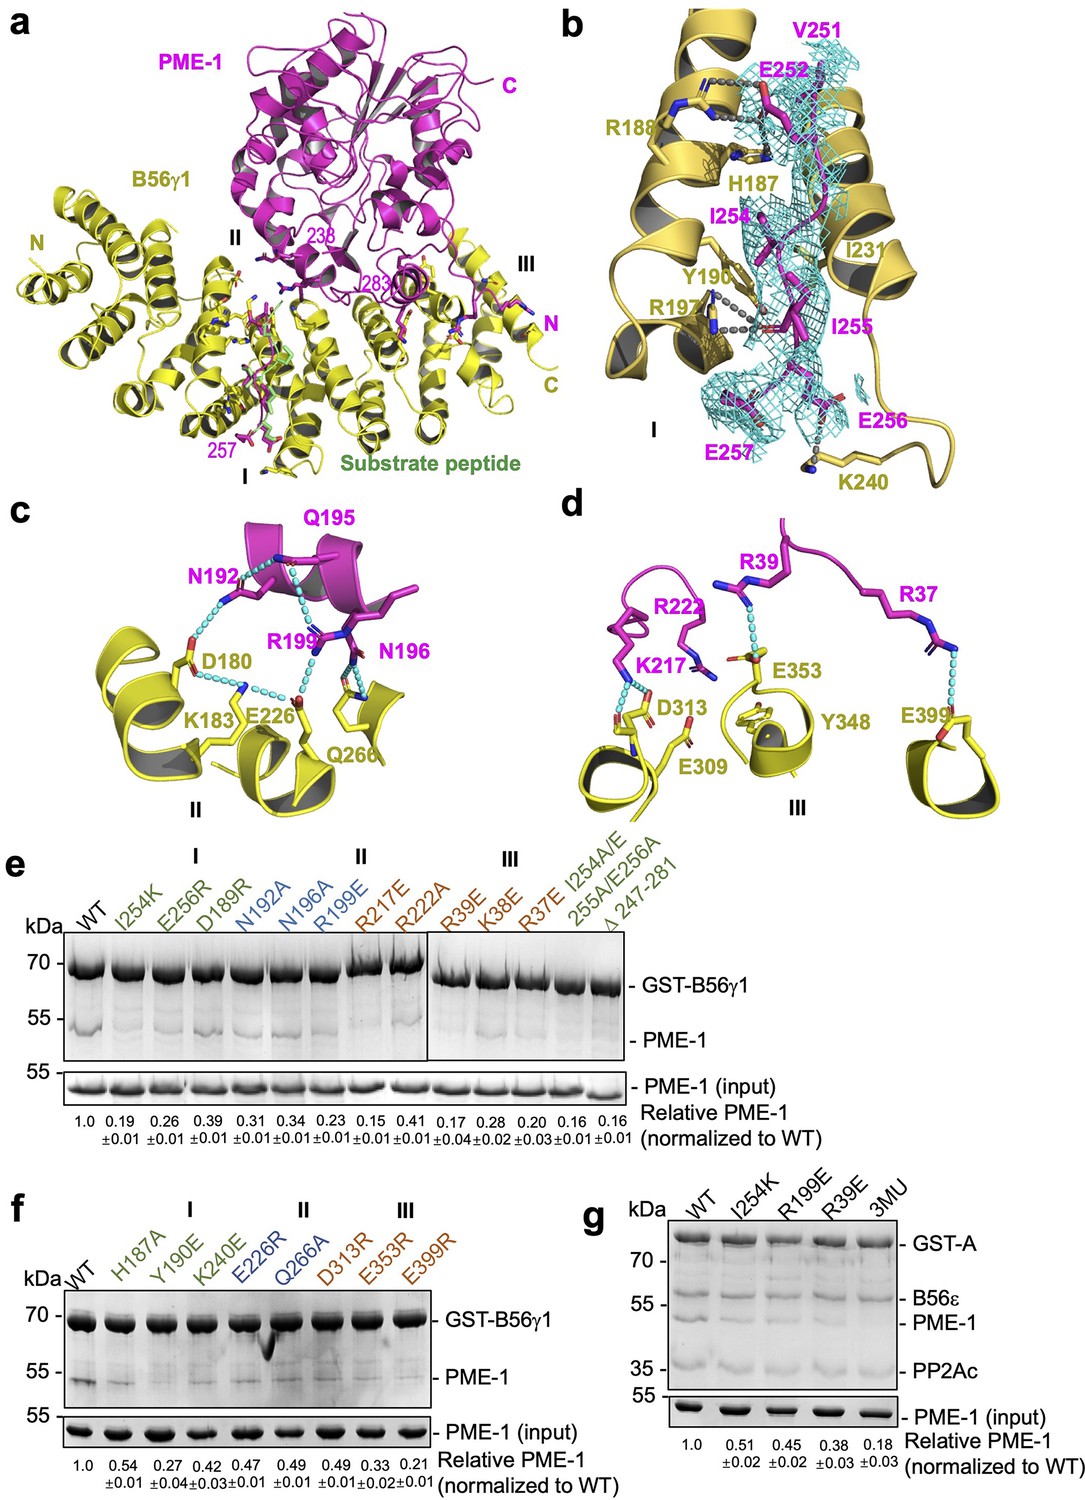
B56–PP2A methylesterase 1 (PME-1) interfaces.
(a) An overview of interactions between B56γ1 (yellow) and PME-1 (magenta). The short linear motif (SLiM) in the PME-1 internal loop was perfectly overlaid with the BubR1 substrate peptide (669LDPIIE675D) from the B56γ1–BubR1 complex (PBD code: 5JJA) aligned by B56γ1. (b–d) Closeup views of interaction interfaces I, II, and III between B56γ1 and PME-1. B56γ1 and PME-1 residues are shown in stick and colored yellow and magenta, respectively. The cryoelectron microscopy (cryo-EM) electron density map for the SLiM in PME-1 was colored cyan and shown at 4 Å. (e) Pulldown of PME-1 WT or mutants by GST-B56γ1. (f) Pulldown of PME-1 by GST-B56γ1 bearing WT or mutant B56γ1. (g) Pulldown of PME-1 WT or mutants by the GST-tagged protein phosphatase 2A (PP2A)-B56ε holoenzyme. (e–g) GST-tagged proteins were immobilized on Glutathione-Sepharose 4B (GS4B) resins before pulldown. Proteins associated with GS4B resins after pulldown were examined by sodium dodecyl sulfate–polyacrylamide gel electrophoresis (SDS–PAGE) and visualized by Coomassie blue staining. The intensities of bound PME-1 were first normalized to the immobilized GST-tagged proteins and then normalized against the WT (1.0). The quantified results of three independent experiments were shown as mean ± standard deviation (SD) at the bottom of the gel.
-
Figure 4—source data 1
Source data for Figure 4e.
- https://cdn.elifesciences.org/articles/79736/elife-79736-fig4-data1-v2.zip
-
Figure 4—source data 2
Source data for Figure 4f.
- https://cdn.elifesciences.org/articles/79736/elife-79736-fig4-data2-v2.zip
-
Figure 4—source data 3
Source data for Figure 4g.
- https://cdn.elifesciences.org/articles/79736/elife-79736-fig4-data3-v2.zip
Figure 5 with 2 supplements

Different effects of PP2A methylesterase 1 (PME-1) inhibitor and B56–PME-1 interface mutations.
(a) The time-dependent demethylation curves of protein phosphatase 2A (PP2A)-B56γ1 holoenzyme (upper left), the AC dimeric core enzyme (upper right), PP2A-Bα holoenzyme (lower left), and PP2A-PR70 holoenzyme (lower right) by PME-1 WT and mutant (3MU). The demethylation curves are plotted based on the quantified data in Figure 5—figure supplement 1. (b) Pulldown of PME-1 by GST-tagged PP2A core enzyme or PP2A-Bα/PP2A-B56ε/PP2A-PR70 holoenzymes in the presence or absence of PME-1 inhibitor, ABL127. Proteins bound to Glutathione-Sepharose 4B (GS4B) resins were examined and quantified similar to Figure 4e. The intensities of bound PP2A were first normalized to the immobilized GST-tagged proteins and then normalized to control (1.0). (c) Illustration of the A–B56γ1 interface and the PP2Ac tail from the overlaid holoenzyme. The cryoelectron microscopy (cryo-EM) map was shown at 3.5 Å. The electron density map for the A-subunit and B56γ1 was shown (left). The lack of cryo-EM electron density for the PP2Ac tail that occupies the A–B56 interface in the overlaid holoenzyme (right) supports the notion that the PP2Ac tail disappears from this interface once the holoenzyme is bound to PME-1. A-subunit, B56γ1, and electron density map are colored as in Figures 3 and 4. The PP2Ac tail from the holoenzyme is shown in stick and colored orange. (d) The latch-to-induce-and-lock model for PME-1 interactions with and methylesterase activation toward PP2A holoenzymes. In brief, PME-1 disordered motifs, including substrate-mimicking SLiM, latch to the regulatory subunit, enabling holoenzyme conformational changes, PME-1 interactions with PP2Ac, and the movement of PP2Ac tail from the holoenzyme interface to the PME-1 active site.
-
Figure 5—source data 1
Source data for Figure 5a.
- https://cdn.elifesciences.org/articles/79736/elife-79736-fig5-data1-v2.zip
-
Figure 5—source data 2
Source data for Figure 5b.
- https://cdn.elifesciences.org/articles/79736/elife-79736-fig5-data2-v2.zip
Figure 5—figure supplement 1

Time course of protein phosphatase 2A (PP2A) holoenzyme demethylation.
The time-dependent demethylation of PP2A-B56γ1 (a), AC dimeric core enzyme (b), PP2A-Bα holoenzyme (c), and PP2A-PR70 (d) by PP2A methylesterase 1 (PME-1) WT and 3MU mutant. The intensity of demethylated PP2Ac was first normalized over the signal of the A-subunit and then normalized to PP2Ac with methyl groups completely removed by NaOH.
-
Figure 5—figure supplement 1—source data 1
Source data for Figure 5—figure supplement 1a.
- https://cdn.elifesciences.org/articles/79736/elife-79736-fig5-figsupp1-data1-v2.zip
-
Figure 5—figure supplement 1—source data 2
Source data for Figure 5—figure supplement 1b.
- https://cdn.elifesciences.org/articles/79736/elife-79736-fig5-figsupp1-data2-v2.zip
-
Figure 5—figure supplement 1—source data 3
Source data for Figure 5—figure supplement 1c.
- https://cdn.elifesciences.org/articles/79736/elife-79736-fig5-figsupp1-data3-v2.zip
-
Figure 5—figure supplement 1—source data 4
Source data for Figure 5—figure supplement 1d.
- https://cdn.elifesciences.org/articles/79736/elife-79736-fig5-figsupp1-data4-v2.zip
Figure 5—figure supplement 2
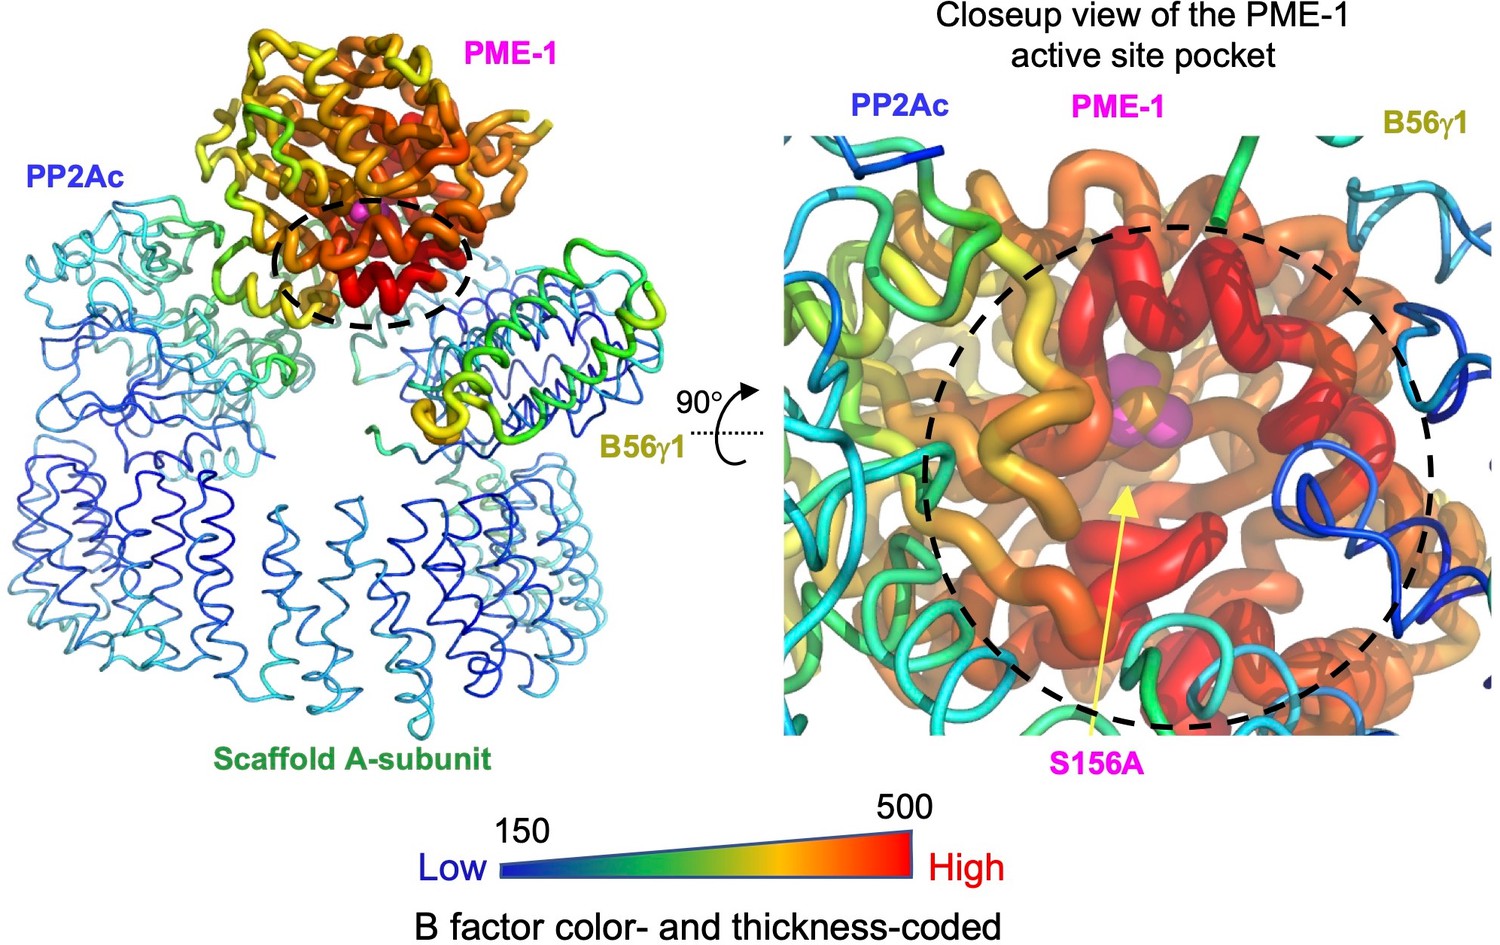
Structural model illustrating B factors of the cryoelectron microscopy (cryo-EM) structure of the protein phosphatase 2A (PP2A)-B56γ1–PP2A methylesterase 1 (PME-1) complex.
The overall view of the entire structure (left) and the closeup view of the PME-1 active site pocket (right) are shown.
Figure 6 with 1 supplement
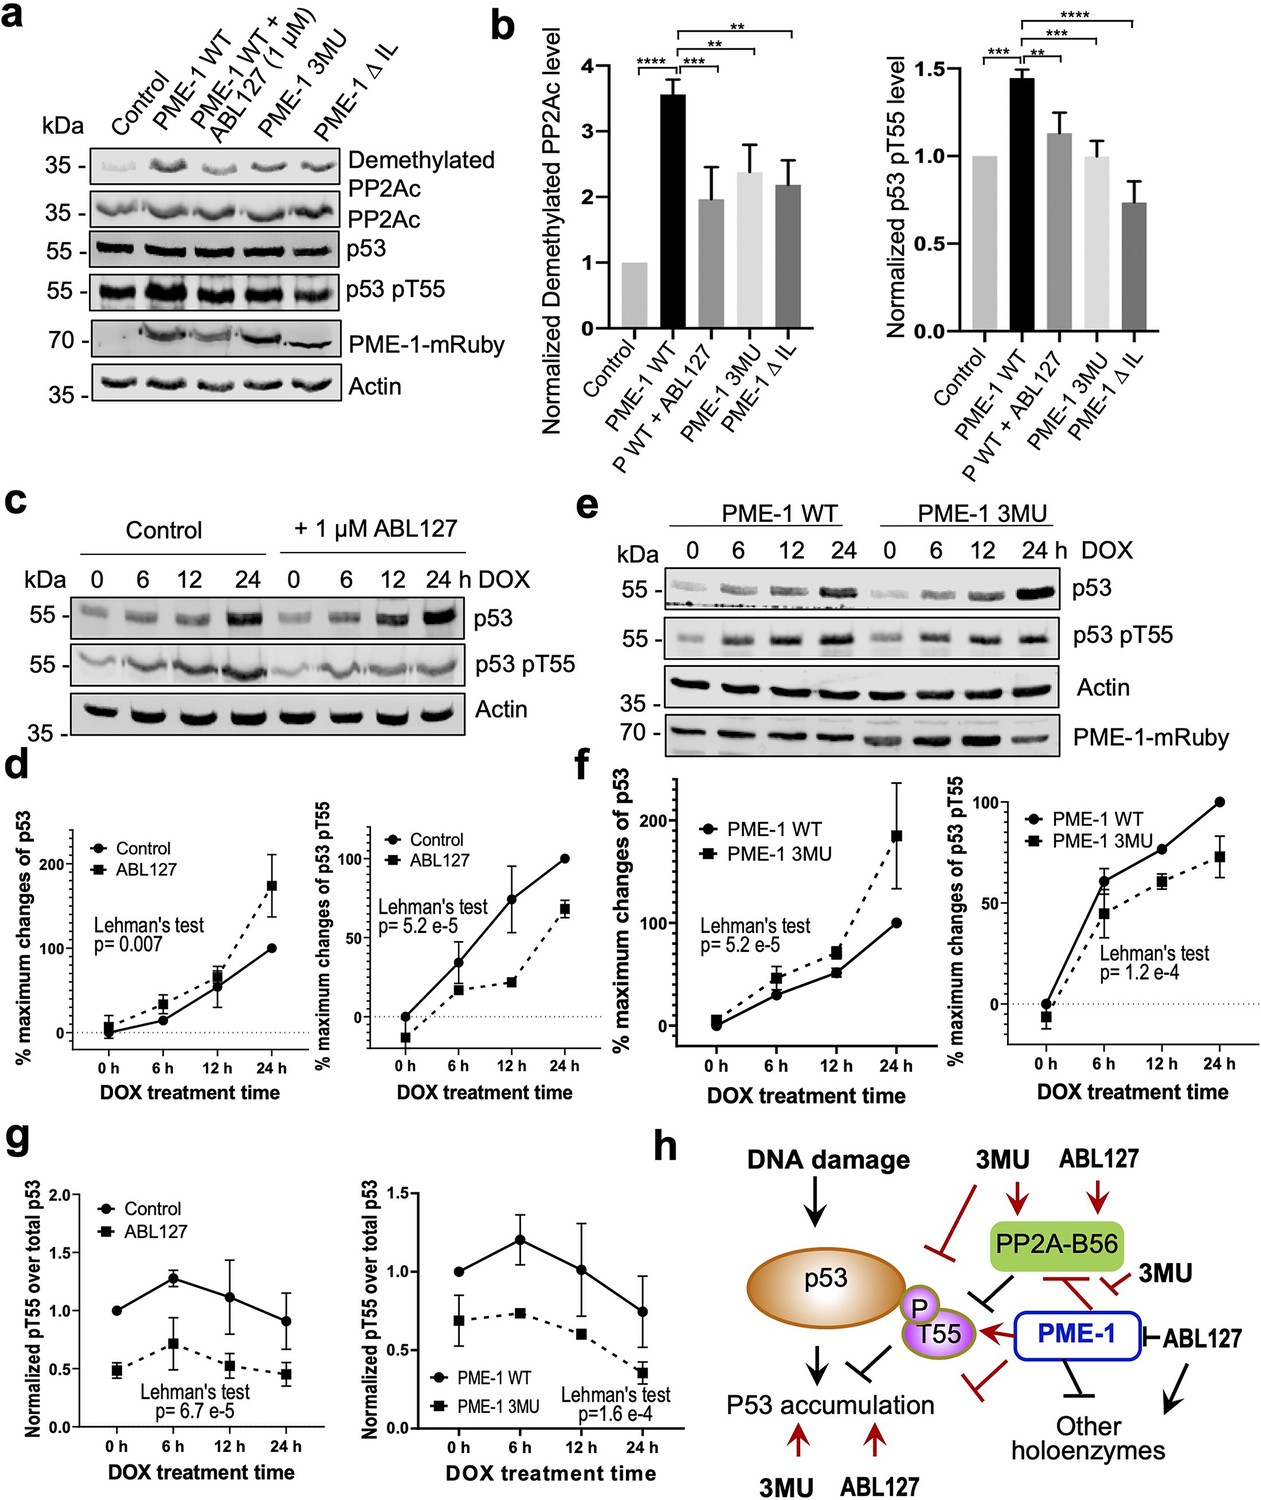
PP2A methylesterase 1 (PME-1) function in p53 signaling.
(a) Effects of PME-1 inhibitor versus B56 interface mutations in PME-1 (3MU) on p53 phosphorylation at Thr55 and cellular PP2Ac methylation. The mock vector, wild-type, or mutant PME-1 were transfected into 293T cells, followed by treatment by ABL127 as indicated. Total cell lysates were examined by western blot. The representative results from three repeats were shown. (b) Cellular levels of p53 pThr55 and demethylated PP2Ac in (a) were normalized against actin loading control, and mean ± standard deviation (SD) was calculated from three independent experimental repeats. One-way analysis of variance (ANOVA) with Tukey’s multiple comparisons was used to determine the difference between independent groups (**p < 0.01; ***p < 0.001; ****p < 0.0001). (c) Effects of PME-1 inhibitor on p53 accumulation and phosphorylation at T55 during DNA damage response (DDR). 293T cells were treated with DOX (2 μg/ml) in the presence of ABL127 (1 μM) or Dimethyl sulfoxide (DMSO) for indicated durations. Total p53 and pThr55 were detected at indicated time points. The representative results from three repeats were shown. (d) Time-dependent increases in p53 total protein and pThr55 were first quantified as the percentage of maximum changes in each experimental repeat in c and mean ± SD were then calculated from three repeats and used for data plotting. (e) Effects of PME-1 3MU mutations on p53 accumulation and phosphorylation at T55 during DDR. 293T Cells were treated with DOX (2 μg/ml) after 48 hr transfection with wild-type or mutant PME-1. Total p53 and pThr55 were detected at indicated time points. The representative results from three repeats were shown. (f) Time-dependent increases in p53 total protein and pThr55 were quantified as in d using data in e. (g) Ratios of pThr55 over total p53 during DDR calculated from data in c (left) and e (right). Mean ± SD were calculated from three independent experimental repeats. (d–g) The difference between curves was evaluated using Lehman’s test. (h) Illustration of p53 signaling during DDR and roles of PME-1 in suppressing p53 accumulation by downregulating protein phosphatase 2A (PP2A)-B56 holoenzyme activities toward the inhibitory phosphorylation at Thr55 of p53. 3MU selectively abolishes the PME-1 activities toward the PP2A-B56 holoenzymes. Thus, its function in enhancing p53 accumulation and suppressing pThr55 in p53 is mediated by its specific function to alleviate PME-1 activities toward PP2A-B56 holoenzymes. ABL127 blocks total PME-1 activities toward all PP2A holoenzymes, including the PP2A-B56 holoenzymes, and thus affects total p53 and pThr55 similar to 3MU.
-
Figure 6—source data 1
Source data for Figure 6a.
- https://cdn.elifesciences.org/articles/79736/elife-79736-fig6-data1-v2.zip
-
Figure 6—source data 2
Source data for Figure 6b.
- https://cdn.elifesciences.org/articles/79736/elife-79736-fig6-data2-v2.zip
-
Figure 6—source data 3
Source data for Figure 6c.
- https://cdn.elifesciences.org/articles/79736/elife-79736-fig6-data3-v2.zip
-
Figure 6—source data 4
Source data for Figure 6d.
- https://cdn.elifesciences.org/articles/79736/elife-79736-fig6-data4-v2.zip
-
Figure 6—source data 5
Source data for Figure 6e.
- https://cdn.elifesciences.org/articles/79736/elife-79736-fig6-data5-v2.zip
-
Figure 6—source data 6
Source data for Figure 6f.
- https://cdn.elifesciences.org/articles/79736/elife-79736-fig6-data6-v2.zip
-
Figure 6—source data 7
Source data for Figure 6g.
- https://cdn.elifesciences.org/articles/79736/elife-79736-fig6-data7-v2.zip
Figure 6—figure supplement 1
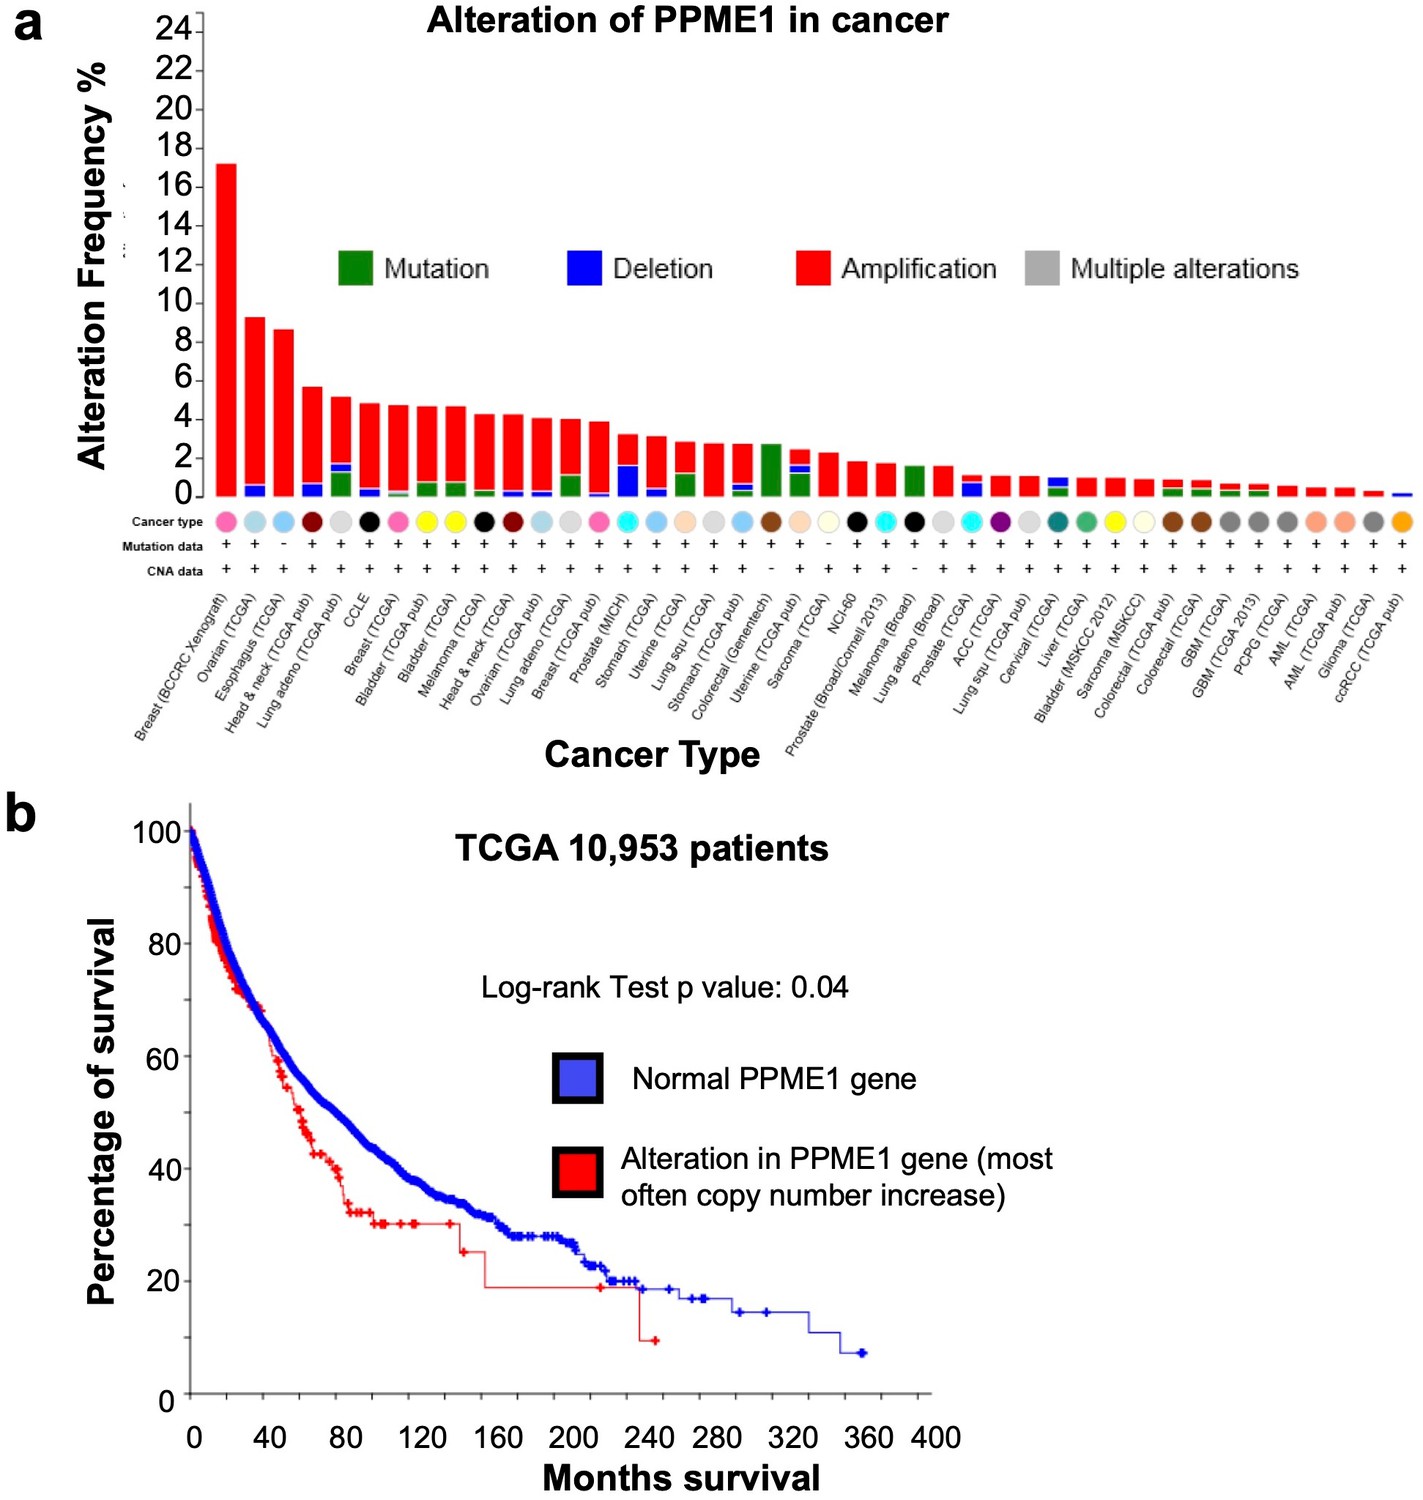
Amplification and mutation of the PPME-1 gene that encodes PP2A methylesterase 1 (PME-1) in cancer are associated with poorer survival outcome.
(a) The PPME-1 gene is frequently altered and amplified in multiple types of cancers (cbioportal.org). (b) The survival data from 10,953 cancer patients from the The Cancer Genome Atlas (TCGA) database indicated that PME-1 amplification is associated with poorer survival outcomes with a p value of 0.04.
Figure 7

Illustration of the signaling loop of protein phosphatase 2A (PP2A) holoenzyme biogenesis and recycling and the multifaceted roles of PP2A methylesterase 1 (PME-1), including demethylation of the PP2A core enzyme to suppress holoenzyme assembly, inhibition of holoenzyme substrate recognitions, and demethylation of PP2A holoenzymes.
The latter provides a mechanism for priming PP2A holoenzymes for demethylation-dependent decommissioning.
Tables
Table 1
Cryoelectron and 36 are marked as headers microscopy (cryo-EM) data collection, model building, and structure refinements for the protein phosphatase 2A (PP2A)-B56γ1–PP2A methylesterase 1 (PME-1) complex.
| Summary of data collection and model statistics | |
|---|---|
| Data collection and processing | |
| Number of grids used | 1 |
| Grid type | Quantifoil 300 mesh R 1.2/1/3 with ultrathin carbon |
| Microscope | Titan Krios |
| Detector | Gatan K3 Summit |
| Voltage (kV) | 300 |
| Electron dose (e−/Å2) | 50.8 |
| Defocus range (μm) | 1.5–2.3 |
| Pixel size (A) | 1.059 |
| Number of movies | 7529 |
| Number of particles | 276,737 |
| PDB | 7SOY |
| EMD | EMD-25363 |
| Symmetry | C1 |
| Map resolution (Å) | 3.4 |
| FSC threshold | 0.143 |
| Refinement (Phenix) | |
| Initial model used (PDB code) | 3C5W, 2NPP |
| Resolution (Å) | 3.4 |
| Map CC | 0.84 |
| Map sharpening B factor (Å2) | −10 |
| Model composition | |
| Number of chains | 4 |
| Nonhydrogen atoms | 12180 |
| Protein residues/waters | 1529/0 |
| Ligands/metals | 0/0 |
| R.m.s. deviations | |
| Bonds length (Å) | 0.003 |
| Bonds angle (°) | 0.572 |
| Validation | |
| MolProbity score | 1.66 |
| Clashscore | 13.36 |
| Rotamer outerliers (%) | 0 |
| C-Beta outerliers (%) | 0 |
| Ramachandran plot statistics (%) | |
| Favored | 98.42 |
| Allowed | 1.58 |
| Outlier | 0 |
Additional files
Download links
A two-part list of links to download the article, or parts of the article, in various formats.
Downloads (link to download the article as PDF)
Open citations (links to open the citations from this article in various online reference manager services)
Cite this article (links to download the citations from this article in formats compatible with various reference manager tools)
Coupling to short linear motifs creates versatile PME-1 activities in PP2A holoenzyme demethylation and inhibition
eLife 11:e79736.
https://doi.org/10.7554/eLife.79736


