Innate immune signaling in trophoblast and decidua organoids defines differential antiviral defenses at the maternal-fetal interface
- Department of Molecular Genetics and Microbiology, Duke University School of Medicine, United States
- Duke Human Vaccine Institute, Duke University, United States
- Division of Maternal-Fetal Medicine, Division of Reproductive Infectious Disease, Department of Obstetrics, Gynecology and Reproductive Sciences, University of Pittsburgh Medical Center (UPMC), United States
- Magee Womens Research Institute, United States
- Department of Pediatrics, Weill Cornell Medical Center, Duke University Medical Center, United States
- Division of Maternal-Fetal Medicine, Department of Obstetrics and Gynecology, Duke University Medical Center, United States
Figures
Figure 1 with 2 supplements
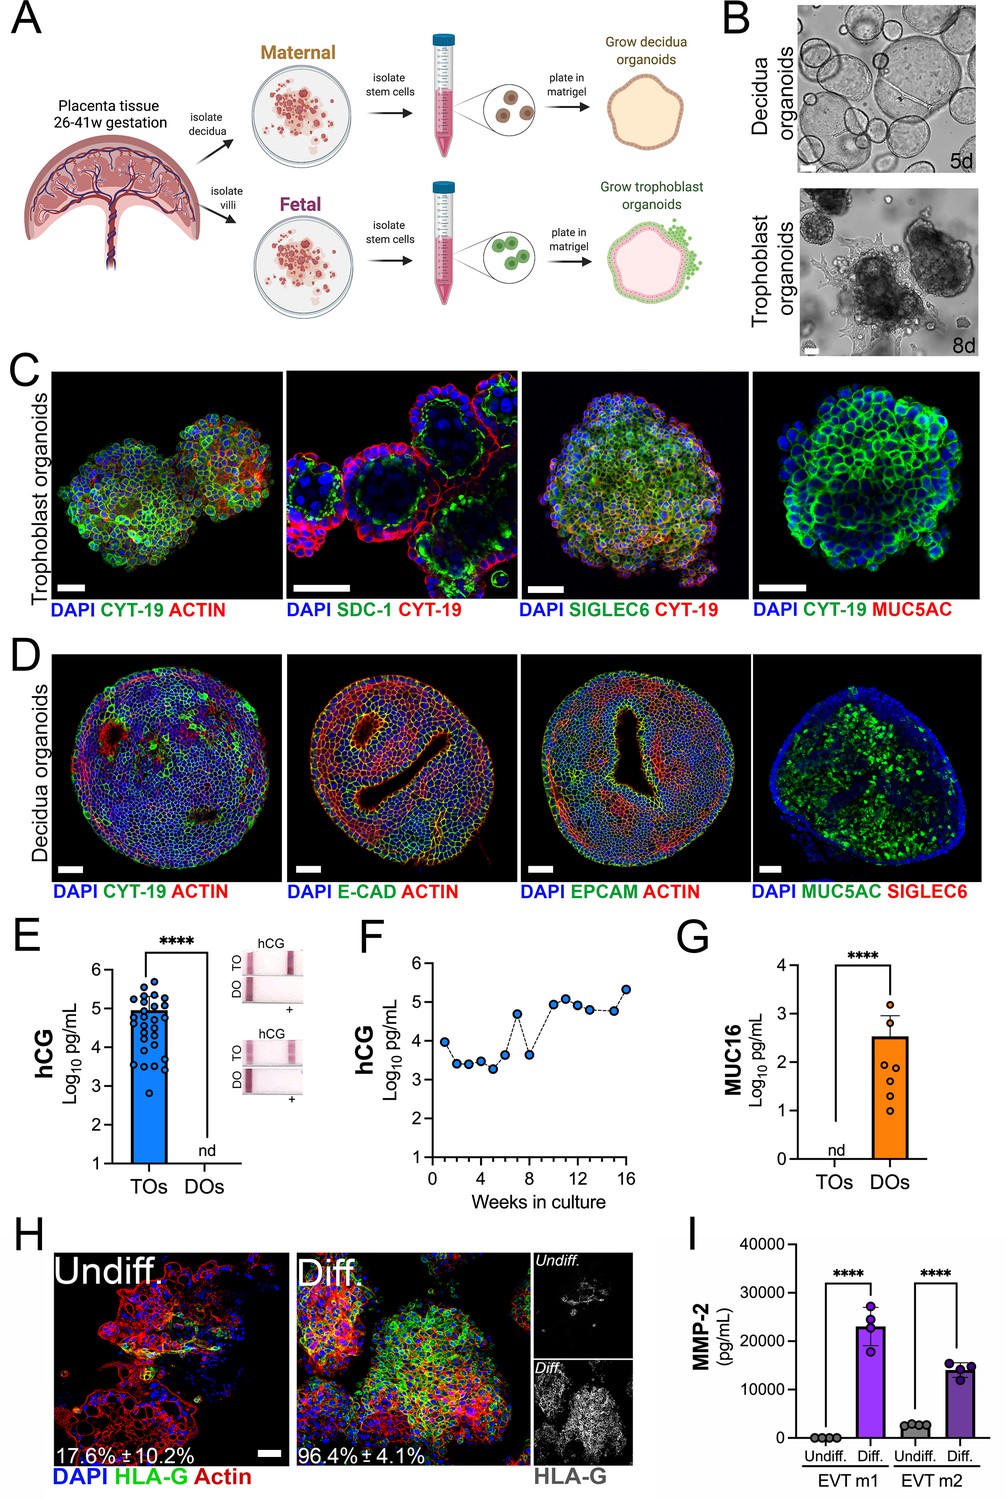
Long-term three-dimensional organoids cultures can be established from human mid- and late-gestation placental tissue.
(A) Schematic representation of the derivation of trophoblast organoids (TOs) and decidual organoids (DOs) from mid-to-late gestation placental tissue. (B) Representative bright-field images of TOs and DOs after passaging in complete growth medium TOM and ExM, respectively at 5 days (DO, top) or 8 days (TO, bottom) post-passaging. Scale bar, 50 µm. (C) Confocal microscopy in TOs immunostained for (from left) cytokeratin-19, SDC-1, SIGLEC-6, cytokeratin-19 (in green) and actin, cytokeratin-19, or MUC5AC (in red). DAPI-stained nuclei are shown in blue. Individual channels are shown in Figure 1—figure supplement 1D. Scale bar, 50 µm. (D) Confocal microscopy in DOs immunostained for (from left) cytokeratin-19, E-cadherin (E-cad), EpCAM, or MUC5AC (in green) and actin or SIGLEC6 (in red). DAPI-stained nuclei are shown in blue. Individual channels are shown in Figure 1—figure supplement 1D. Scale bar, 50 µm. (E) Levels of hCG in conditioned medium (CM) isolated from TOs (blue) or DOs (orange) as determined by Luminex. At right, over the counter (OTC) pregnancy tests for hCG in two matched TO and DO lines. (F) Levels of hCG in CM isolated from TOs throughout a 16-week culture period as determined by Luminex. (G) Levels of secreted Mucin-16 (MUC16) in CM isolated from TOs (light blue) or DOs (orange) as determined by Luminex assays. (H) Confocal microscopy in TOs differentiated into an EVT-enriched phenotype (Diff., right) or cultured under standard growth conditions (Undiff., left), and immunostained with HLA-G (in green). Actin is shown in red and DAPI-stained nuclei in blue. At right, black and white images of HLA-G in undifferentiated (top) or differentiated (bottom) conditions. (I) Levels of MMP-2 in the media of undifferentiated (undiff.) or EVT-differentiated (diff.) TOs as assessed by Luminex assays. Shown are media isolated from both stages of EVT differentiation, medium 1 (EVT m1), which contains NRG1, and medium 2 (EVT m2), without NRG1. In (E), (G), and (I), each symbol represents an individual CM preparation and significance was determined by Mann-Whitney U-test. ****, p<0.0001 and nd, not detected. EVT, extravillous trophoblast; hCG, human chorionic gonadotropin.
Figure 1—figure supplement 1
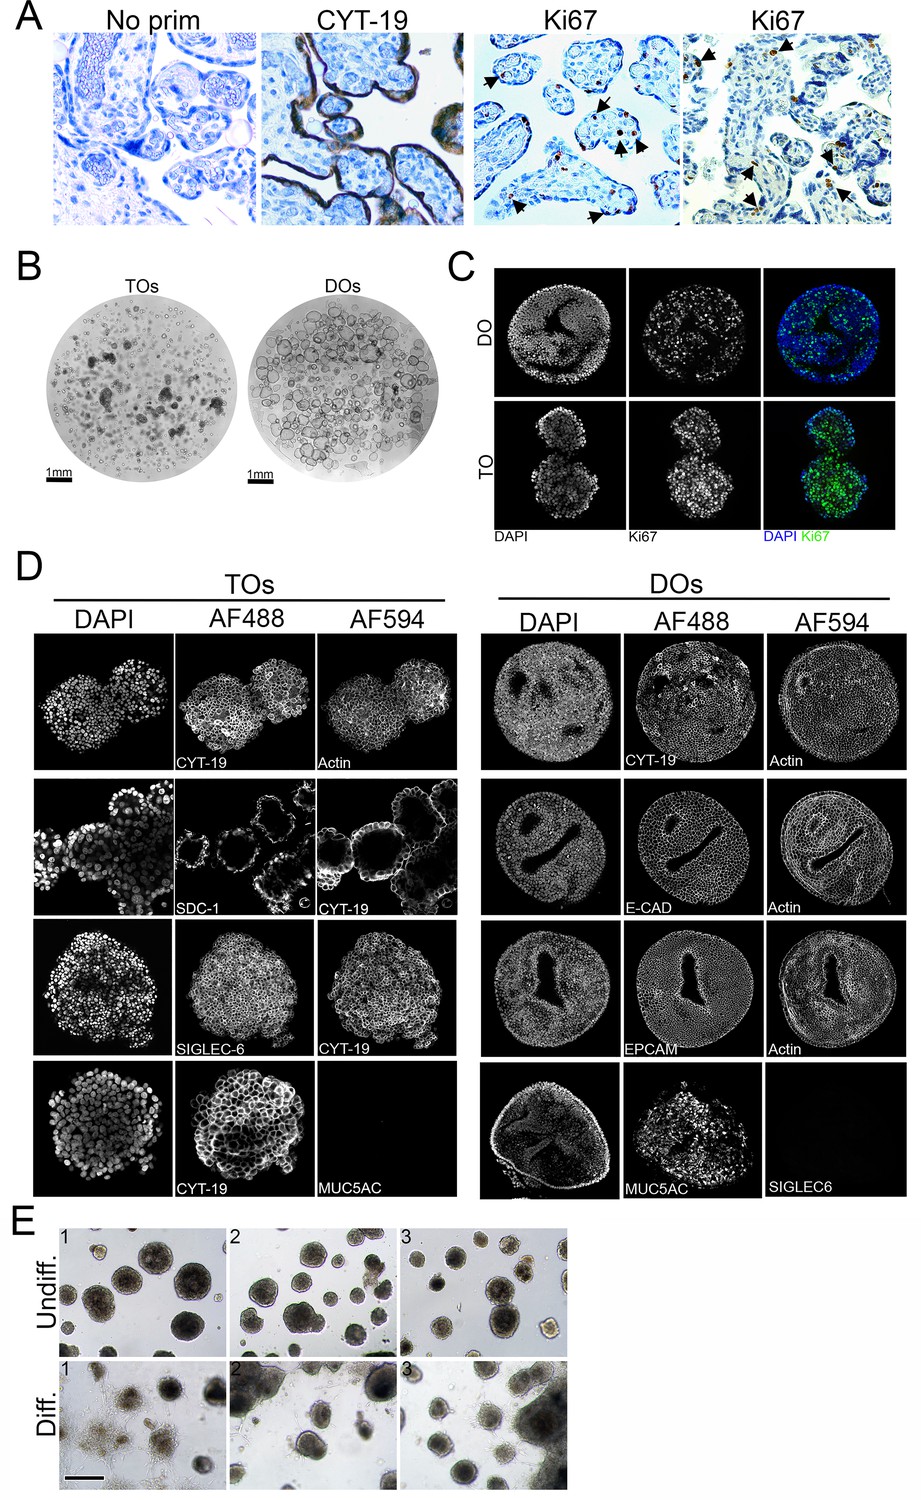
Characterization of trophoblast (TO) and decidua organoids (DO).
(A) Immunohistochemistry in human full-term placental villi tissue used to generate TOs. Shown are no primary controls (left) and representative images of tissue immunostained for cytokeratin-19 (CYT-19) or Ki-67 as a marker of cell proliferation. Black arrows denote nuclei positive for Ki-67. (B) Bright-field images of Matrigel containing TOs (left) or DOs (right). Tiled images were captured using a motorized xy-stage at 10× magnification. Scale shown at bottom left. (C) Immunostaining for Ki67 (green) in DOs (top) or TOs (bottom). DAPI-stained nuclei are shown in blue. (D) Black and white images of single channel confocal micrographs used to generate the merged images shown in Figure 1C and D. (E) Representative brightfiled images (captured at 10× magnification) of replicates of undifferentiated (top row) or EVT differentiated (bottom row) TOs. Scale, 100μm.
Figure 1—video 1
Three-dimensional image reconstruction of SDC-1 immunostaining in trophoblast organoids (TOs).
Shown is a three-dimensional image reconstruction of an xz-stack of TOs immunostained for SDC-1 (in green) and counterstained for actin (in red). DAPI-stained nuclei are shown in blue. A single xz plane of this image is shown in Figure 1C. Generated using Imaris.
Figure 2 with 1 supplement
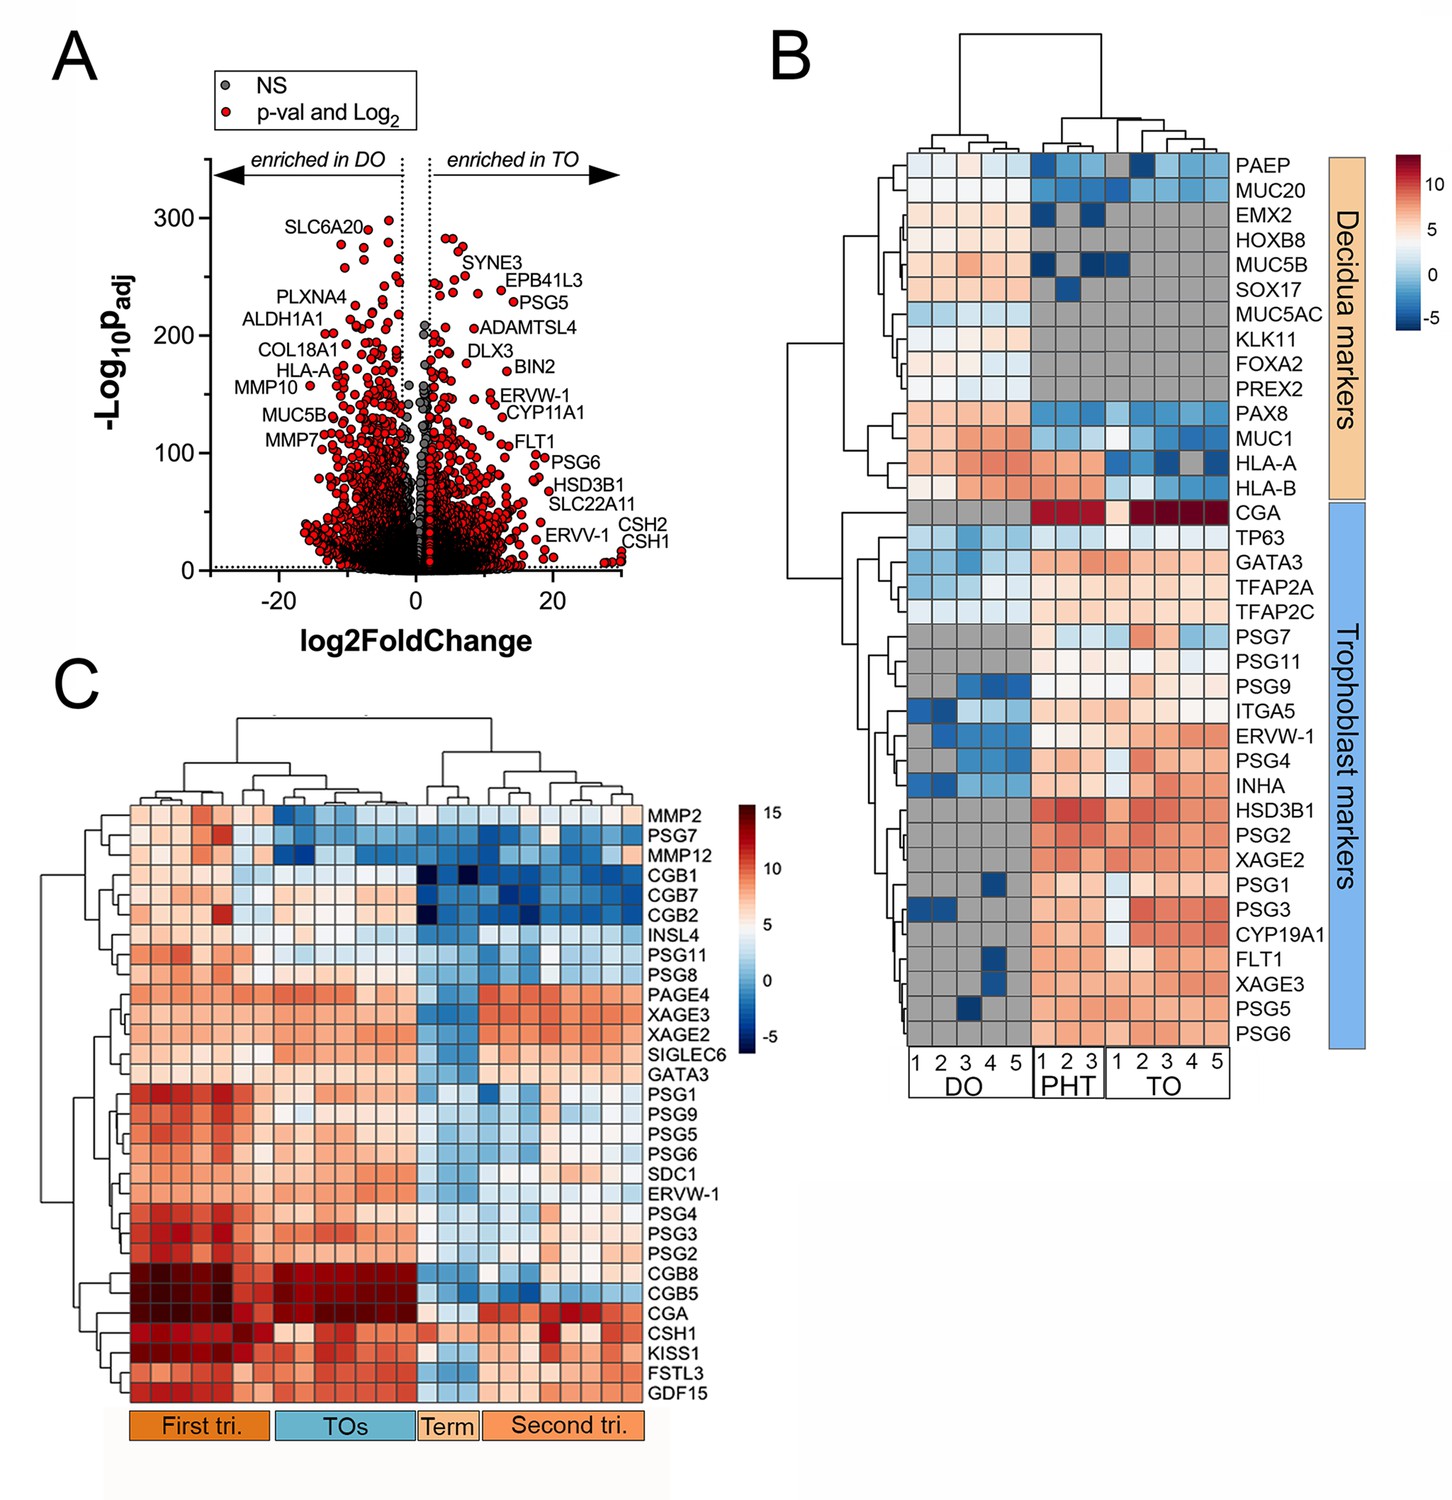
Whole genome transcriptional profiling of trophoblast (TO) and decidua organoids (DO).
(A) Volcano plot demonstrating differentially expressed transcripts in TOs or DOs as assessed by DeSeq2 analysis. Gray circles represent genes whose expression was not significantly changed and red denotes transcripts significantly enriched in TOs (right) or DOs (left) (significance was set at p<0.01 and log2 fold-change of ±2). (B) Heatmap (based on log2 RPKM values) of transcripts expressed in DOs, TOs, or primary human trophoblasts (PHTs) cells that are associated with markers of trophoblasts (top, blue) or the decidua (bottom, orange). Key at right. Red indicates high levels of expression, blue indicates low levels of expression, and gray indicates no reads detected. Hierarchical clustering is shown on left and top. (C) Heatmap (based on log2 RPKM values) of transcripts expressed in TOs or human placental tissue isolated from the first or second trimesters, or from full-term tissue. Key at right. Red indicates high levels of expression, blue indicates low levels of expression, and gray indicates no reads detected. Hierarchical clustering is shown on left and top.
Figure 2—figure supplement 1
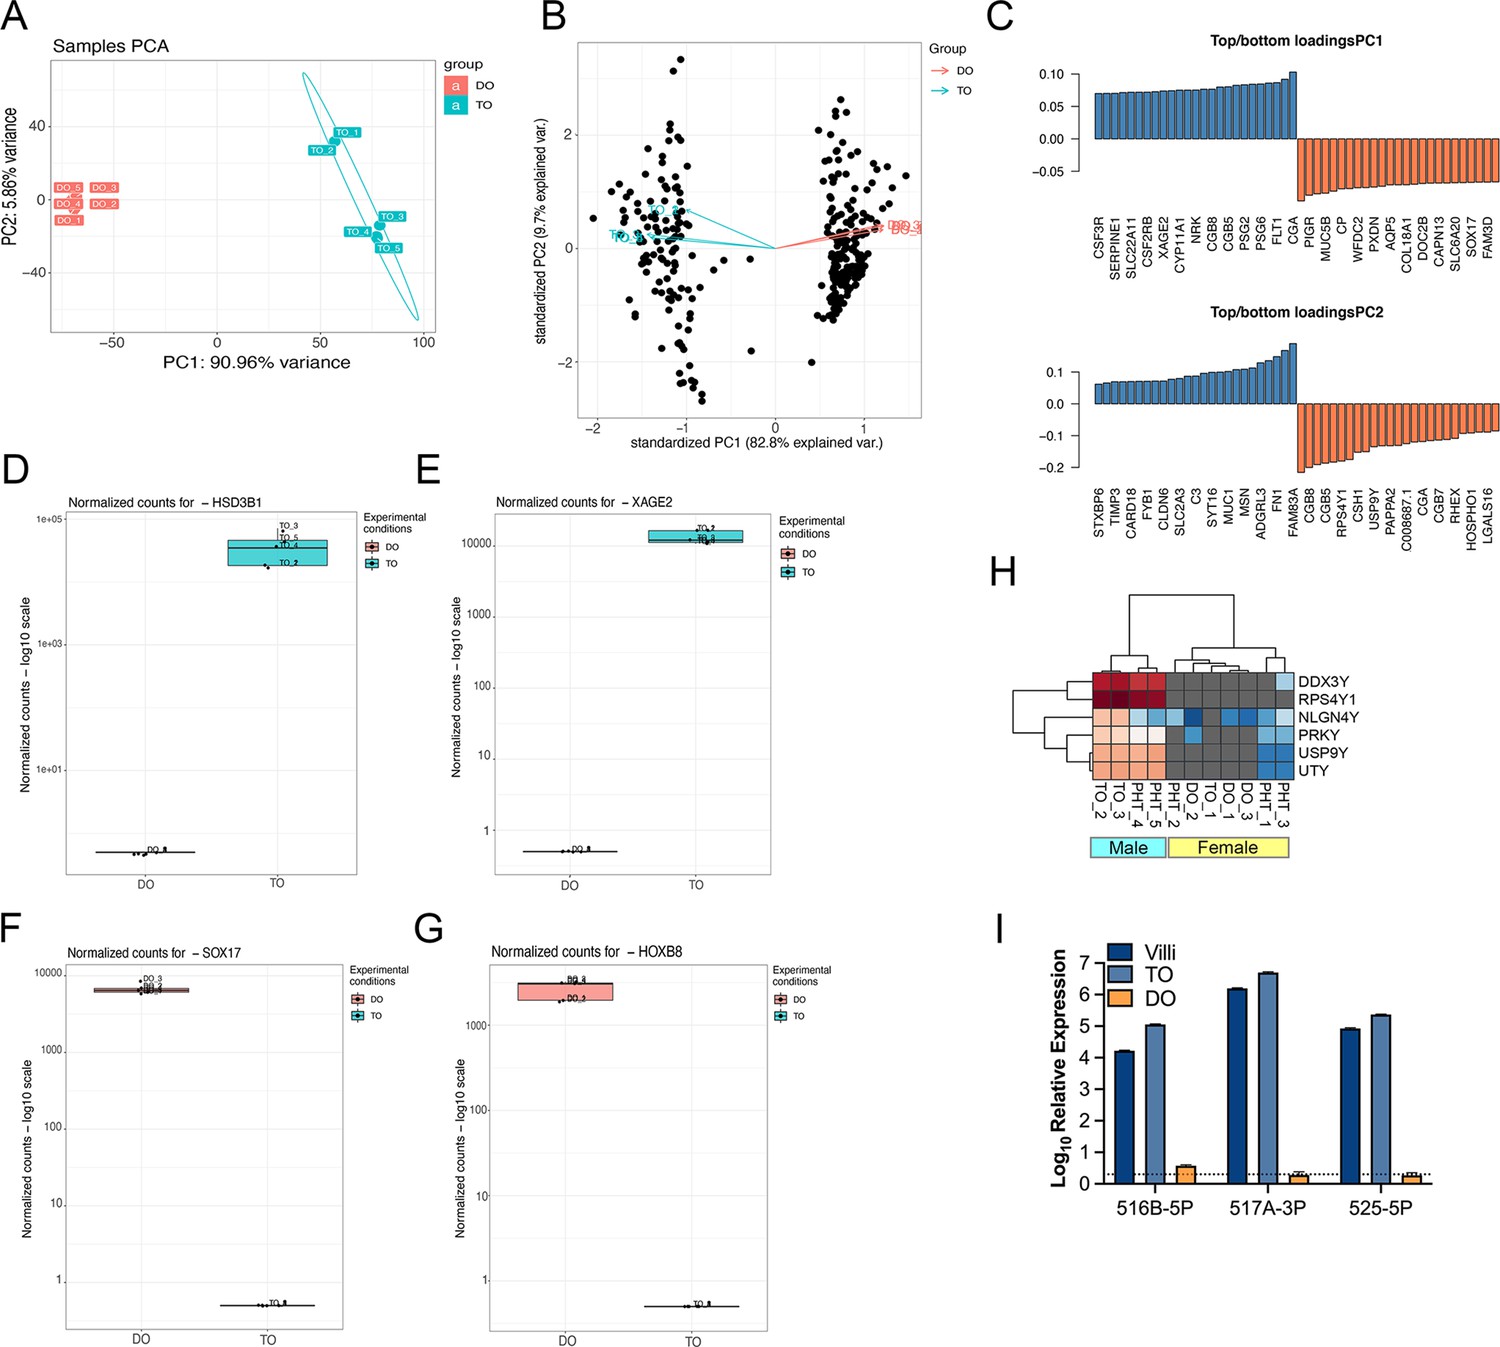
RNASeq of TOs and DOs.
(A, B) Principal component analysis based on transcriptional profiles from DOs (orange) or TOs (blue). (C) Transcripts on the first and second principal components (PC1, PC2) with the greatest variance. Blue indicates enrichment in TOs and orange indicates enrichment in DOs. (D–G) Gene-specific enrichment of select transcripts in TOs (blue) and DOs (orange). Shown are HSD3B1 (D), XAGE2 (E), SOX17 (F), and HOXB8 (G). Five individual samples are shown as unique datapoints. (H) Heatmap (based on log2 RPKM values) of representative Y-linked transcripts in TOs, DOs, or primary human trophoblasts (PHTs). Red indicates high levels of expression, blue indicates low levels of expression, and gray indicates no reads detected. Hierarchical clustering is shown at top. (I) Expression of three members of the C19MC family (miR-516-5p, 517A-3p, and 525-5p) in TOs (light blue) and DOs (orange), or in chorionic villi (dark blue) isolated from human placentas.
Figure 3 with 1 supplement
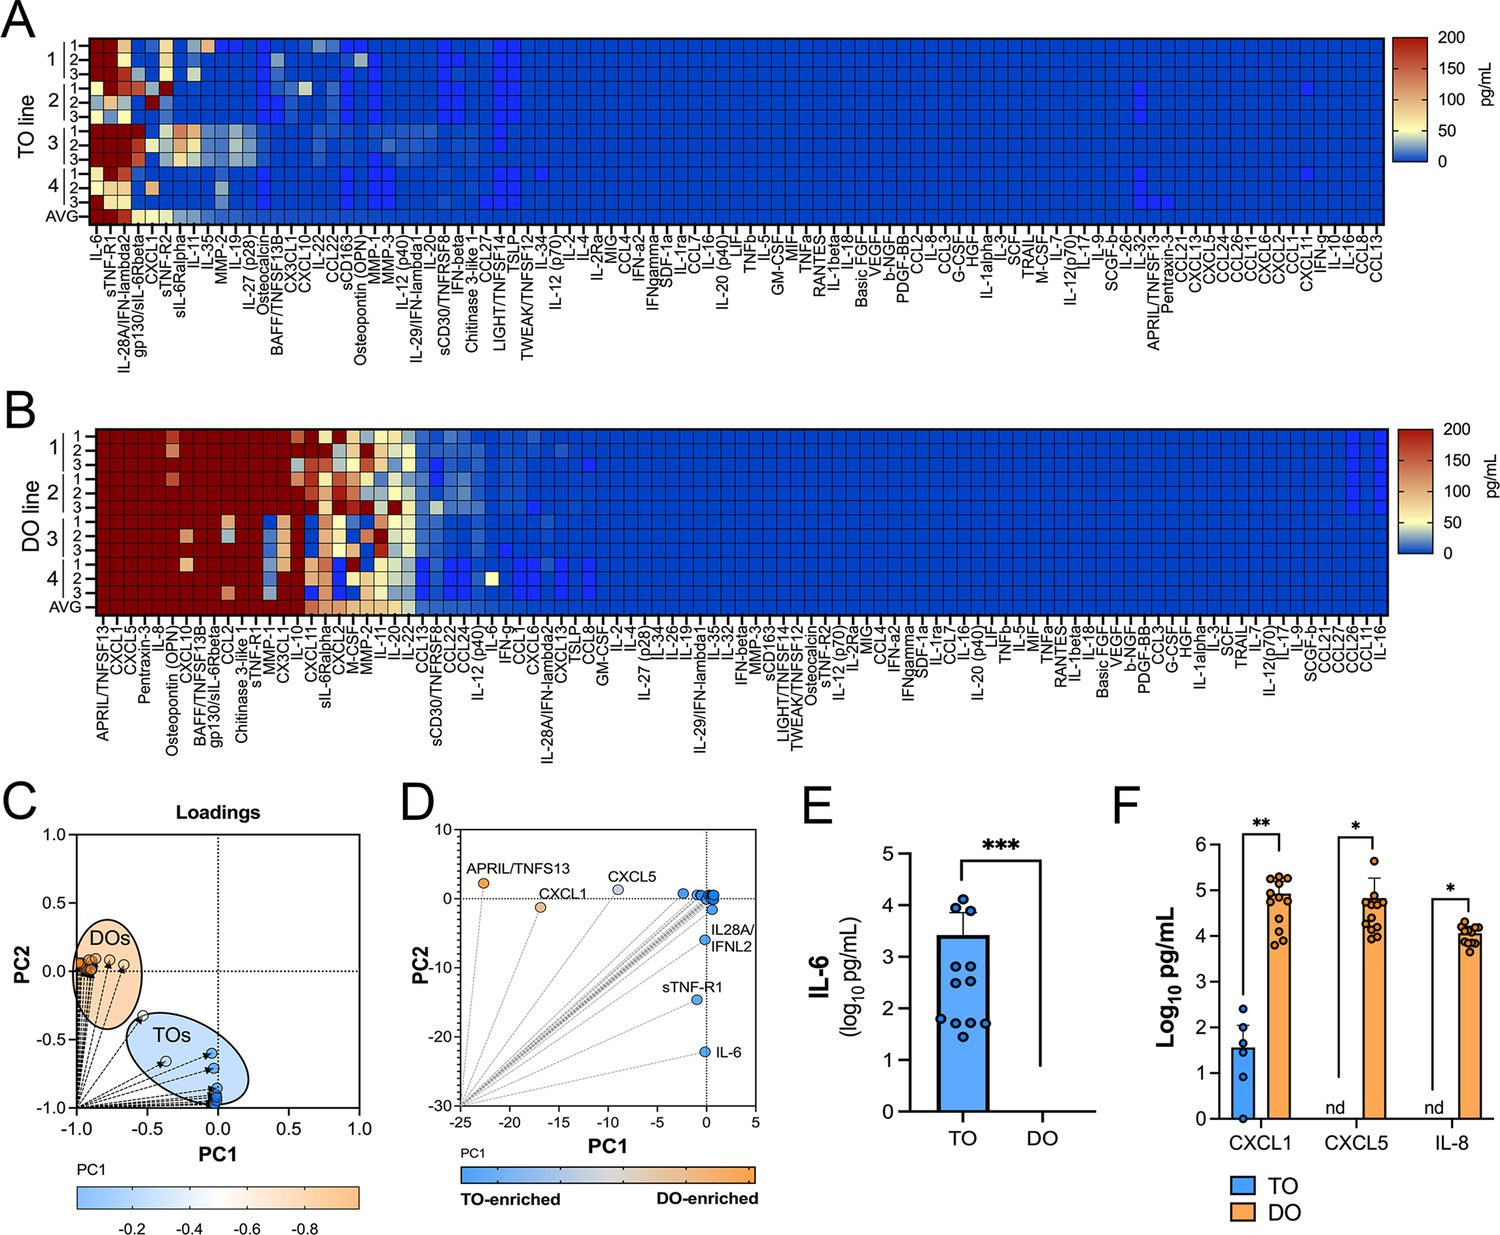
Basal cytokine and chemokine secretion profiles from matched trophoblast (TO) and decidua organoids (DO).
(A, B) Heatmap of 12 conditioned medium (CM) preparations generated from four established TO (A) and DO (B) lines analyzed by Luminex-based multianalyte profiling for the indicated cytokines, chemokines, and growth factors (at bottom). Scale is shown at right. (C, D) Principal component analysis of Luminex data shown in (A) and (B) indicates that the basal secretion between TOs and DOs is unique (C) and identifies the factors that contribute to these differences (D). (E) Basal secretion of IL-6 in TOs, but not DOs, as assessed by Luminex. (F) Basal secretion of CXCL1, CXCL5, and IL-8 in CM from TOs (in blue) or DOs (in orange). In (E) and (F), each symbol represents an individual CM preparation and significance was determined by Mann-Whitney U-test (E) or two-way ANOVA with Šídák’s multiple comparisons tests (F). *** p<0.001, ** p<0.01, * p<0.05.
Figure 3—figure supplement 1
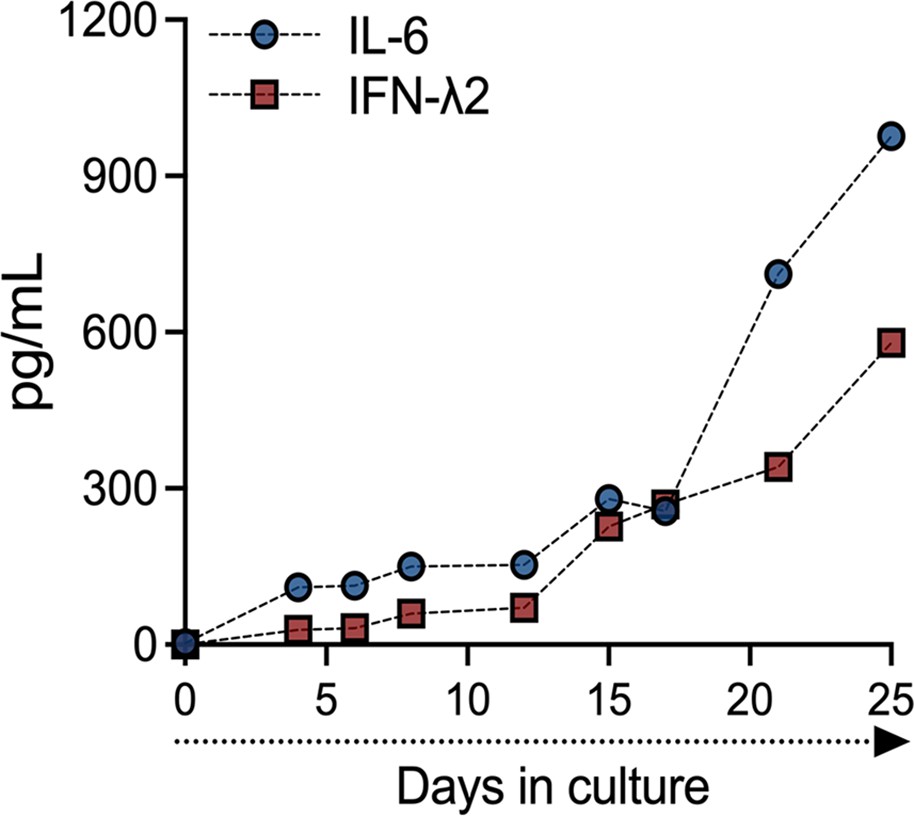
IL-6 and IFN-λ2 release in TOs over time.
Concentrations of IL-6 (blue) and IFN-λ2 (red) in CM generated from a single TO line throughout the first 25 days of culture.
Figure 4
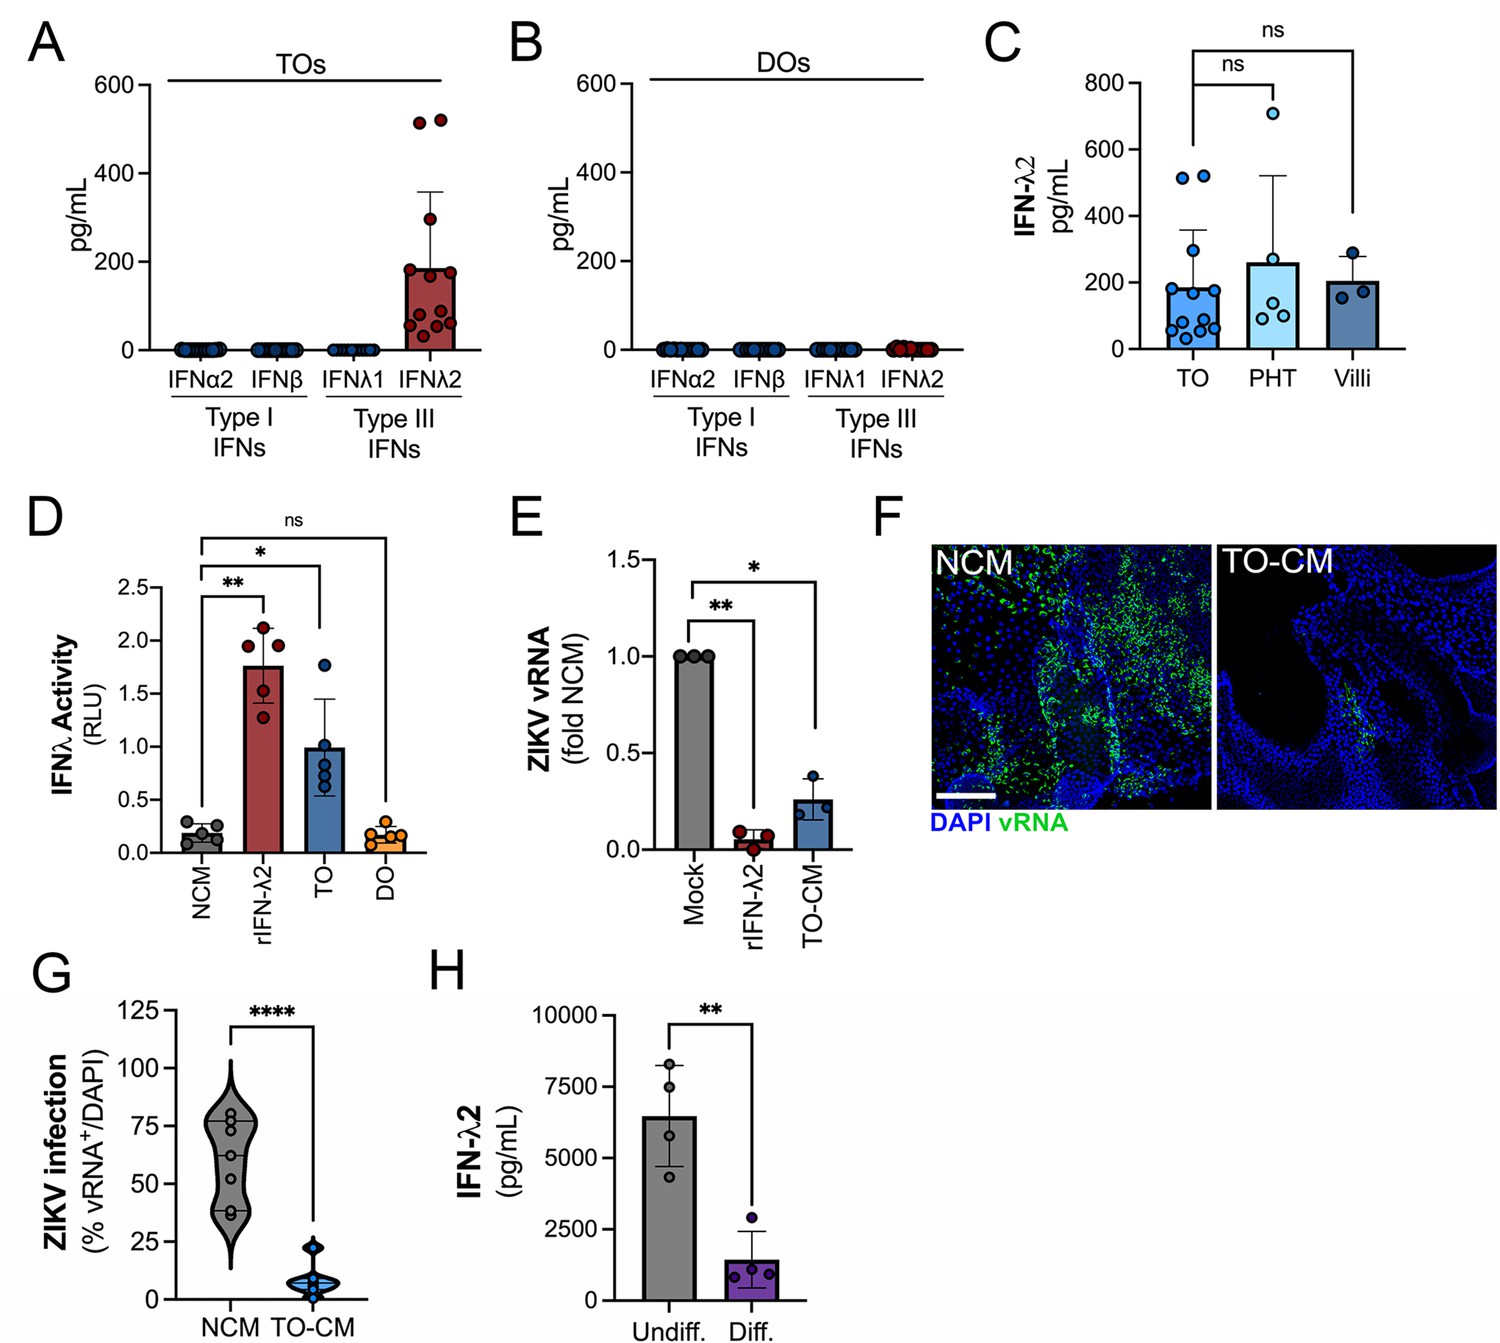
Trophoblast organoids secrete high levels of antiviral IFN-λ2.
(A, B) Comparison of the levels of the type I IFNs IFN-α2 and IFN-β and type III IFNs IFN-λ1 and IFN-λ2 in conditioned medium (CM) isolated from TOs (A) or DOs (B) as determined by Luminex assays. (C) Comparison of the levels of IFN-λ2 in CM isolated from TOs, matched villous tissue, or in primary human trophoblasts (PHTs). (D) IFN-λ activity shown as relative light units (RLUs) of CM isolated from TOs (blue) and DOs (orange) as assessed using an IFN-λ reporter 293T cells line. NCM (non-conditioned medium, gray) was as negative control, NCM supplemented with recombinant human IFN-λ2 (100 ng) was used as a positive control (red). (E) Human osteosarcoma U2OS cells were treated with CM isolated from TOs (blue) or with recombinant IFN-λ2 (100 ng) for 24 hr and then infected with ZIKV for 24 hr (in the presence of CM). Level of ZIKV replication was assessed by viral RNA as determined by qPCR. Data are shown as a fold change in infection from NCM-treated cells. (F) Representative confocal micrographs of DOs treated with NCM or CM isolated from TOs for 24 hr, then infected with ZIKV for 72 hr. Shown in green is viral double stranded RNA, a replication intermediate. DAPI-stained nuclei are shown in blue. Scale bar, 50 μm. (G) Automated image analysis of ZIKV infection in ZIKV-infected DOs treated with NCM or TO-derived CM, as described in (F). Imaged were captured from three different experiments. (H) Comparison of the levels of IFN-λ2 in CM isolated from matched TOs grown under conditions that promote EVT differentiation (Diff., right) or under standard culture conditions (Undiff., left). Data in all panels are mean ± standard deviation from at least three independent CM preparations. Significance was determined by a Student’s t-test, Mann-Whitney U-test or by Kruskal-Wallis U-test with multiple comparisons. *p<0.05; **p<0.01; ****p<0.001, ns, not significant. In all, each symbol represents unique CM preparations. DO, decidua organoid; TO, trophoblast organoid.
Figure 5 with 1 supplement
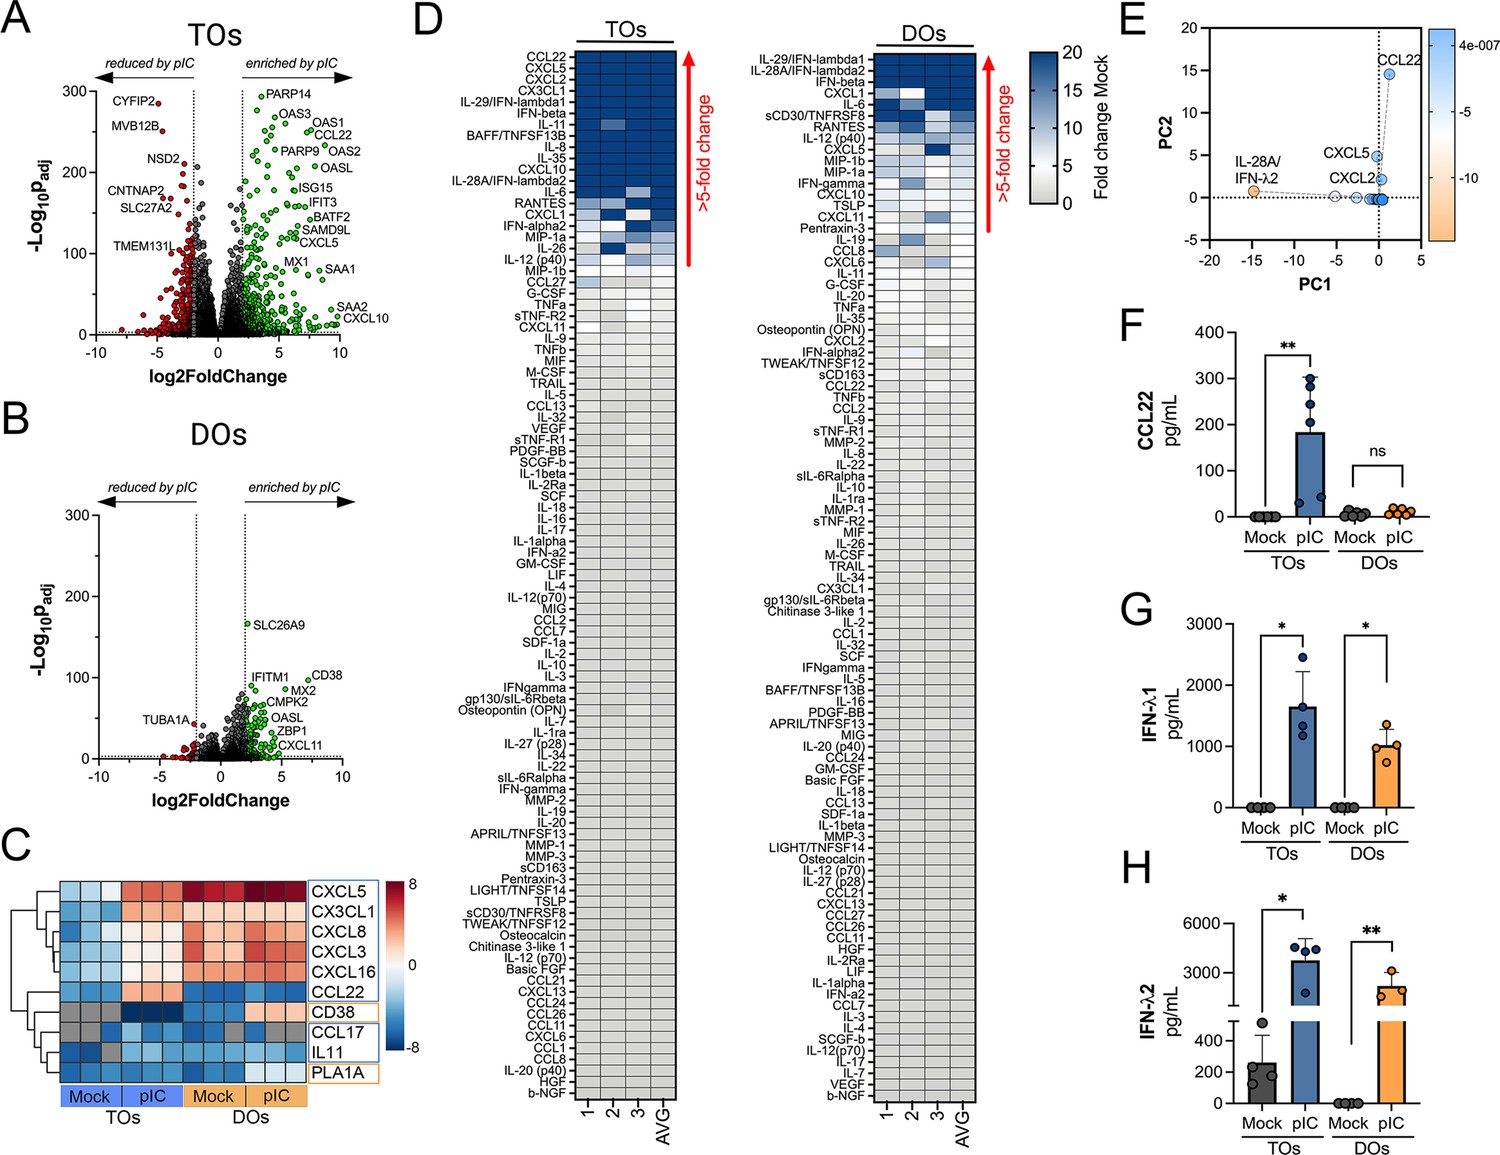
Differential cytokine and chemokine release in trophoblast organoids (TOs) and decidua organoids (DOs) treated with poly I:C.
(A, B) Volcano plots demonstrating differentially expressed transcripts in TOs (A) or DOs (B) treated with poly I:C as assessed by DeSeq2 analysis. Gray circles represent genes whose expression was not significantly changed and green denotes transcripts significantly induced by poly I:C treatment whereas red denotes transcripts significantly reduced by poly I:C treatment. Significance was set at p<0.01 and log2 fold-change of ±2. (C) Heatmap (based on log2 RPKM values) of select transcripts induced uniquely by poly I:C treatment of TOs (blue boxes) or DOs (orange boxes). Key at right. Red indicates high levels of expression, blue indicates low levels of expression, and gray indicates no reads detected. Hierarchical clustering is on the left. (D) Heatmaps demonstrating the induction of factors at left (shown as fold change from mock-treated controls) from TOs (left panel) and DOs (right panel) treated with 10 μg poly (I:C) and analyzed by multiplex Luminex-based profiling for 105 cytokines, chemokines, and other factors. AVG denotes the average change in concentration of factors over conditioned medium (CM) isolated from three individual preparations. Dark blue denotes significantly induced factors compared with untreated controls. Gray or white denotes little to no change (scale at top right). The red arrow demonstrates factors with induction greater than fivefold change observed in the average of separate experiments. Data are from three individual CM preparations from at least three unique matched organoid lines. (E) Principal component analysis of Luminex data shown in left panels identify factors differentially induced by poly I:C treatment of TOs and DOs. (F–H) Levels of CCL22 (F), IFN-λ1 (G), and IFN-λ2 (H) in CM isolated from poly I:C-treated TOs (blue) or DOs (orange) or in mock-treated controls (gray). In (F–H), each symbol represents individual CM preparations. In (F–H), data are shown as mean ± standard deviation and significance was determined using a Mann-Whitney U-test. **p<0.01, *p<0.05; ns, not significant.
Figure 5—figure supplement 1
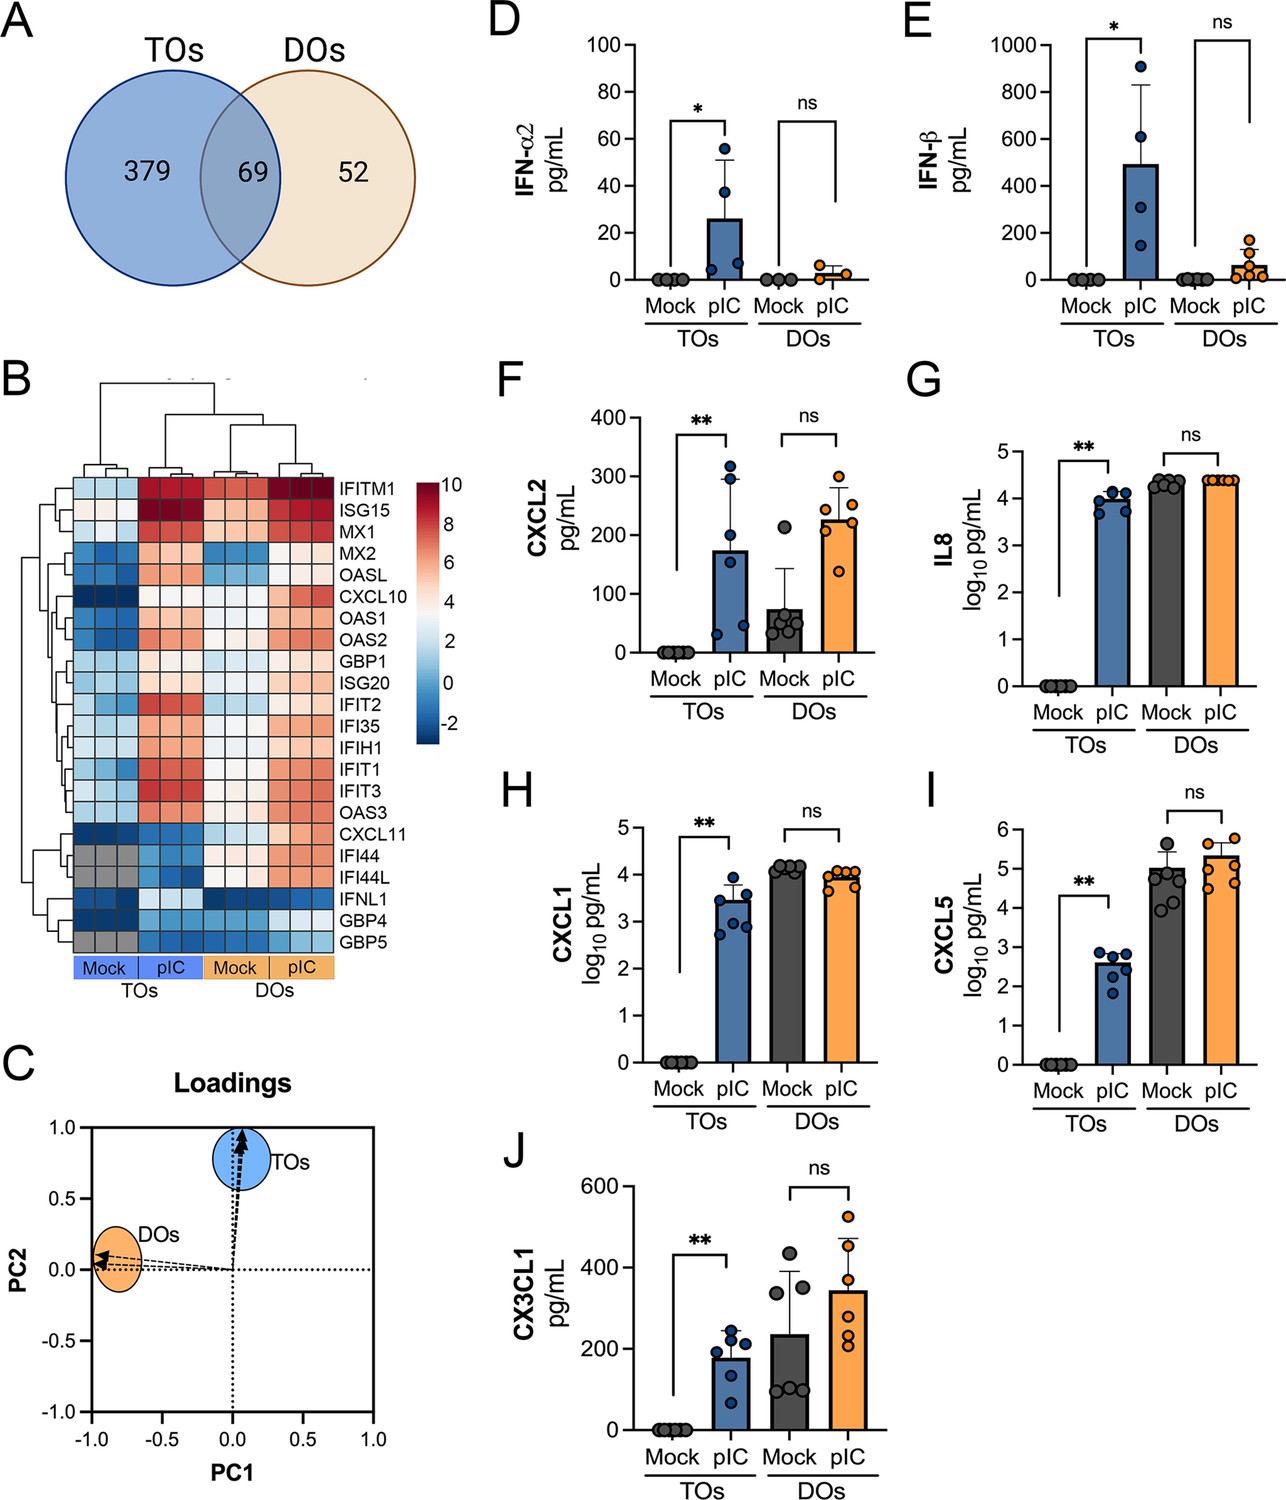
Factors induced by poly I:C treatment of TOs and DOs.
(A) Venn diagram denoting unique and shared differentially expressed transcripts in TOs (blue circle) or DOs (orange circle) treated with poly I:C. (B) Heatmap (based on log2 RPKM values) of transcripts induced by poly I:C treatment of both TOs (blue box, bottom) or DOs (orange box, bottom). Key at right. Red indicates high levels of expression, blue indicates low levels of expression, and gray indicates no reads detected. Hierarchical clustering is on the left. (C) Loadings of principal component analysis of Luminex-based multianalyte profiling of poly I:C treated TOs (blue circle) and DOs (orange circle). (D–J) Levels of IFN-α2 (D), IFNβ (E), CXCL2 (F), IL-8 (G), CXCL1 (H), CXCL5 (I), and CX3CL1 (J) in CM isolated from poly I:C-treated TOs (blue) or DOs (orange) or in mock-treated controls (gray). Each symbol represents individual CM preparations. Significance was determined using a Mann-Whitney U-test. **p<0.01, *p<0.05; ns, not significant.
Figure 6
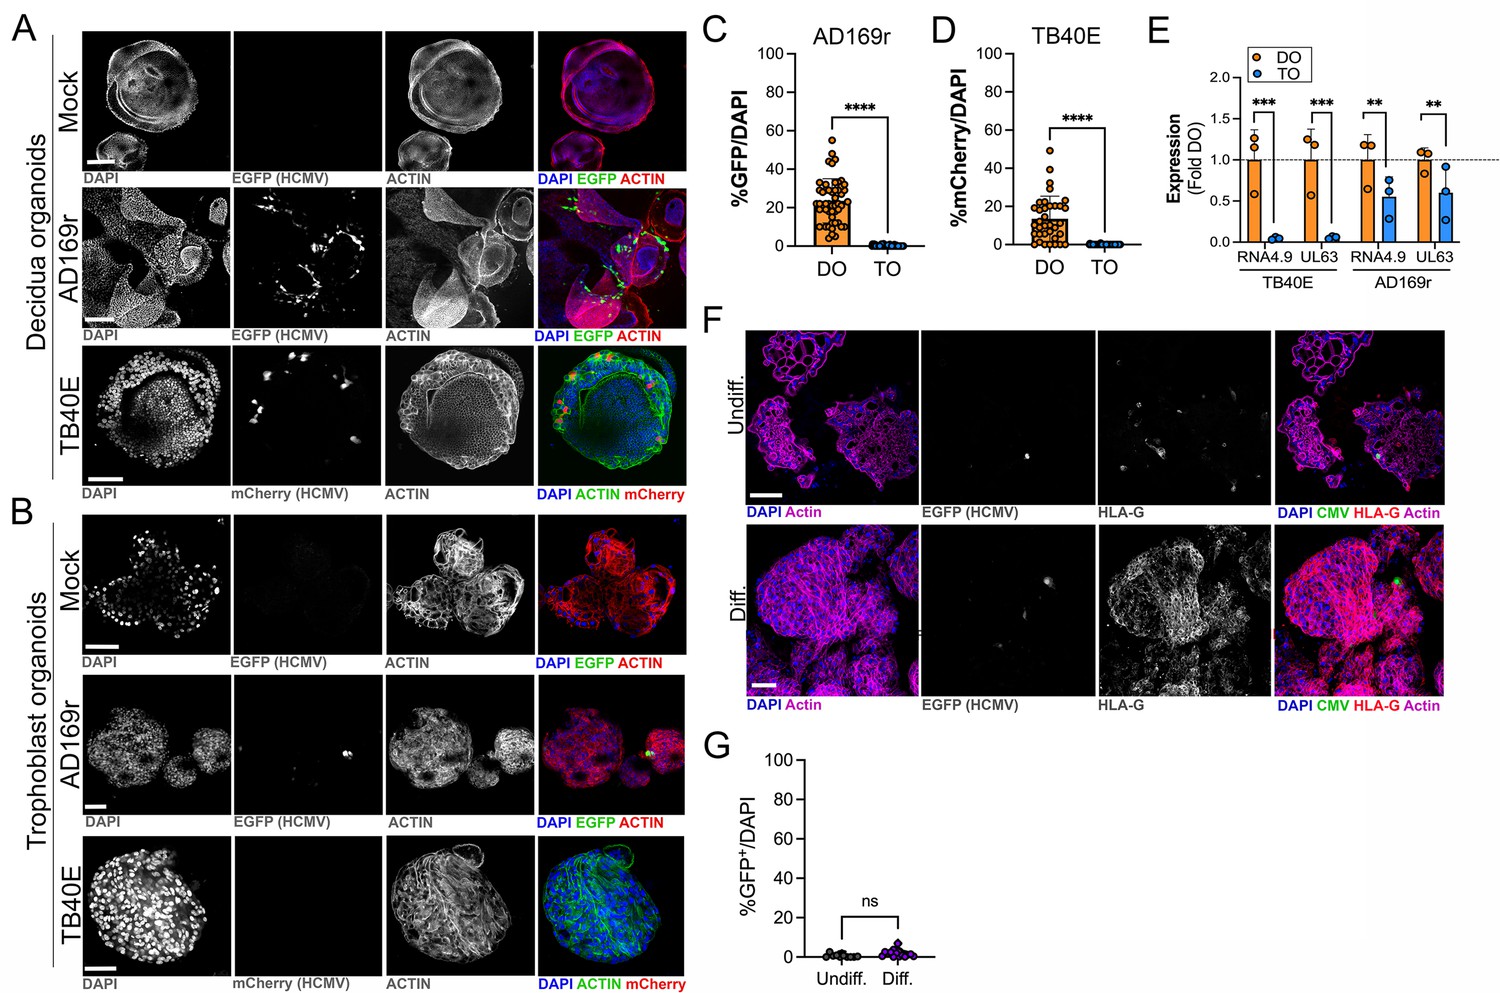
Differential susceptibility of TOs and DOs to HCMV infection.
(A, B) Representative confocal micrographs of DOs (A) or TOs (B) infected with human CMV (HCMV) strains EGFP-tagged AD169r and mCherry-tagged TB40E for ~48 hr. Mock infected shown in top row of (A) and (B). Infected cells are positive for EGFP (AD169r, middle row) or mCherry (TB40E, bottom row). Organoids were stained for actin (red in mock- and AD169r-infected or green in TB40E infected). DAPI-stained nuclei are shown in blue. (C, D) Quantification of HCMV infection in DOs or TOs infected with AD169r (C) or TB40E (D). Shown is the percent HCMV positive cells as assessed by EGFP (AD169r, (C)) or mCherry (TB40E, (D)) over total number of nuclei from confocal micrographs. A minimum of 30 independent organoids taken from biological replicate experiments were quantified by automated image analysis. (E) Comparison of RPKM values for HCMV RNA4.9 and UL63 in TOs (blue) or DOs (orange) as assessed by bulk RNASeq. Data are shown as mean ± standard deviation as a fold of DO values. Significance was determined using a t-test. ***p<0.001, **p<0.01. Each symbol represents an independent sample. (F) Representative confocal micrographs of undifferentiated (top) of EVT differentiated (bottom) TOs infected with EGFP-tagged AD169r and immunostained for HLA-G (in red). DAPI-stained nuclei are shown in blue and actin is in purple. Middle panels are black and whote imaged of HCMV infection and HLA-G immunostaining. (G) Quantification of HCMV (AD169r strain) infection in TOs cultured under standard conditions (Undiff., left) or under conditions that promote EVT differentiation (Diff., right). Shown are the percentage of total cells that were positive for HCMV, as assessed by the presence of GFP, over total nuclei as assessed by DAPI staining. Each symbol represents an independent field from replicates, with at least 2000 total nuclei quantified under both conditions. Significance was determined using a t-test, ns, not significant. In (A, B), F scale bar, 50 µm. DO, decidua organoid; EVT, extravillous trophoblast; HCMV, human cytomegalovirus; TO, trophoblast organoid.
Figure 7
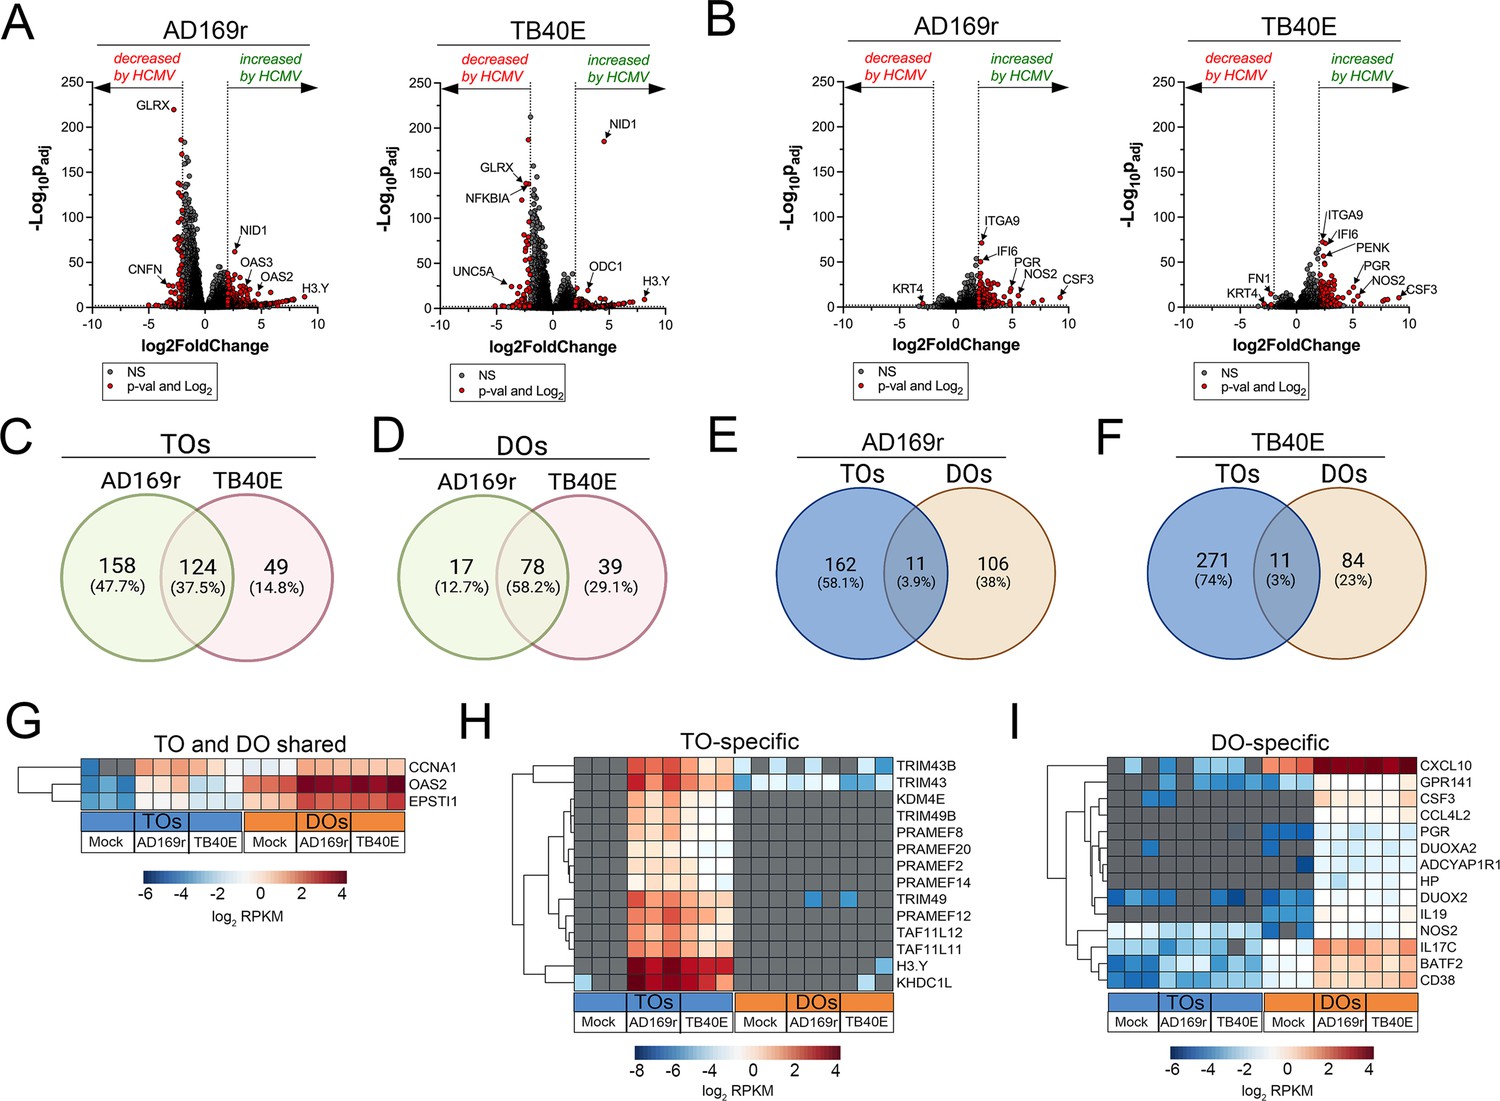
Transcriptional profiling of HCMV infected trophoblast organoids (TOs) and decidua organoids (DOs).
(A, B) Volcano plots demonstrating differentially expressed transcripts in TOs (A) or DOs (B) infected with HCMV strains AD169r or TB40E (as denoted at top) by DeSeq2 analysis. Gray circles represent genes whose expression was not significantly changed and red denotes transcripts significantly changed by HCMV infections. Significance was set at p<0.01 and log2 fold-change of ±2. (C, D) Venn diagrams of differentially expressed transcripts in TOs (C) or DOs (D) infected with HCMV AD169r (green circle) or TB40E (red circle) strains. (E, F) Venn diagrams of the extent of overlap in differentially expressed transcripts in TOs (blue circle) or DOs (orange circles) infected with HCMV AD169r (E) or TB40E (F) strains. (G) Heatmap (based on log2 RPKM values) of transcripts induced by HCMV infection of both TOs (blue box, bottom) or DOs (orange box, bottom). (H, I) Heatmap (based on log2 RPKM values) of transcripts induced by HCMV infection specifically in TOs (H) or DOs (I). In (G–I), key at bottom and red indicates high levels of expression, blue indicates low levels of expression, and gray indicates no reads detected. Hierarchical clustering is on the left. HCMV, human cytomegalovirus.
Figure 8 with 2 supplements
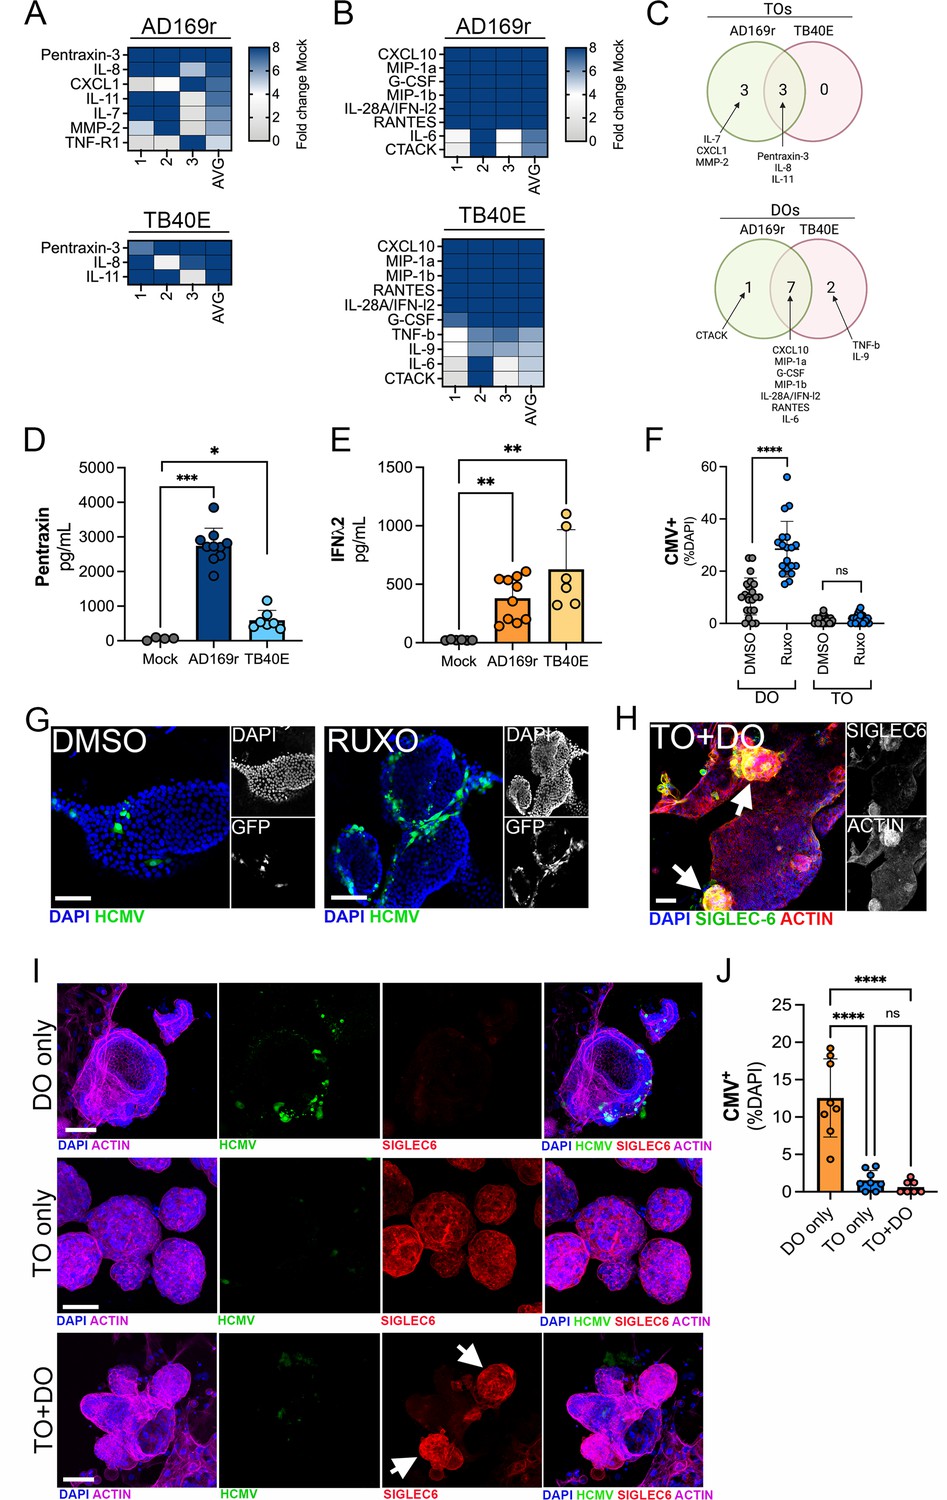
Differential innate immune responses to HCMV infection of TOs and DOs.
(A, B) Heatmaps demonstrating the induction of factors at left (shown as fold change from mock-treated controls) from TOs (A) and DOs (B) infected with HCMV (AD169r, top or TB40E, bottom strains). Shown are factors induced >5-fold (full heatmap is shown in Figure 8—figure supplement 2). AVG denotes the average change in concentration of factors over conditioned medium (CM) isolated from three individual preparations. Dark blue denotes significantly induced factors compared with untreated controls. Gray or white denotes little to no change (scale at top right). (C) Venn diagrams comparing the factors induced by infection of TOs (top) or DOs (bottom) with AD169r (green) or TB40E (red). (D) Levels of pentraxin in TOs infected with AD169r (middle, dark blue) or TB40E (right, light blue) compared to mock-infected controls (left, gray). (E) Levels or IFN-λ2 in CM isolated from DOs infected with HCMV AD169r (middle, dark orange) or TB40E (right, light orange) or in in mock-treated controls (left, gray). Each symbol represents individual CM preparations and significance was determined using a Mann-Whitney U-test. ***p<0.001, **p<0.01, *p<0.05. (F) Quantification of the extent of HCMV infection in DOs (left) or TOs (right) treated with DMSO control (DMSO, gray) or with ruxolitinib (ruxo, blue) and infected with the AD169r strain of HCMV for 48 hr. Shown are the percent HCMV positive cells as assessed by GFP signal over total nuclei as assessed by DAPI staining. Each symbol represents individual fields/organoids and significance was determined using a Mann-Whitney U-test. ****p<0.0001, ns not significant. (G) Representative images from the quantification shown in (G) of DOs treated with DMSO control (left) or ruxolitinib (right) and infected with the GFP-tagged AD169r strain of HCMV for 48 hr. DAPI-stained nuclei are shown in blue. (H) Confocal micrographs of co-cultures of TOs and DOs immunostained for the trophoblast-specific marker SIGLEC-6 (in green). Actin is shown in red and a DAPI-stained nuclei are in blue. At right, black and white images of SIGLEC-6 (top) and actin (bottom). (I) Confocal micrographs of co-cultures singly cultured DOs (top row), TOs (middle row), or co-cultured TOs and DOs (bottom row) infected with AD169r HCMV (in green) and immunostained for the trophoblast-specific marker SIGLEC-6 (in red). Actin is shown in purple and a DAPI-stained nuclei are in blue. Black and white images are located in Figure 8—figure supplement 1A. (J) Quantification of the extent of HCMV infection in singly cultured DOs (orange, left) or TOs (blue, middle) or co-cultured TOs and DOs (pink, right) infected with the AD169r strain of HCMV for 48 hr. Shown are the percent HCMV positive cells as assessed by GFP signal over total nuclei as assessed by DAPI staining. Each symbol represents individual fields/organoids and significance was determined using a Mann-Whitney U-test. ****p<0.0001, ns not significant. In (G–I), scale bar, 50 µm. DO, decidua organoid; HCMV, human cytomegalovirus; TO, trophoblast organoid.
Figure 8—figure supplement 1

Co-cultures of TOs and DOs.
(A) Black and white images of single channel confocal micrographs used to generate the merged images shown in Figure 8I. (B) Representative over the counter (OTC) pregnancy tests for hCG in two singly cultured DOs (top) or TOs (middle) or in co-cultures of TOs and DOs (bottom).
Figure 8—figure supplement 2

Differential innate responses in TOs and DOs infeced with HCMV.
(A, B) Heatmaps demonstrating the induction of factors at left (shown as fold change from mock-treated controls from TOs (A) and DOs (B) infected with AD169r (left) or TB40E (right) strains of HCMV for ~48 hrs as accessed by Luminex-based multianalyte profiling. AVG denotes the average change in concentration of factors over conditioned medium (CM) isolated from three individual preparations. Dark blue denotes significantly induced factors compared with untreated controls. Grey or white denotes littl to no change (scale at top right). The red arrow demonstrates factors with induction greater than five-fold change observed in the average of separate experiments. (C-E), Levels of IFN-λ1 (C), IFN-α2 (D), or IFN-β (E) in CM isolated from DOs infected with HCMV AD169r (middle, dark orange) or TB40E (right, light orange) or in mock-treated controls (left, grey). In (C-E), each symbol represents individual CM preparations and significance was determined using a Mann-Whitney U-test. ns, not significant.
Tables
Appendix 1—key resources table
| Reagent type (species) or resource | Designation | Source or reference | Identifiers | Additional information |
|---|---|---|---|---|
| Other | Matrigel | Corning | 356231 | Growth-factor-reduced for organoid growth. |
| Other | TrypLE Express | Gibco | 12605–028 | For organoid dissociation during passaging. |
| Other | Stem Pro Accutase | Gibco | A11105-01 | For organoid dissociation during passaging. |
| Other | CryoStor CS10 stem cell freezing medium | STEMCell Technologies | 07930 | For organoid cryopreservation. |
| Other | Trypsin-250 | Alfa Aesar | Alfa Aesar | For stem cell isolation from tissue. |
| Other | Collagenase V | Sigma-Aldrich | C9263-100MG | For stem cell isolation from tissue. |
| Other | recombinant human EGF | Gibco | PHG0314 | For organoid growth media. |
| Other | recombinant human R-spondin 1 | R & D systems | 4645-RS-100 | For organoid growth media. |
| Other | recombinant human FGF2 | Peprotech | 100–18 C | For organoid growth media. |
| Other | recombinant human HGF | Peprotech | 100–39 | For organoid growth media. |
| Other | ITS-X supplement | Gibco | 51500–056 | For organoid growth media. |
| Other | KO serum replacement | ThermoFisher | 10828010 | For organoid growth media. |
| Other | NRG1 | Cell Signaling | 5218SC | For organoid growth media. |
| Other | A83-01 | Tocris | 2939 | For organoid growth media. |
| Other | Y27632 | Sigma or STEMCell Technologies | Y0503 or 72304 | For organoid growth media. |
| Other | nicotinamide | Sigma | N0636 | For organoid growth media. |
| Other | FBS | Cytiva HyClone | SH30070.03 | For organoid growth media. Heat inactivated at 50 oC for 30 min. |
| Other | Advanced DMEM/F12 medium | Life Technologies | 12634–010 | For organoid growth media. |
| Other | 24-well tissue culture plates | Corning | 3526 | For organoid plating. |
| Cell line (human) | HEK-Blue IFN-λ reporter cells | InvivoGen | hkb-ifnl | |
| Other | HCMV AD169r BADrUL131-Y4 | T. Shenk | PMID: 16051825 | |
| Other | HCMV TB40/E | N. Moorman | PMID: 21307184 | |
| Other | 8-well chamber slide | Millipore | PEZGS0816 | For organoid plating. |
| Other | Cell recovery solution | Corning | 354253 | |
| Other | Vectashield | Vector Laboratories | H-1200–10 | Mounting medium for immunofluorescence. |
| Antibody | Mouse monoclonal Cytokeratin-19 | Abcam | ab9221 | (Immunofluorescence, 1:500) |
| Antibody | Rabbit monoclonal Cytokeratin-19 | Abcam | ab52625 | (Immunofluorescence, 1:500) |
| Antibody | Rabbit polyclonal E-cadherin | Invitrogen | PA5-85088 | (Immunofluorescence, 1:500) |
| Antibody | Rabbit monoclonal EpCAM | Abcam | ab223582 | (Immunofluorescence, 1:500) |
| Antibody | Mouse monoclonal Mucin 5AC | Abcam | ab3649 | (Immunofluorescence, 1:500) |
| Antibody | Rabbit polyclonal SIGLEC6 | Abcam | ab262851 | (Immunofluorescence, 1:500) |
| Antibody | Mouse monoclonal HLA-G | Abcam | ab52454 | (Immunofluorescence, 1:500) |
| Antibody | Rabbit monoclonal HLA-G | Abcam | ab283260 | (Immunofluorescence, 1:500) |
| Antibody | Mouse monoclonal Ki67 | BD Biosciences | 550609 | (Immunofluorescence, 1:500; Immunohistochemistry, 1:200) |
| Antibody | Rabbit monoclonal SDC-1 | Abcam | ab128936 | (Immunofluorescence, 1:500) |
| Other | Alexa Fluor 594–conjugated phalloidin | Invitrogen | A12381 | For actin staining. (Immunofluorescence 1:1000) |
| Other | Alexa Fluor 633–conjugated phalloidin | Invitrogen | A22284 | For actin staining. (Immunofluorescence 1:1000) |
| Other | Alexa Fluor Plus 488 Goat anti-Mouse IgG secondary antibody | Invitrogen | A32723 | Secondary antibody for immunofluorescence. (Immunofluorescence 1:1000) |
| Other | Alexa Fluor 594 Goat anti-Mouse IgG secondary antibody | Invitrogen | A11032 | Secondary antibody for immunofluorescence. (Immunofluorescence 1:1000) |
| Other | Alexa Fluor 488 Goat anti-Rabbit IgG secondary antibody | Invitrogen | A11034 | Secondary antibody for immunofluorescence. (Immunofluorescence 1:1000) |
| Other | Alexa Fluor 594 Goat anti-Rabbit IgG secondary antibody | Invitrogen | A11037 | Secondary antibody for immunofluorescence. (Immunofluorescence 1:1000) |
| Software, algorithm | Fiji | N/A | https://imagej.net/software/fiji/ | For image analysis, including three- dimensional reconstructions. |
| Software, algorithm | CellSens | Olympus | N/A | |
| Software, algorithm | Imaris | Oxford Instruments | Version 9.2.; for image analysis, including three- dimensional reconstructions. | |
| Software, algorithm | CLC Genomics | Qiagen | Version 20 | |
| Software, algorithm | GraphPad Prism | Dotmatics | Version 9 | |
| Other | Vectastain Elite ABC HRP Kit | Vector Laboratories | PK-6100 | For immunohistochemistry. |
| Other | Biotinylated Goat Anti-Rabbit | Vector Laboratories | BA-1000 | For immunohistochemistry. (Immunohistochemistry, 1:250) |
| Other | Biotinylated Goat Anti-Mouse | Vector Laboratories | BA-9200 | For immunohistochemistry. (Immunohistochemistry, 1:250) |
| Other | DAB substrate | Vector Laboratories | SK-4100 | For immunohistochemistry. |
| Other | Vectamount Permanent Mounting Medium | Vector Laboratories | H-5000 | For immunohistochemistry. |
| Commercial assay, kit | GenElute total mammalian RNA miniprep kit | Sigma | RTN70-1KT | With on-column DNAse treatment |
| Commercial assay, kit | iScript cDNA synthesis kit | Biorad | 1708891 | N/A |
| Commercial assay, kit | iQ SYBR Green Supermix | Biorad | 1708882 | N/A |
| Software, algorithm | DeSeq2 | M.Love et al | PMID: 25516281 | https://bioconductor.org/packages/release/bioc/html/DESeq2.html |
| Software, algorithm | pheatmap | Raivo Kolde | https://cran.r-project.org/web/packages/pheatmap/pheatmap.pdf | |
| Software, algorithm | pcaExplorer | Marini and Binder | PMID: 31195976 | https://bioconductor.org/packages/release/bioc/html/pcaExplorer.html |
| Commercial assay, kit | Bio-Plex Pro Human Inflammation Panel 1 | Biorad | 171AL001M | |
| Commercial assay, kit | Bio-Plex Human Chemokine Panel, 40-plex | Biorad | 171AK99MR2 | |
| Commercial assay, kit | Bio-Plex Pro Human Cytokine Screening Panel, 48-Plex kit | Biorad | 12007283 | |
| Commercial assay, kit | hCG Human ProcartaPlex Simplex Kit | Thermo Fisher | EPX010-12388-901 | |
| Commercial assay, kit | CA125/Mucin-16 Human ProcartaPlex Simplex Kit | Thermo Fisher | EPX010-12437-901 | |
| Chemical compound, drug | Poly(I:C) HMW | Invivogen | tlrl-pic | |
| Chemical compound, drug | Ruxolitinib | Invivogen | tlrl-rux | |
| Biological sample | Primary human trophoblasts from full term placentas | PMID: 27066743 | SRP067137 | Bulk RNASeq from primary human trophoblasts. |
| Biological sample | Primary human trophoblasts from full term placentas | PMID: 28784796 | SRP109039 | Bulk RNASeq from primary human trophoblasts. |
| Biological sample | First trimester placental tissue | University of Cambridge | PRJEB38810 | Bulk RNASeq from first trimester placental tissue. |
| Biological sample | Full-term placental tissue | PMID: 33969332 | PRJNA721668 | Bulk RNASeq from ffull-term placental tissue. |
Additional files
Download links
A two-part list of links to download the article, or parts of the article, in various formats.
Downloads (link to download the article as PDF)
Open citations (links to open the citations from this article in various online reference manager services)
Cite this article (links to download the citations from this article in formats compatible with various reference manager tools)
Innate immune signaling in trophoblast and decidua organoids defines differential antiviral defenses at the maternal-fetal interface
eLife 11:e79794.
https://doi.org/10.7554/eLife.79794


