Fixation can change the appearance of phase separation in living cells
- Division of Chemistry and Chemical Engineering, California Institute of Technology, United States
- Division of Biology and Biological Engineering, California Institute of Technology, United States
Figures
Figure 1 with 4 supplements
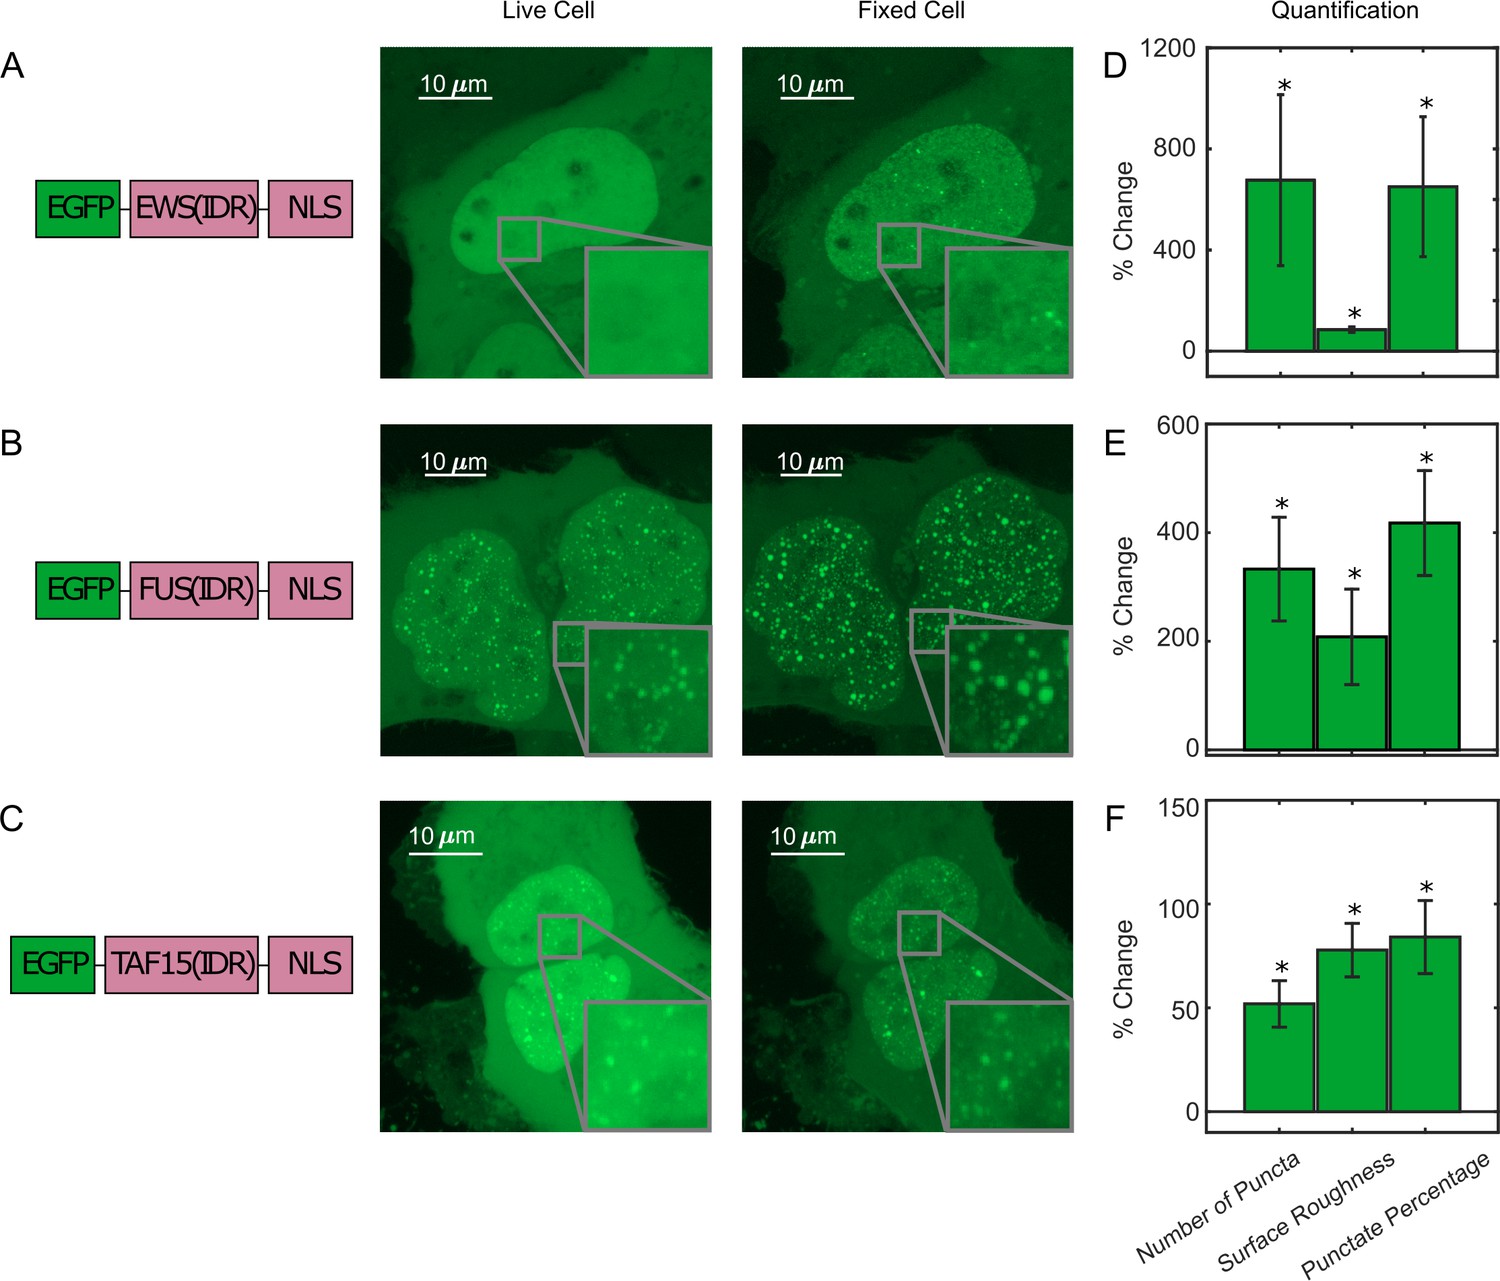
Fixation can change the apparent liquid–liquid phase separation (LLPS) behaviors of proteins.
(A) EGFP-EWS(IDR), (B) EGFP-FUS(IDR), and (C) EGFP-TAF15(IDR) are transiently expressed in U2OS cells and imaged before and after fixation using confocal fluorescence microscopy. A schematic of each protein construct is shown on the left. A maximum z-projection of a representative live cell expressing its respective protein is shown next to that of the same cell after 10 min of fixation with 4% paraformaldehyde (PFA). The inserts show a zoomed-in region of the cell. (D–F) Quantification of percentage change of LLPS parameters after fixation. The values are averaged from 34 (D), 17 (E), or 24 (F) cells measured in 3 (D), 2 (E), or 2 (F) independent transfection and imaging sessions. Error bars represent standard errors. Asterisks indicate a significant difference compared with 0 (p<0.05, Wilcoxon signed-rank test).
-
Figure 1—source data 1
Quantification of puncta parameters used to generate the bar plots.
- https://cdn.elifesciences.org/articles/79903/elife-79903-fig1-data1-v3.xlsx
Figure 1—figure supplement 1
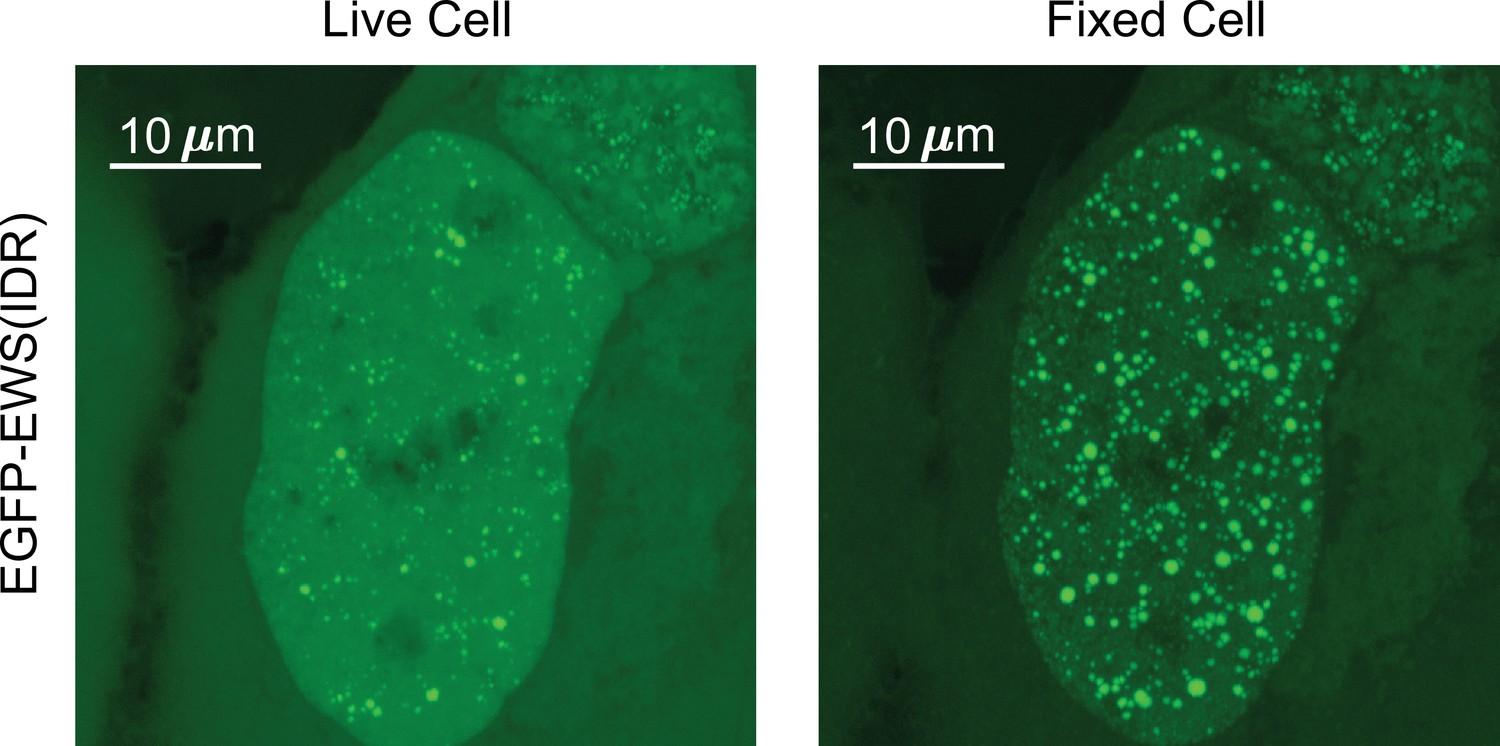
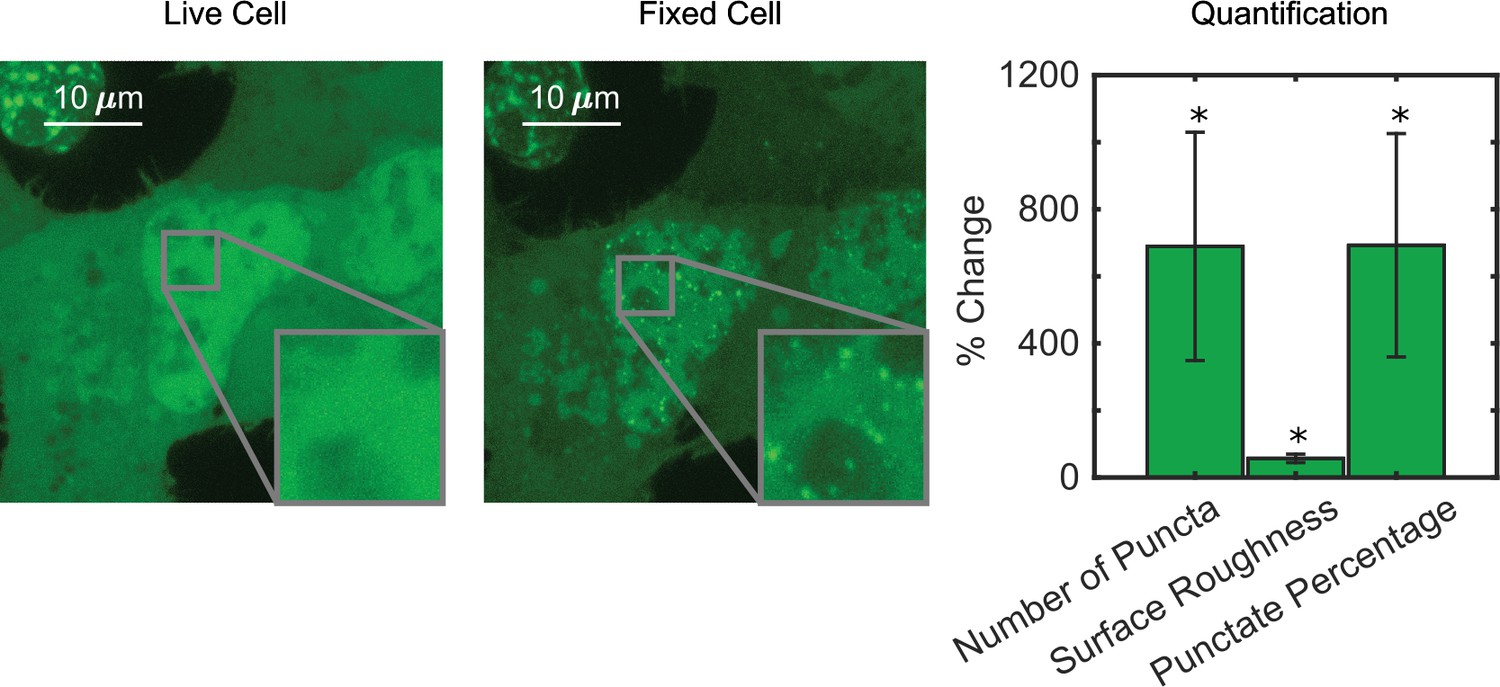
EGFP-EWS(IDR) can form droplet-like puncta in living cells, which change appearance upon fixation.
Figure 1—figure supplement 2
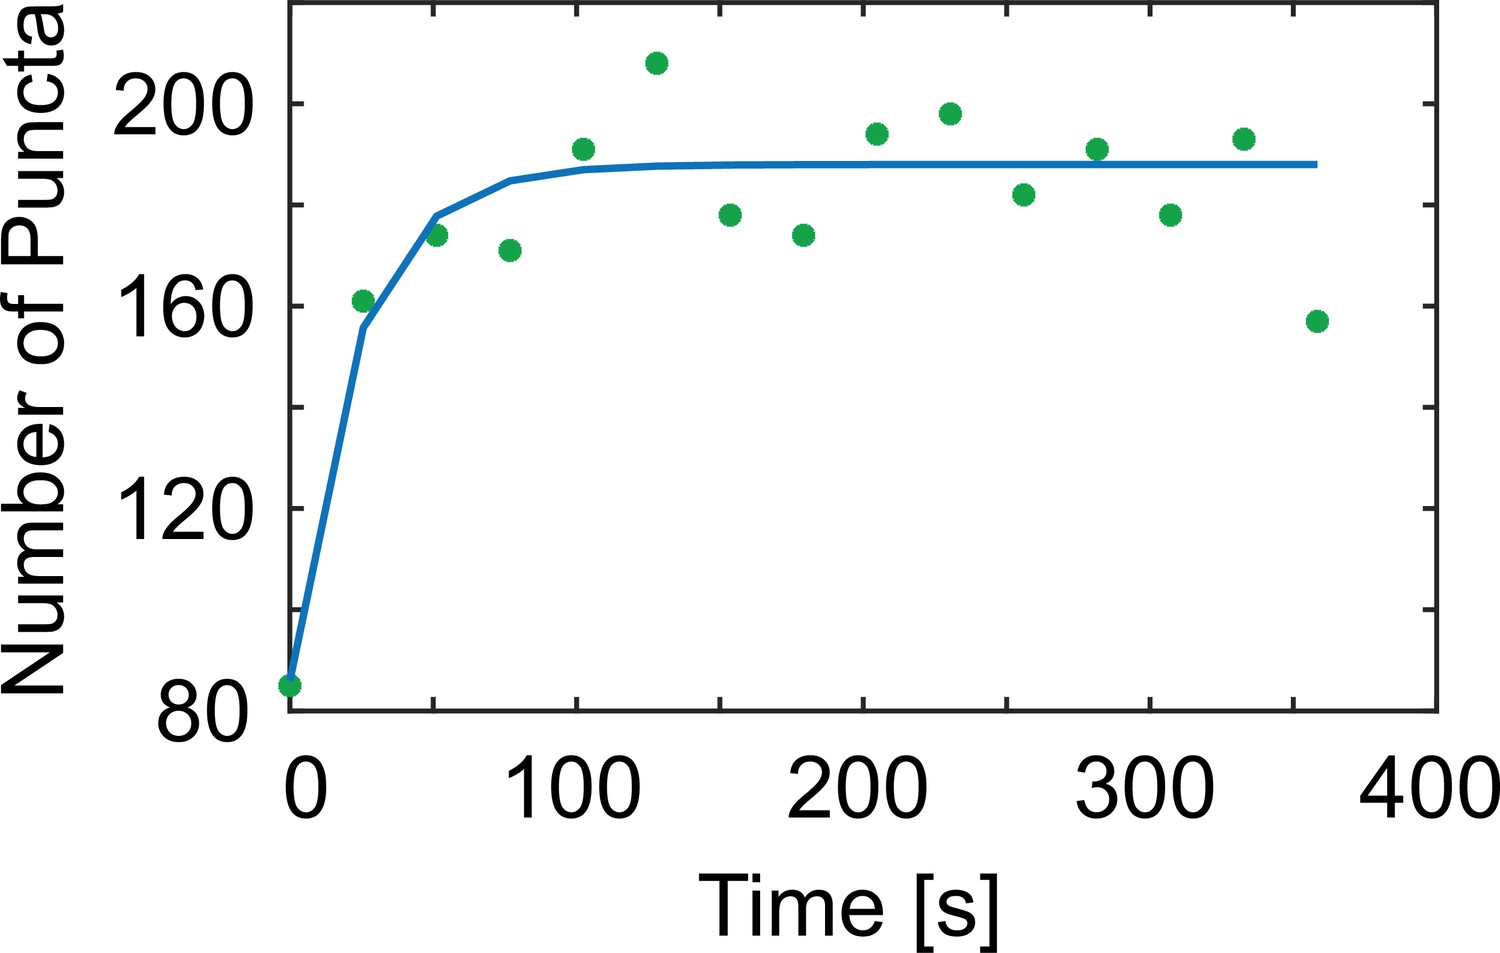
Quantification of Video 1 shows the number of EGFP-FUS(IDR) puncta in the cell as a function of the length of paraformaldehyde (PFA) treatment.
Fixation is complete in ~100 s. The green scattered plot represents actual data points, and the blue line plot is to guide the eye.
Figure 1—figure supplement 3
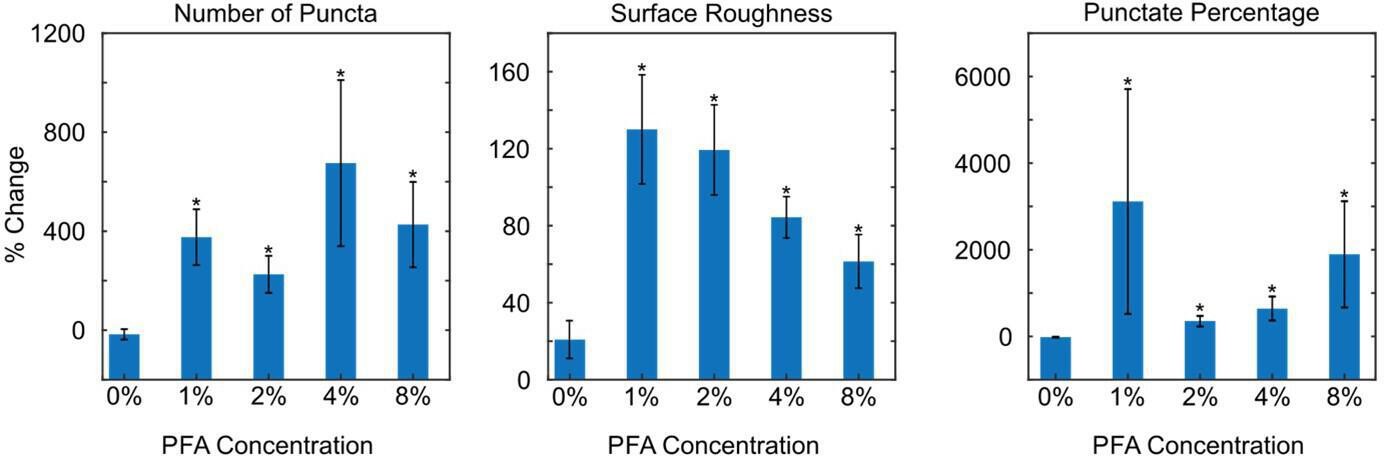
Fixation at various paraformaldehyde (PFA) concentrations can change the apparent liquid–liquid phase separation (LLPS) behaviors of EGFP-EWS(IDR).
We show the percentage change of LLPS parameters after 10 min of fixation. The values are averaged from 10 (0% PFA, PBS buffer only), 20 (1% PFA), 20 (2% PFA), 34 (4% PFA), or 20 (8% PFA) cells. Error bars represent standard errors. Asterisks indicate a significant difference of the values compared with 0 (p<0.05, Wilcoxon signed-rank test). All the tested concentrations of PFA except for 0% PFA (PBS only) result in a significant change of the LLPS parameters. A quantitative comparison between the results at different PFA concentrations is difficult due to increased fluorescence quenching effects at higher concentrations of PFA. We thus focus on comparing the percentage change of LLPS parameters with 0 and with that upon treatment of PBS only.
-
Figure 1—figure supplement 3—source data 1
Quantification of puncta parameters used to generate Figure 1—figure supplements 3 and 4.
- https://cdn.elifesciences.org/articles/79903/elife-79903-fig1-figsupp3-data1-v3.xlsx
Figure 1—figure supplement 4
Fixation using paraformaldehyde/glutaraldehyde (PFA/GA) in combination still changes the apparent liquid–liquid phase separation (LLPS) behaviors of EGFP-EWS(IDR).
Adding 0.2% GA to 4% PFA does not reduce the fixation artifact. The fixed-cell image was taken 10 min after PFA/GA treatment. Percentage change of LLPS parameters after PFA/GA fixation is significantly different from 0, but not significantly different from the percentage change upon PFA only fixation (Figure 1D). The values here are averaged from 20 cells measured in one transfection and imaging session. Error bars represent standard errors. Asterisks indicate a significant difference compared with 0 (p<0.05, Wilcoxon signed-rank test).
Figure 2 with 1 supplement
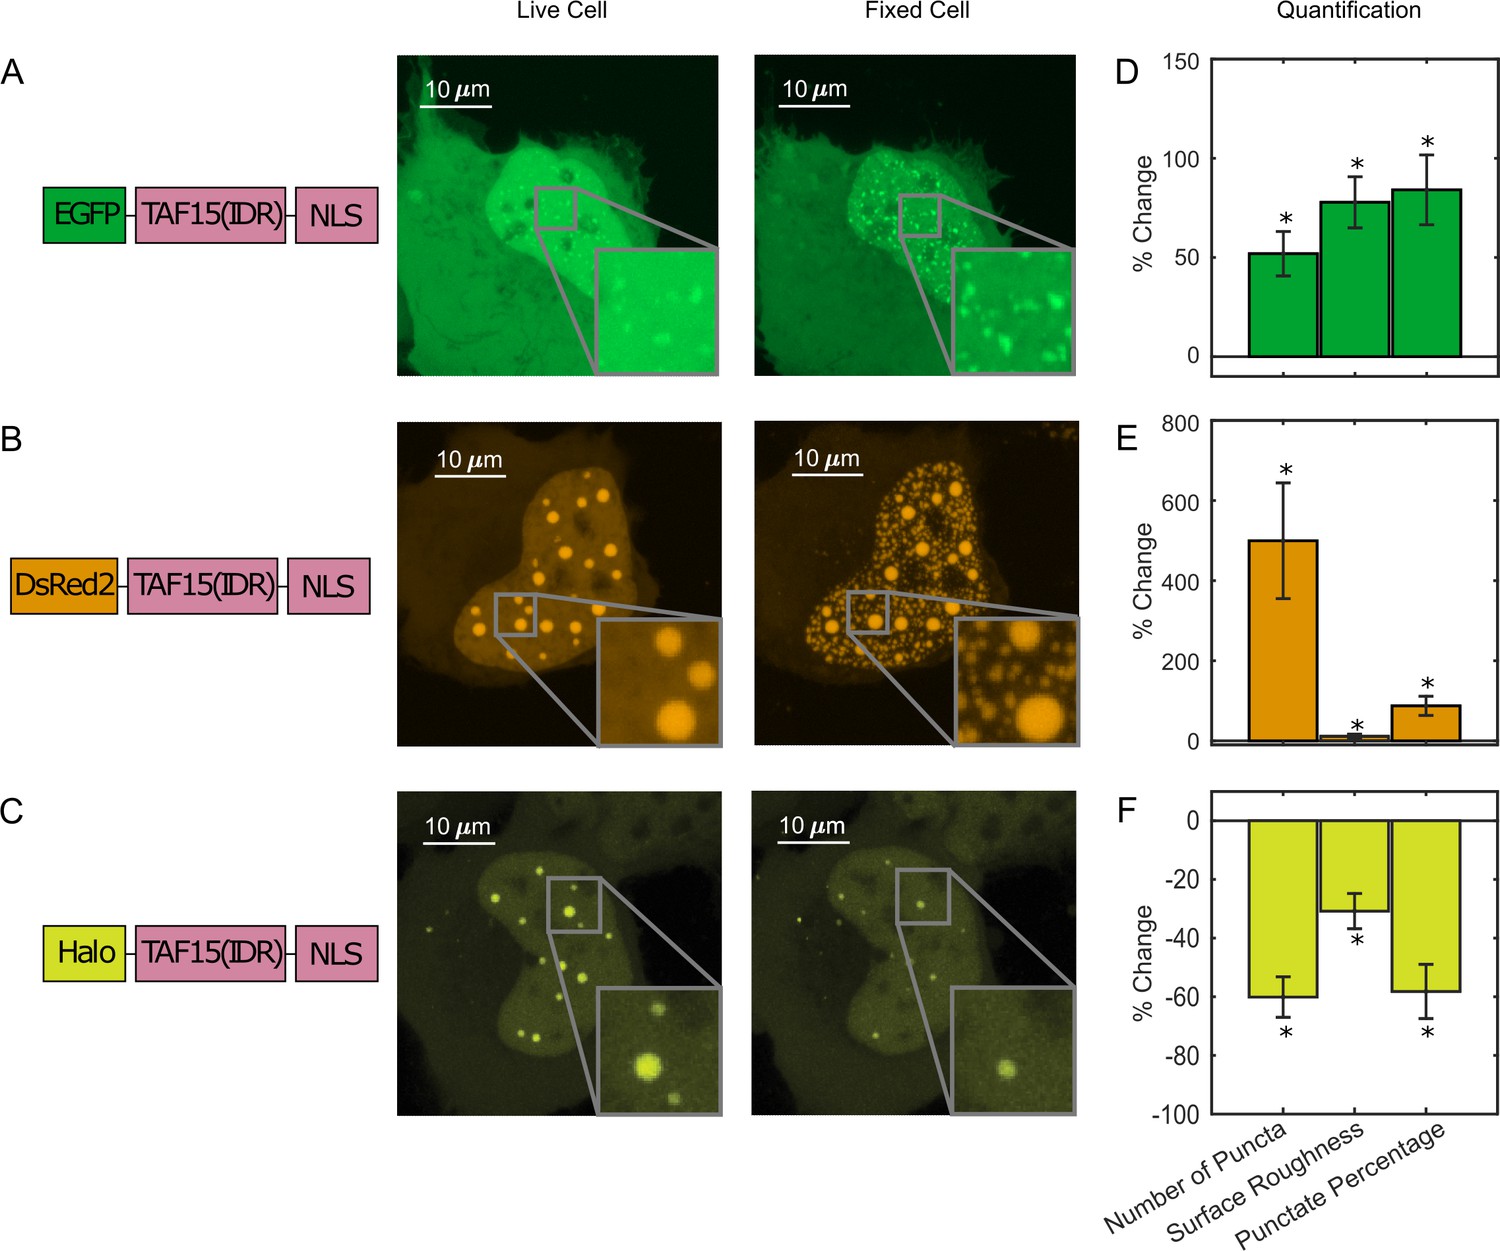
Paraformaldehyde (PFA) fixation can both enhance and diminish liquid–liquid phase separation (LLPS) appearance.
U2OS cells expressing (A) EGFP-TAF15(IDR), (B) DsRed2-TAF15(IDR), and (C) Halo-TAF15(IDR), ligated with the JFX549 Halo ligand, are imaged using confocal fluorescence microscopy before and after 10 min of fixation with 4% PFA. Schematics of the protein constructs are shown on the left. Live- and fixed-cell images are compared. (D–F) Quantification of LLPS parameters after fixation. The values are averaged from 24 (D), 23 (E), or 10 (F) cells measured in 2 (D), 2 (E), or 3 (F) independent transfection and imaging sessions. Error bars represent standard errors. Asterisks indicate a significant difference compared with 0 (p<0.05, Wilcoxon signed-rank test).
-
Figure 2—source data 1
Quantification of puncta parameters used to generate the bar plots.
- https://cdn.elifesciences.org/articles/79903/elife-79903-fig2-data1-v3.xlsx
Figure 2—figure supplement 1
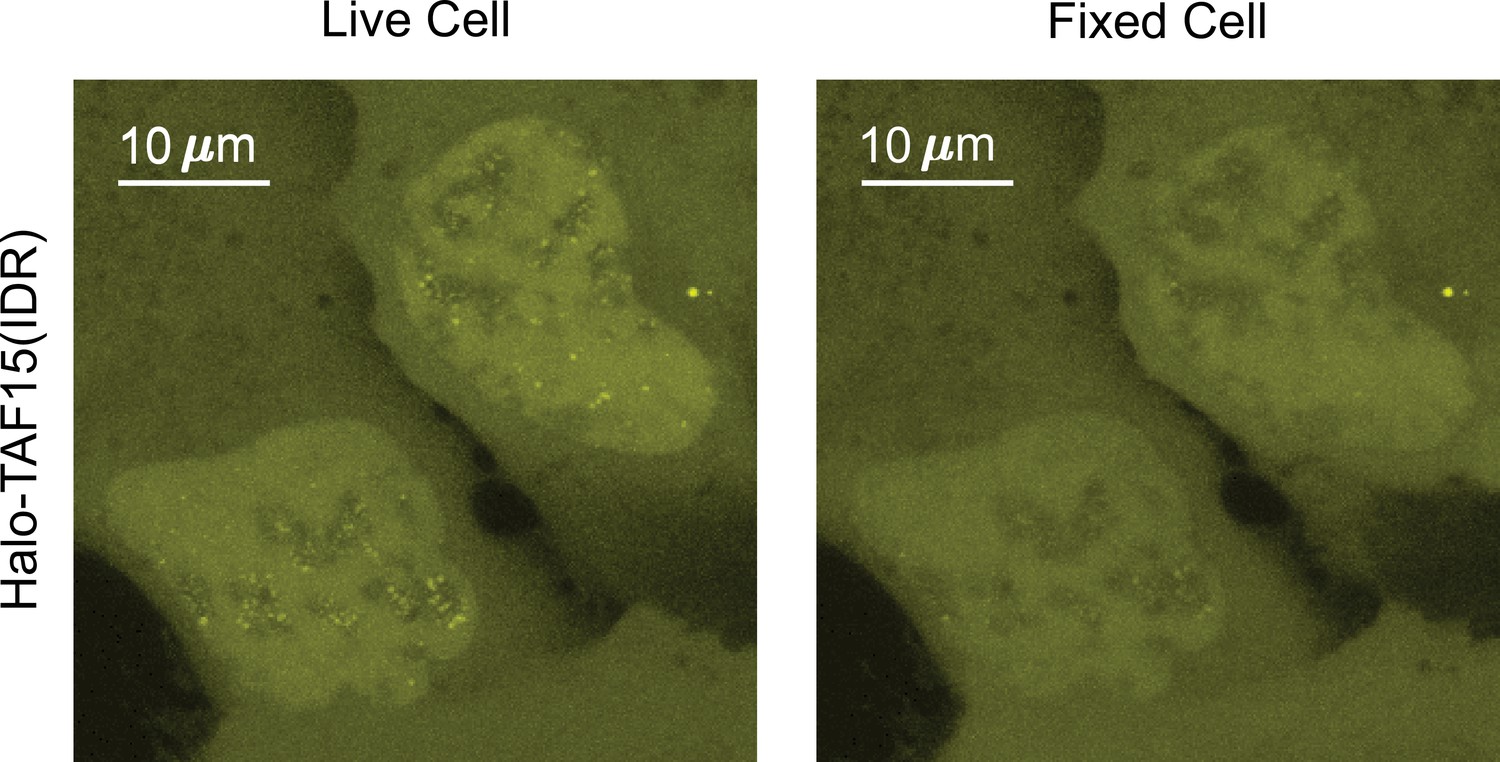
Fixation can diminish liquid–liquid phase separation (LLPS) appearance.
Two U2OS cells expressing Halo-TAF15(IDR) are side-by-side in the same field of view. Puncta formed in live-cell nuclei disappeared after fixation.
Figure 3
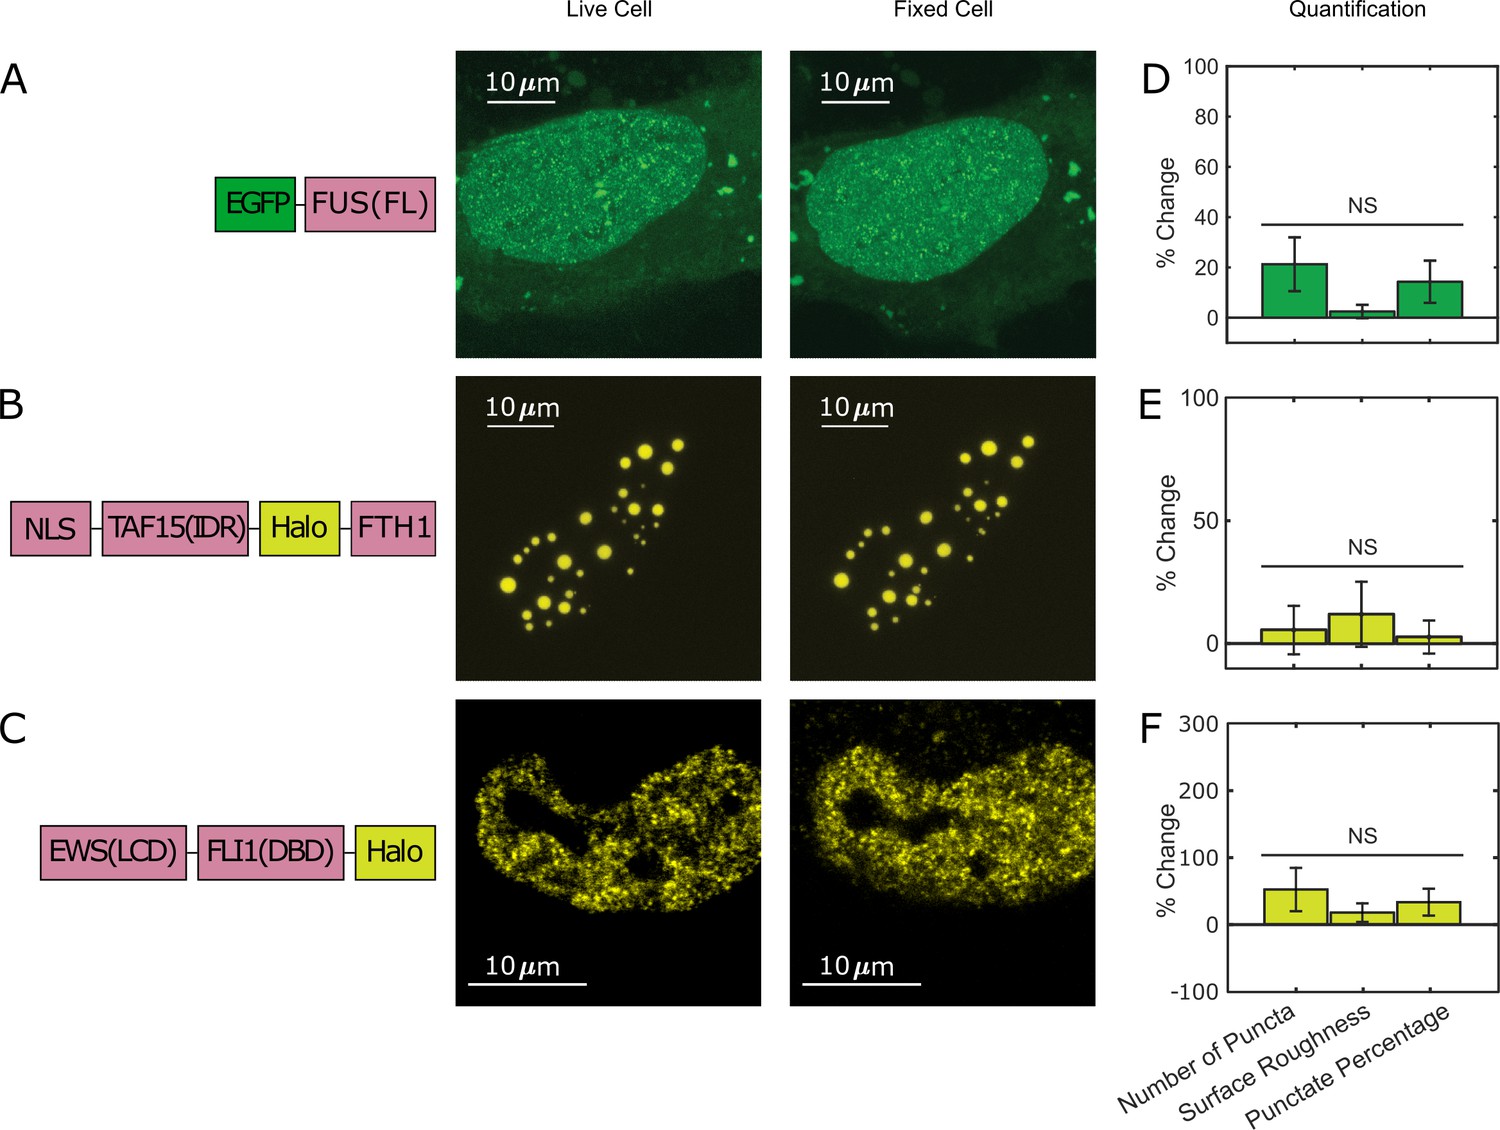
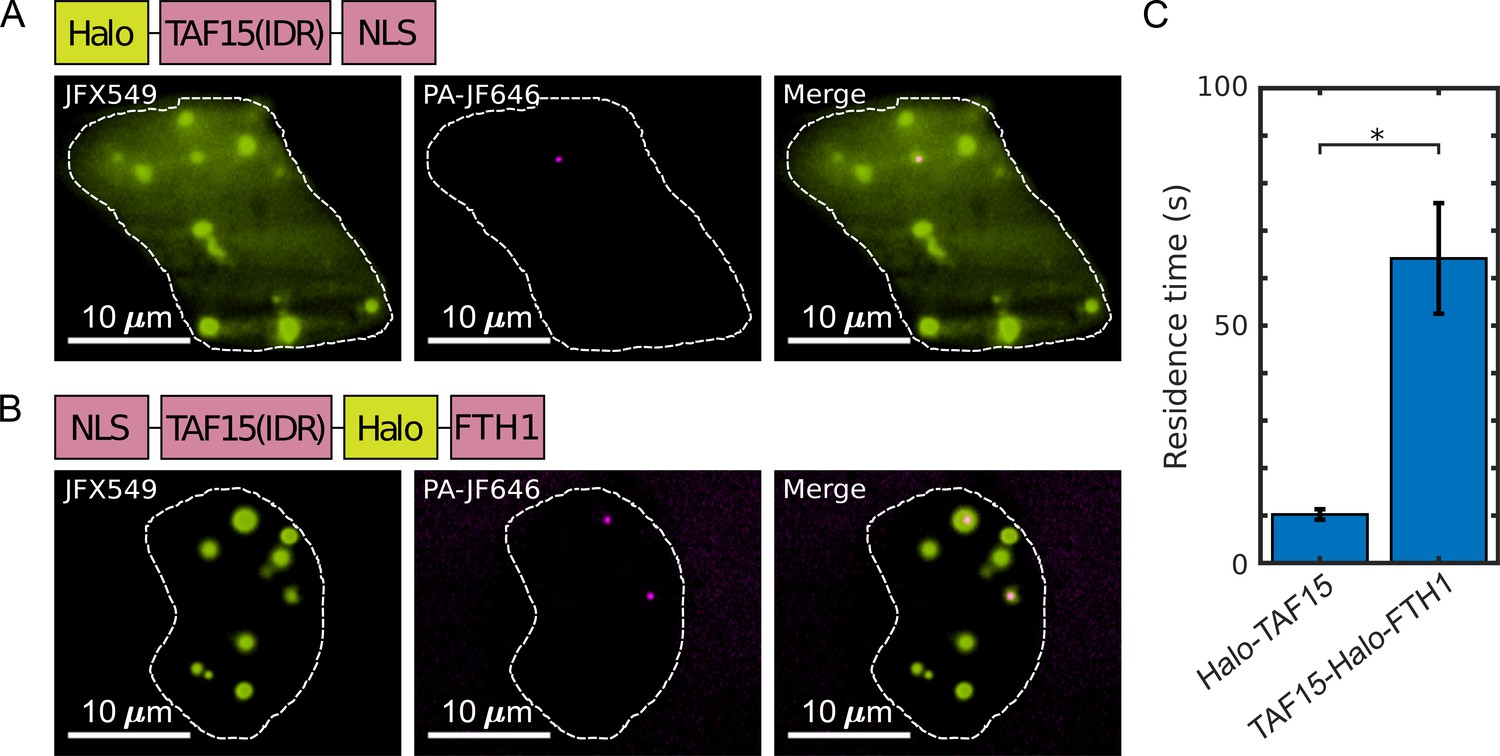
Not all puncta-forming proteins show the fixation artifact.
U2OS cells expressing (A) EGFP-FUS(FL) and (B) TAF15(IDR)-Halo-FTH1, and (C) an A673 cell expressing endogenous EWS::FLI1-Halo are imaged using confocal fluorescence microscopy before and after 10 min of fixation with 4% paraformaldehyde (PFA). Halo-tagged proteins are ligated with the JFX549 Halo ligand before imaging. Schematics of the protein constructs are shown on the left. Live- and fixed-cell images are compared. (D–F) Quantification of puncta parameters after fixation. The values are averaged from 21 (D), 16 (E), or 15 (F) cells measured in 1 (D), 4 (E), or 2 (F) independent transfection and imaging sessions. Error bars represent standard errors. NS: not significant difference compared with 0 (p<0.05, Wilcoxon signed-rank test). None of the examined proteins show significant changes in their liquid–liquid phase separation (LLPS) or hub appearance in the fixed-cell image as compared to the live-cell image.
-
Figure 3—source data 1
Quantification of puncta parameters used to generate the bar plots.
- https://cdn.elifesciences.org/articles/79903/elife-79903-fig3-data1-v3.xlsx
Figure 4
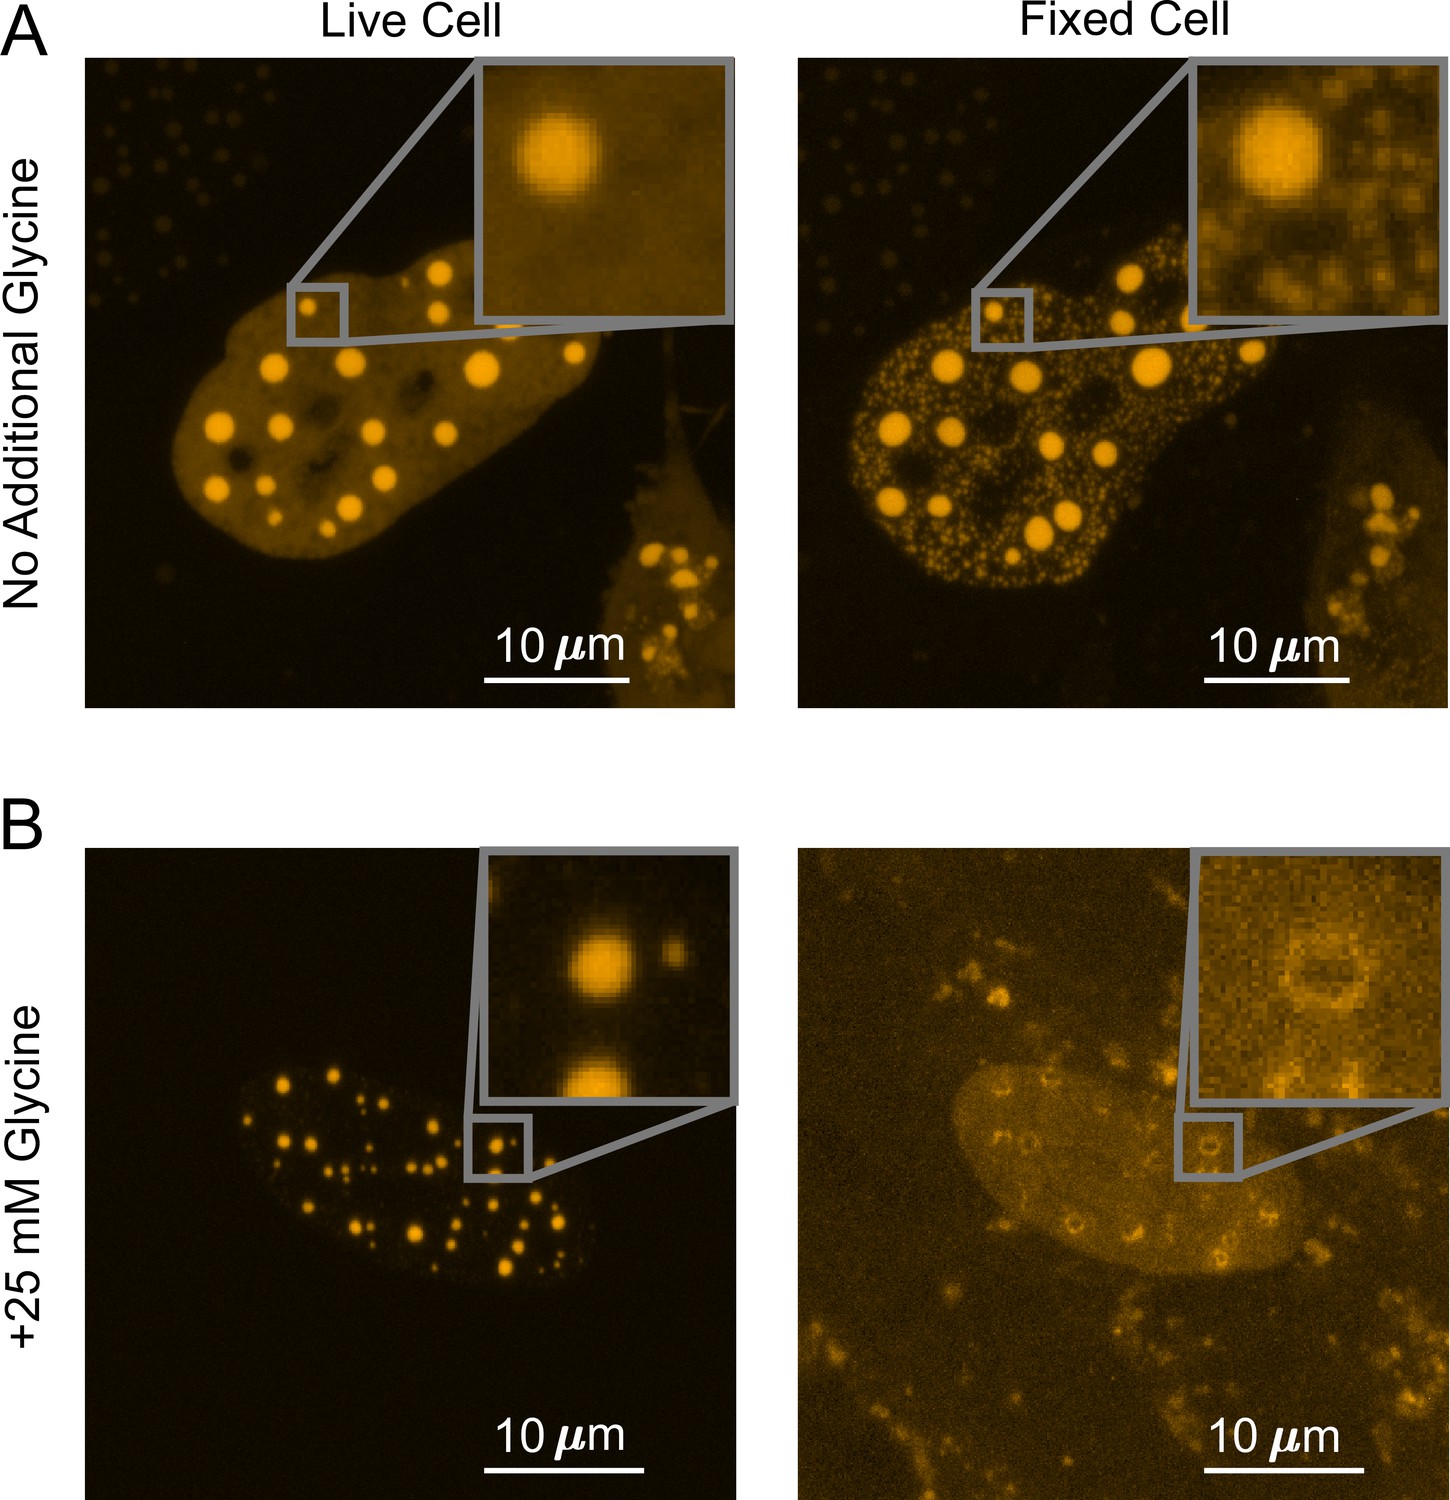
Competitive fixation pathway creates a reversed fixation artifact.
(A) Fixing U2OS cells that express DsRed2-TAF15(IDR) in the absence of additional glycine causes many small puncta to appear. (B) Fixing cells in the presence of 25 mM additional glycine results in a reduction in the number of puncta, with large puncta forming ‘donut’ shapes. In both (A) and (B), cells are imaged using confocal fluorescence microscopy before and after 10 min of fixation with 4% paraformaldehyde (PFA).
Figure 5
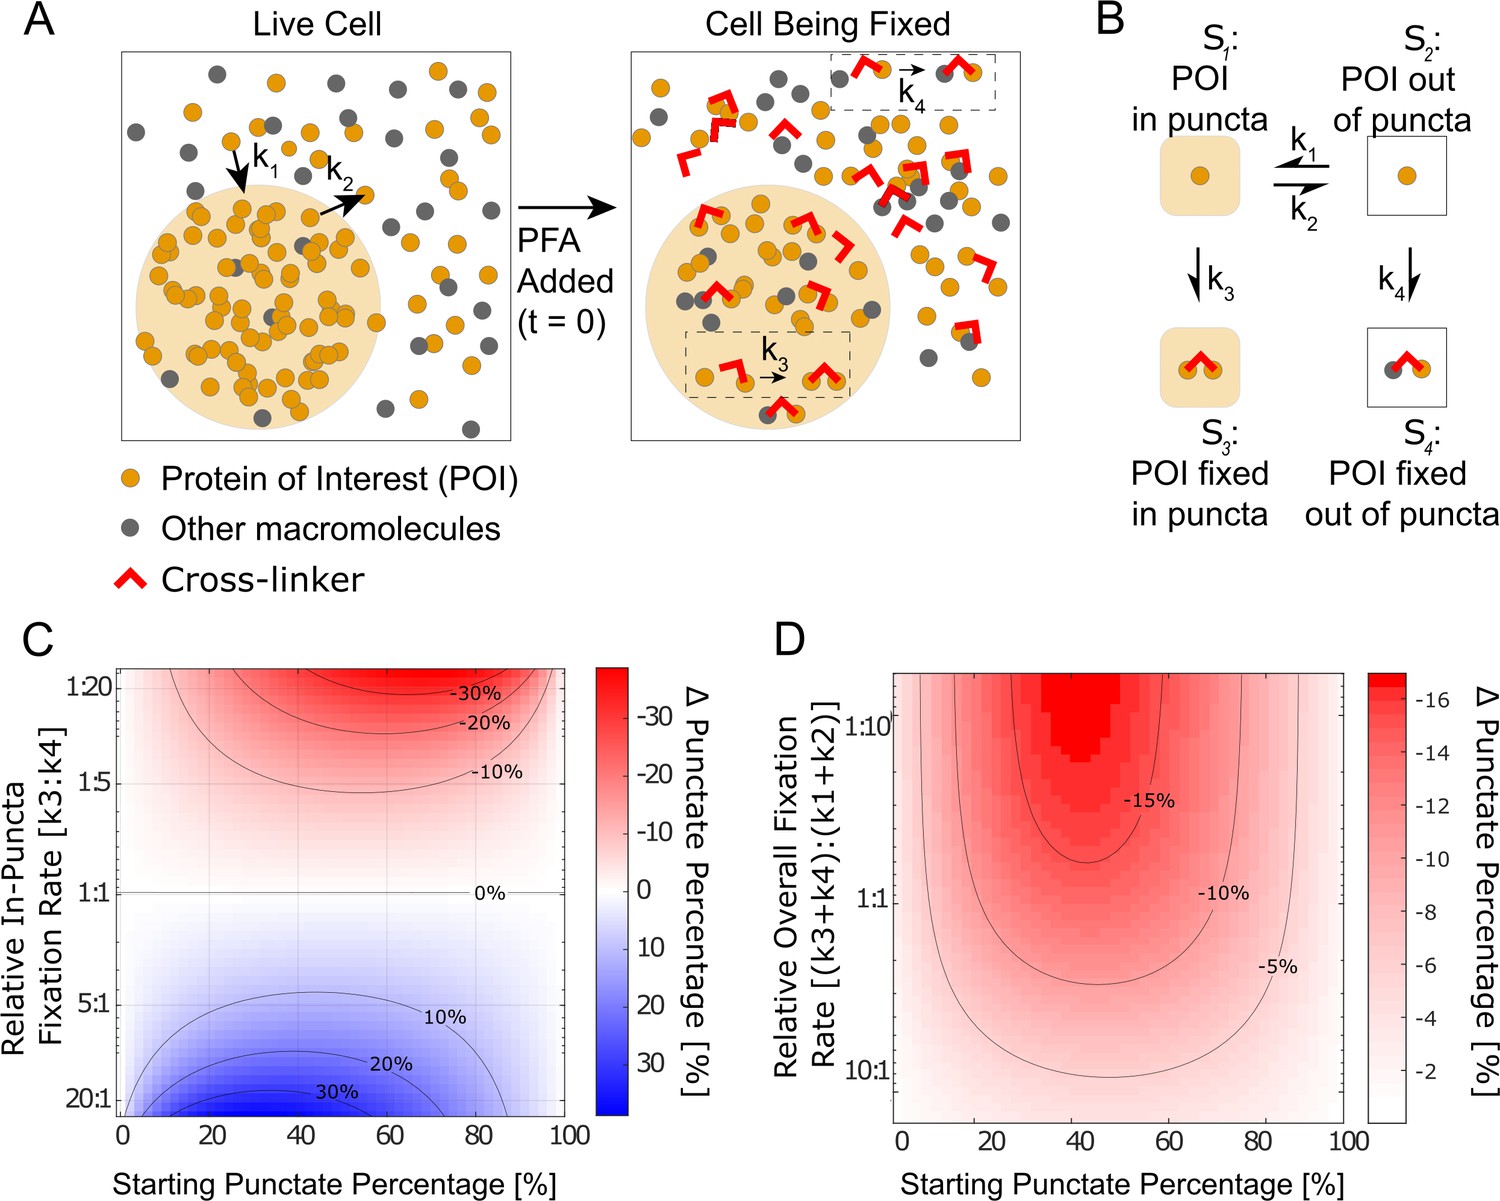
Kinetic simulation explains bifurcating fixation artifacts.
(A) Schematic that describes fixation of a phase-separating protein of interest (POI) in the cell. (B) The four-state kinetic model with associated kinetic rates connecting the different states. (C) Simulation of the fixation artifact as a function of the starting punctate percentage and the relative in-puncta fixation rate , assuming the overall fixation rate as well as overall protein binding and dissociation rates are constant (, ). Faster in-puncta fixation causes liquid–liquid phase separation (LLPS) behavior to be over-represented (blue). Slower in-puncta fixation causes LLPS behavior to be under-represented (red). (D) Simulation of the fixation artifact as a function of the starting punctate percentage and the relative overall fixation rate , assuming individual fixation rates are constant (, ). Fast overall fixation rate compared with protein–protein interaction dynamics decreases the fixation artifact. (C) and (D) were simulated over starting punctate percentages ranging from 0% (, ) to 100% (, ). Level curves are marked on (C) and (D).
Figure 6
The residence times of proteins in their droplet-like puncta vary.
Shown are individual frames from two-color single-molecule movies of (A) Halo-TAF15(IDR) and (B) TAF15(IDR)-Halo-FTH1. Each protein was labeled with a lower concentration of a photoactivatable dye for SPT (20 nM PA-JF646, magenta) and a higher concentration of non-photoactivatable dye for visualization of the droplet-like puncta (100 nM JFX549, yellow). A white dashed line outlines the nucleus. (C) The mean residence time of TAF15(IDR)-Halo-FTH1 in its puncta is significantly longer than that of Halo-TAF15(IDR) in its puncta. The value for each protein is averaged from 20 cells measured in three independent transfection and imaging sessions. Error bars represent standard errors. Asterisk indicates a significant difference between the two proteins (p<0.05, Wilcoxon rank-sum test).
-
Figure 6—source data 1
Residence times (RTs) measured by single-particle tracking (SPT) used to generate the bar plots.
- https://cdn.elifesciences.org/articles/79903/elife-79903-fig6-data1-v3.xlsx
Figure 7
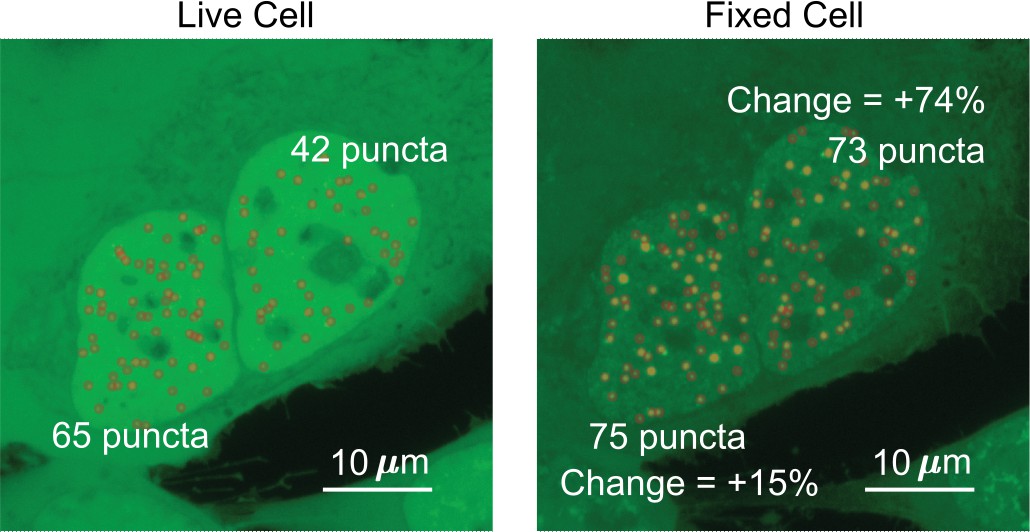
Determination of the number of puncta in the cell nucleus.
Two cells expressing EGFP-TAF15(IDR) have the number of puncta before and after fixation compared. The cell on the left shows an increase of 10 puncta, a change of 15%. The cell on the right shows an increase of 31 puncta, a change of 74%.
Figure 8
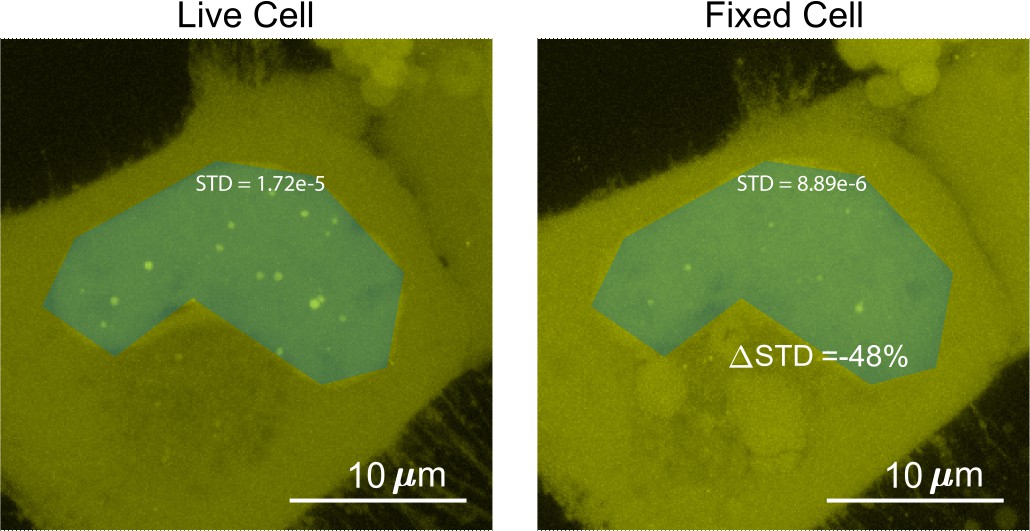
Determination of the surface roughness of a cell nucleus image.
We drew a blue patch that covers the nucleus of a cell expressing Halo-TAF15(IDR) and compared the standard deviation of the pixel intensity within the blue patch before and after fixation. The change in standard deviation between the two images is –48%.
Figure 9
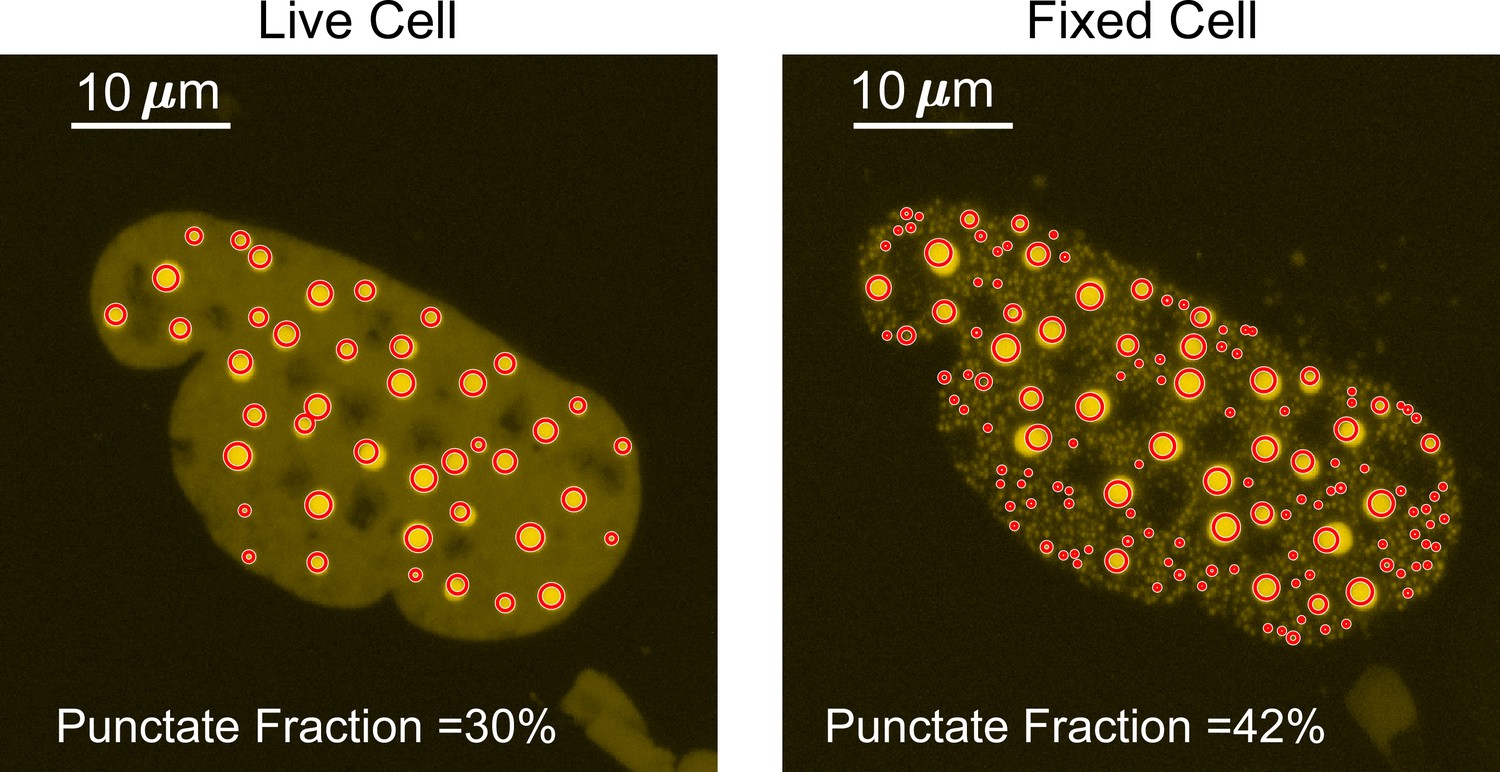
Determination of the punctate percentage.
The punctate percentage of DsRed2-TAF15(IDR) is compared before and after fixation. The red circles represent the boundary within which the integrated fluorescence is considered ‘in puncta’.
Videos
Video 1
Real-time imaging of a U2OS cell expressing EGFP-FUS(IDR) during paraformaldehyde (PFA) fixation.
Video 2
A two-color real-time movie of individual molecules of TAF15(IDR)-Halo-FTH1 binding to its puncta.
Tables
Key resources table
| Reagent type (species) or resource | Designation | Source or reference | Identifiers | Additional information |
|---|---|---|---|---|
| Cell line (human) | Knock-in A673 cell line | Chong et al., 2018 | N/A | Human: A673 carrying HaloTag knock-in at the ews::fli1 locus |
| Cell line (human) | U2OS cell line | Chong et al., 2018 | N/A | N/A |
| Recombinant DNA reagent | EGFP-EWS(IDR)-NLS | This paper | N/A | Plasmid encoding the protein See materials availability statement |
| Recombinant DNA reagent | EGFP-FUS(IDR)-NLS | This paper | N/A | Plasmid encoding the protein See materials availability statement |
| Recombinant DNA reagent | EGFP-TAF15(IDR)-NLS | This paper | N/A | Plasmid encoding the protein See materials availability statement |
| Recombinant DNA reagent | DsRed2-TAF15(IDR)-NLS | This paper | N/A | Plasmid encoding the protein See materials availability statement |
| Recombinant DNA reagent | Halo-TAF15(IDR)-NLS | Chong et al., 2018 | N/A | Plasmid encoding the protein See materials availability statement |
| Recombinant DNA reagent | EGFP-FUS(FL) | This paper | N/A | Plasmid encoding the protein See materials availability statement |
| Recombinant DNA reagent | NLS-TAF15(IDR)-Halo-FTH1 | This paper | N/A | Plasmid encoding the protein See materials availability statement |
| Chemical compound, drug | Glycine | Fisher Scientific | Fischer Scientific: BP381-5 | N/A |
| Chemical compound, drug | Paraformaldehyde | VWR | VWR: 100503-917 | N/A |
| Chemical compound, drug | Glutaraldehyde | Sigma-Aldrich | Sigma-Aldrich: 340855-25ML | N/A |
Additional files
-
MDAR checklist
- https://cdn.elifesciences.org/articles/79903/elife-79903-mdarchecklist1-v3.docx
-
Source code 1
Code used to quantify number of puncta, surface roughness of cell nucleus, and punctate percentage.
- https://cdn.elifesciences.org/articles/79903/elife-79903-code1-v3.zip
-
Source code 2
Code used to perform kinetic simulation of the four-state fixation model.
- https://cdn.elifesciences.org/articles/79903/elife-79903-code2-v3.zip
Download links
A two-part list of links to download the article, or parts of the article, in various formats.
Downloads (link to download the article as PDF)
Open citations (links to open the citations from this article in various online reference manager services)
Cite this article (links to download the citations from this article in formats compatible with various reference manager tools)
Fixation can change the appearance of phase separation in living cells
eLife 11:e79903.
https://doi.org/10.7554/eLife.79903


