Osteoclast-mediated resorption primes the skeleton for successful integration during axolotl limb regeneration
- CRTD/ Center for Regenerative Therapies TU, Center for Molecular and Cellular Bioengineering, Technische Universität Dresden, Germany
- Department of Stem Cell and Regenerative Biology, Harvard University, United States
- Center for Regenerative Medicine, Massachusetts General Hospital, Harvard Medical School, United States
- Max Planck Institute of Molecular Cell Biology and Genetics, Germany
- Center for Systems Biology Dresden, Germany
- Max Planck Institute for the Physics of Complex Systems, Germany
- Cluster of Excellence Physics of Life, Technische Universität Dresden, Germany
- Department of Biology, Wake Forest University, United States
- Department of Internal Medicine 3, Center for Healthy Aging, University Hospital Carl Gustav Carus at the Technische Universität Dresden, Germany
- Paul Langerhans Institute Dresden of Helmholtz Centre Munich, University Hospital Carl Gustav Carus at the Technische Universität Dresden, Germany
Figures
Figure 1
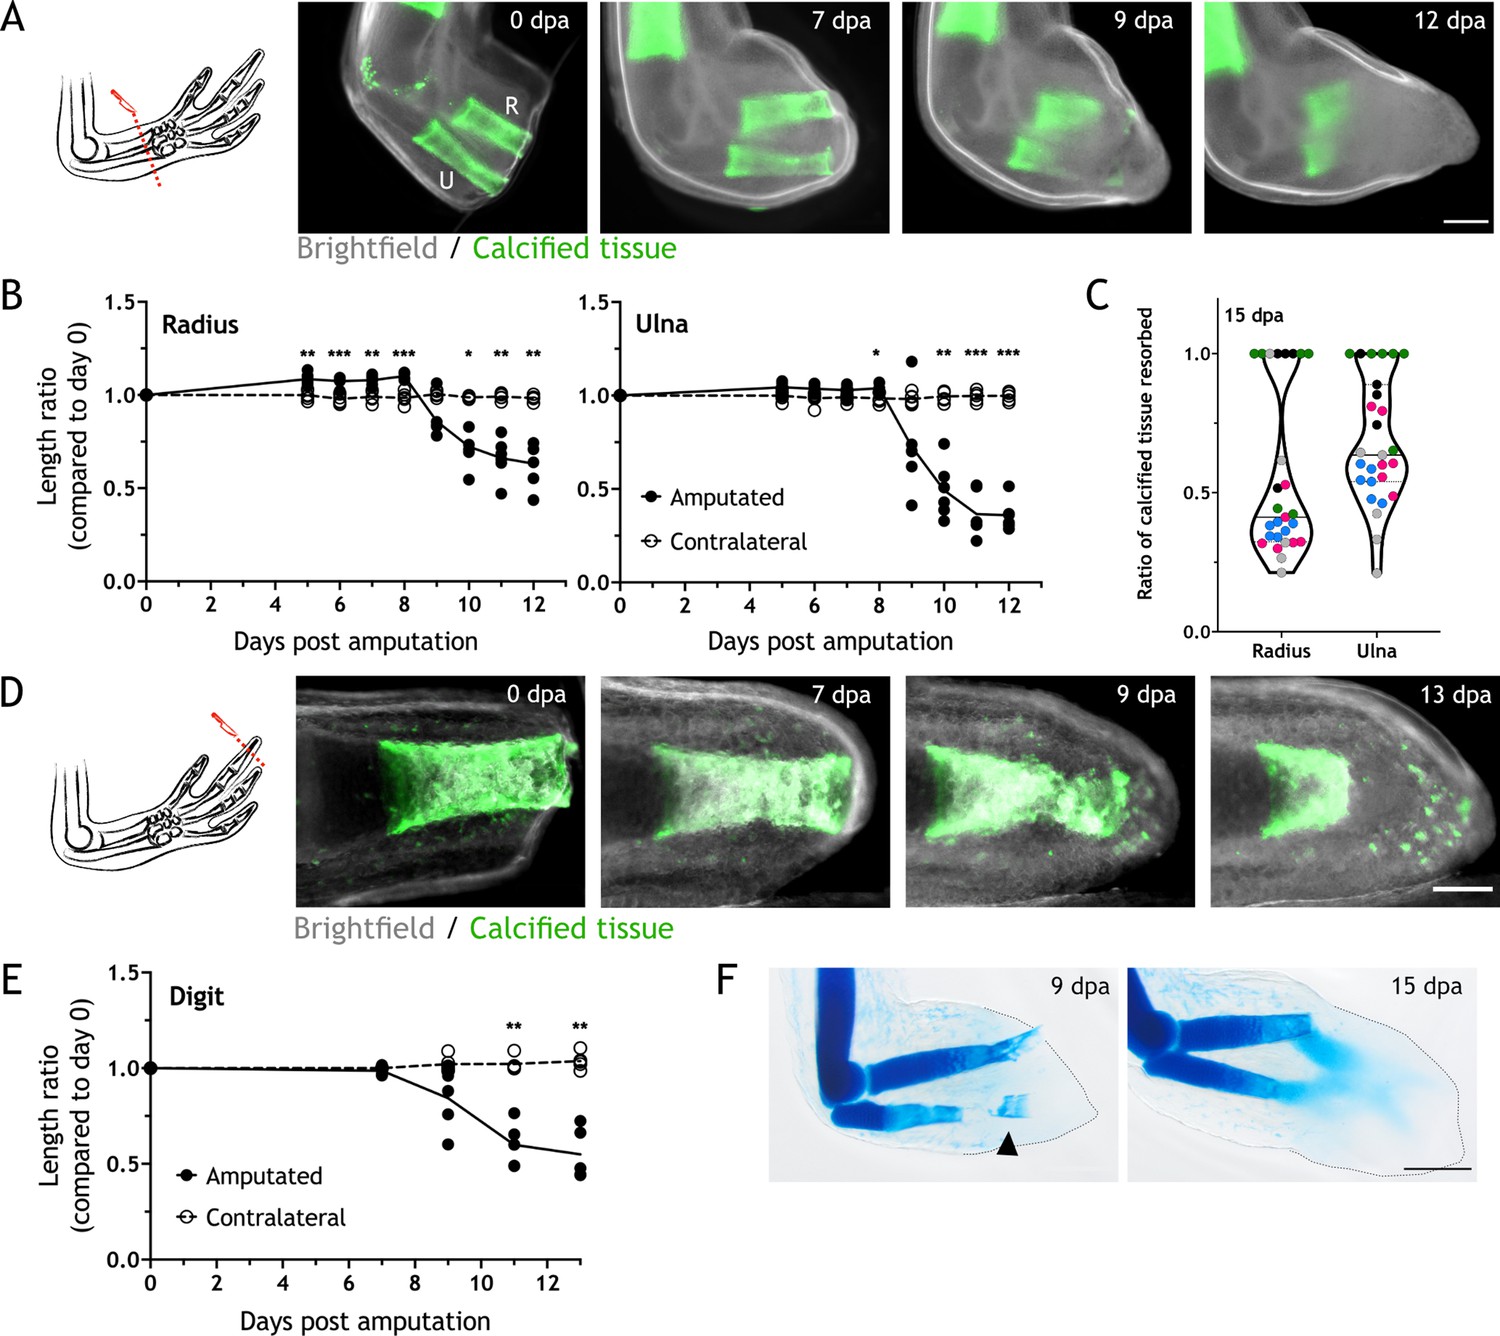
Skeletal elements are resorbed upon amputation.
(A) Time course of resorption during zeugopod regeneration. Calcein-stained axolotls were amputated at the distal end of the calcified tissue. R: radius; U: ulna; Scale bar: 500µm. (B) Quantification of resorption rate in radius and ulna in (A). Length ratio was calculated using the length at 0 dpa as a reference. Each dot represents an animal (n=6; *** p<0.001, ** p<0.01, * p<0.05, two-way ANOVA, Bonferroni’s multiple comparisons test, amputated versus contralateral). (C) Quantification of resorption percentage in calcified radius and ulna among animals in different assays. Each assay is represented by a color (pool of five independent experiments, n=27). (D) Time course of resorption during digit regeneration. Calcein-stained axolotls were amputated at the distal end of the calcified tissue. Scale bar: 200µm. (E) Quantification of calcified digit resorption in (D). Length ratio was calculated using the length at 0 dpa as a reference. Each dot represents an animal (n=5; ** p<0.01, two-way ANOVA, Bonferroni’s multiple comparisons test, amputated versus contralateral). (F) Alcian blue staining of limbs at different dpa. Arrowhead: broken piece of ulna. Dashed line: outline of distal limb. Scale bar: 500µm (n=2).
Figure 2 with 1 supplement
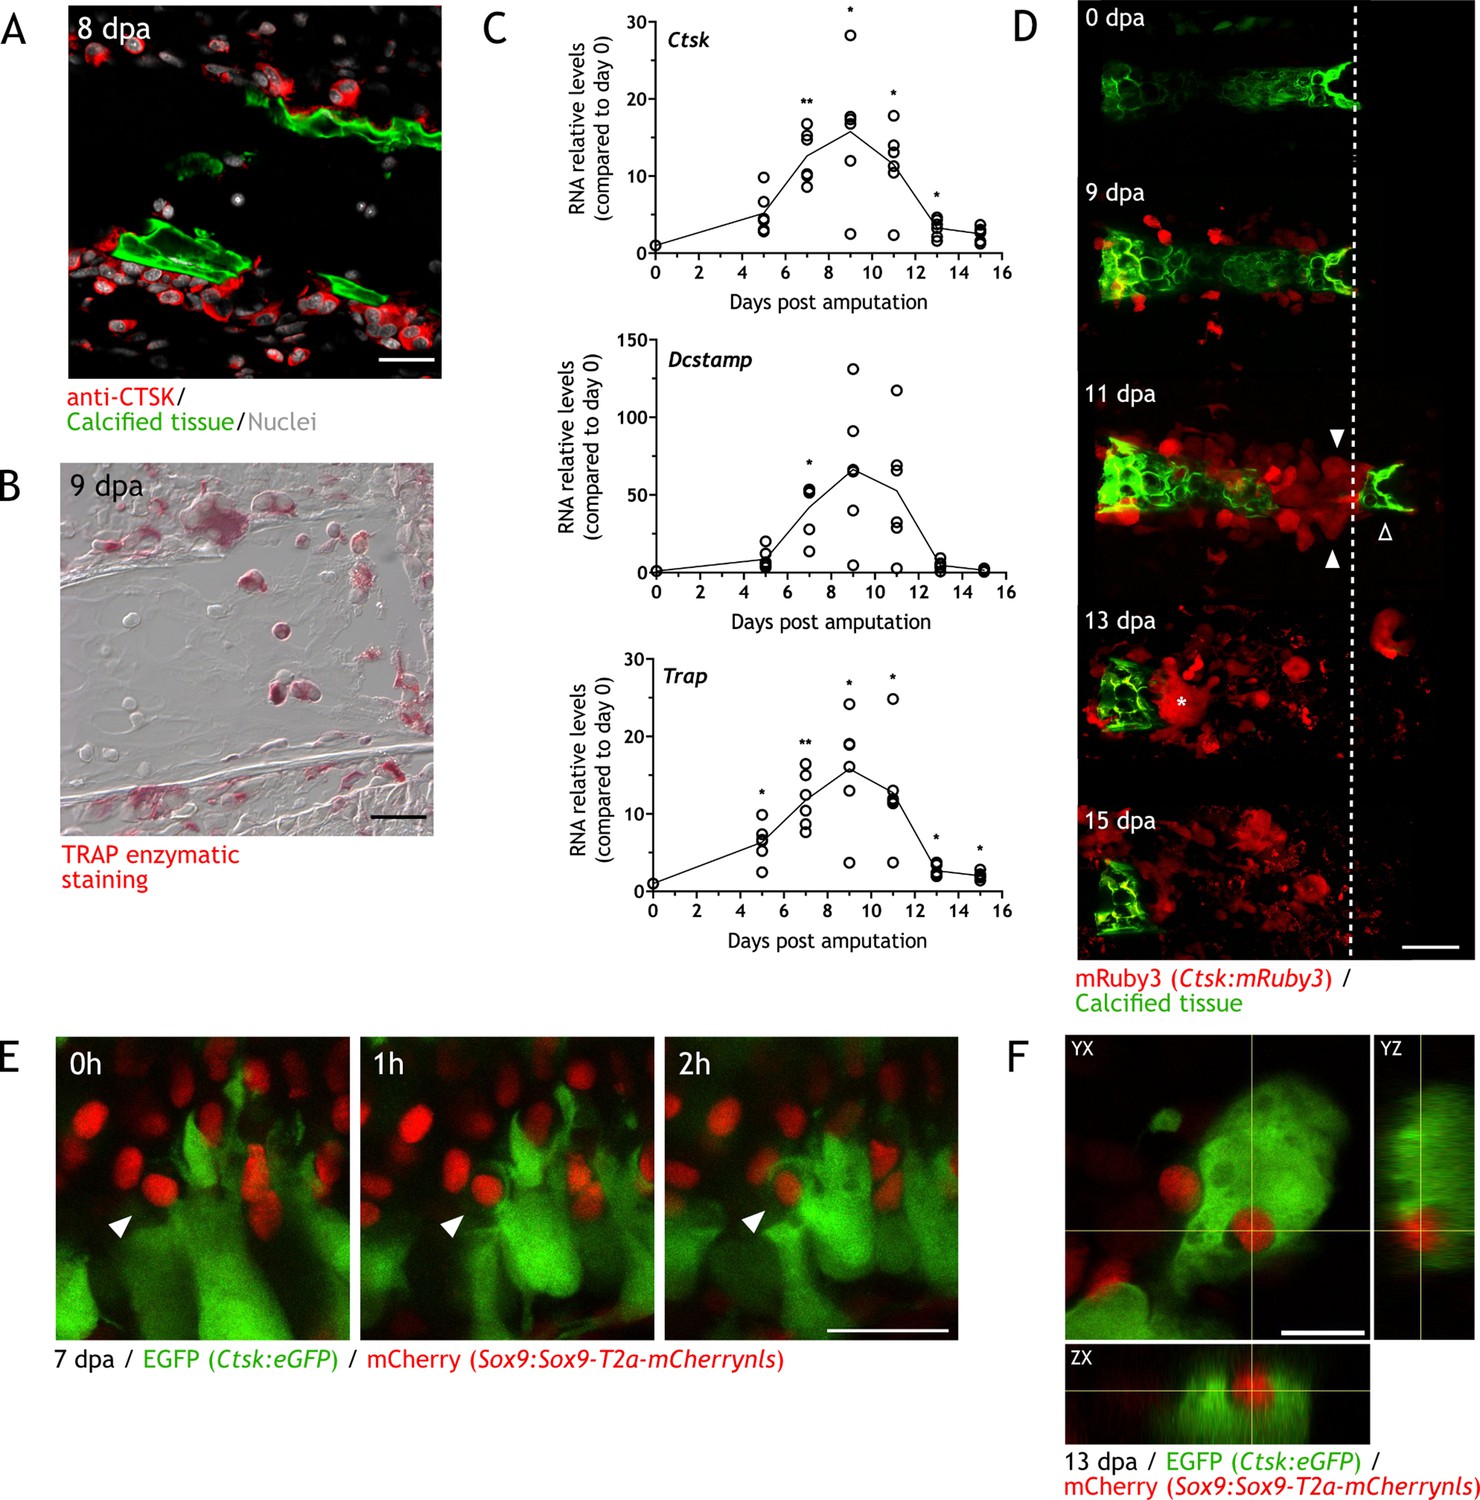
Osteoclasts are identified during skeletal resorption.
(A) Apotome image of immunofluorescence for anti-cathepsin K (CTSK; red) in zeugopod section at 8 dpa. Calcein was used for calcified cartilage labeling (green) and Hoechst for nuclear staining (white). Scale bar: 50 µm (n=2). (B) Tartrate-resistant acid phosphatase (TRAP) enzymatic staining in zeugopod section at 9 dpa. Scale bar: 50 µm (n=2). (C) RT-qPCR for Trap, Ctsk, and Dcstamp at different dpa upon zeugopodial amputation. Solid line represents mean, each dot is an animal (n=6. ** p<0.01, * p<0.05, one-way ANOVA, Bonferroni’s multiple comparisons test, each timepoint versus 0 dpa). (D) In vivo confocal imaging of Ctsk:mRuby3 (red) upon digit amputation. Calcein was used for calcified cartilage labeling (green). Image represents a maximum intensity projection of 10 images (3 µm interval). White arrowhead: mRuby3+ cells (osteoclasts). Black arrowhead: break in the skeletal tissue. Dashed line: amputation plane. Asterisk: multinucleated osteoclast. Scale bar: 100 µm (n=3). (E) In vivo confocal imaging of Sox9 × Ctsk at 7 dpa. Images were taking at time 0, 1, and 2hr. Image represents a maximum intensity projection of four images (3µm interval). White arrowhead: eGFP+ osteoclast engulfing mCherry+ chondrocyte. Scale bar: 50 µm (n=6). (F) Orthogonal view of in vivo confocal imaging from the Sox9 × Ctsk line at 13 dpa. Image is composed of 15 planes with a voxel depth of 2 µm. Center of cross shows mCherry+ cell phagocytosed by eGFP+ cell. Scale bar: 50 µm (n=6).
Figure 2—figure supplement 1
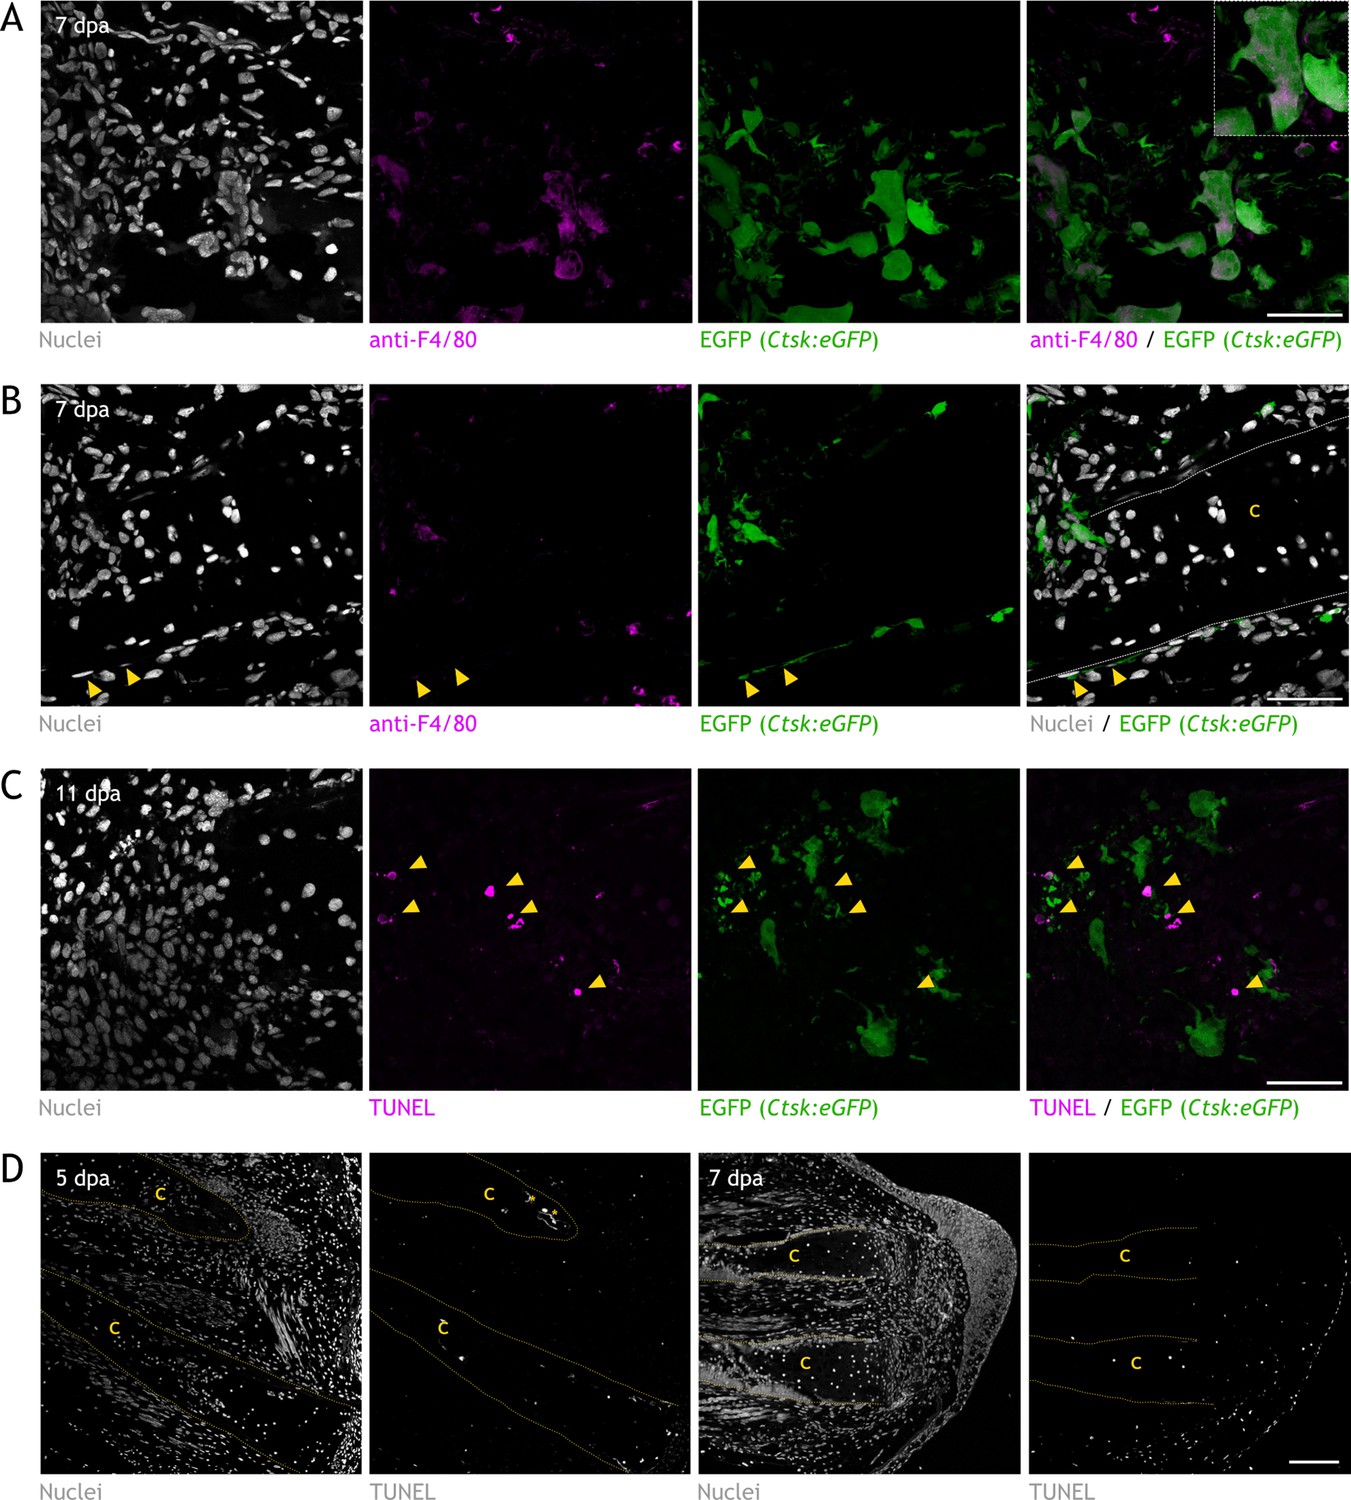
Characterization of Ctsk:eGFP transgenic line and assessment of apoptosis in skeleton during regeneration.
(A) Confocal image of immunofluorescence (IF) for anti-F4/80 (magenta) in Ctsk:eGFP zeugopod section at 7 dpa. eGFP endogenous fluorescence was acquired (green), and Hoechst was used for nuclear staining (white). Inset: multinucleated eGFP+/F4/80+ cell. Scale bar: 100µm (n=4). (B) Confocal image of IF for anti-F4/80 (magenta) in Ctsk:eGFP zeugopod section at 7 dpa. eGFP endogenous fluorescence was acquired (green), and Hoechst was used for nuclear staining (white). Arrowheads: eGFP+/F4/80− perichondral cell. C: cartilage. Dashed line: cartilage boundaries. Scale bar: 100µm (n=4). (C) Confocal image of TUNEL assay (magenta) in Ctsk:eGFP (green) zeugopod section at 11 dpa. Hoechst was used for nuclear staining (white). Arrowheads: TUNEL+/eGFP+ osteoclasts. Scale bar: 100µm (n=3). (D) Confocal image of TUNEL assay in limbs at 5 and 7 dpa. C: cartilage. Yellow dashed line: cartilage boundaries. Asterisk: Staining noise. Scale bar: 250µm (n=3).
Figure 3

Zoledronic acid (zol) treatment inhibits osteoclast-mediated skeletal resorption.
(A) Time course of resorption during zeugopod regeneration upon zol treatment. Calcein-stained axolotls were amputated at the distal end of the calcified tissue. Scale bar: 500µm. (B) Quantification of resorption rate in radius and ulna upon zol treatment in (A). Length ratio was calculated using the length at 0 dpa as a reference. Each dot represents an animal (n=6; a: p<0.05 uninjected vs. zol, b: p<0.01 uninjected vs. zol, c: p<0.001 vehicle vs. zol, d: p<0.001 uninjected vs. zol, e: p<0.01 vehicle vs. zol, two-way ANOVA, Tukey’s multiple comparisons test). (C) RT-qPCR for Trap, Ctsk, and Dcstamp at 9 dpa upon zol treatment. Each dot represents an animal (n=5, one-way ANOVA, Tukey’s multiple comparisons test). (D) In vivo confocal imaging of Ctsk:eGFP (green) upon digit amputation. Alizarin red was used for calcified cartilage labeling (red). Image represents a maximum intensity projection of 15 images (3µm interval). Scale bar: 50 µm (n=4).
Figure 4 with 1 supplement
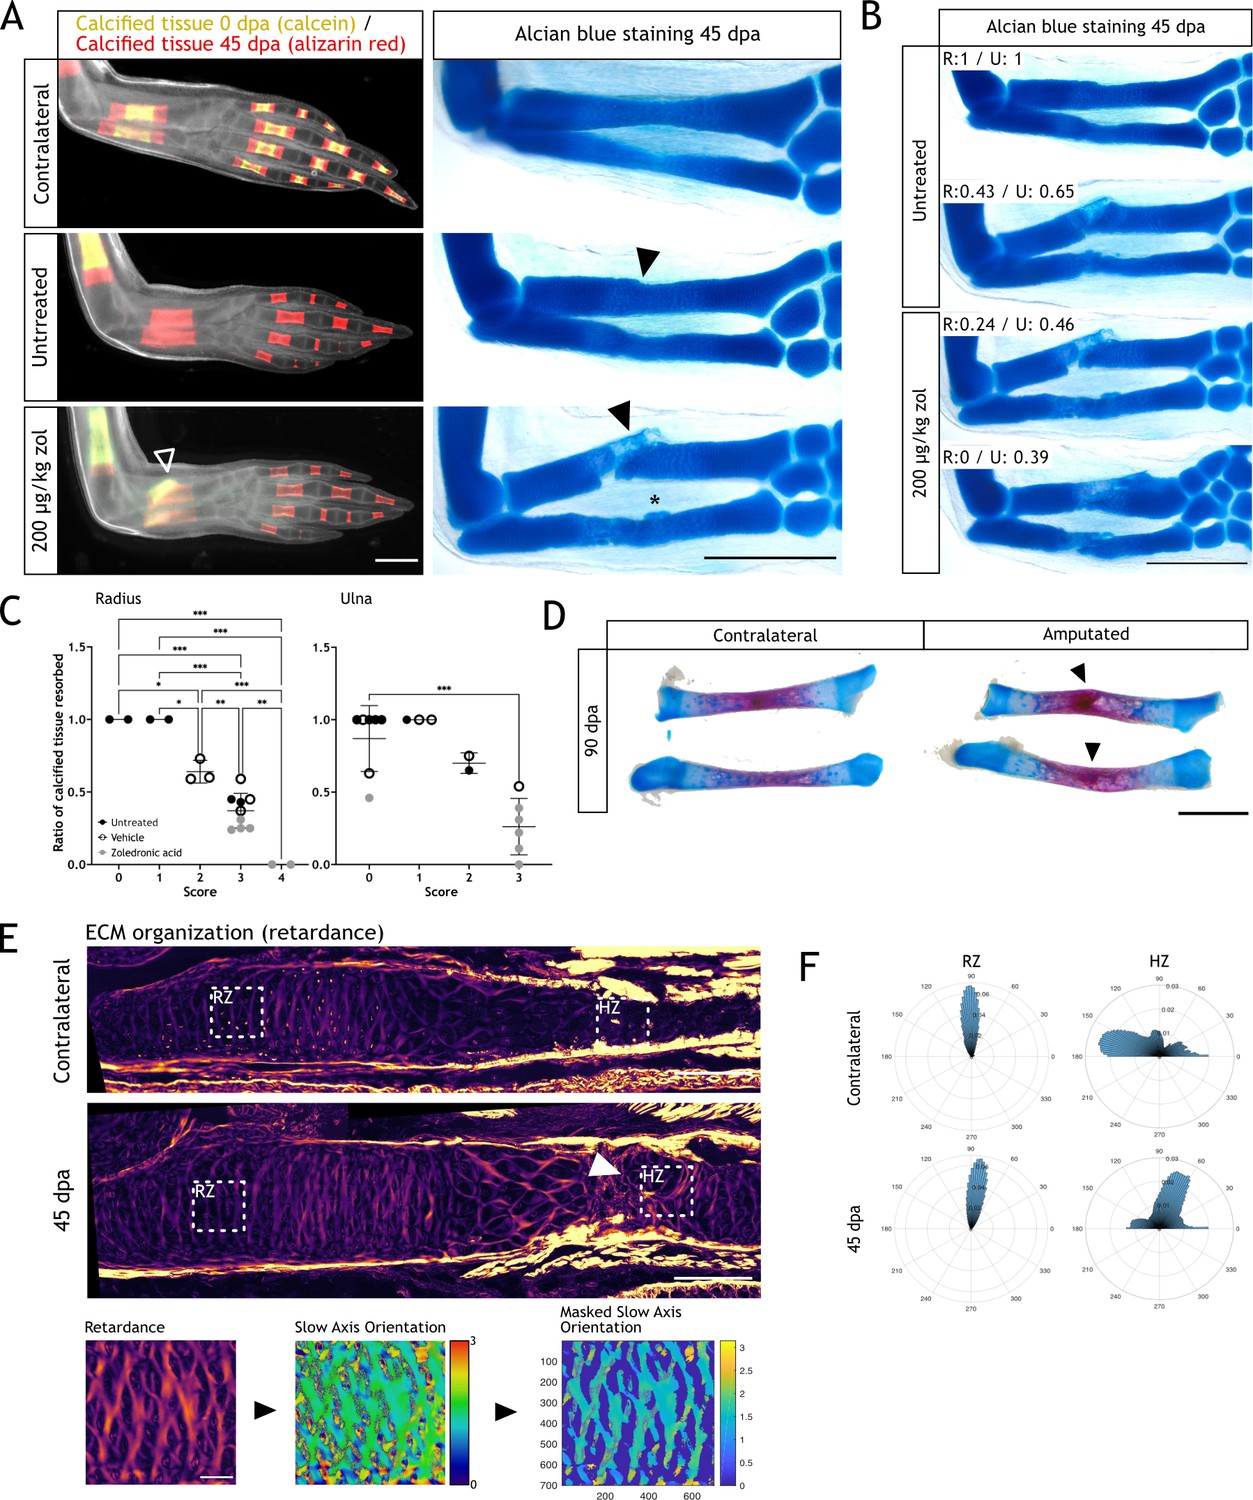
Resorption inhibition does not halt regeneration but results in an integration failure of the newly formed skeleton.
(A) In vivo calcein/alizarin red staining (left panel) and alcian blue staining (right panel) in zoledronic acid (zol)-treated limbs at 45 dpa. Arrowheads: integration failure in skeletal elements. Asterisk: heterotopic cartilage formation in ulna. Scale bar: 1 mm (n=6). (B) Alcian blue staining in zol-treated limbs at 45 dpa. Resorption rate for radius and ulna is specified for each case. Scale bar: 1 mm (n=6). (C) Correlation between integration scores (Materials and methods) and resorption rate for radius (left) and ulna (right). Each dot represents an animal (n=18. * p<0.05, ** p<0.01, *** p<0.001, one-way ANOVA, Tukey’s multiple comparisons test). (D) Alcian blue/alizarin red staining of zeugopodial elements at 90 dpa. Arrowhead: stump-regenerated interphase. Scale bar: 2 mm. (E) Upper panel: retardance image from unamputated and 40 dpa ulna. RZ (resting zone) and HZ (hypertrophic zone) squares represent the quantification areas. Arrowhead: disorganized interphase. Scale bar: 200µm. Lower panel: quantification flow chart. The mask was created using the retardance image to quantify only extracellular matrix (ECM) components and applied to the slow axis orientation image to determine the orientation of the ECM components at each pixel. In the masked orientational field, the cellular regions are shown in dark blue for visualization purposes but their orientational values were excluded from the analysis in F. Scale bar: 50 µm (n=7 for unamputated, n=9 for amputated). (F) Histograms showing the orientation of the ECM components at each pixel in RZ or HZ for the unamputated or 40 dpa ulna. Angles are shown in degrees (n=7 for unamputated, n=9 for amputated).
-
Figure 4—source data 1
Score matrix for integration phenotypes.
- https://cdn.elifesciences.org/articles/79966/elife-79966-fig4-data1-v2.csv
Figure 4—figure supplement 1
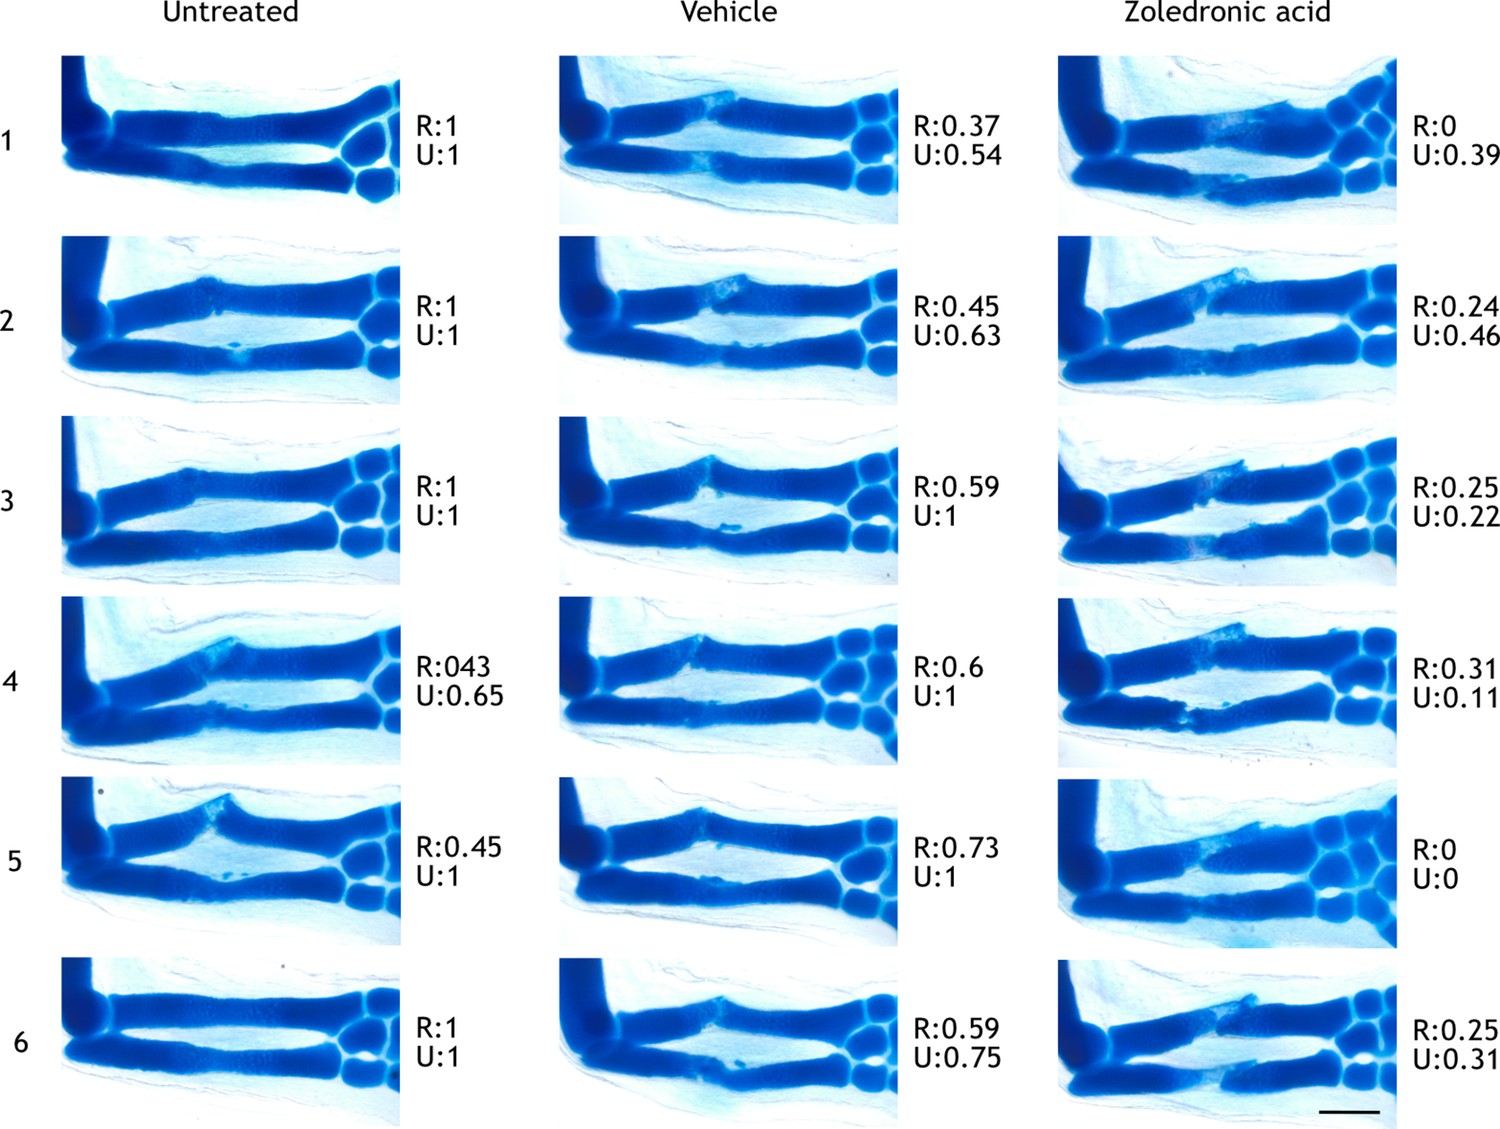
Limbs used for scoring integration phenotypes.
Alcian blue staining of regenerated limbs (45 dpa) treated with zoledronic acid (z), vehicle (v), or untreated (u). Resorption rate measured at 15 dpa is shown for each limb for radius (R) and ulna (U). Limbs were numbered and used for assessing integration efficiency using the score matrix explained in Materials and methods. Scale bar: 500µm.
Figure 5 with 2 supplements

The wound epithelium is involved in resorption induction.
(A) Time course of resorption during zeugopod regeneration upon full skin flap (FSF) surgery. Calcein-stained axolotls were amputated at the distal end of the calcified tissue. Arrowheads: resorption in control cases. Scale bar: 1 mm (n=9). (B) Alcian blue/alizarin red staining of limbs at 25 dpa after FSF surgery. Arrowhead: resorption of distal radius. Scale bar: 1 mm (n=9). (C) In situ hybridization (ISH) for Ctsk in limb sections at 9 dpa after FSF surgery. Scale bar: 500 µm (n=3 for control, n=4 for FSF). (D) Whole mount ISH (WISH) for Krt17 in limbs upon zeugopod amputation at different dpa. Dashed lines: skeletal elements position. Scale bar: 500µm (n=3). (E) Masson’s trichrome staining from limb sections upon zeugopod amputation at different dpa. Yellow arrowheads: beginning of wound epithelium. White arrowheads: osteoclasts (n=3). (F) Inset from (E) 5 dpa. Scale bar: 200µm. (G) Inset from (E) 7dpa. White arrowheads: osteoclasts. Scale bar: 200µm. (H) Quantification of position of osteoclasts in zeugopod at 7 dpa. Each dot represents an osteoclast. Position of wound epithelium (WE) is shown with a red line. Image of a quantified section shows the position of osteoclasts in the sample (three independent experiments, n=101).
Figure 5—figure supplement 1
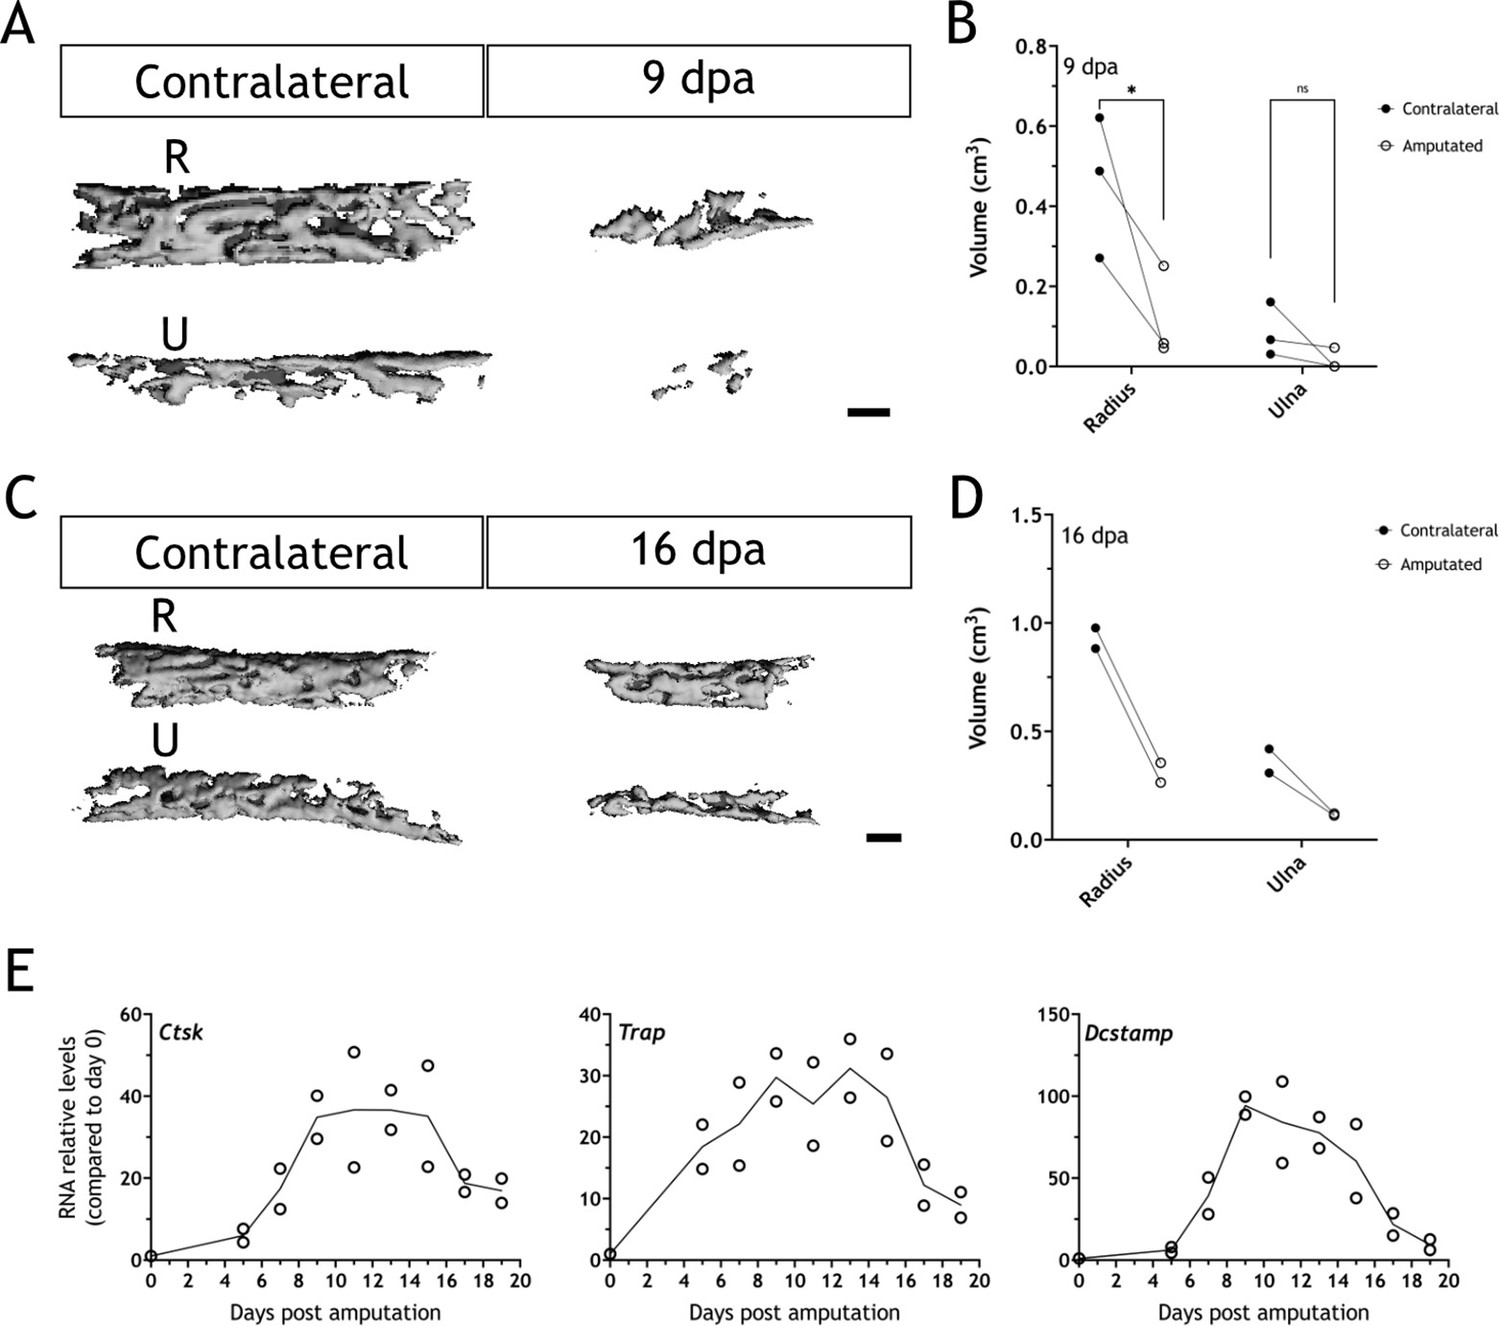
Bones are resorbed upon amputation in 16cm snout-to-tail axolotls.
(A) Three-dimensional (3D) reconstructions from µCT scans for radius (R) and ulna (U) in the contralateral and a 9 dpa limb upon amputation at the distal end of the calcified tissue. Scale bar: 200µm (n=3). (B) Quantification of bones volume (cm3) for samples in (A). Each dot represents an animal (n=3; * p<0.05, two-way ANOVA, Bonferroni’s multiple comparisons test, contralateral versus amputated). (C) 3D reconstructions from µCT scans for radius and ulna in the contralateral and a 16 dpa limb upon amputation at the distal end of the calcified tissue. Scale bar: 200µm (n=2). (D) Quantification of bones volume (cm3) for samples in (C). Each dot represents an animal (n=2). (E) RT-qPCR for Ctsk, Trap, and Dcstamp at different dpa upon zeugopodial amputation. Solid line represents mean, each dot is an animal (n=2).
Figure 5—figure supplement 2

Ctsk+ cells are located in the vicinity of the wound epithelium (WE) at 7 dpa.
(A) Left: eGFP+ cells from Ctsk:eGFP axolotl at 7 dpa. Hoechst was used for nuclear staining (white). Middle: Masson’s trichrome staining of same section. Right: overlay of eGFP image in Masson’s trichrome image. Yellow arrowheads: beginning of wound epithelium. Scale bar: 500 µm (n=3). (B) Quantification of position of eGFP+ cells in zeugopod at 7 dpa. Each dot represents an osteoclast. Position of WE is shown with a red line. Image of a quantified section shows the position of osteoclasts in the sample (three independent experiments, n=135).
Figure 6
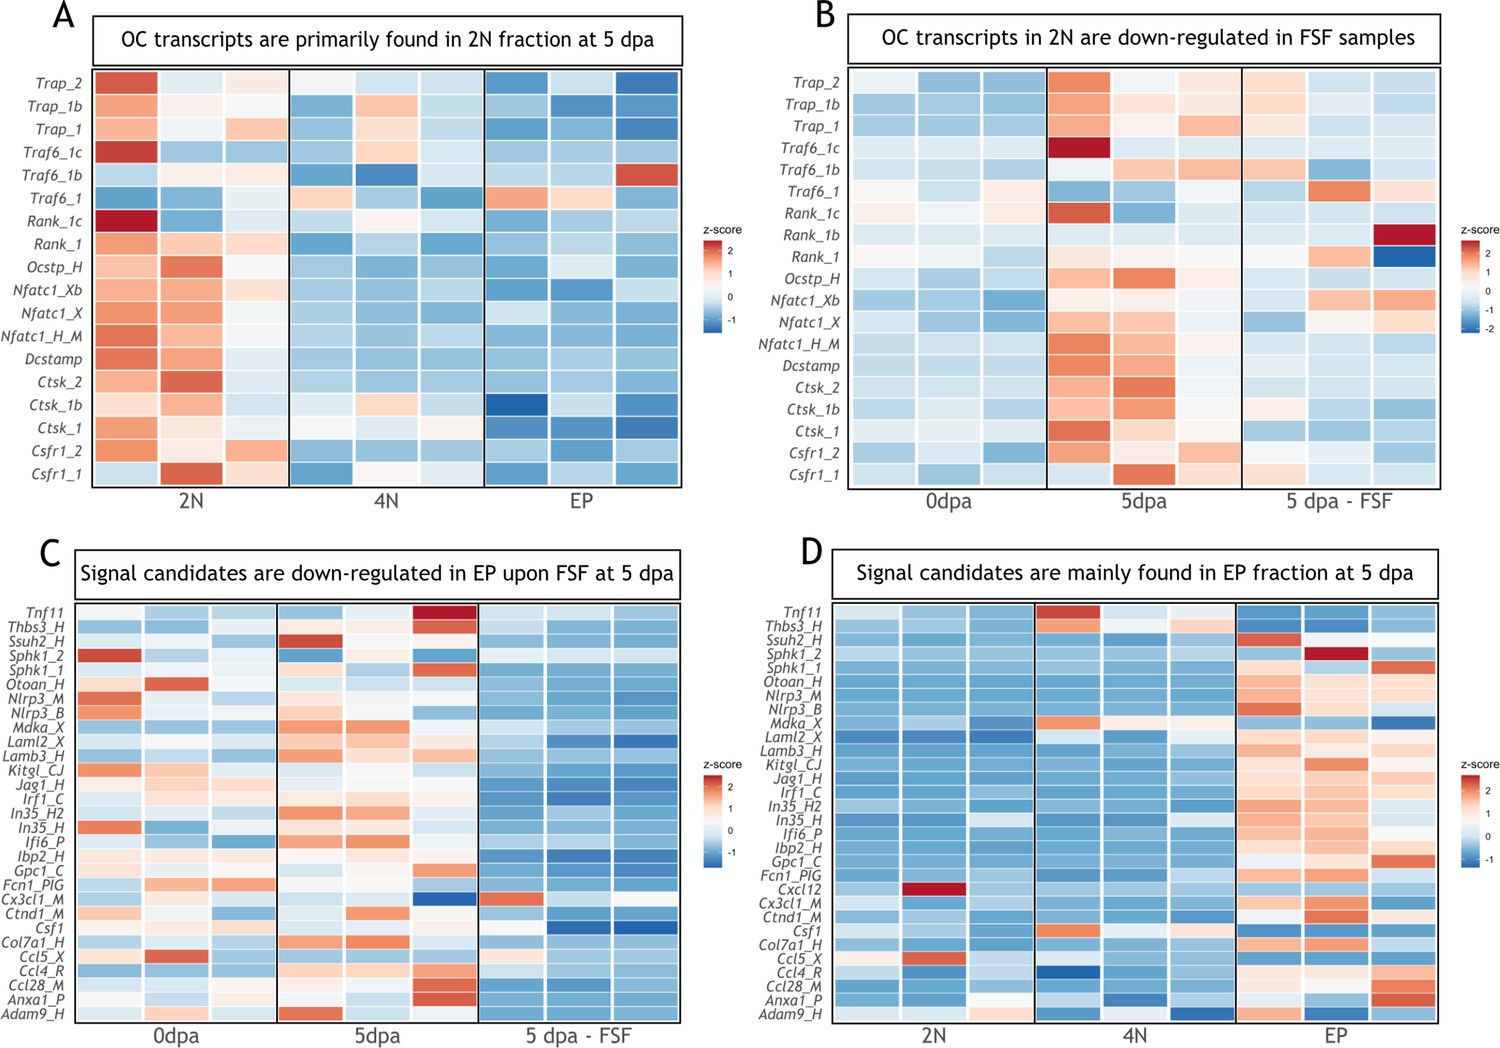
Transcripts associated with osteoclastogenesis are downregulated in full skin flap (FSF) samples at 5 dpa.
(A) Heatmap of transcripts associated with osteoclast function in three different fractions at 5 dpa. 2N: mature cells, 4N: dividing cells, EP: epithelial cells (n=3). (B) Heatmap of transcripts associated with osteoclast function in 2N fraction at different timepoints. FSF samples correspond at 5 dpa (n=3). (C) Heatmap of differentially downregulated transcripts in EP fraction after FSF surgery at 5 dpa associated with osteoclast recruitment and/or differentiation (n=3). (D) Heatmap of differentially downregulated transcripts after FSF surgery in three different fractions associated with osteoclast recruitment and/or differentiation (n=3).
Figure 7 with 1 supplement
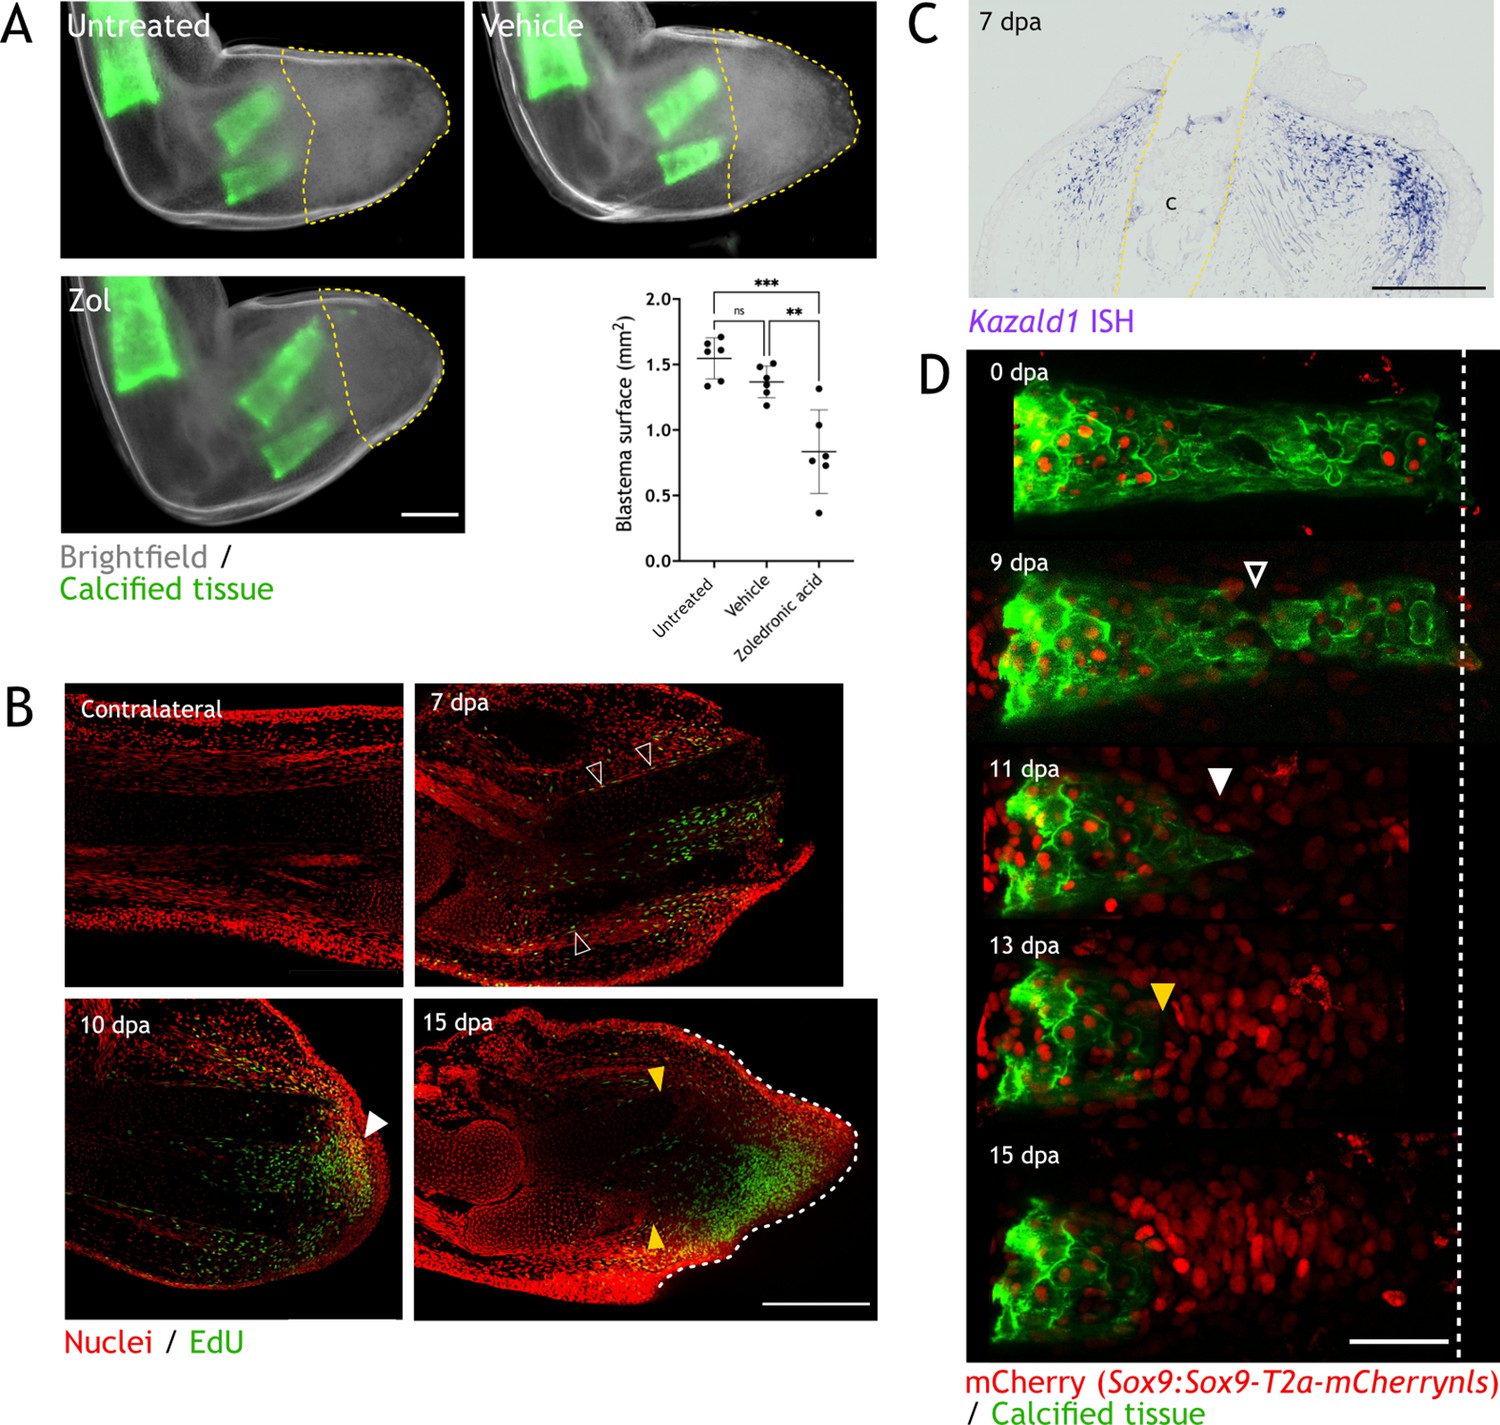
Skeletal resorption and blastema formation are spatially and temporally correlated.
(A) Quantification of blastema size in zoledronic acid-treated limbs at 15 dpa. Dashed lines: blastema. Each dot represents an animal, mean and SD are also shown (n=6, *** p<0.001, ** p<0.01, one-way ANOVA, Tukey’s multiple comparisons test). (B) Whole mount EdU staining (green) in limbs upon zeugopod amputation at different dpa. TO-PRO-3 was used for nuclear staining (red). Black arrowheads: dividing periskeletal cells. White arrowhead: blastema. Yellow arrowheads: distal end of skeletal element. Dashed line: blastema. Scale bar: 500µm (n=6). (C) In situ hybridization (ISH) for Kazald1 in limb sections upon zeugopod amputation at 7 dpa. Yellow dashed lines: cartilage (c) position. Scale bar: 500 µm (n=3). (D) Time course of resorption during digit regeneration in Sox9-mCherry (red). Calcein-stained (green) axolotls were amputated at the distal end of the calcified tissue. Black arrowhead: calcified tissue break. White arrowhead: condensation of mCherry+ cells. Yellow arrowhead: resorption. Scale bar: 100µm (n=6).
Figure 7—figure supplement 1
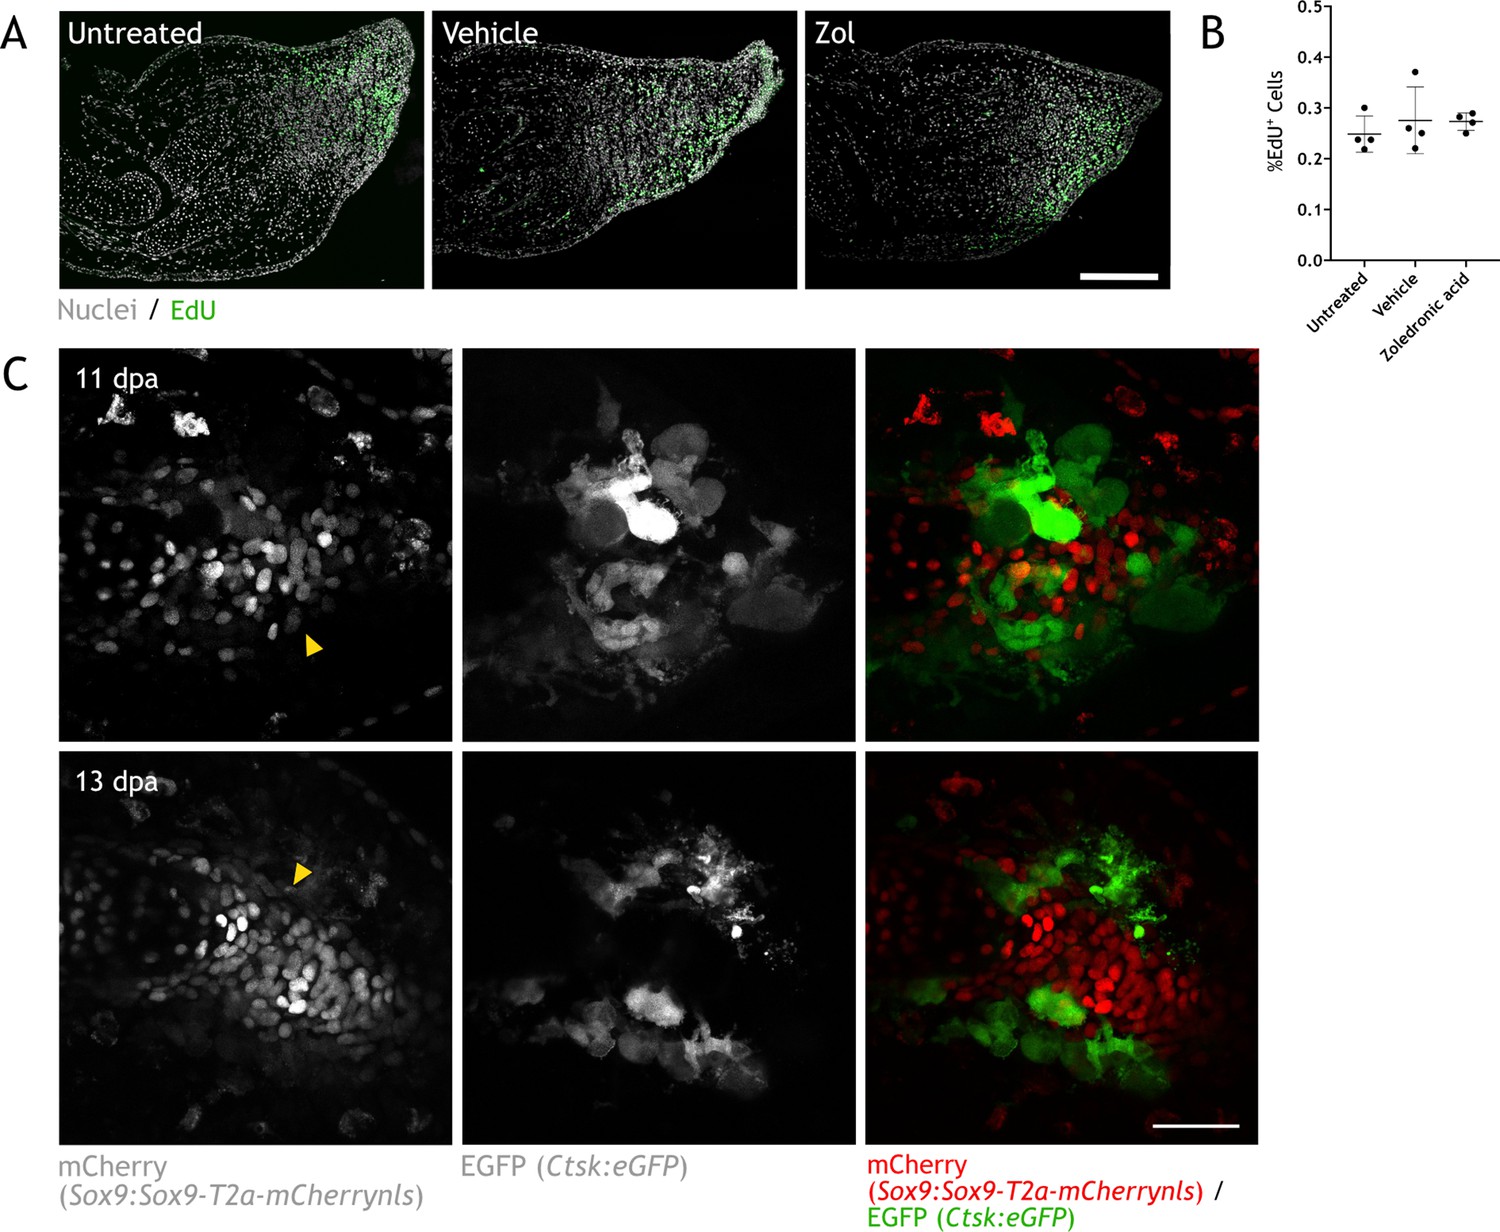
Skeletal resorption and condensation are spatially and temporally correlated.
(A) Apotome image of EdU staining (green) in zeugopod sections at 15 dpa upon treatment with zoledronic acid (zol). Hoechst was used for nuclear staining (white). Scale bar: 50µm (n=2). (B) Quantification of EdU+ cells in sections from (A). Two sections per sample were quantified (n=2). (C) In vivo confocal imaging of Sox9 × Ctsk upon digit amputation. Image represents a maximum intensity projection of five images (3µm interval). Yellow arrowheads: cartilage condensation. Scale bar: 100µm (n=6).
Tables
Key resources table
| Reagent type (species) or resource | Designation | Source or reference | Identifiers | Additional information |
|---|---|---|---|---|
| Strain, strain background (Ambystoma mexicanum) | Axolotl, white (d/d) | CRTD Axolotl facility | ||
| Genetic reagent (A. mexicanum) | Sox9:Sox9-T2a-mCherrynls | Riquelme-Guzmán et al., 2021 | C-Tit/+(Sox9:Sox9-T2a-mCherrynls)ETNKA | |
| Genetic reagent (A. mexicanum) | Ctsk:mRuby3 | This paper | tgTol2(Drer.Ctsk:mRuby3)tsg | Generated in d/d strain |
| Genetic reagent (A. mexicanum) | Ctsk:eGFP | This paper | tgTol2(Drer.Ctsk:eGFP)tsg | Generated in d/d strain |
| Genetic reagent (A. mexicanum) | Sox9 × Ctsk | This paper | C-Tit/+(Sox9:Sox9-T2a-mCherrynls)ETNKA × tgTol2(Drer.Ctsk:eGFP)tsg | |
| Antibody | Rabbit polyclonal anti-CTSK | Abcam | Cat #ab1902 RRID:AB_2261274 | Immunofluorescence (IF; 1:20) |
| Antibody | Rat monoclonal anti-F4/80 | Biorad | Cat #MCA497 RRID:AB_2335599 | IF (1:100) |
| Antibody | Sheep polyclonal anti-digoxigenin-AP, Fab fragments | Roche | Cat #11093274910 RRID:AB_2313640 | In situ hybridization (ISH; 1:5000) Whole mount ISH (1:3000) |
| Recombinant DNA reagent | p-GEMt-Ctsk | This paper | ISH probe | |
| Recombinant DNA reagent | p-GEMt-Kazald1 | This paper | ISH probe | |
| Recombinant DNA reagent | p-GEMt-Krt17 | This paper | ISH probe | |
| Recombinant DNA reagent | Ctsk:mRuby3 | Backbone from Geurtzen et al., 2022 | Modified for this paper | |
| Recombinant DNA reagent | Ctsk:eGFP | Backbone from Geurtzen et al., 2022 | Modified for this paper | |
| Sequence-based reagent | Ctsk Fw primer | Bryant et al., 2017 | PCR primer/in situ hybridization probe | GTGCAGAACCGACCCGATG |
| Sequence-based reagent | Ctsk Rv primer | Bryant et al., 2017 | PCR primer/in situ hybridization probe | CAGCTGGACTCGGAGTGATGC |
| Sequence-based reagent | Kazald1 Fw primer | Bryant et al., 2017 | PCR primer/in situ hybridization probe | CTCGTGACATCCTGAGCCTGGAAG |
| Sequence-based reagent | Kazald1 Rv primer | Bryant et al., 2017 | PCR primer/in situ hybridization probe | GAAAATGGATAAGGTGGTGGGGAGGG |
| Sequence-based reagent | Krt17 Fw primer | Leigh et al., 2018 | PCR primer/in situ hybridization probe | CCTCTTGGACGTGAAGACC |
| Sequence-based reagent | Krt17 Rv primer | Leigh et al., 2018 | PCR primer/in situ hybridization probe | CCAGAGAAGATGAGCATACATCGG |
| Sequence-based reagent | Ctsk Fw primer | This paper | RT-qPCR primer | TGGCCCTTTTAACAACACCG |
| Sequence-based reagent | Ctsk Rv primer | This paper | RT-qPCR primer | ACTGAGTTGCAACAGCTTCC |
| Sequence-based reagent | Rpl4 Fw primer | This paper | RT-qPCR primer | TGAAGAACTTGAGGGTCATGG |
| Sequence-based reagent | Rpl4 Rv primer | This paper | RT-qPCR primer | CTTGGCGTCTGCAGATTTTTT |
| Sequence-based reagent | Trap Fw primer | This paper | RT-qPCR primer | TCATTGCCTGGTCAAGCATC |
| Sequence-based reagent | Trap Rv primer | This paper | RT-qPCR primer | TGGGCATAGTAGAACCGCAA |
| Sequence-based reagent | Dcstamp Fw primer | This paper | RT-qPCR primer | TGGAAACCAAAAGTGCAGCG |
| Sequence-based reagent | Dcstamp Rv primer | This paper | RT-qPCR primer | CCCCTCAGTGCCATCATTGT |
| Chemical compound, drug | Calcein | Sigma-Aldrich | Cat #C0875 | 0.1% solution |
| Chemical compound, drug | Alizarin red | Sigma-Aldrich | Cat #A5533 | 0.1% solution |
| Chemical compound, drug | Zoledronic acid | Sigma-Aldrich | Cat #SML0223 | Intraperitoneal (IP) injections, 200µg/kg |
| Commercial assay or kit | Click-iT EdU Cell Proliferation Kit for Imaging, Alexa Fluor 488 dye | Invitrogen | Cat #C10337 | IP injections, 10µg/g |
| Commercial assay or kit | Masson’s trichrome staining | Sigma-Aldrich | Cat #HT15 | |
| Commercial assay or kit | pGEM-T Easy Vector Systems | Promega | Cat #A1360 | |
| Commercial assay or kit | RNAeasy Mini Kit | QIAGEN | Cat #74104 | |
| Software, algorithm | µManager | Edelstein et al., 2014 | https://micro-manager.org/ | |
| Software, algorithm | Fiji | Schindelin et al., 2012, Rueden, 2022 | https://github.com/fiji/fiji RRID:SCR_002285 | |
| Software, algorithm | Prism9 | GraphPad Software | https://www.graphpad.com | |
| Software, algorithm | Affinity Designer | Serif Europe | https://affinity.serif.com/ |
Table 1
Criteria for scoring integration in limbs at 45 dpa.
| Question | Yes (value) | No (value) |
|---|---|---|
| Is there angulation present? | +1 | +0 |
| Is there superposition between the mature tissue and the regenerated structure? | +1 | +0 |
| Does regeneration result in element doubling? | +1 | +0 |
| Does the regenerated structure constitute one continuous element? | +0 | +1 |
Additional files
Download links
A two-part list of links to download the article, or parts of the article, in various formats.
Downloads (link to download the article as PDF)
Open citations (links to open the citations from this article in various online reference manager services)
Cite this article (links to download the citations from this article in formats compatible with various reference manager tools)
Osteoclast-mediated resorption primes the skeleton for successful integration during axolotl limb regeneration
eLife 11:e79966.
https://doi.org/10.7554/eLife.79966


