Cryo-electron tomography of Birbeck granules reveals the molecular mechanism of langerin lattice formation
- Department of Anatomy and Structural Biology, Graduate School of Medicine, University of Yamanashi, Japan
- Department of Cell Biology and Anatomy, Graduate School of Medicine, University of Tokyo, Japan
- Faculty of Life and Environmental Science, University of Yamanashi, Japan
- Department of Dermatology, University of Yamanashi, Japan
Figures
Figure 1 with 1 supplement
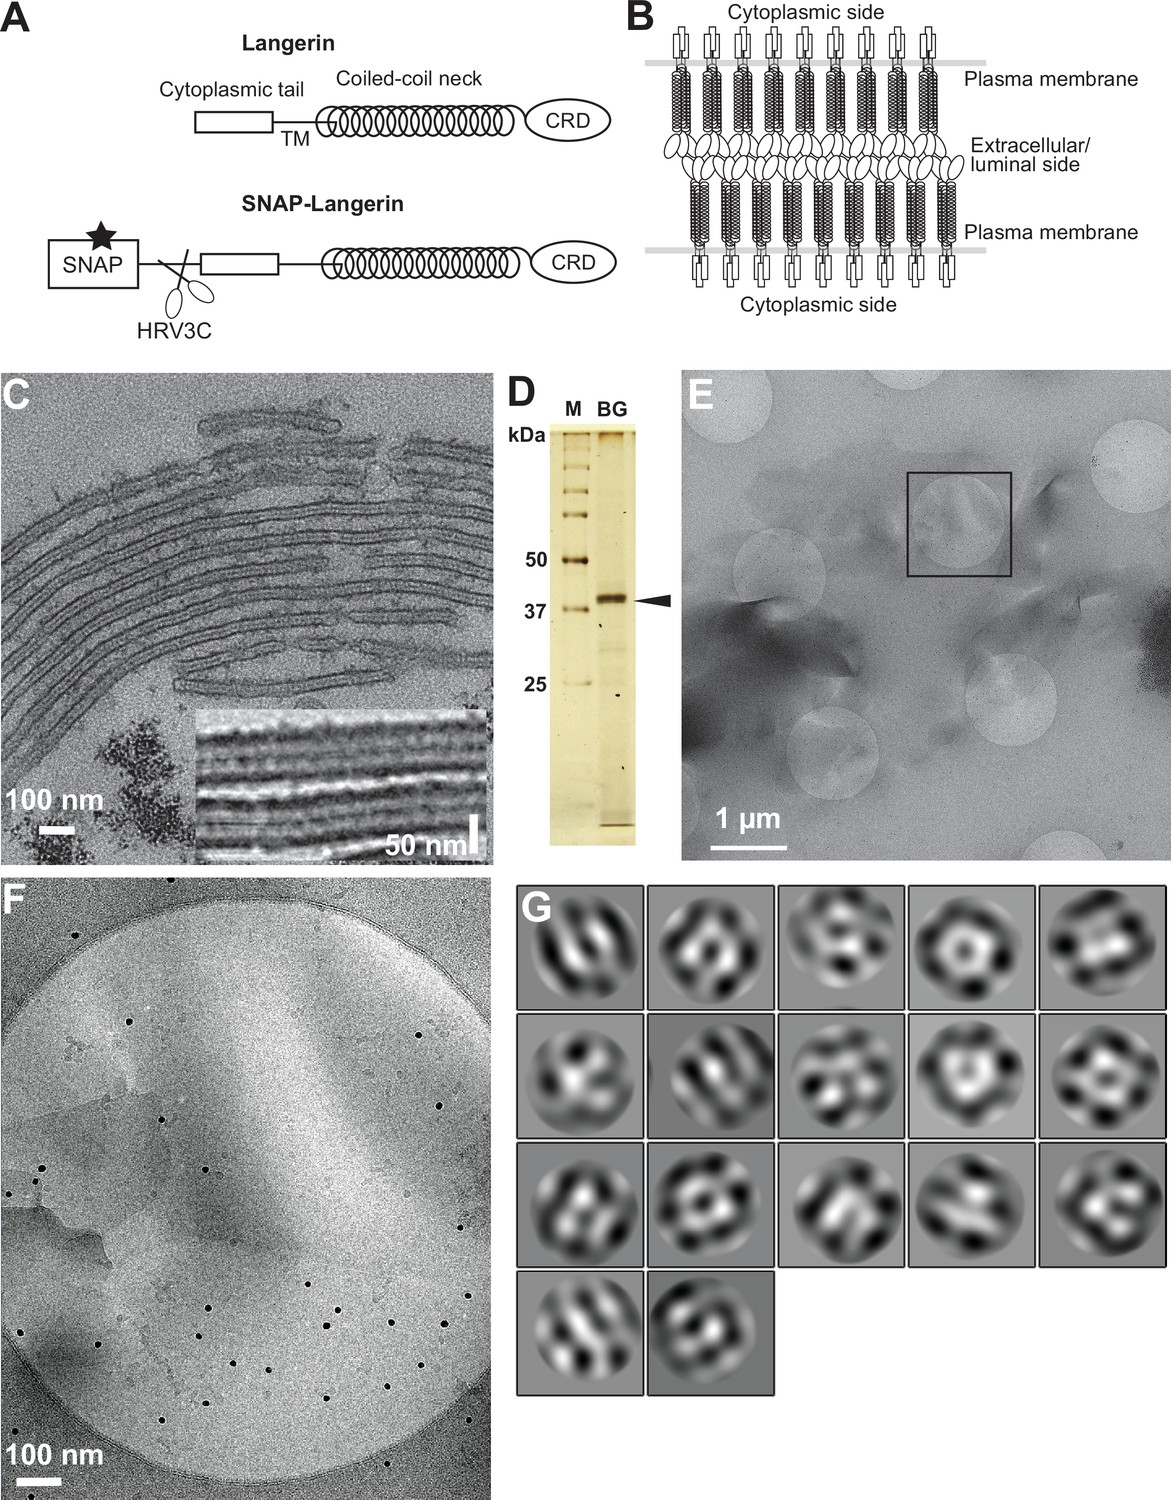
Isolation of Birbeck granules.
(A) Domain organization of langerin. Human langerin is a 328-amino acids protein composed of an N-terminal cytoplasmic tail, a transmembrane domain (TM), a coiled-coil neck, and a C-terminal carbohydrate-recognition domain (CRD). We fused a SNAP-tag at the N-terminus of langerin and inserted an HRV3C protease cleavage site between the tag and the langerin sequences. For streptavidin-mediated precipitation of Birbeck granules, the SNAP-tag was biotinylated (star). (B) Model of langerin oligomerization within Birbeck granules. Langerin trimers bind to each other face-to-face via the CRDs, bringing the two layers of the plasma membrane closer together. (C) Birbeck granules formed in 293T cells overexpressing langerin. Addition of yeast mannan induced the formation of Birbeck granules a few micrometers long. Inset shows a magnified view of Birbeck granules. (D) SDS-PAGE of isolated Birbeck granules. Purified langerin (arrowhead) was released from streptavidin-agarose by HRV3C digestion. M: molecular weight marker; and BG: isolated Birbeck granules. (E) Cryo-electron microscopy of isolated Birbeck granules. Black square indicates the position of the close-up view shown in F. (F) Wavy lamellar structure of the Birbeck granule. Black dots were gold nanoparticles used as fiducial markers. (G) Class averages of the projection images of Birbeck granules. The image dimension is 34 nm2. Although 2D classification did not converge well due to the continuity of the structure, some classes showed a porous structure with a honeycomb-like lattice.
-
Figure 1—source data 1
Original gel image of Figure 1D.
- https://cdn.elifesciences.org/articles/79990/elife-79990-fig1-data1-v2.zip
-
Figure 1—source data 2
Annotated gel image of Figure 1D.
- https://cdn.elifesciences.org/articles/79990/elife-79990-fig1-data2-v2.pdf
Figure 1—figure supplement 1
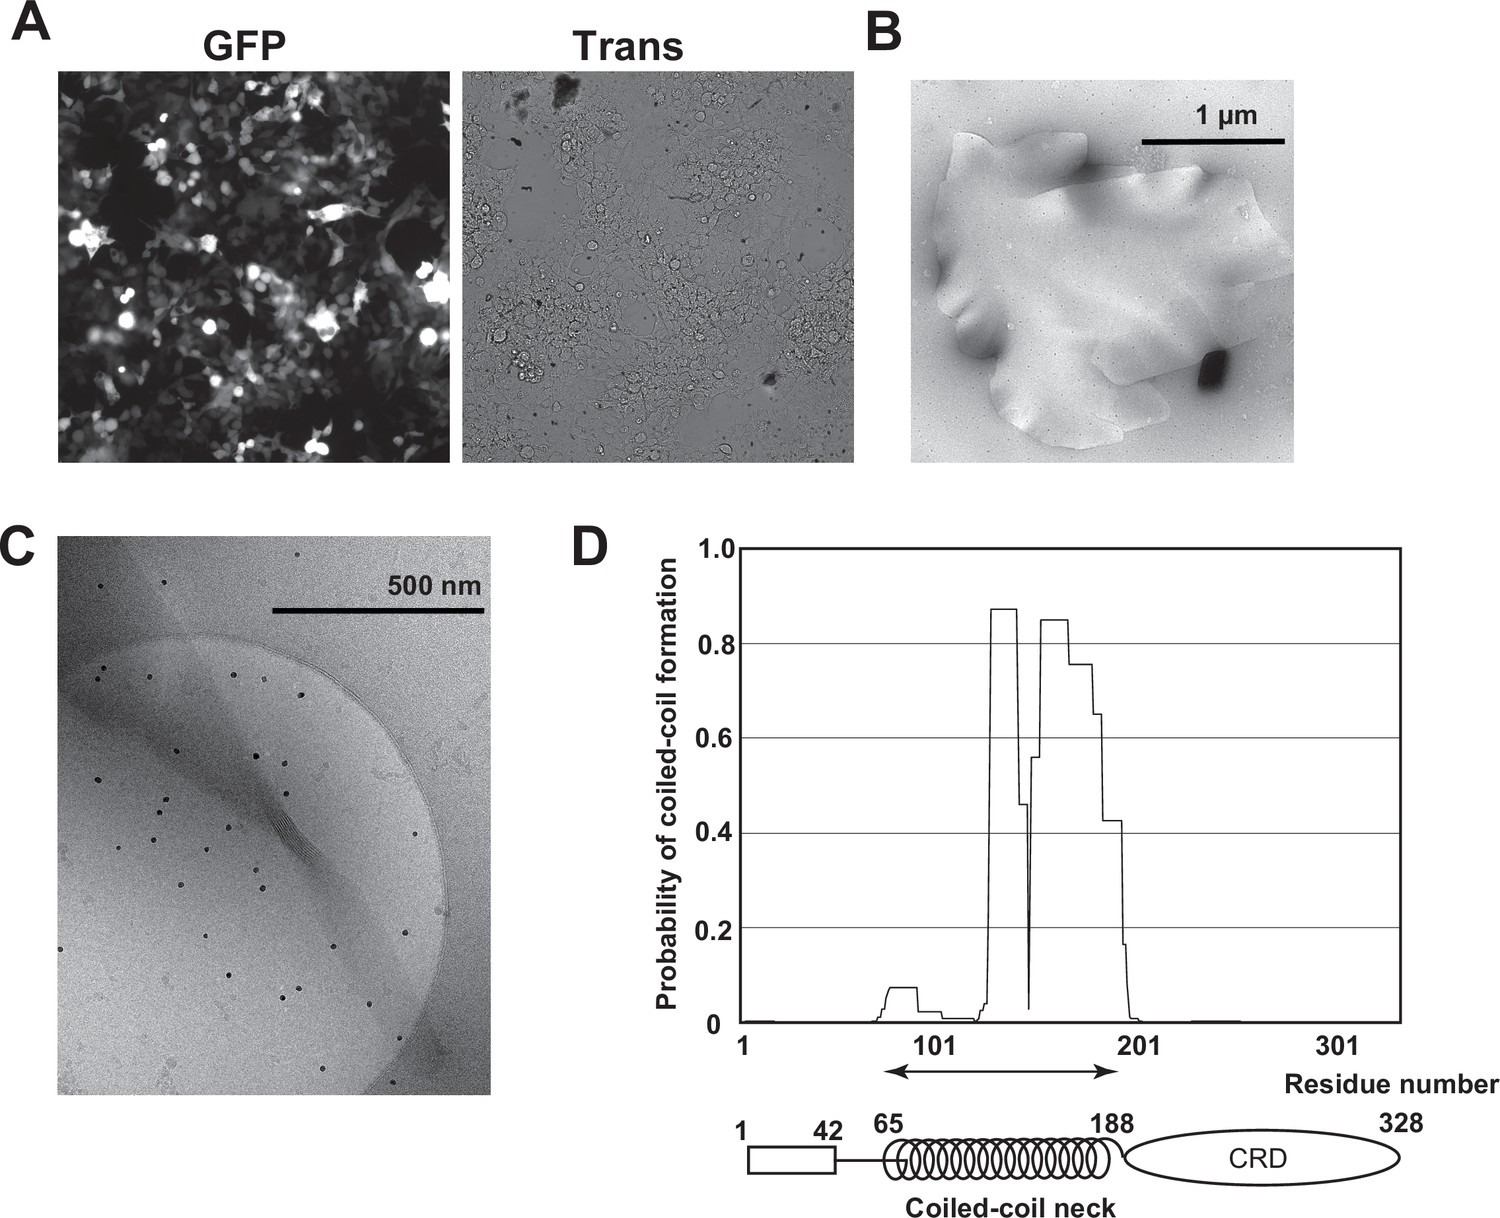
Isolation of Birbeck granules.
(A) Fluorescence microscopy image of 293T cells expressing langerin. IRES-driven GFP expression was detected. The transformation efficiency was approximately 40%. (B) Negative-stain electron microscopy image of an isolated Birbeck granule stained with 2% uranium acetate. (C) Cryo-electron microscopy image of a twisted Birbeck granule. (D) Coiled-coil prediction profile of langerin.
Figure 2 with 2 supplements
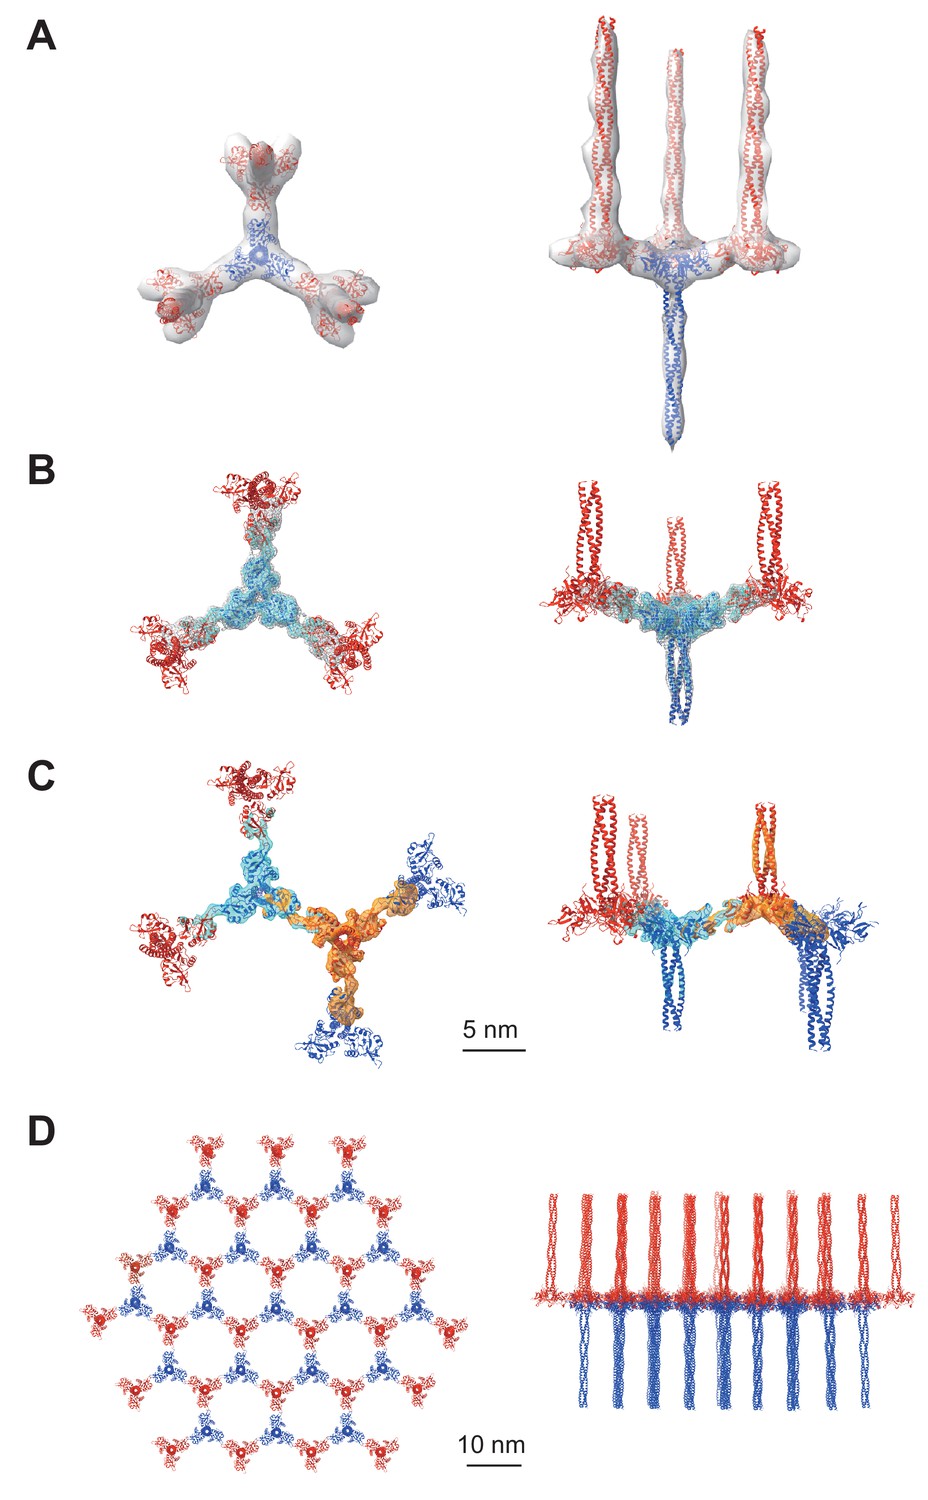
Averaged subtomograms of Birbeck granules.
(A) Result of the initial 3D refinement. The central langerin trimer (blue) binds to the three inverted langerin trimers (red). (B) Result of the focused refinement. Improved resolution (6.4 Å) allowed secondary structure modeling. The gray mesh and the cyan surface indicate low and high threshold isosurfaces, respectively. (C) Result of the two-body refinement. The second body (orange) was refined with respect to the first body (cyan). (D) Honeycomb model of the langerin lattice within Birbeck granules. This honeycomb lattice is an ideal model, with the assumption of structural uniformity. (A–D) left, top views; right, side views.
Figure 2—figure supplement 1
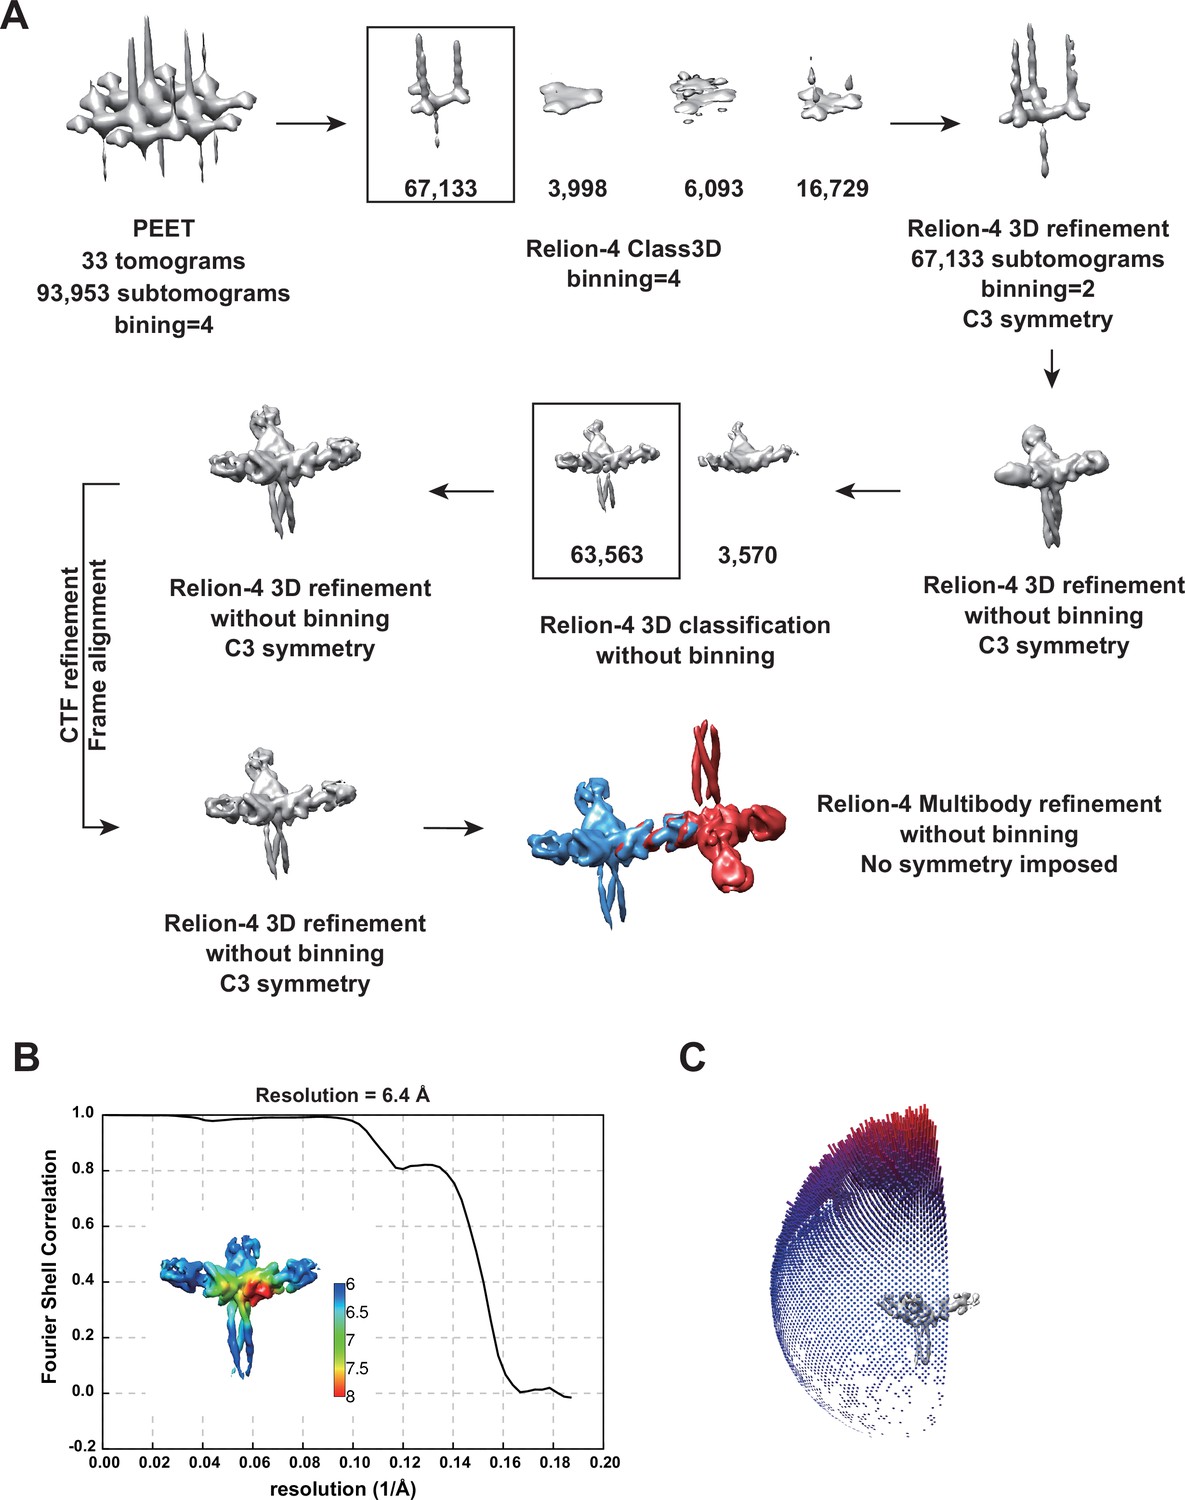
Cryo-electron tomography of Birbeck granules.
(A) Summary of image processing. (B) Fourier shell correlation plot of the 3D refined structure of the langerin trimer, corresponding to the map in Figure 2C. The estimated resolution was 6.4 Å with a cut-off value of 0.143. The inset shows the local resolution map. (C) Angular distribution of the subtomograms. Although there was a strong bias toward the top-view direction, twisting of some granules (Figure 1—figure supplement 1C) provided side views.
Figure 2—video 1
Movie representation of the langerin lattice.
Figure 3 with 1 supplement

Binding interface between two langerin trimers.
(A) Two langerin trimers interact via the loops at residues 258–263. Amino acid codes and residue numbers are indicated. Yellow and pink circles indicate the primary and secondary carbohydrate-binding sites. The orientations of the side chains are speculative because the resolution of these maps (6.4 Å) was insufficient for precise modeling. Calcium ions (green) were placed based on the crystal structure (PDB ID: 3KQG). Top and side views are displayed in the top and bottom rows, respectively. Broken squares indicate the positions of the magnified views on the right. (B) Flexibility between the two trimers. The first eigenvector of the structural variation of the inverted trimer (red) relative to the upright trimer (blue) shows an approximately 30° rotation about the loop 258–263 (see Figure 3—video 1).
Figure 3—video 1
Morphing movie showing the first eigenvector of structural variation calculated by multibody analysis.
Figure 4

Mutations to the loop 258–263 disrupted Birbeck granule formation.
(A) Ultra-thin electron microscopy of Birbeck granules with and without yeast mannan in langerin-overexpressing 293T cells. Residues at 260–263 (Met-Glu-Gly-Asp, MEGD) were mutated to Met-Arg-Gly-Asp (MRGD), Met-Arg-Gly-Lys (MRGK), or Ala-Arg-Gly-Lys (ARGK). The Mannan (+) WT image has a lower magnification than the others in order to show the entire Birbeck granules. (B–D) Quantification of Birbeck granule formation. Horizontal lines indicate the median values. Single asterisks and the double asterisk indicate statistically significant differences with p<0.01 and p=0.0101, respectively. NS indicates no statistically significant differences. p values were calculated using Bonferroni-corrected Student’s t-tests. (B) Lengths of individual Birbeck granules were measured. N=337 (WT mannan-), 386 (WT mannan+), 348 (MRGD), 233 (MRGK), and 70 (ARGK). p=1.4 × 10–68 (WT mannan (-)), 2.6×10–46 (MRGD), 6.6×10–62 (MRGK), and 1.1×10⁻³⁵ (ARGK). (C) Sum of the length of Birbeck granules per 100 µm2 cell area. Cross-sections of cells with nuclei of >5 µm in diameter were selected and the total lengths of the Birbeck granules were measured within the cells. N=20 for all the samples. p=2.9 × 10⁻⁷ (WT mannan (-)), 5.0×10⁻⁸ (MRGD), 1.5×10⁻¹⁰ (MRGK), and 1.0×10⁻¹¹ (ARGK). (D) Number of the Birbeck granules per 100 µm2 cell area. N=20 for all the samples. p=0.85 (WT mannan (-)), 1.2 (MRGD), 0.005 (MRGK), and 2.2×10⁻¹³ (ARGK).
Figure 5 with 1 supplement
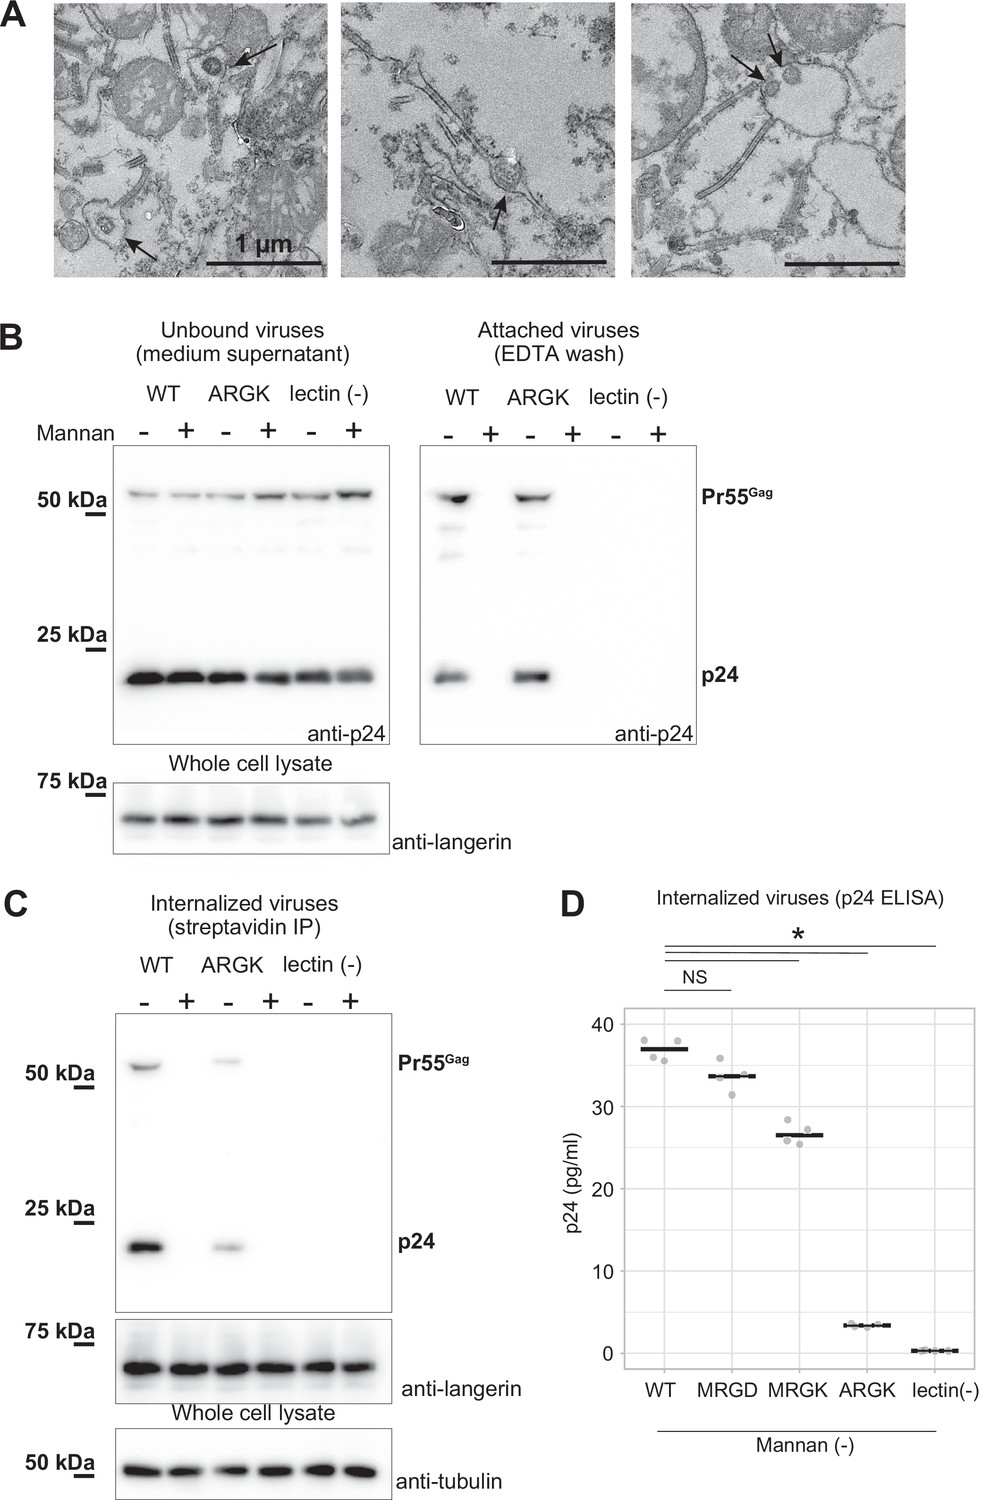
Mutation to the loop 258–263 inhibited the internalization of pseudoviruses.
HIV-1 pseudoviruses were added to langerin-expressing 293T cells. Yeast mannan (10 µg/ml) was added to block the lectin-dependent binding of pseudoviruses. A langerin mutant lacking calcium binding ability (lectin (-)) was used as the negative control. (A) Immunoblots of pseudoviruses attached to the cell surface. Unbound and attached viruses were collected from the supernatant of the culture medium and TBS-EDTA buffer, respectively. Samples of unbound viruses were diluted 50-fold to adjust the band intensities. The expression levels of SNAP-tagged langerin show that the numbers of transfected cells were approximately the same in each experiment. Pr55gag and p24 indicate unprocessed and fully-processed capsid proteins, respectively. (B) Immunoblots of internalized pseudoviruses. Birbeck granules were isolated by precipitation using streptavidin-agarose, and intracellular viruses and langerin were detected by their respective antibodies. Tubulins in the whole-cell lysates were detected for loading controls. (C) Quantification of internalized viruses using p24 ELISA. Horizontal lines indicate the mean. NS and Asterisk indicate no significant difference and statistically significant differences (p=0.07 (MRGD); 9.4×10⁻⁵ (MRGK); 9.9×10⁻⁹ (ARGK); and 5.5×10⁻⁹ (lectin(-))) calculated using Bonferroni-corrected Student’s t-tests (N=4), respectively.
-
Figure 5—source data 1
Original blot image of Figure 5B (right, anti-p24).
- https://cdn.elifesciences.org/articles/79990/elife-79990-fig5-data1-v2.zip
-
Figure 5—source data 2
Annotated blot image of Figure 5B (right, anti-p24).
- https://cdn.elifesciences.org/articles/79990/elife-79990-fig5-data2-v2.pdf
-
Figure 5—source data 3
Original blot image of Figure 5B (right, anti-langerin).
- https://cdn.elifesciences.org/articles/79990/elife-79990-fig5-data3-v2.zip
-
Figure 5—source data 4
Annotated blot image of Figure 5B (right, anti-langerin).
- https://cdn.elifesciences.org/articles/79990/elife-79990-fig5-data4-v2.pdf
-
Figure 5—source data 5
Original blot image of Figure 5B (left, anti-p24) and Figure 5C (anti-p24).
- https://cdn.elifesciences.org/articles/79990/elife-79990-fig5-data5-v2.zip
-
Figure 5—source data 6
Annotated blot image of Figure 5B (left, anti-p24) and Figure 5C (anti-p24).
- https://cdn.elifesciences.org/articles/79990/elife-79990-fig5-data6-v2.pdf
-
Figure 5—source data 7
Original blot image of Figure 5C (anti-langerin).
- https://cdn.elifesciences.org/articles/79990/elife-79990-fig5-data7-v2.tif
-
Figure 5—source data 8
Original blot image of Figure 5C (anti-tubulin).
- https://cdn.elifesciences.org/articles/79990/elife-79990-fig5-data8-v2.zip
-
Figure 5—source data 9
Annotated blot images of Figure 5C (anti-langerin and anti-tubulin).
- https://cdn.elifesciences.org/articles/79990/elife-79990-fig5-data9-v2.pdf
Figure 5—figure supplement 1
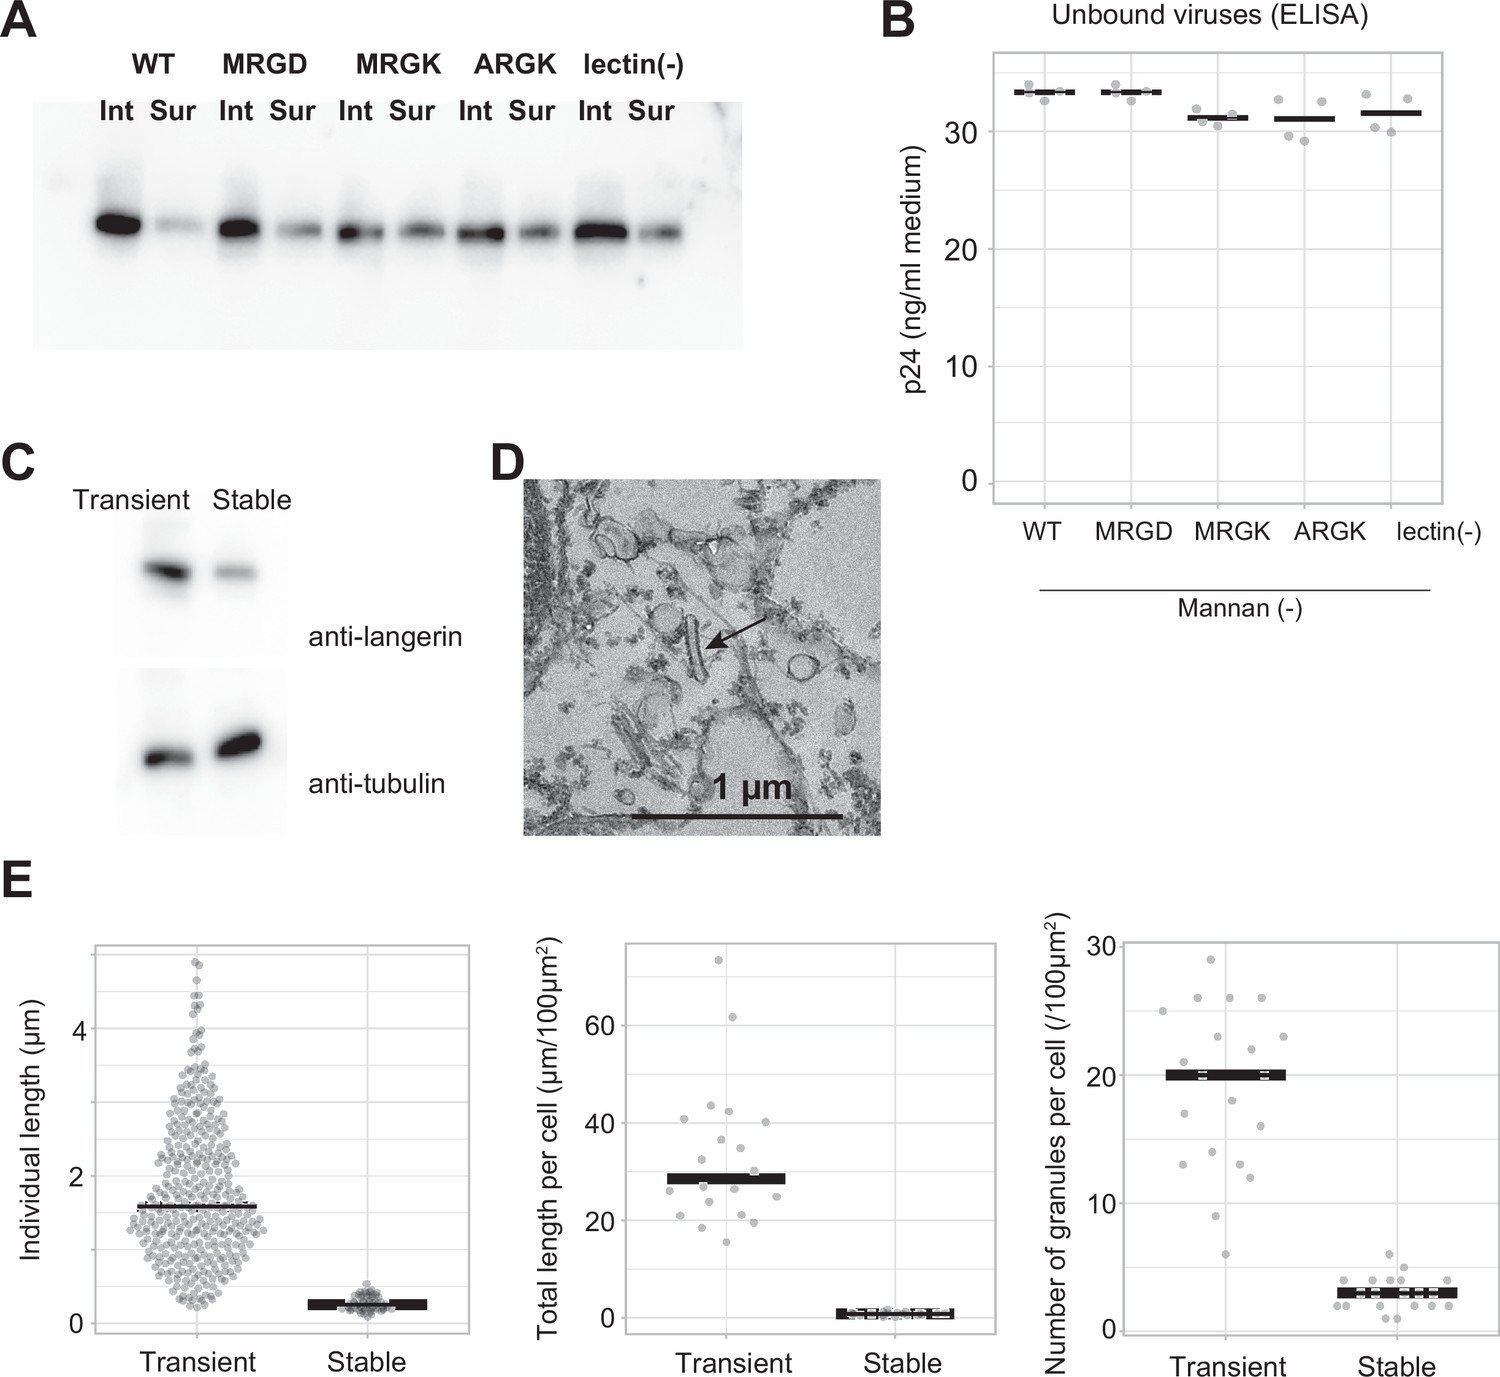
Virus internalization by langerin.
(A) Surface labeling of langerin. Langerin-expressing cells were surface-labeled using biotin N-hydroxysulfosuccinimide ester, and labeled langerin were immunoprecipitated using streptavidin agarose. ‘Int’ and ‘Sur’ indicate intracellular and surface langerin, respectively. The intracellular: surface ratio of langerin was approximately 5:1 and this ratio was not significantly affected by mutations. (B) Quantification of unbound viruses using p24 ELISA. Medium supernatants were diluted 1000-fold before loading into the ELISA plate. Concentration of viruses in the medium supernatant were nearly equal among the wild type and the mutants. (C) Anti-langerin immunoblot of stably-expressing cell line. The expression level of langerin in the stable cell line was approximately 30% of that of transiently-expressing cells. Given that the transformation efficiency of transiently-expressing cells was 40%, the actual expression level of langerin per cell is estimated to be ~12%. (D) Electron microscopy of the stable cell line. Birbeck granule formation was induced by addition of yeast mannan. Short and isolated Birbeck granules were observed (arrow) (E) Quantification of Birbeck granule formation. ‘Transient’ corresponds to WT mannan (+) in Figure 4B–D. 74 Birbeck granules in 20 stably-expressing cells were measured. p=2.0 × 10⁻³⁰ (individual length), 2.5×10⁻¹² (individual length), and 9.7×10⁻¹⁴ (number).
-
Figure 5—figure supplement 1—source data 1
Original blot image of Figure 5—figure supplement 1A.
- https://cdn.elifesciences.org/articles/79990/elife-79990-fig5-figsupp1-data1-v2.zip
-
Figure 5—figure supplement 1—source data 2
Annotated blot image of Figure 5—figure supplement 1A.
- https://cdn.elifesciences.org/articles/79990/elife-79990-fig5-figsupp1-data2-v2.pdf
-
Figure 5—figure supplement 1—source data 3
Original blot image of Figure 5—figure supplement 1C (anti-langerin).
- https://cdn.elifesciences.org/articles/79990/elife-79990-fig5-figsupp1-data3-v2.zip
-
Figure 5—figure supplement 1—source data 4
Original blot image of Figure 5—figure supplement 1C (anti-tubulin).
- https://cdn.elifesciences.org/articles/79990/elife-79990-fig5-figsupp1-data4-v2.zip
Figure 6

Model of HIV internalization by langerin.
(A) Glycosylated structure of HIV-1 envelope (env, gray) (Constructed based on PDB ID: 5FYJ and 6ULC) bound to the langerin trimer complex. Branches of the high-mannose oligosaccharide interacting with the primary (yellow) and secondary (pink) carbohydrate-binding sites. The broken square indicates the position of the close-up view on the right. (B) Schematics of HIV internalization by langerin. The inset on the top shows an overview of antigen processing within a Langerhans cell. Viruses are captured by langerin, internalized into a Birbeck granule, and degraded by the autophagic system. The red square indicates the viral entry process described in the lower panels. The high-mannose oligosaccharide on HIV-1 env first binds to the primary carbohydrate-binding site, and one of the branches of the oligo-mannose weakly interacts with the secondary binding site. The flexible neck region allows docking of the loop 258–263 of an adjacent trimer into the secondary carbohydrate-binding cleft, reinforcing the binding of the oligo-mannose. As the elastic neck regions straighten, the plasma membrane is deformed into a lamellar invagination, which internalizes the virus.
Figure 7
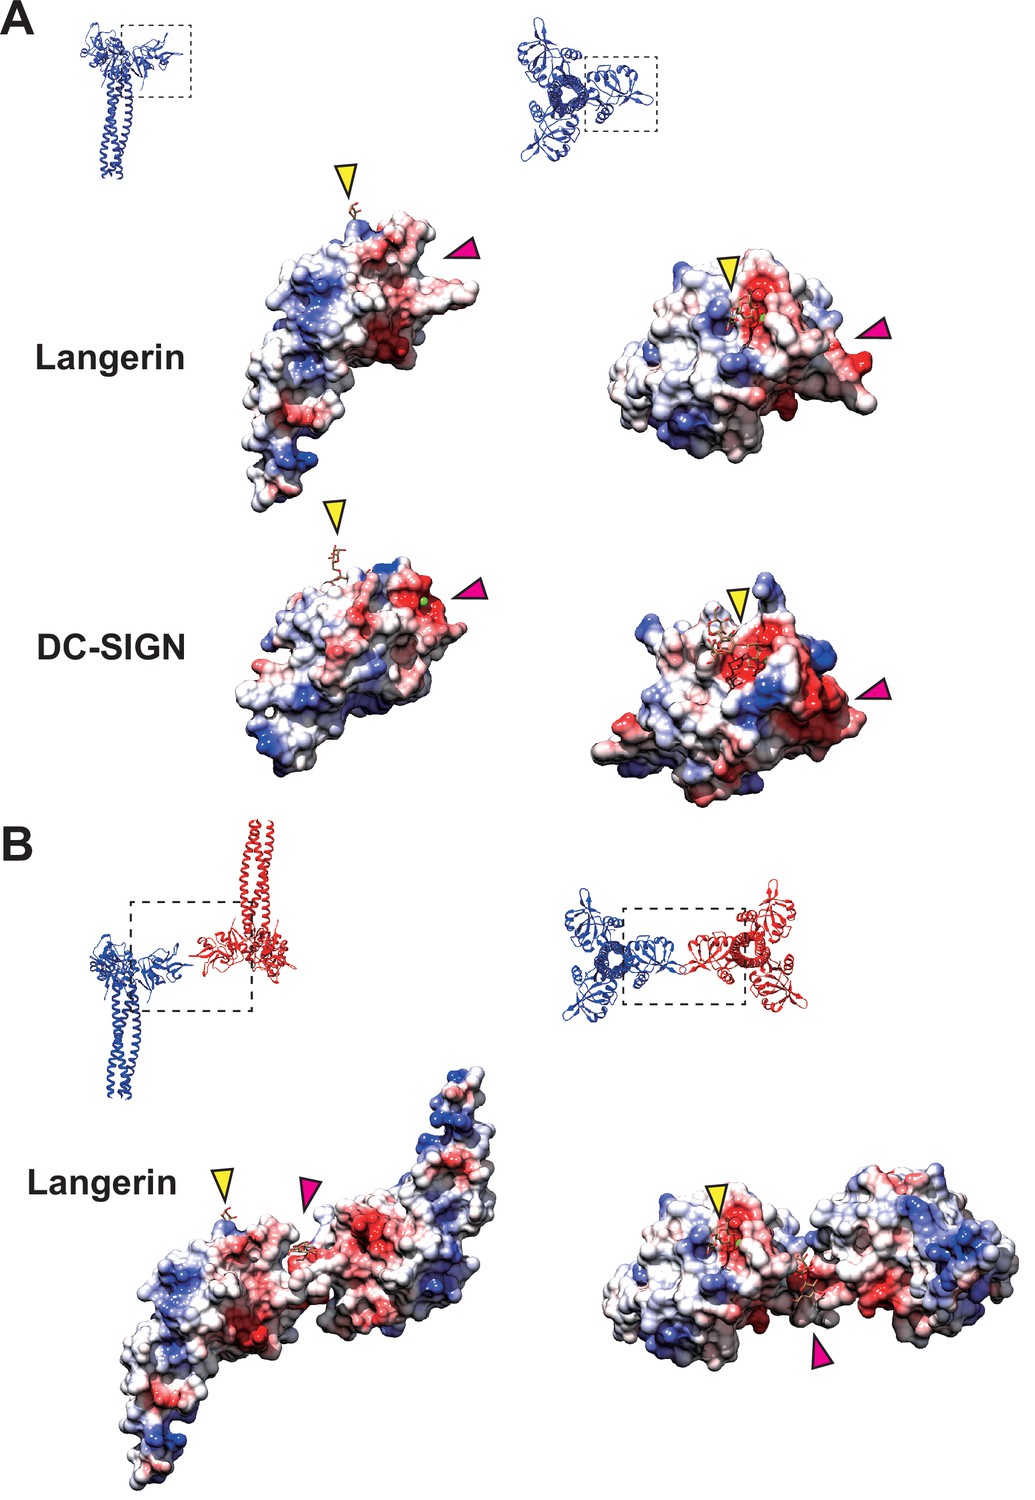
Coulombic surfaces of the carbohydrate-binding sites.
(A) Comparison of the surface charge between the CRDs of langerin and DC-SIGN (PDB ID: 1SL4). Blue and red coloring indicates positive and negative charges, respectively. The primary and secondary carbohydrate-binding sites are indicated by yellow and pink arrowheads, respectively. The region of DC-SIGN corresponding to the secondary carbohydrate-binding sites of langerin is occupied by calcium ions (green) and does not form a cleft. (B) Surface model of the langerin trimer complex. Mannose ligands are placed based on a previously proposed model (Chatwell et al., 2008). (A–B) Broken squares indicate the position and the orientation of the side (left) and the top (right) views. Oligosaccharide ligands are shown in gray.
Additional files
-
Supplementary file 1
Source code for generating the center coordinates within a polygon.
- https://cdn.elifesciences.org/articles/79990/elife-79990-supp1-v2.zip
-
Supplementary file 2
Table summary of data collection and model validation.
- https://cdn.elifesciences.org/articles/79990/elife-79990-supp2-v2.docx
-
MDAR checklist
- https://cdn.elifesciences.org/articles/79990/elife-79990-mdarchecklist1-v2.docx
Download links
A two-part list of links to download the article, or parts of the article, in various formats.
Downloads (link to download the article as PDF)
Open citations (links to open the citations from this article in various online reference manager services)
Cite this article (links to download the citations from this article in formats compatible with various reference manager tools)
Cryo-electron tomography of Birbeck granules reveals the molecular mechanism of langerin lattice formation
eLife 11:e79990.
https://doi.org/10.7554/eLife.79990


