A paternal bias in germline mutation is widespread in amniotes and can arise independently of cell division numbers
- Department of Biological Sciences, Columbia University, United States
- Department of Systems Biology, Columbia University, United States
Figures
Figure 1 with 1 supplement
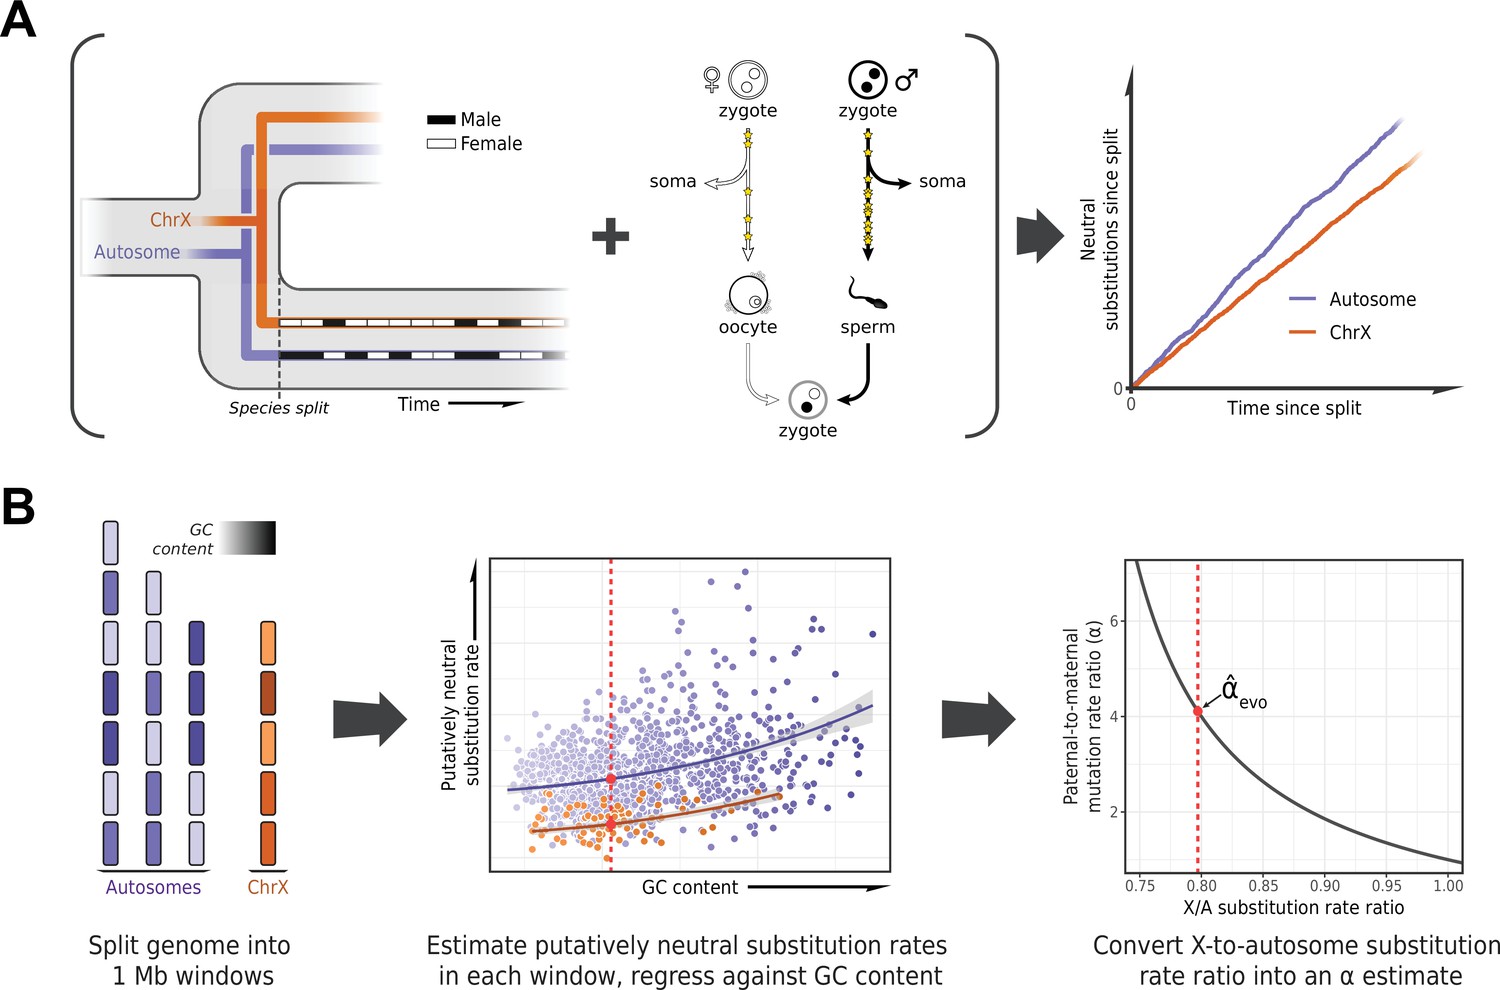
Estimating the paternal bias in mutation from neutral substitution rates of sex chromosomes and autosomes.
(A) On average, the lineage of an X chromosome spends fewer generations in males than females. Given a higher mutation rate in males than in females and all else being equal, this leads to lower rates of neutral substitutions on the X chromosome compared to autosomes (Miyata et al., 1987). (B) Procedure for estimating the ratio of paternal-to-maternal mutation rates, α, from substitution rates in sex chromosomes and autosomes. The autosomes and the X chromosome are partitioned into 1 Mb windows, depicted in purple and orange, respectively. Each window is filtered to focus on putatively neutrally evolving sequences (see Selecting non-repetitive and putatively neutral sequences in Materials and methods), and its GC content is calculated (represented by shading). The putatively neutral substitution rates per window are then regressed against the GC content (center panel, see Estimating α from X-to-autosome substitution rate ratios in Materials and methods). Substitution rate estimates for the X chromosome and autosomes are obtained from the regression fit (red points). Finally, the ratio of the point estimates is converted to an estimate of α (right panel). An analogous procedure applies to comparisons of the Z chromosome and autosomes in a ZW sex determination system.
Figure 1—figure supplement 1
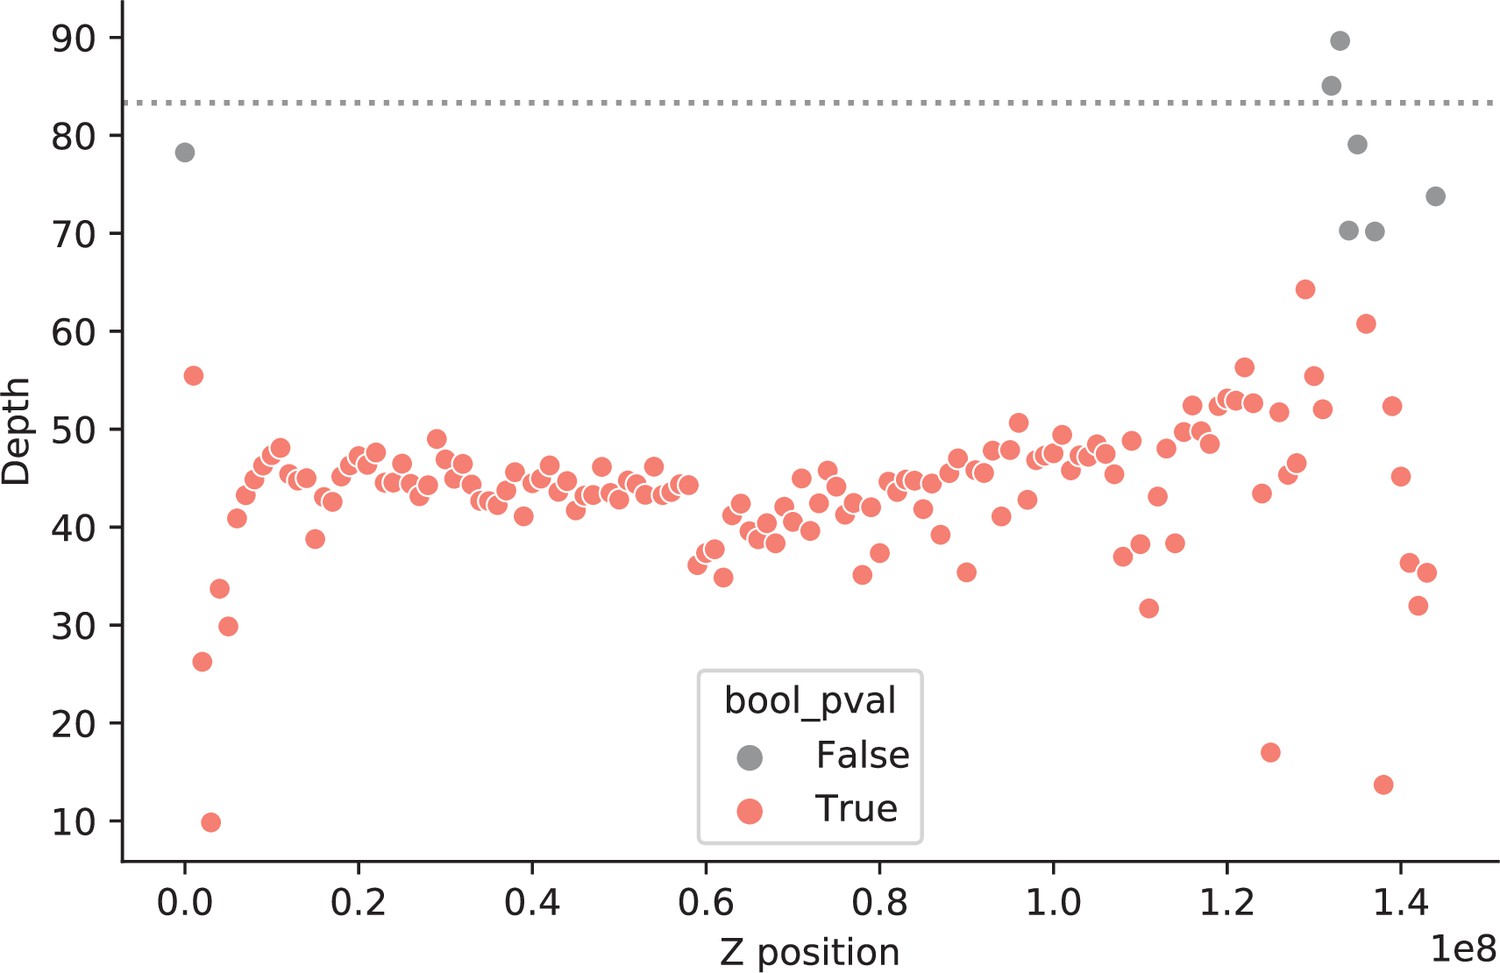
Identification of pseudo-autosomal regions in Thamnophis.
Depth of coverage along the Z chromosome of a heterogametic Thamnophis sirtalis individual. Each data point represents a 1 Mb window, colored by p-value (red if ≦ 0.05) assuming depth of coverage is Poisson distributed with (the mean coverage in the autosomes of the same individual) (see Selecting non-repetitive and putatively neutral sequences in Materials and methods). We considered the Z genomic windows with similar coverage to that in the autosomes (gray points) to be pseudo-autosomal regions with homologs on the W chromosome.
Figure 2 with 3 supplements
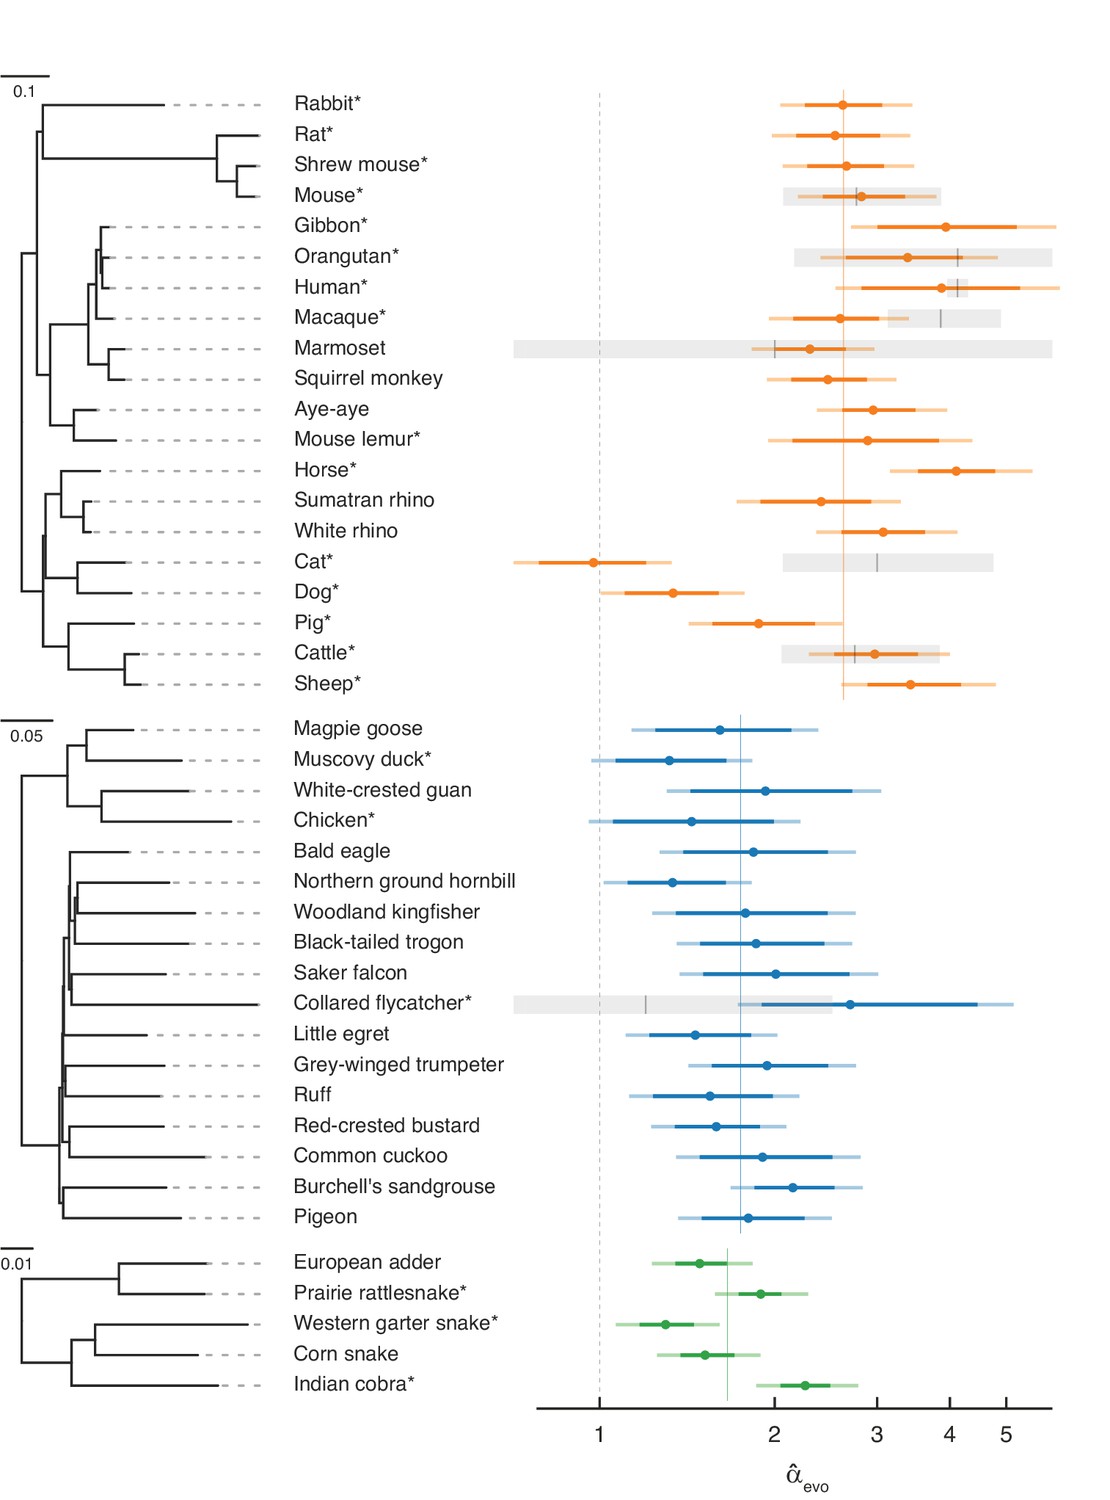
Estimates of the paternal bias in mutation across 42 amniote lineages.
Colored points denote estimates of α from X (Z)-to-autosome substitution rate ratios () in mammals (top, orange), birds (middle, blue), and snakes (bottom, green). Vertical colored lines denote the mean for each group, while the vertical gray dashed line denotes (i.e., no sex bias in mutation). Species in each group are plotted by their phylogenetic relationships and branch lengths are scaled by the neutral substitution rate estimated from autosomes (see Estimating putatively neutral substitution rates in Materials and methods). Note that branch lengths are comparable within the phylogeny of each taxon but not across taxa, as the scaling differs (see the legend for each group). In mammals, was estimated from neutral substitutions along the lineage from the tip to the most recent common ancestor indicated in the phylogeny. In birds, where phylogenetic relationships are more tenuous, we divided species into six subgroups (Supplementary file 5) to avoid highly uncertain ancestral nodes in Neoaves; thus, some estimates in Neoaves average over deeper splits than suggested by the full phylogeny, which we plot for clarity. Asterisks indicate species with chromosome-level assemblies. Darker colored horizontal lines behind the points represent 95% CIs, which were computed by bootstrap resampling of the 1 Mb genomic windows across 500 replicates; the central 95% interval across bootstrap replicates is shown. Lighter colored horizontal lines include uncertainty in the ratio of paternal-to-maternal generation times, allowing the ratio to range between 0.9 and 1.1 (Amster and Sella, 2016). Short vertical red lines denote point estimates of from published pedigree mutation studies of de novo mutations, and the surrounding horizontal gray boxes represent the 95% binomial CI for those estimates.
Figure 2—figure supplement 1
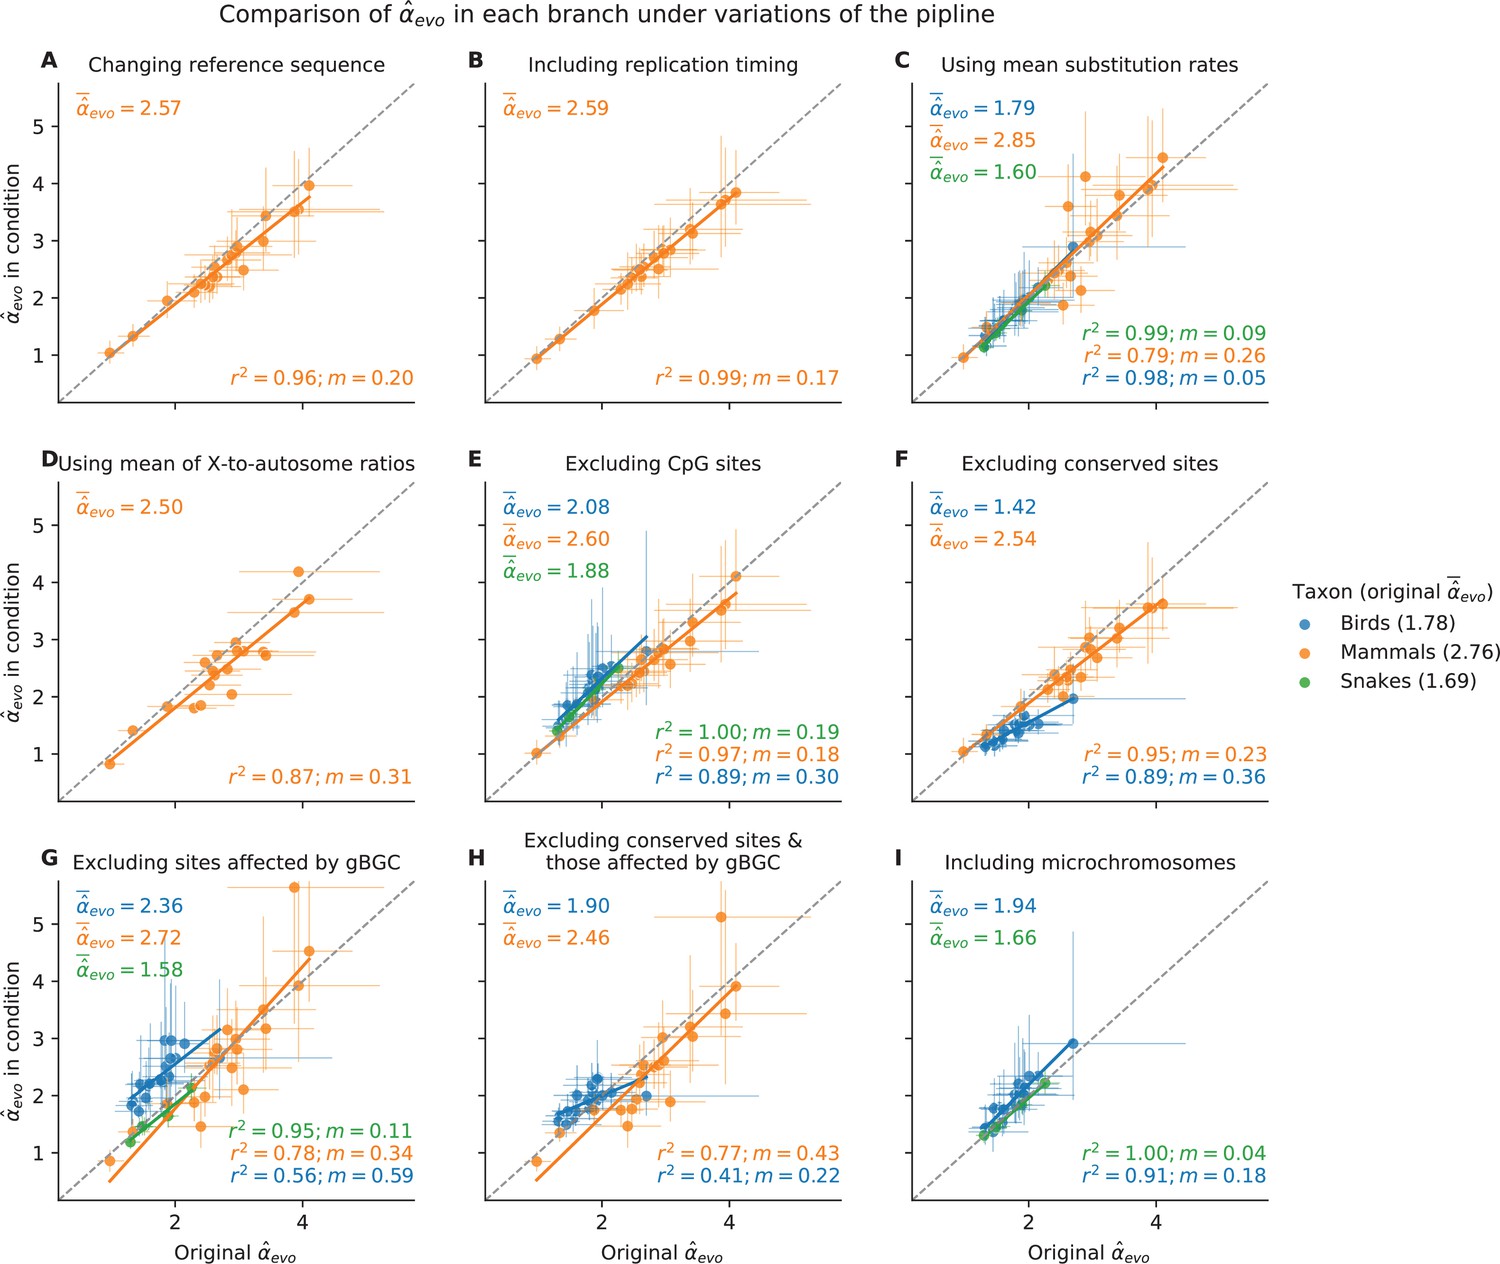
for each species, obtained under variants of the pipeline presented in the main text.
In each plot, the inferred by the pipeline described in Figure 1 and used throughout the manuscript (shown on the x-axis) is compared to estimates from the same pipeline with one modified condition (y-axis): In (A), the mammalian is obtained using Mus musculus as reference sequence instead of Homo sapiens (see Sequence alignments in Materials and methods); in (B) replication timing is included as a predictor in the regression (see Estimating α from X-to-autosome substitution rate ratios in Materials and methods); in (C) is obtained from the ratio of X (Z)-to-autosome mean substitution rates across genomic windows (see Estimating α from X-to-autosome substitution rate ratios in Materials and methods); in (D) is obtained from the mean of the ratio of X (Z)-to-autosome substitution rates, in windows with similar GC content (see Estimating α from X-to-autosome substitution rate ratios in Materials and methods). Here, CIs in the y-axis are extremely wide and not shown; in (E) is obtained after masking all CpG sites in the genome sequence alignment (see Selecting non-repetitive and putatively neutral sequences in Materials and methods); in (F) is obtained after masking all conserved sites identified by phastCons, in addition to exons (see Selecting non-repetitive and putatively neutral sequences in Materials and methods); in (G) is estimated for sites unaffected by GC-biased gene conversion (see Estimating putatively neutral substitution rates in Materials and methods); in (H) is estimated by both excluding conserved regions as in F, and using sites unaffected by GC-biased gene conversion as in G; and in (I) in birds and snakes is obtained including microchromosomes rather than masking them (see Selecting non-repetitive and putatively neutral sequences in Materials and methods). and mean absolute error () are shown in the bottom-right corner of each subplot. For each taxon, the mean obtained using the modified pipeline are annotated in the top-left corner, and the mean in the original pipeline can be found in the figure legend. Lines indicate ordinary least squares regression fits.
Figure 2—figure supplement 2
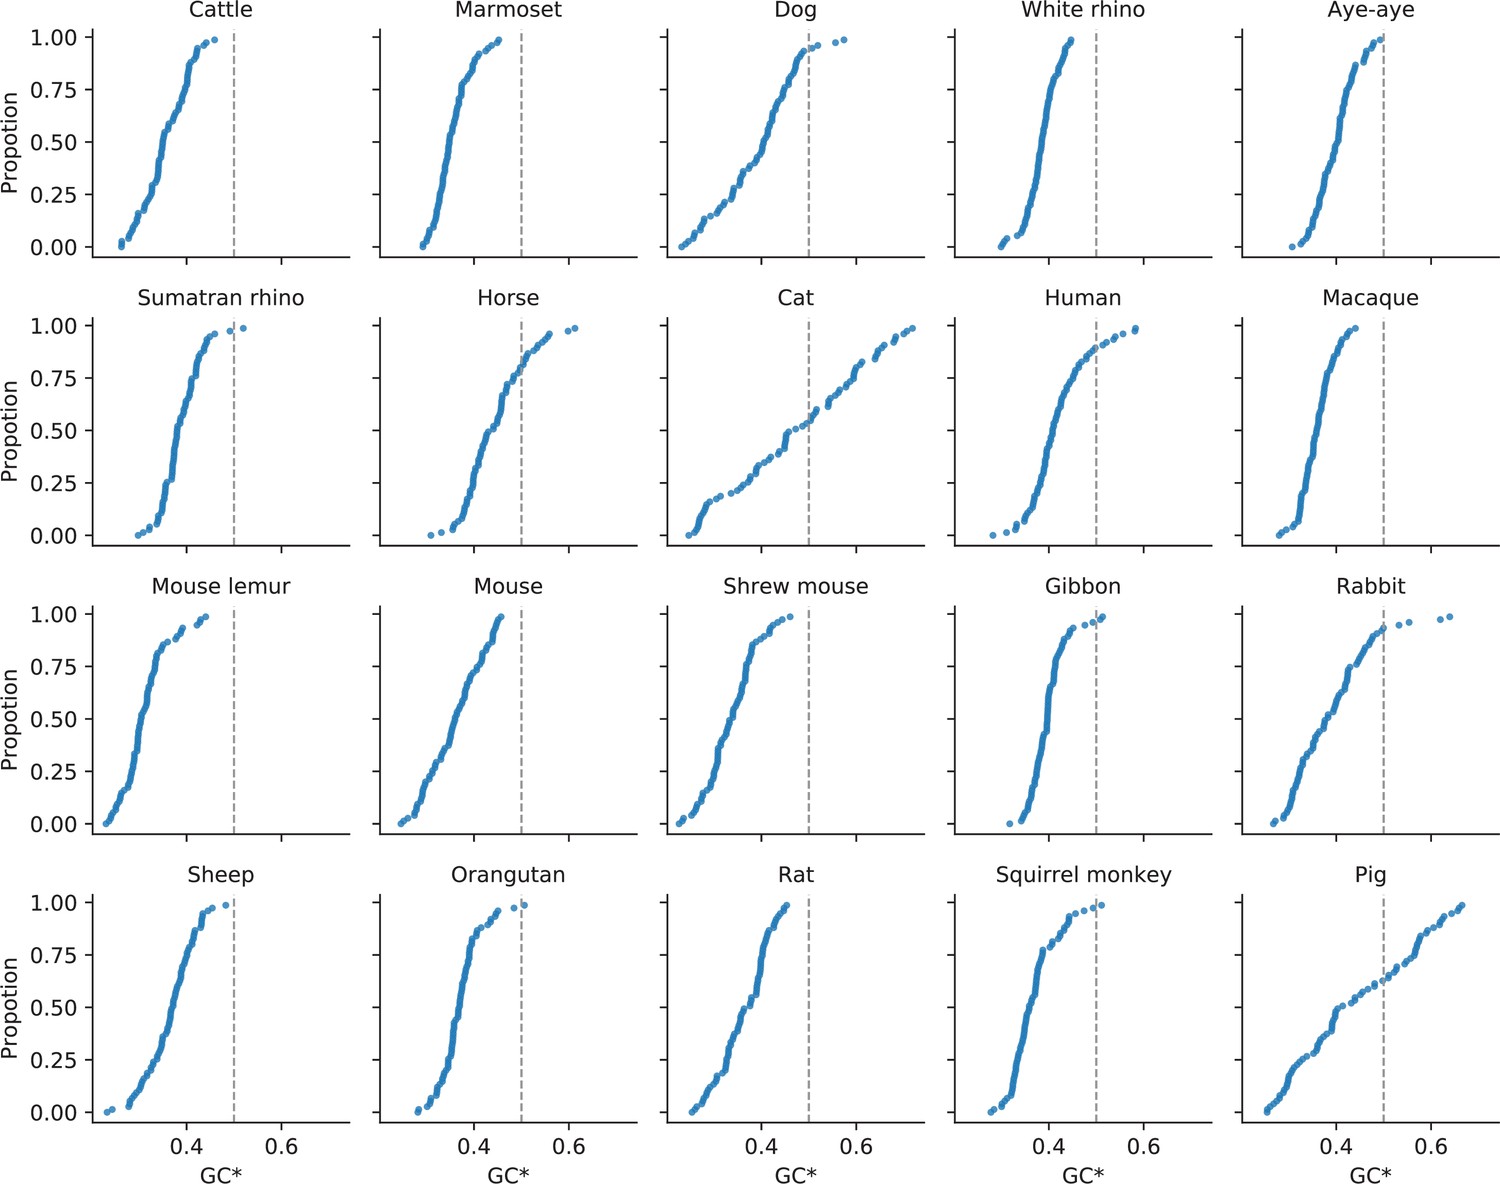
Expected equilibrium GC content (GC*) in the mammalian X chromosomes.
GC* is calculated as the fraction of the rate of substitutions favored by GC-biased gene conversion out of the total rate of substitutions affected by GC-biased gene conversion (i.e., ). To calculate GC* in 1 Mb genomic windows across the X chromosome of mammals, we used estimated rates of putatively neutral substitution for single mutation classes as described in Estimating putatively neutral substitution rates in Materials and methods. The vertical gray dashed lines at GC* = 0.5 are plotted to facilitate comparison between the distributions. The lineages leading to cats and pigs have unusually wide distributions of GC*, consistent with their idiosyncratic recombination landscapes in the X chromosome (Li et al., 2016).
Figure 2—figure supplement 3
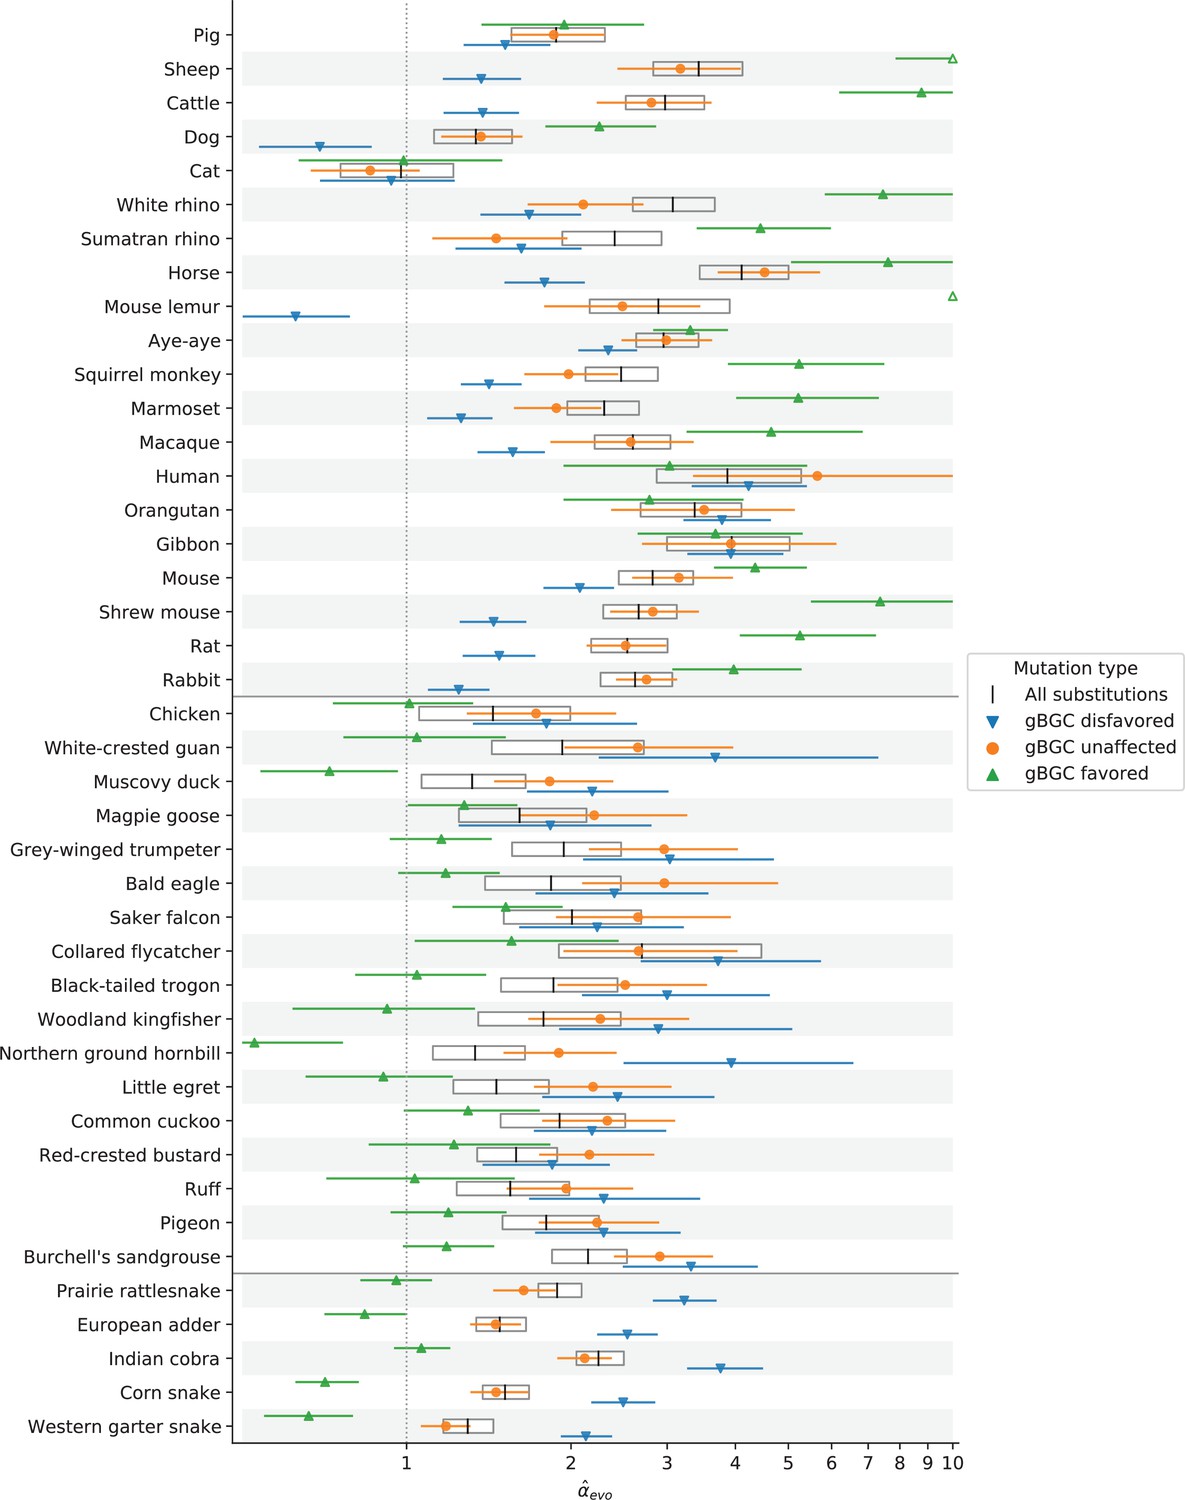
Estimation of for mutation types affected or unaffected by GC-biased gene conversion (gBGC).
α estimates were obtained from the ratio of X (Z)-to-autosome substitution rates of four mutation types (see Estimating putatively neutral substitution rates in Materials and methods): all substitutions (white boxes), substitutions that gBGC acts against (i.e., changes from strong [S] nucleotides [C & G] to weak [W] nucleotides [A & T], blue), substitutions favored by gBGC (W>S, green), and substitutions unaffected by gBGC (W>W and S>S, orange). Note that the x-axis is log-scaled, and values extending below 0.5 or past 10 are truncated, with hollow markers showing point estimates that are outside of these bounds. Horizontal black lines separate species belonging to mammals, birds, and snakes (from top to bottom).
Figure 3 with 2 supplements
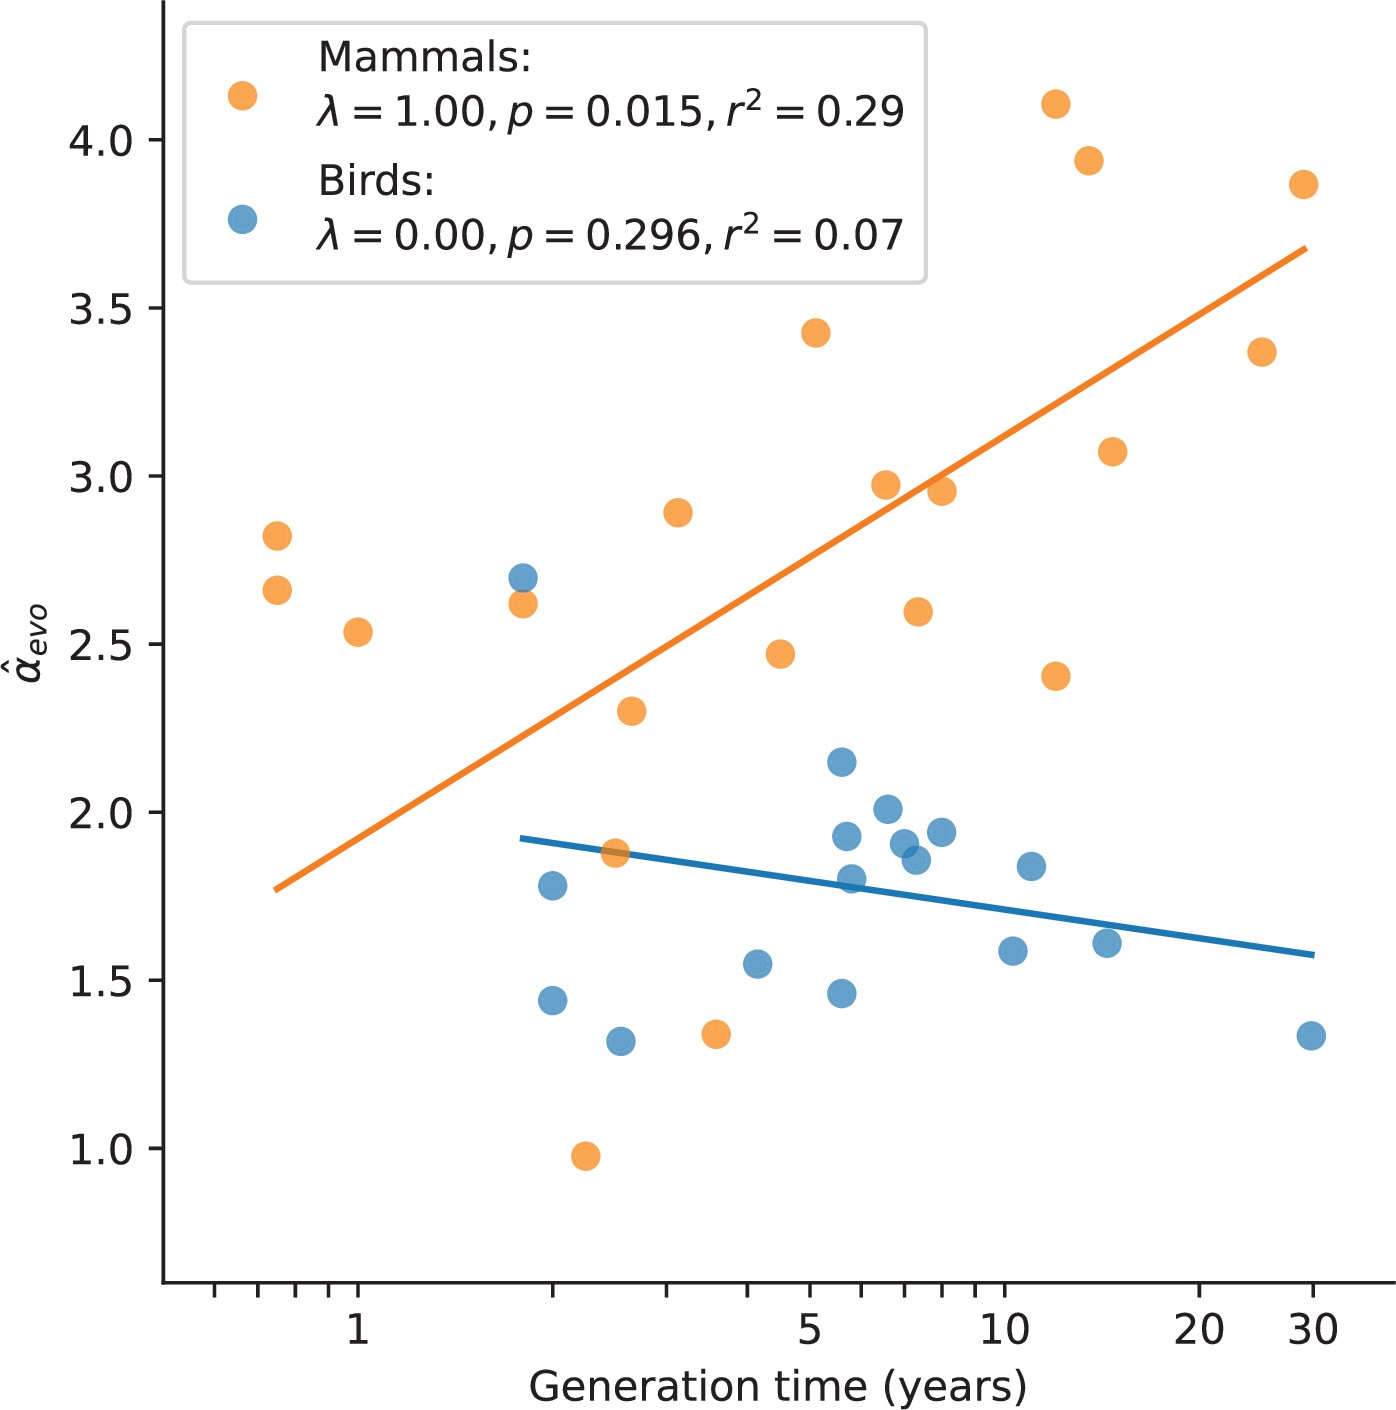
Relationship between and generation time estimates in mammals and birds.
Estimates of α from X (Z)-to-autosome comparisons are plotted against generation times from the literature (see Supplementary file 2), on a log scale. Lines denote the phylogenetic generalized least squares regression fits in mammals (orange) and birds (blue). λ refers to Pagel’s λ (Pagel, 1999), a measure of the strength of phylogenetic signal, which was inferred via maximum likelihood (see Testing relationships between α and life history traits in Materials and methods). Fixing λ to 1 in birds, as estimated for mammals, did not meaningfully improve the fit (p-value =0.282, ).
Figure 3—figure supplement 1
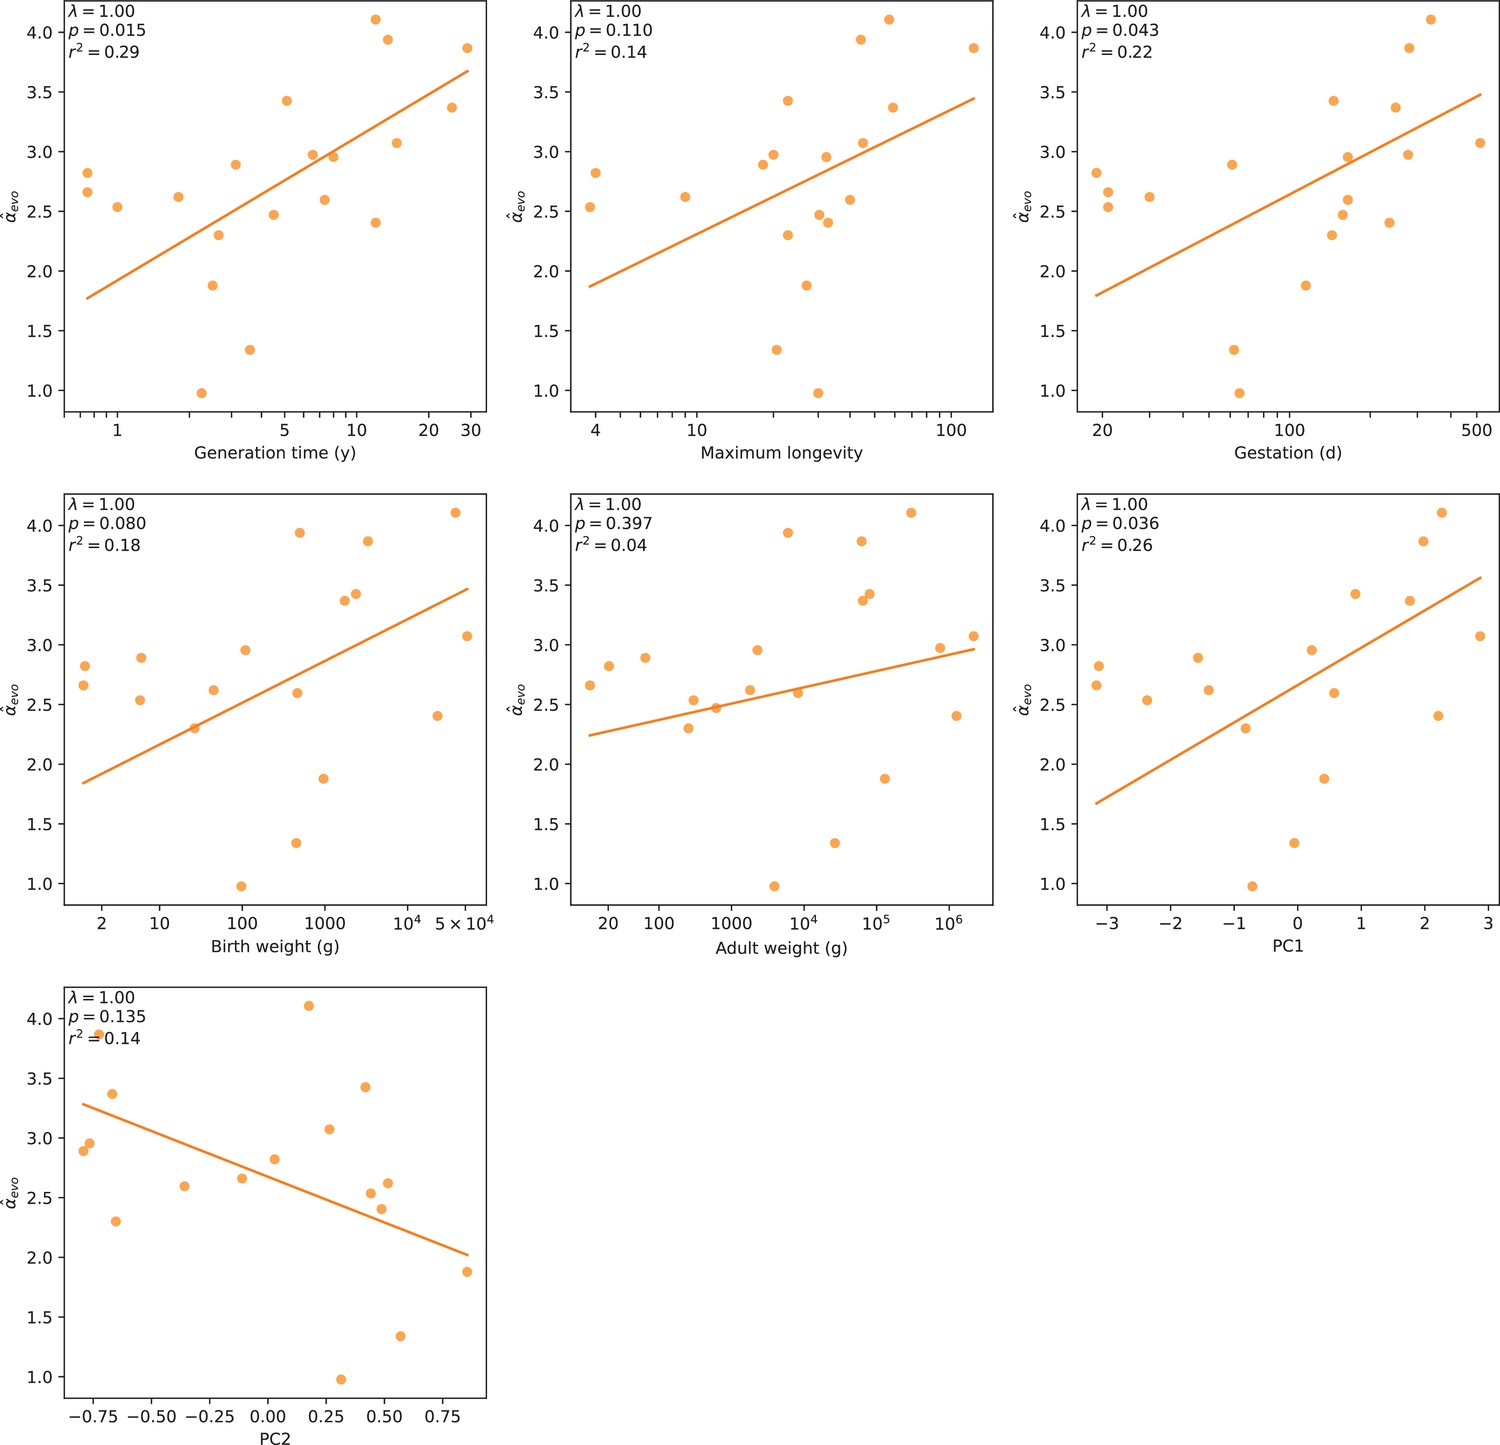
Relationship between mammalian and various life history traits.
α estimates from the ratio of X-to-autosome substitution rates were regressed against five life history traits separately, using phylogenetic generalized least squares. The estimates were also regressed against the first two principal components (PCs, see Figure 3—figure supplement 2 and Testing relationships between α and life history traits in Materials and methods) obtained in a PC analysis of the traits gestation, birth weight, adult weight, and generation time. (For reference, the comparison with generation time from Figure 4 is reproduced here.) Best fit lines are drawn in orange; regression statistics are indicated in the upper left corner of each subplot. Pagel’s λ (Pagel, 1999) was estimated by maximum likelihood (see Testing relationships between α and life history traits in Materials and methods).
Figure 3—figure supplement 2

Principal component (PC) analysis of four life history traits.
Gestation, birth weight, adult weight, and generation time measurements in mammals were gathered from the literature (see Testing relationships between α and life history traits in Materials and methods and Supplementary file 2) and subjected to PC analysis. Species are projected onto the two leading PCs, which are shown with the amount of variance captured by each in parentheses. Blue arrows denote loadings for the trait variables.
Figure 4 with 2 supplements

Variation in α among mammals may reflect varying exposures to different developmental stages.
(A) Ratio of paternal-to-maternal de novo mutations (DNMs) occurring in early embryogenesis (Early, white points), after the sexual differentiation of the germline (Late, gray points) and in both of these stages combined (Total, red line), for the three mammalian species in which this classification is available (mouse Lindsay et al., 2019, cattle Harland et al., 2017, and human Sasani et al., 2019). For each species, the percentage of DNMs occurring at each stage are indicated and used to scale the size of points. Vertical lines show the 95% binomial CIs. Since the phasing rate is not equal across developmental stages, point estimates for α in Total were computed by extrapolating the proportion of paternally and maternally phased DNMs in each stage to all the DNMs in that stage (i.e., assuming full phasing) (see Estimating α from pedigree studies in vertebrates in Materials and methods). (B) Schematic representation of a model in which α is the outcome of mutation in two developmental stages (see Modeling the effects of germline developmental stages on α in Materials and methods). (C) Expected relationship between α and generation time under the model outlined in B, assuming generation times are the same in both sexes. The increase of α with generation time depends on the paternal mutation rate per year in Late, , as illustrated by the purple gradient. (D) Fits of predicted α values to (orange) and (gray). In each species, α is predicted with Equation 1 assuming and using and , the latter estimated from autosomal branch-specific substitution rates per year () or as estimated from pedigree sequencing data () (see Modeling the effects of germline developmental stages on α in Materials and methods). The orange and gray lines denote the regression fit using phylogenetic generalized least squares (PGLS). PGLS statistics are shown for the two models (see Figure 3 legend for details).
Figure 4—figure supplement 1
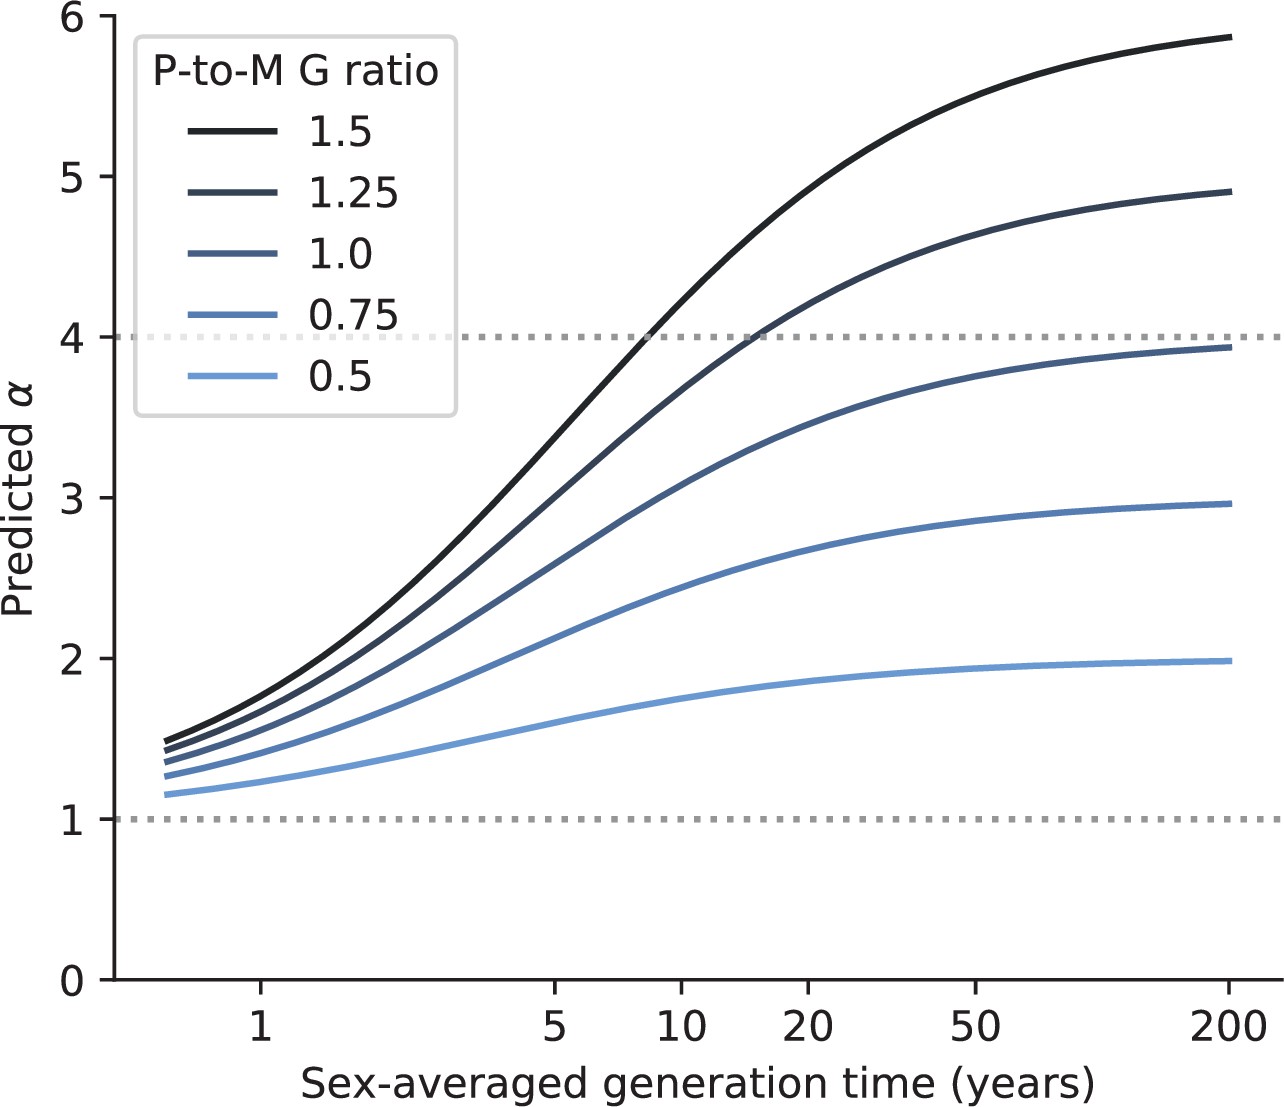
The maximal value of α depends on the ratio of paternal-to-maternal generation times.
The relationship between generation time and α that is expected using the model depicted in Figure 4B, for different ratios of paternal-to-maternal generation times (‘P-to-M G times’) (blue hues). Namely, we assume that (i) each sex accrues the same expected number of Early mutations per base pair (), (ii) the ratio of paternal-to-maternal mutation rate per unit of time is 4 in the Late stage (), and (iii) equals per base pair per year (see Modeling the effects of germline developmental stages on α in Materials and methods for more details). The maximum generation time (x-axis) was unrealistically set to 200 years to better show the plateau in α.
Figure 4—figure supplement 2
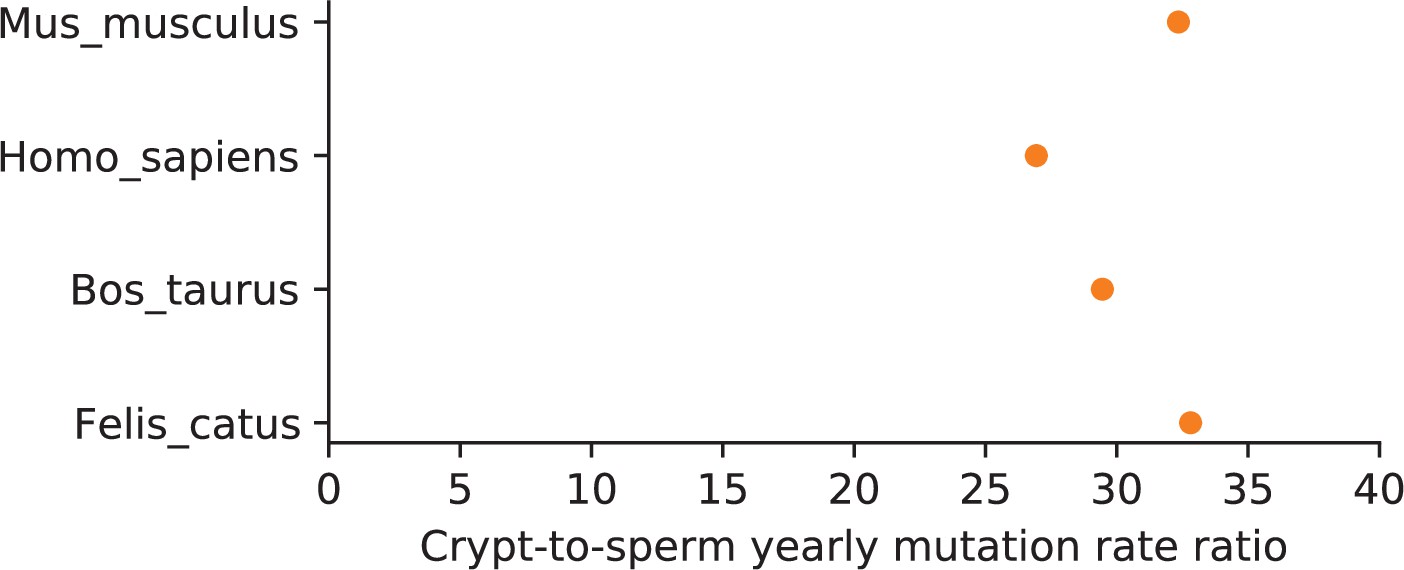
Ratio of crypt-to-sperm mutation rate per unit of time in four mammals.
The yearly mutation rate in colonic crypts was obtained from Cagan et al., 2022, for four species in which pedigree sequencing estimates of the mutation rate per generation are also available (Jónsson et al., 2017; Lindsay et al., 2019; Harland et al., 2017; Wang et al., 2022b). To estimate the mutation rate per year in sperm, we used the paternal-to-maternal generation time ratio in each pedigree study and assumed that: (i) each sex accrues the same expected number of Early mutations per base pair () and (ii) a ratio of paternal-to-maternal mutation rates per unit of time of 4 in the Late phase () (see Modeling the effects of germline developmental stages on α in Materials and methods).
Additional files
-
Supplementary file 1
Genome assembly statistics and heterozygosity estimates for 241 mammals, 365 birds, and 9 snakes.
- https://cdn.elifesciences.org/articles/80008/elife-80008-supp1-v2.xlsx
-
Supplementary file 2
Estimates of α obtained from the ratios of X (Z)-autosome substitution rates and from pedigree data, as well as life history traits, and genome assembly statistics for 46 mammal, bird, and snake species.
- https://cdn.elifesciences.org/articles/80008/elife-80008-supp2-v2.csv
-
Supplementary file 3
Phased de novo mutation counts categorized by developmental stage.
- https://cdn.elifesciences.org/articles/80008/elife-80008-supp3-v2.xlsx
-
Supplementary file 4
Sets of bird species used to estimate .
To avoid uncertain phylogenetic relationships within Neoaves, birds were split into separate analysis sets before estimating substitution rates (see Sequence alignments in Materials and methods). In groups 1–5, Gallus gallus was included as an outgroup when estimating substitution rates.
- https://cdn.elifesciences.org/articles/80008/elife-80008-supp4-v2.xlsx
-
Supplementary file 5
Pseudo-autosomal region intervals.
Coordinates were taken from studies Liu et al., 2019; Raudsepp and Chowdhary, 2015; Schield et al., 2019; Shearn et al., 2020; Skinner et al., 2013; Das et al., 2009; Smeds et al., 2014.
- https://cdn.elifesciences.org/articles/80008/elife-80008-supp5-v2.xlsx
-
Supplementary file 6
Parameter estimates and 95% confidence intervals from the regression of substitution rates against GC content (see Equation 3).
- https://cdn.elifesciences.org/articles/80008/elife-80008-supp6-v2.xlsx
-
MDAR checklist
- https://cdn.elifesciences.org/articles/80008/elife-80008-mdarchecklist1-v2.docx
Download links
A two-part list of links to download the article, or parts of the article, in various formats.
Downloads (link to download the article as PDF)
Open citations (links to open the citations from this article in various online reference manager services)
Cite this article (links to download the citations from this article in formats compatible with various reference manager tools)
A paternal bias in germline mutation is widespread in amniotes and can arise independently of cell division numbers
eLife 11:e80008.
https://doi.org/10.7554/eLife.80008


