Protein compactness and interaction valency define the architecture of a biomolecular condensate across scales
- Max Perutz Labs, Vienna Biocenter Campus (VBC), Austria
- University of Vienna, Center for Molecular Biology, Department of Structural and Computational Biology, Austria
- Medical University of Vienna, Center for Medical Biochemistry, Austria
- MM Shemyakin and Yu A Ovchinnikov Institute of Bioorganic Chemistry, Russian Academy of Sciences, Russian Federation
- University of Vienna, Center for Molecular Biology, Department of Biochemistry and Cell Biology, Austria
Figures
Figure 1 with 2 supplements
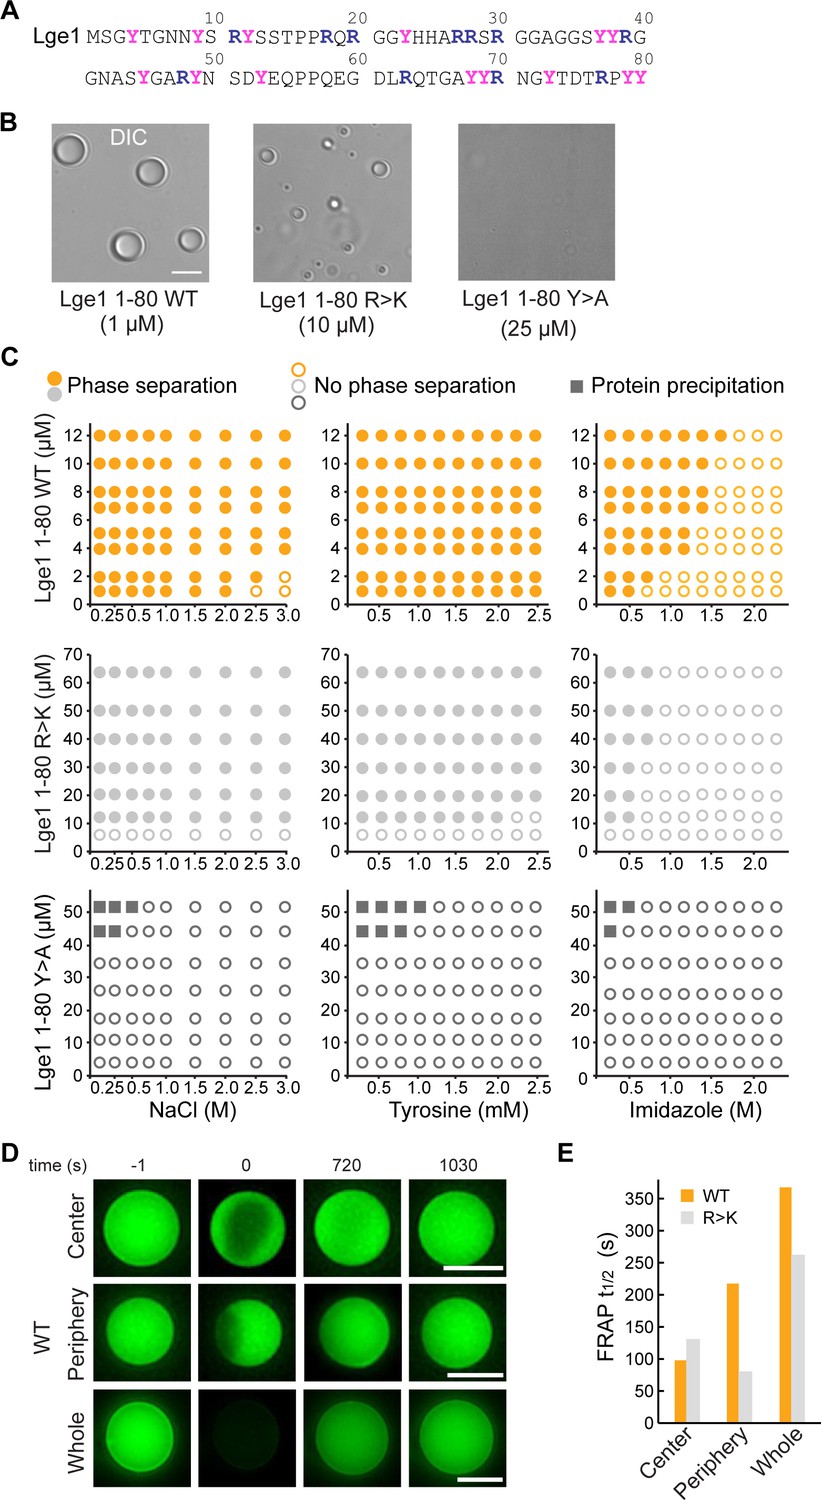
Lge11-80 condensate formation critically depends on tyrosine residues.
(A) Sequence of Lge11-80. Arginines and tyrosines are highlighted in deep blue and magenta, respectively. (B) Condensate formation for Lge11-80 WT (left) and R>K (middle) in buffer with 200 mM NaCl. No such condensates are observed for Lge11-80 Y>A (right). Scale bar, 5 µm. (C) Solubility diagrams for the WT (top row), R>K (middle row) and Y>A (bottom row) Lge11-80 variants with protein concentration given on the y-axis and concentration of NaCl (left panels), tyrosine (middle panels), and imidazole (right panels) given on the x-axis. (D) Representative fluorescence recovery after photobleaching (FRAP) images of Lge11-80 WT condensates, bleached in the center (upper panels), periphery (middle), or across the whole condensate (lower panels), including pre-bleach (left, time –1 s), bleach (time 0 s), and post-bleach (time 720 s, 1030 s). Scale bars, 5 µm. (E) Half-times of FRAP of Dylight-labeled Lge11-80 WT (orange) and R>K (gray) that were bleached in the center, periphery, or across the whole condensate. Data was obtained after fitting to a double exponential model (see Figure 1—figure supplement 2).
-
Figure 1—source data 1
Raw data used in panel C.
- https://cdn.elifesciences.org/articles/80038/elife-80038-fig1-data1-v3.zip
Figure 1—figure supplement 1
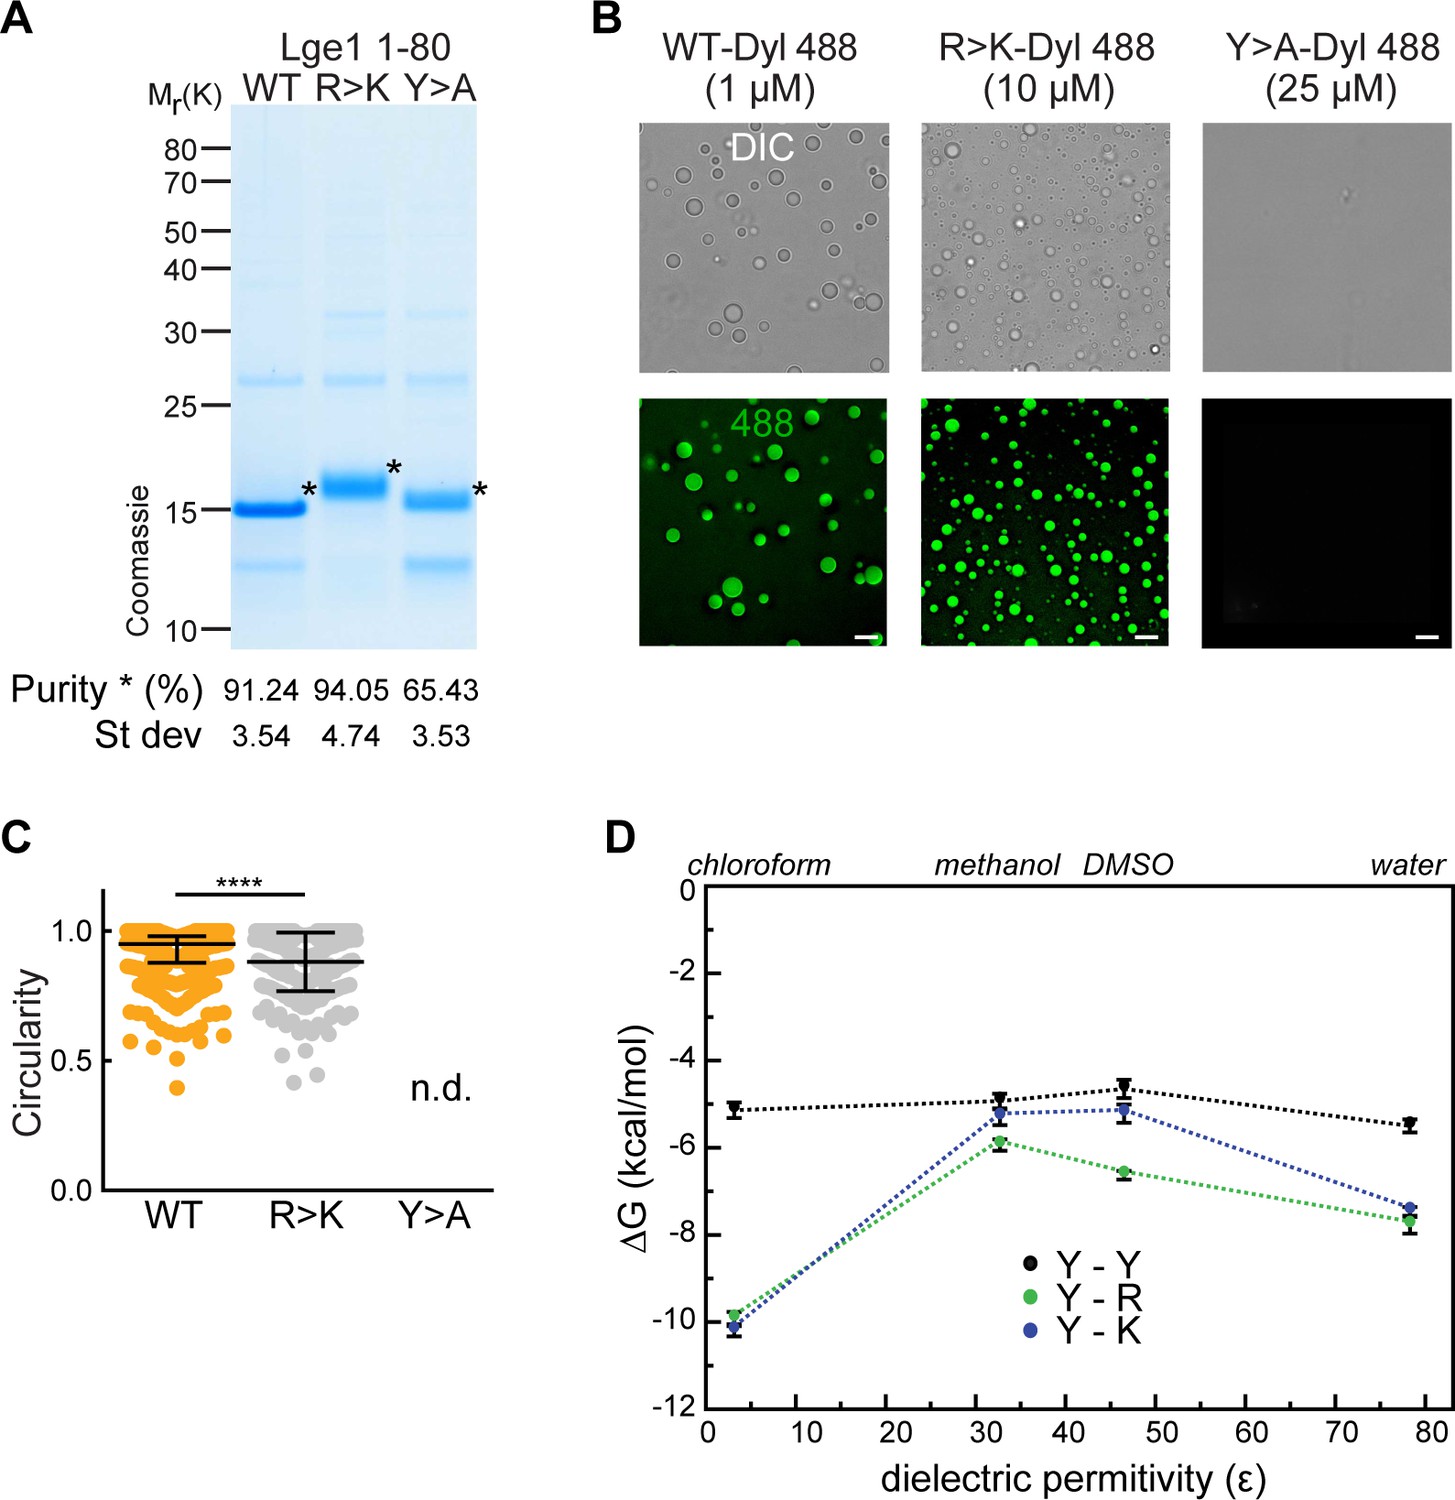
Experimental and modeling studies of the effect of tyrosine and arginine mutations in Lge11-80.
(A) Lge11-80 purification and purity. Following purification, the constructs were analyzed by SDS-PAGE (4–12% gel, MOPS buffer) and Coomassie staining. Lge11-80 purity was assessed by densitometry, comparing Lge1 (*) to other impurities detected in the same lane (see Methods for the protocol). Average and standard deviation from three different purifications are included. (B) Representative images of Dylight-labeled Lge11-80 WT, R>K and Y>A, generated at the indicated protein concentrations. Scale bar, 5 µm. (C) Circularity of Dylight-labeled Lge11-80 WT (1 µM; orange) and R>K (10 µM; light gray) condensates in solution (25 mM Tris, 100 mM NaCl, pH 7.5). Median and interquartile range are indicated. nWT = 300, nR>K = 286. n.d., not determinable. ****p<0.0001, determined by two-sided Mann-Whitney test. (D) Dependence of the pairwise interaction free energies (ΔG) of arginine (R), lysine (K), and tyrosine (Y) sidechain analogs on the dielectric permittivity of the environment (Ɛ). Results of all-atom Monte-Carlo simulations (see Methods for more details).
-
Figure 1—figure supplement 1—source data 1
Raw data used in panels A and C.
- https://cdn.elifesciences.org/articles/80038/elife-80038-fig1-figsupp1-data1-v3.zip
-
Figure 1—figure supplement 1—source data 2
Calculated free-energy values used in panel E.
- https://cdn.elifesciences.org/articles/80038/elife-80038-fig1-figsupp1-data2-v3.zip
Figure 1—figure supplement 2
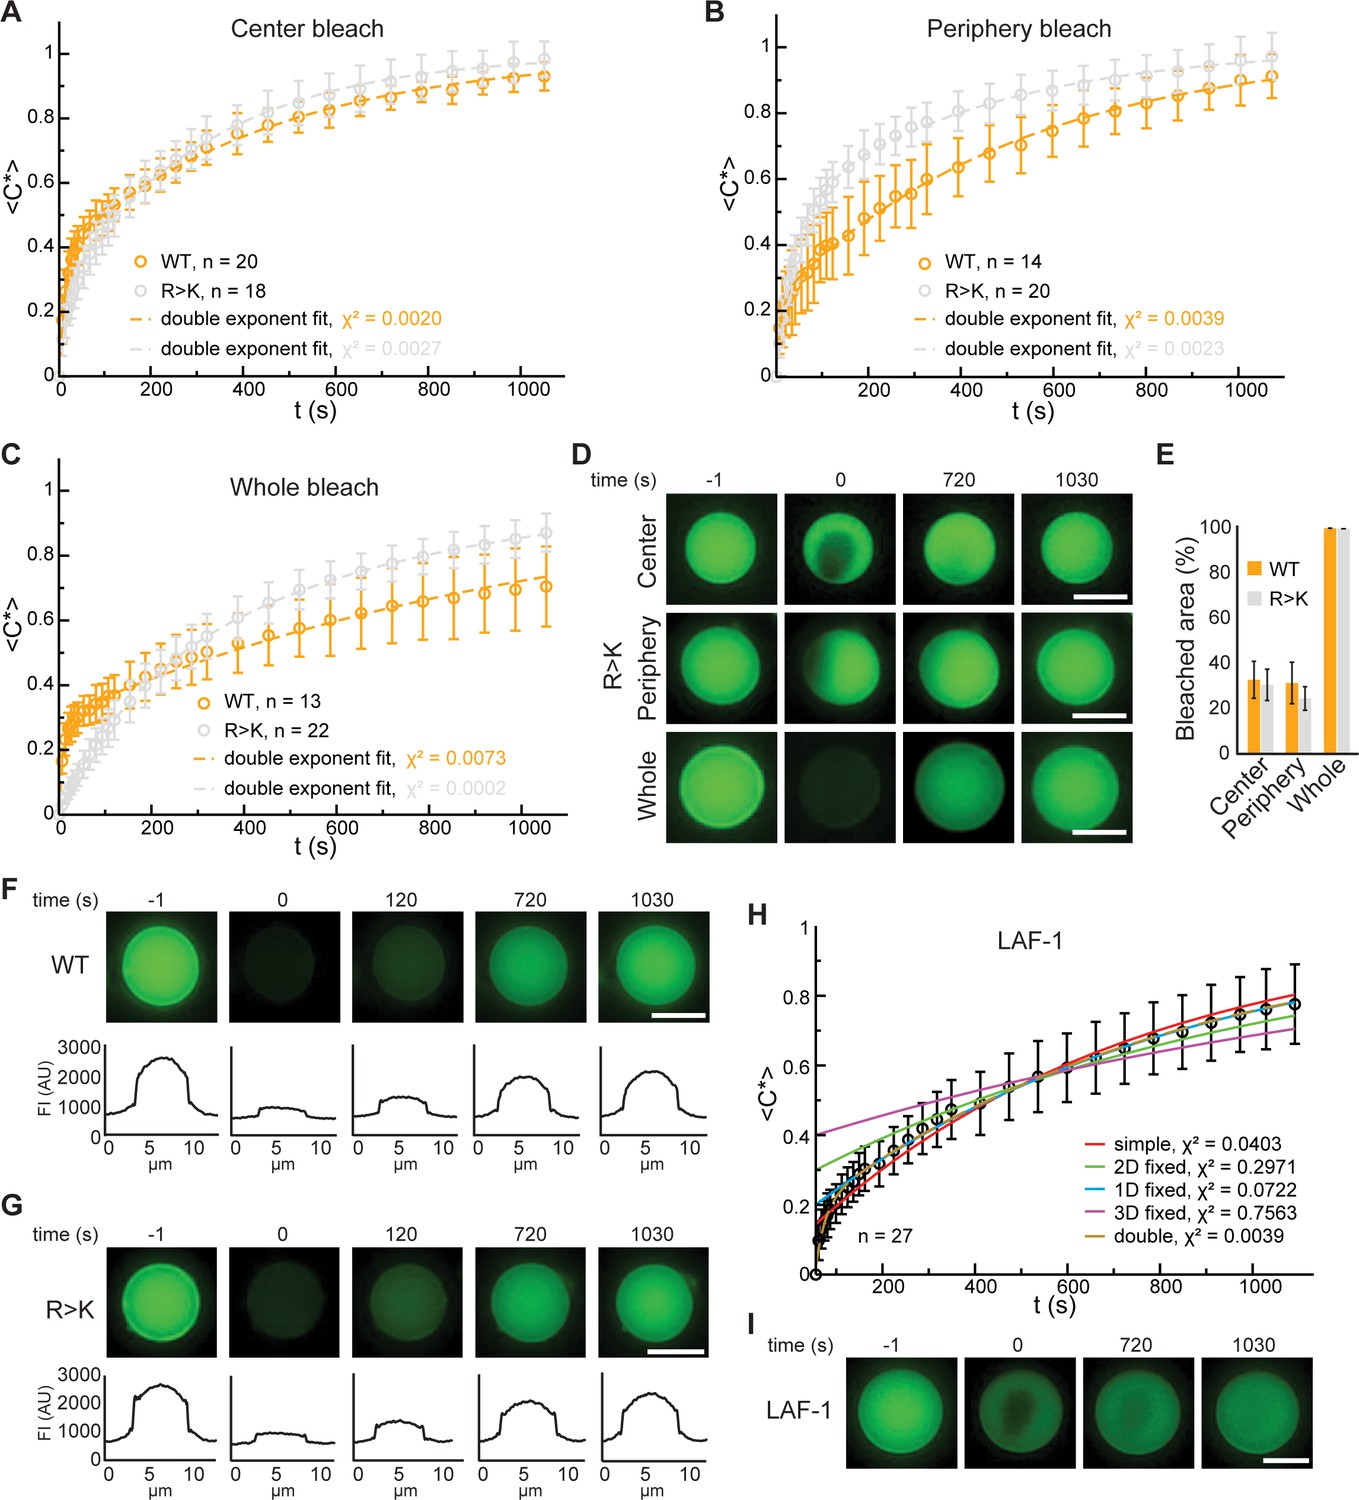
Fluorescence recovery after photobleaching (FRAP) analyses of Lge11-80 and LAF-1 condensates.
FRAP curve of Dylight-labeled Lge11-80 WT (orange) and R>K (gray) condensates that were bleached in the center (A), the periphery (B), or across the whole condensate (C). Recovery of the normalized intensity inside the bleach spot <C*>over time is shown as average (open circles) and standard deviation. The data is fitted to a double exponential model (dashed line). n, number of individual condensates. χ2, chi-squared value. (D) Representative FRAP images of Lge11-80 R>K condensates, bleached in the center (upper panels), the periphery (middle), or across the whole condensate (lower panels), including pre-bleach (left, time –1 s), bleach (time 0 s), and post-bleach (time 720 s, 1030 s). Scale bars, 5 µm. (E) Average of the percentage of the bleached area calculated over the total area of Lge11-80 WT (orange) and R>K (gray) condensates that were bleached in the center, periphery, and across the whole condensate. Error bars represent standard deviation. Number of condensates quantified as in A, B, C. (F) Representative FRAP images of a Lge11-80 WT condensate that was bleached across the whole condensate, including pre-bleach (time –1 s), bleach (time 0 s), and post-bleach (time 120 s, 720 s, 1030 s). The corresponding line profiles of the condensate at different times after bleaching show homogeneous fluorescent recovery. FI, fluorescent intensity. Scale bar, 5 µm. (G) Representative FRAP images of a Lge11-80 R>K condensate that was bleached across the whole condensate. The fluorescent line profile shows the same recovery behavior as for Lge11-80 WT in (F). FI, fluorescent intensity. Scale bar, 5 µm. (H) FRAP curve of Dylight-labeled LAF-1 shown as the average of the normalized intensity inside the bleach spot <C*> over time (black open circles). Error bars represent standard deviation. Fits to different models are plotted, with the corresponding chi-squared values (χ2). (I) Representative FRAP images of a LAF-1 condensate that was bleached in the center, including pre-bleach (time –1 s), bleach (time 0 s), and post-bleach (time 720 s, 1030 s). Scale bar, 5 µm.
-
Figure 1—figure supplement 2—source data 1
Fluorescence recovery after photobleaching (FRAP) summary: fitting parameters, recovery half-times, and raw data.
- https://cdn.elifesciences.org/articles/80038/elife-80038-fig1-figsupp2-data1-v3.xlsx
Figure 2 with 1 supplement
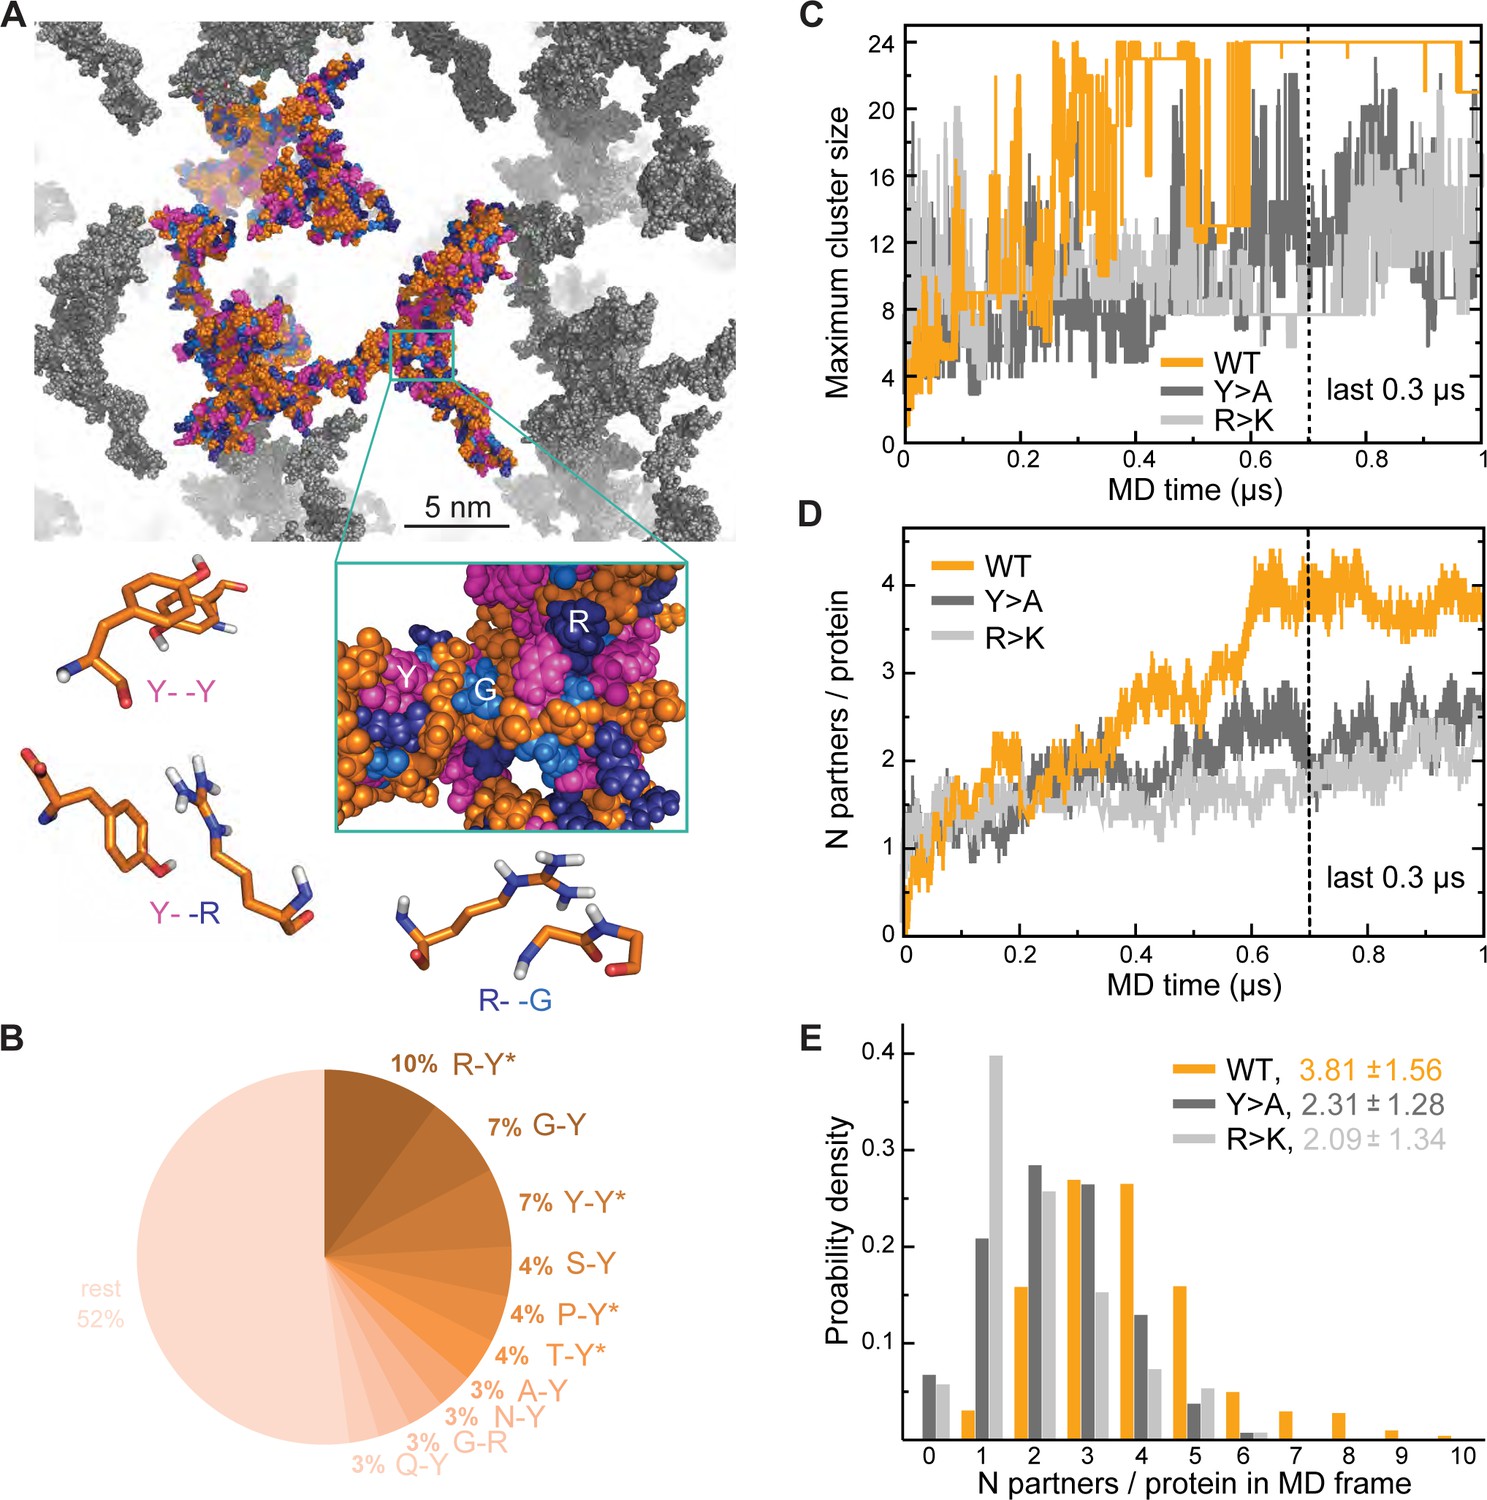
Analysis of interaction networks for Lge11-80 variants by all-atom molecular dynamics (MD) in 24-copy systems.
(A) Exemplary MD snapshot of the WT interaction network (see Video 3 for the full MD trajectory). Proteins in the simulation box are given in the atomic representation (orange), whereby glycine, arginine, and tyrosine residues are colored in sky blue, deep blue, and magenta, respectively. Periodic images of the simulated system are shown in gray. (B) Pairwise contact statistics over the last 0.3 µs of simulations for the Lge11-80 WT. Contacts enriched over the sequence background are marked with stars (see Figure 2—figure supplement 1A for exact enrichment values). (C) Time evolution of the largest detected protein cluster size and (D) the average number of interaction partners per protein chain, that is interaction valency, for the WT (orange line), Y>A (dark gray line), and R>K (light gray line) multi-chain systems. (E) Distributions of the number of interaction partners per protein over the last 0.3 µs of simulations. The color code is the same as in (C and D).
-
Figure 2—source data 1
Contact statistics used in panel B.
- https://cdn.elifesciences.org/articles/80038/elife-80038-fig2-data1-v3.xlsx
-
Figure 2—source data 2
Molecular dynamics (MD) data used in panels C, D, E.
- https://cdn.elifesciences.org/articles/80038/elife-80038-fig2-data2-v3.zip
Figure 2—figure supplement 1
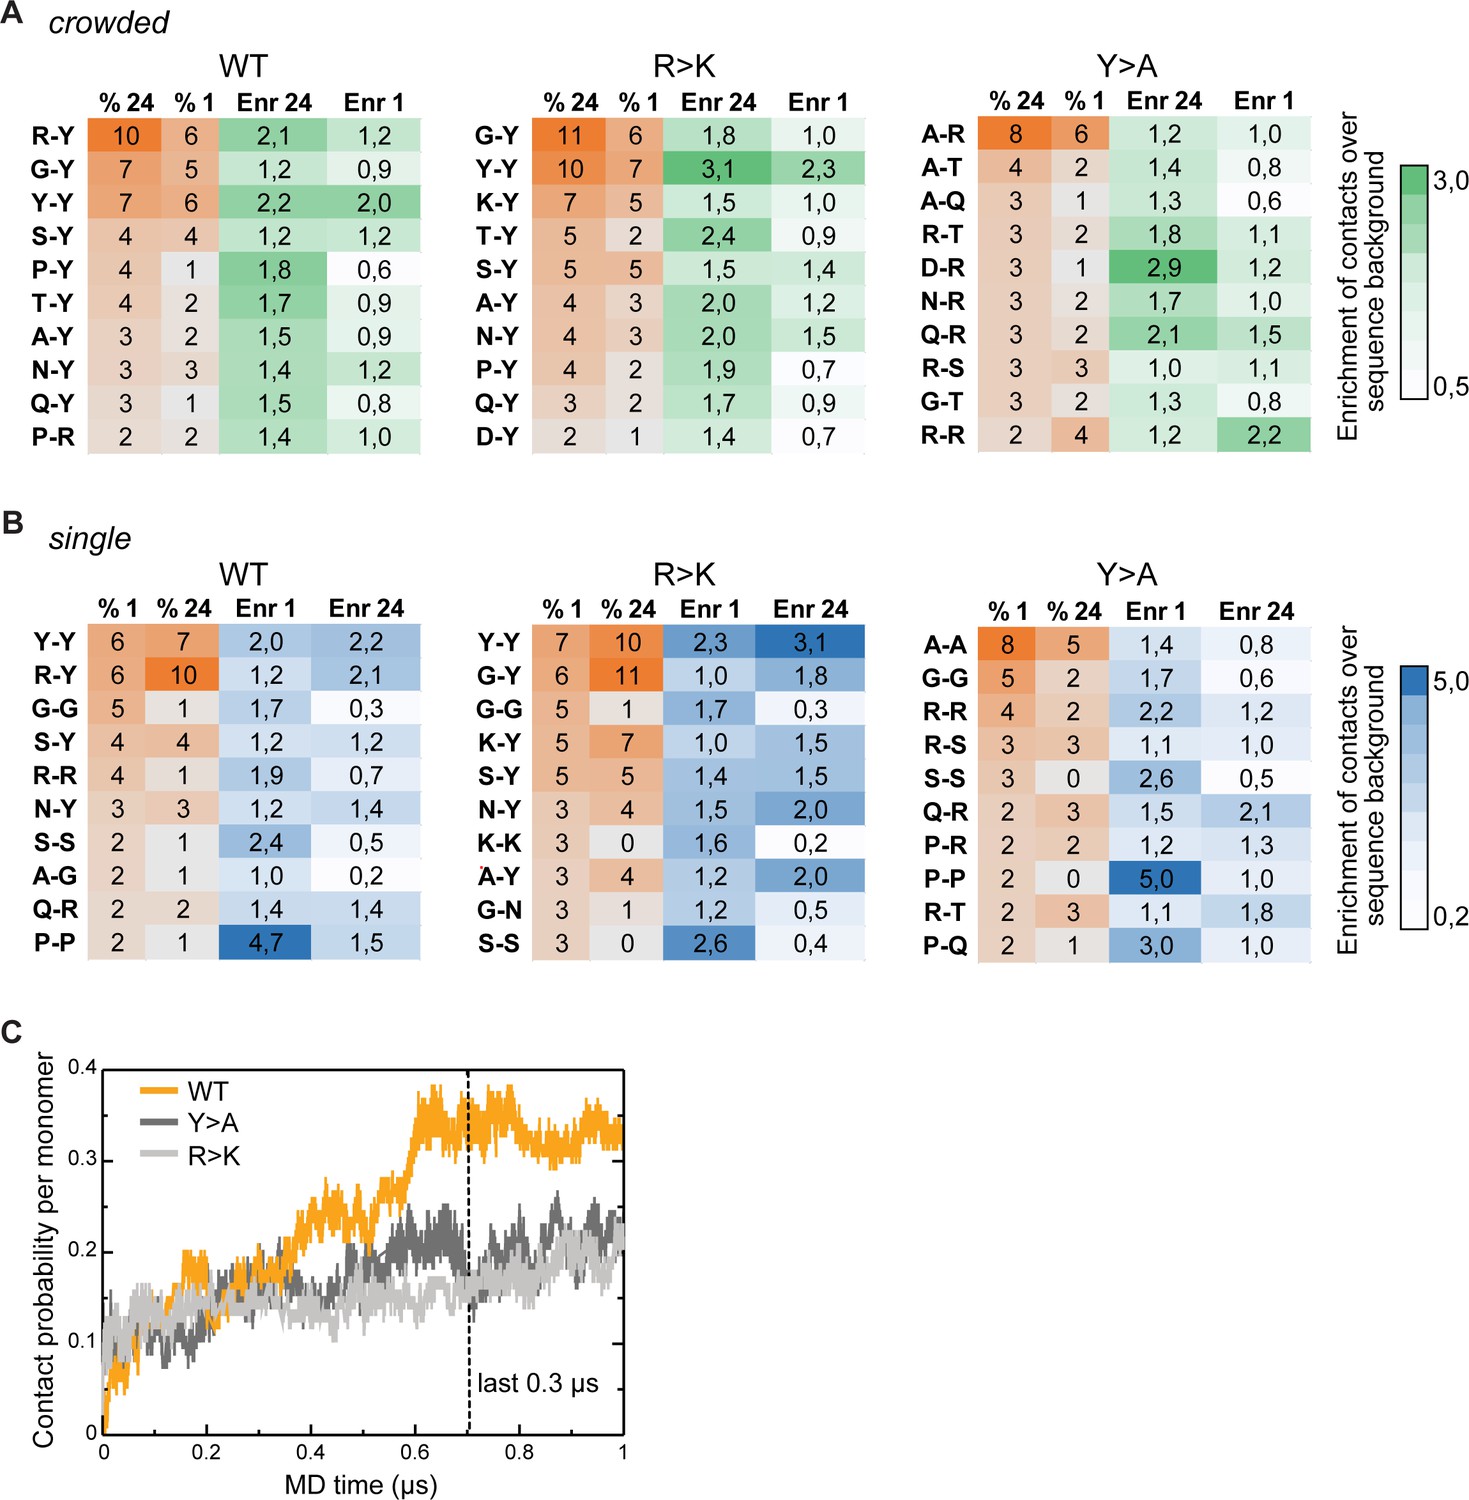
Inter- and intramolecular interactions of Lge11-80 variants in molecular dynamics (MD) simulations.
(A) Top 10 most frequent and enriched pairwise contacts between the residues in different protein molecules in multi-chain simulations (percentages, % 24; enrichment, Enr 24) as compared to single-chain simulations (% 1, Enr 1) for the WT (left panels), the R>K (middle panels), and the Y>A (right panels) Lge11-80 variants. The enrichments were calculated in comparison to the randomized sequence background according to the scale given on the right. Contact statistics were collected over the last 0.3 µs of MD simulations for two independent single-chain MD runs and all 24 proteins in multi-chain MD runs. (B) Top 10 most frequent and enriched pairwise contacts in the single-molecule context as compared to the crowded environment. Details as in A. (C) Time evolution of contact probability per monomer for the WT (orange line), Y>A (dark gray line), and R>K (light gray line) in multi-chain systems.
-
Figure 2—figure supplement 1—source data 1
Molecular dynamics (MD) data used in panels A, B, C.
- https://cdn.elifesciences.org/articles/80038/elife-80038-fig2-figsupp1-data1-v3.zip
Figure 3 with 1 supplement
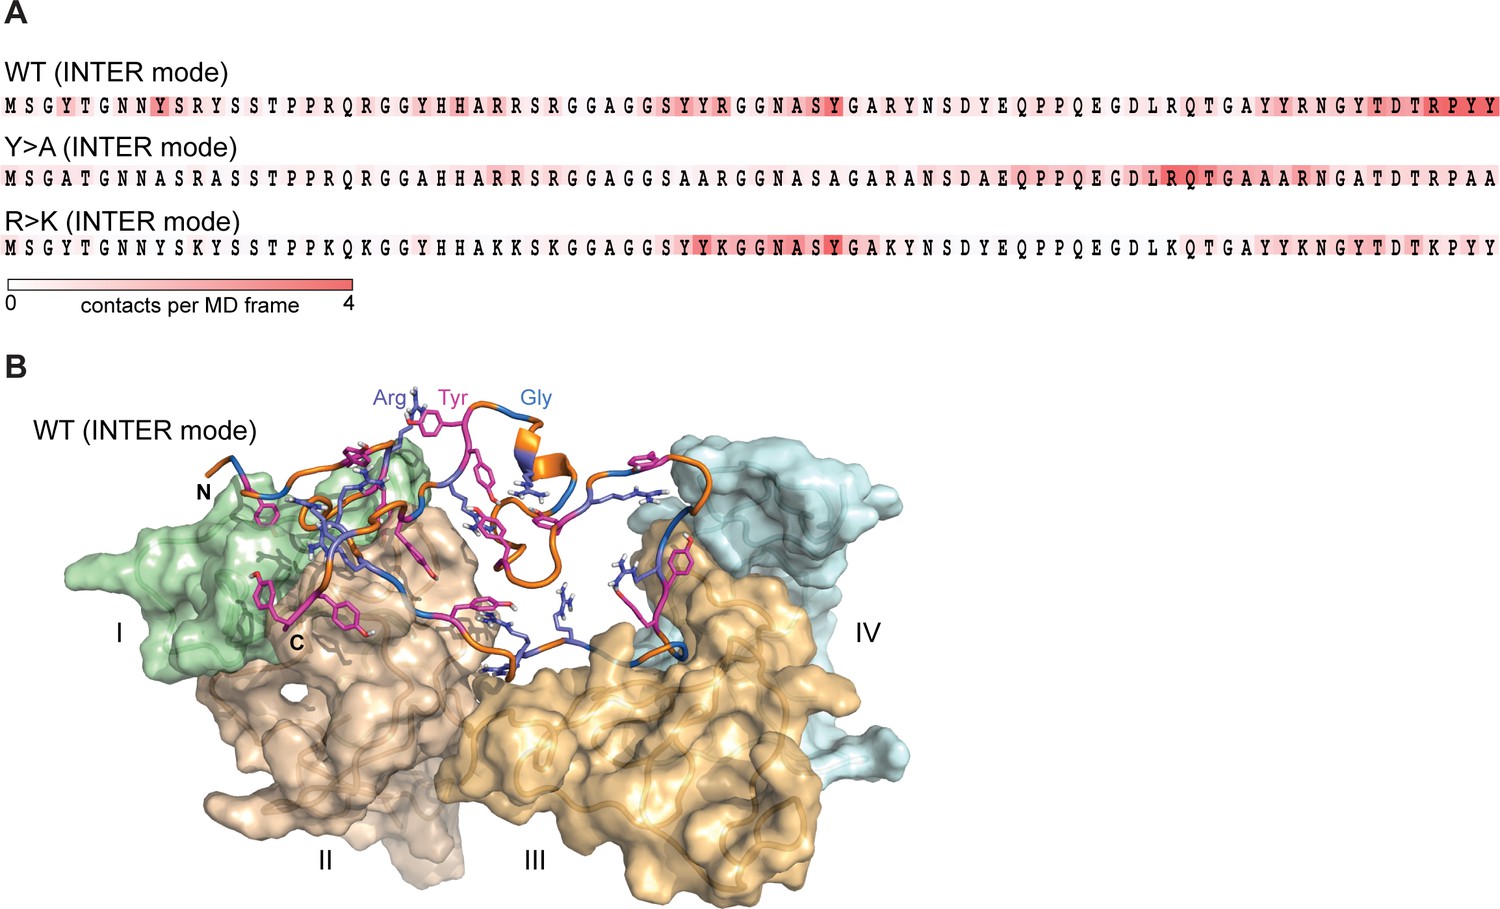
Lge11-80 variants exhibit a dynamic binding mode in multi-chain systems.
(A) Representative distributions of statistically defined interaction regions (‘stickers’) mapped onto the protein sequence. Protein sequences are colored according to the average contact statistics over the last 0.3 µs. Four interaction profiles of proteins having the number of partners corresponding to the average valency in the system (four partners for the Lge11-80 WT and two partners for both mutants) and displaying the highest mutual correlations were used for the determination of the representative mode. The representative modes in all three cases display the Pearson correlation coefficient R>0.6 with the interaction profiles obtained by averaging over all 24 copies in each system. (B) 3D model of the representative binding mode for Lge11-80 WT. An MD snapshot at 1 µs is given for a protein copy (shown in cartoon and sticks representation; the color scheme is the same as in Figure 2B) that is simultaneously interacting with four partners (shown in surface representation in pale cyan, pale green, wheat, and light orange, and indicated by Roman numerals).
-
Figure 3—source data 1
Contact statistics used in panel A.
- https://cdn.elifesciences.org/articles/80038/elife-80038-fig3-data1-v3.zip
Figure 3—figure supplement 1
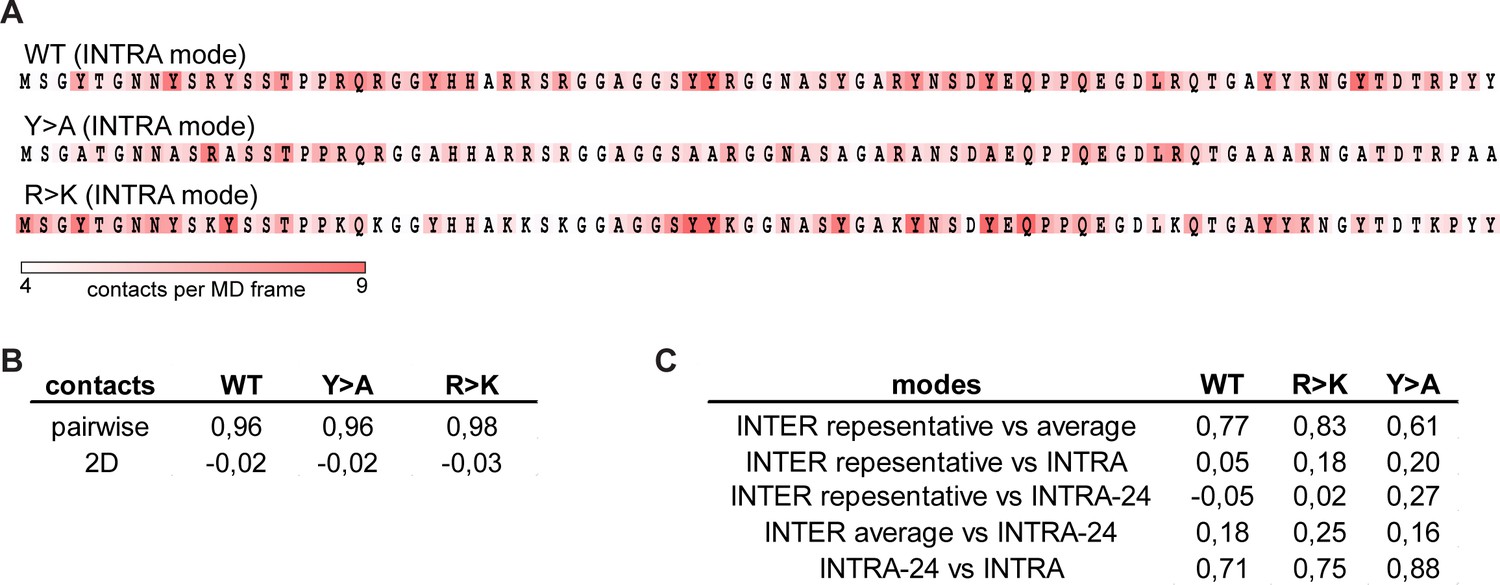
Correspondence between inter- and intramolecular interaction modes of Lge11-80 variants.
(A) Distributions of statistically defined interaction regions (‘stickers’) along the protein sequence in the single-chain systems. Protein sequences are colored according to the average contact statistics over the last 0.3 µs in two independent molecular dynamics (MD) runs. (B) Pearson correlation coefficients between pairwise contact statistics and 2D pairwise contacts maps obtained over the last 0.3 µs of single- and multi-chain simulations. (C) Pearson correlation coefficients calculated from the comparison of statistically defined interaction modes obtained over the last 0.3 µs of single- and multi-chain simulations as shown in panel A and Figure 3A.
-
Figure 3—figure supplement 1—source data 1
Contact statistics used in panel A and correlation data shown in panels B and C.
- https://cdn.elifesciences.org/articles/80038/elife-80038-fig3-figsupp1-data1-v3.zip
Figure 4 with 1 supplement
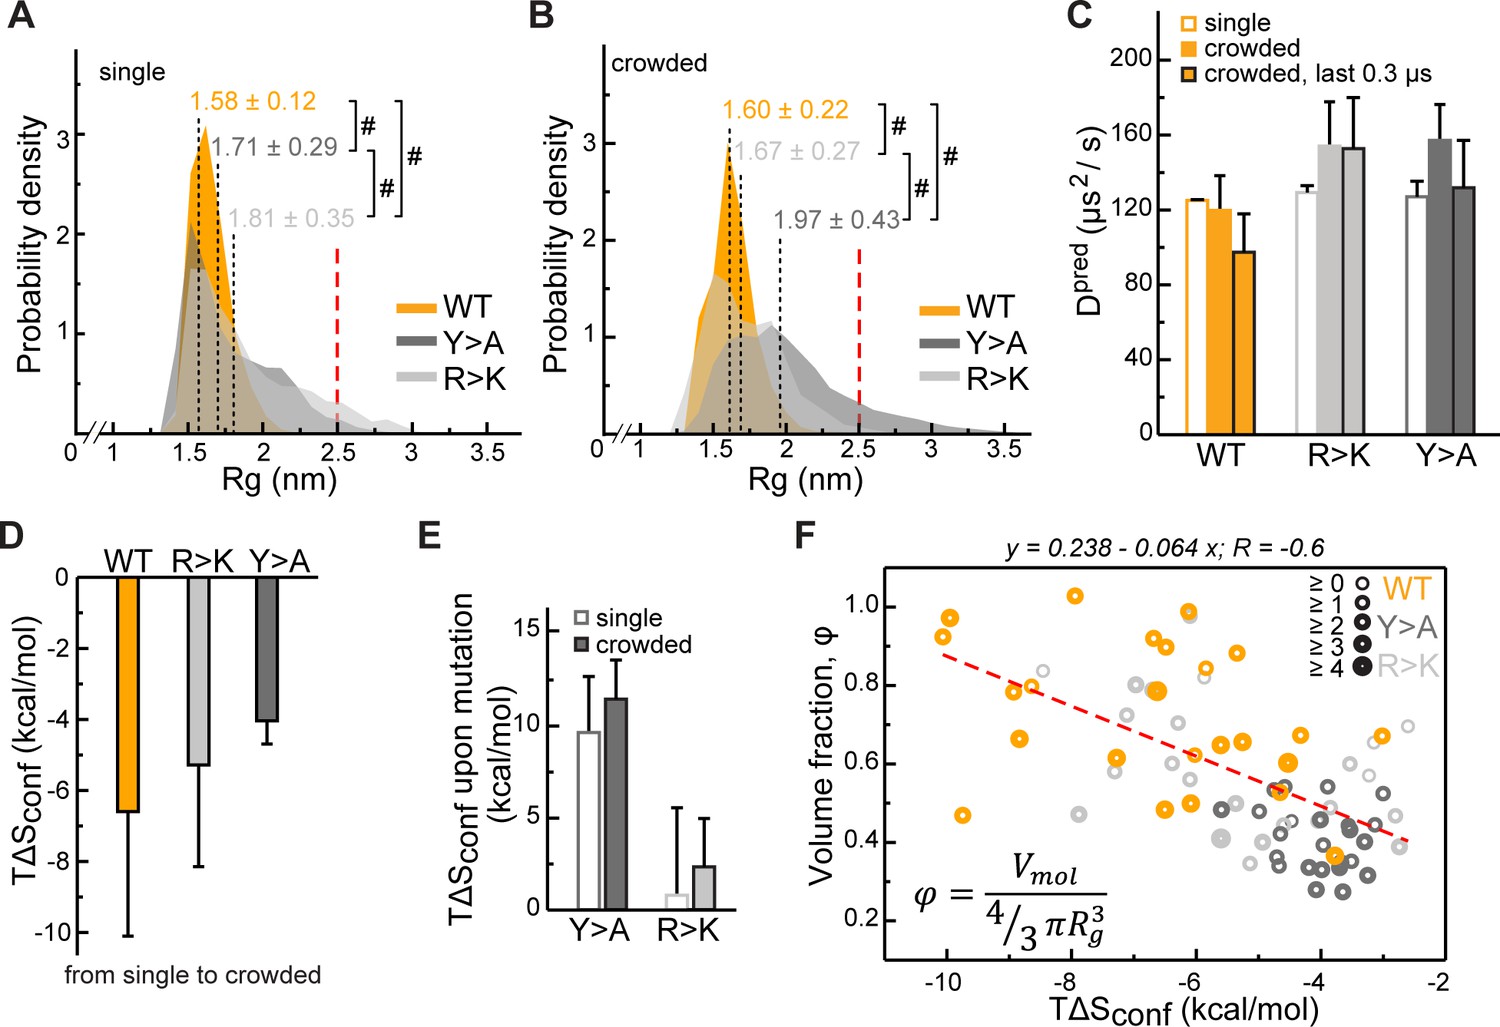
Impact of Lge11-80 sequence on its conformational behavior and dynamics.
Distributions of radii of gyration (Rg) for Lge11-80 variants in (A) single-chain and (B) multi-chain systems. The last 0.3 µs of molecular dynamics (MD) trajectories were used to collect Rg statistics for (A) two independent runs of the single-chain simulation and (B) all 24 protein copies in the multi-chain system. Average Rg values from MD simulation (<RgMD>) and the corresponding standard deviations over the last 0.3 µs are indicated. Theoretical Rgrc value for an 80-aa disordered protein chain (see Methods) is shown with a vertical red dashed line. #, p-value <2.2 10–16 according to Wilcoxon rank sum test with continuity correction. (C) MD-derived single-molecule translational diffusion coefficients of Lge11-80 variants. For single copies the values were averaged between the two independent MD runs. For 24 copy systems the value was averaged between all proteins. Error bars depict standard deviations. (D) Average changes in the configurational entropy (ΔSconf) of a protein molecule for the transition from the single-molecule context (dilute state) to the crowded environment. Entropy values are given in energy units (TΔSconf, T = 310 K) and were obtained using complete 1 µs MD trajectories. Averaging was done for entropy differences in all possible combinations between two independent runs of single molecules and 24 protein copies in the crowded system. (E) Average changes in TΔSconf upon different mutations (see Methods) in the single-molecule context and in the crowded environment. Averaging was done for entropy differences over all possible combinations (2×2 and 24×24, respectively). (F) Correlation between relative single-molecule configurational entropy changes (TΔSconf) and the corresponding average compactness (φ) values of all protein copies in the crowded system. The average valency of different protein copies is proportional to the thickness of the circles as given in the legend. Entropy values, average compactness, and average valency values were calculated over the complete 1 µs MD trajectories.
-
Figure 4—source data 1
Molecular dynamics (MD) data used in panels A, B, D, E, and F.
- https://cdn.elifesciences.org/articles/80038/elife-80038-fig4-data1-v3.zip
Figure 4—figure supplement 1
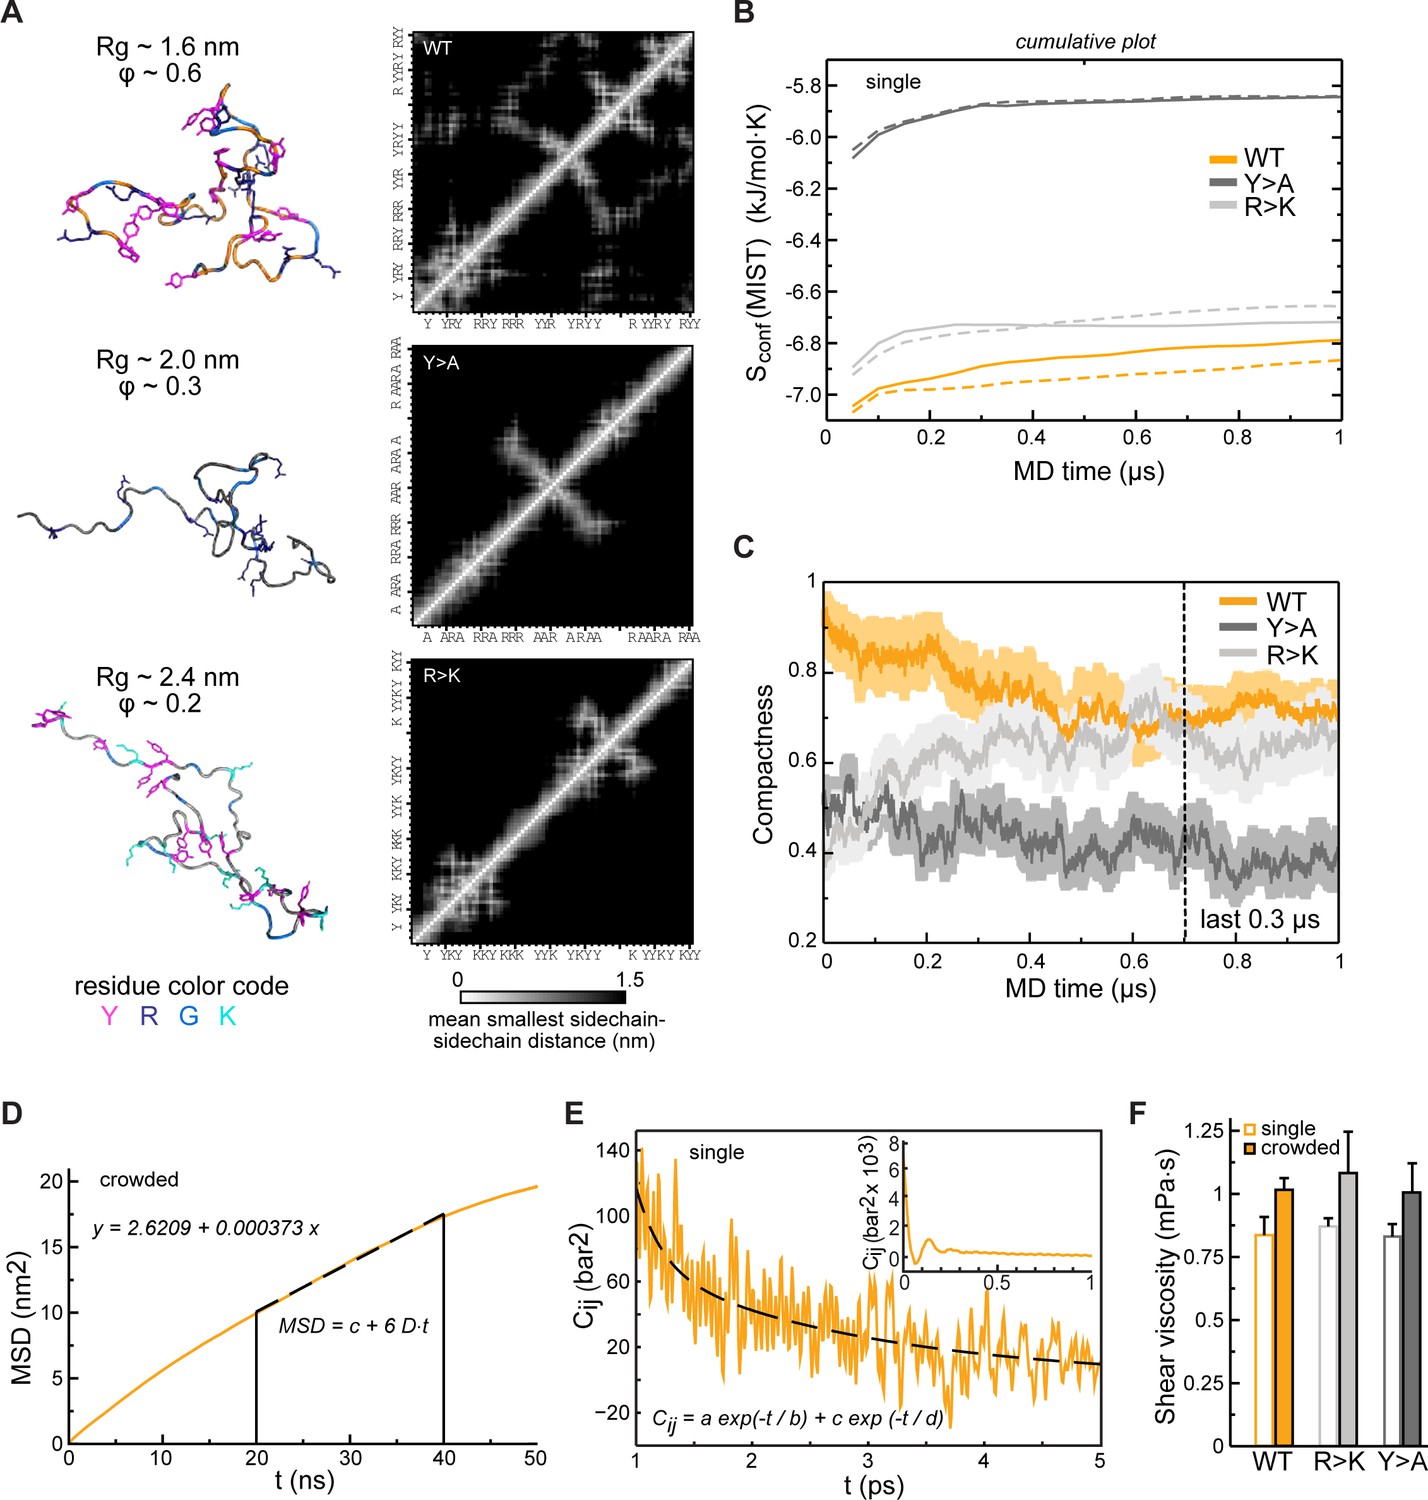
Conformational behavior and condensate rheology of Lge11-80 variants.
(A) Molecular dynamics (MD) conformations of WT (top panels), Y>A (middle panels), and R>K (bottom panels) variants illustrating different levels of compactness with the corresponding inter-residue distance matrices averaged over the 100 ns of a single-chain MD trajectory (contact maps; scale: white– 0 nm; black – 1.5 nm). Proteins are shown in cartoon and sticks representation, and colored in orange (WT), dark gray (Y>A), and gray (R>K) with tyrosine (Y), arginine (R), lysine (K), and glycine (G) residues colored according to the legend given below. (B) Convergence of protein configurational entropy (Sconf) in the single-molecule context. Data for two independent MD replicas are shown with solid and dashed lines, respectively. Cumulative plots were generated using MIST approximation (see Methods) and a 50 ns time step. (C) Time evolution of protein compactness for the WT (orange line), Y>A (dark gray line), and R>K (light gray line) in multi-chain systems. The average values over all 24 copies are shown together with the standard errors of the mean. (D) Exemplary fitting of an MSD curve in the linear range (20–40 ns) for a protein molecule in multi-chain simulations (shown for Lge11-80 WT). (E) Example of double-exponential fitting of the autocorrelation function for a pressure tensor element in the range of 1–5 ps. Inset: An initial part of the autocorrelation function for a pressure tensor element. Data from the analysis of NVT simulations of a single protein copy (shown for Lge11-80 WT). (F) Shear viscosity values obtained from the analysis of the pressure tensor autocorrelation functions (see Methods for details) in single-chain context (open bars) and multi-chain context (filled bars). The average values over different pressure tensor elements are shown together. Error bars depict standard deviations.
-
Figure 4—figure supplement 1—source data 1
Molecular dynamics (MD) data used in panels B, C, D, and E.
- https://cdn.elifesciences.org/articles/80038/elife-80038-fig4-figsupp1-data1-v3.zip
Figure 5 with 2 supplements
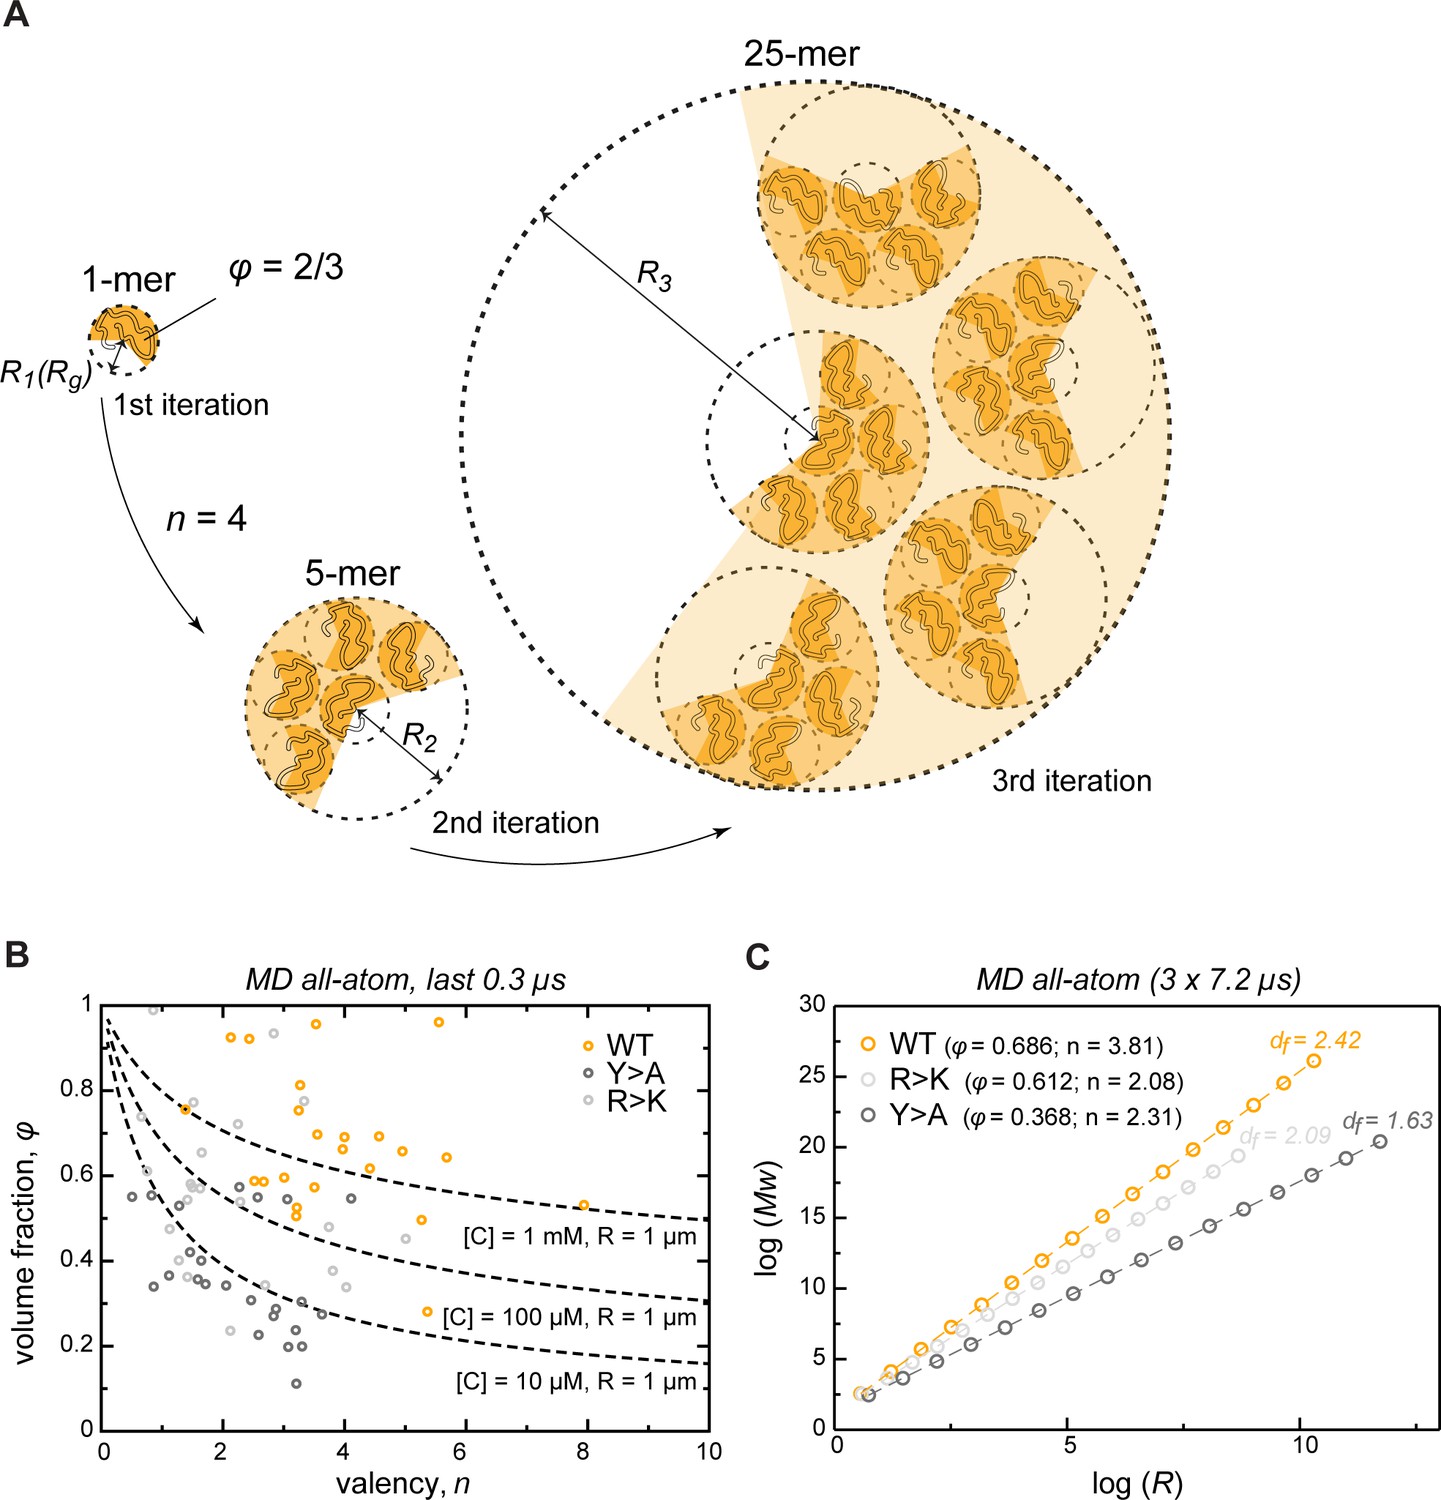
Describing condensate architecture via a fractal scaling model.
(A) Schematic representation of a scaling principle in condensate assembly. Interaction valency (n) and compactness (φ) of individual proteins determine the properties of protein clusters at different iterations (see Appendix 1 for the corresponding formalism). (B) The parameter space for φ and for a condensate with a fixed size (R = 1 µm) and concentration ([C]) described by the model (dashed lines). The φ and for each individual protein molecule in the crowded environment averaged over the last 0.3 µs of molecular dynamics (MD) trajectories are shown with open circles. (C) Power-law dependence between mass and size of protein clusters at different iterations of the model with the applied valency and compactness corresponding to their average values over the 24 simulated protein copies and the last 0.3 µs of MD trajectories (indicated in the legend). Dashed lines show linear regression for the log R vs. log Mw plot with the corresponding slope or fractal dimension (df) indicated above the lines.
-
Figure 5—source data 1
Numerical data used in panel B.
- https://cdn.elifesciences.org/articles/80038/elife-80038-fig5-data1-v3.zip
Figure 5—figure supplement 1
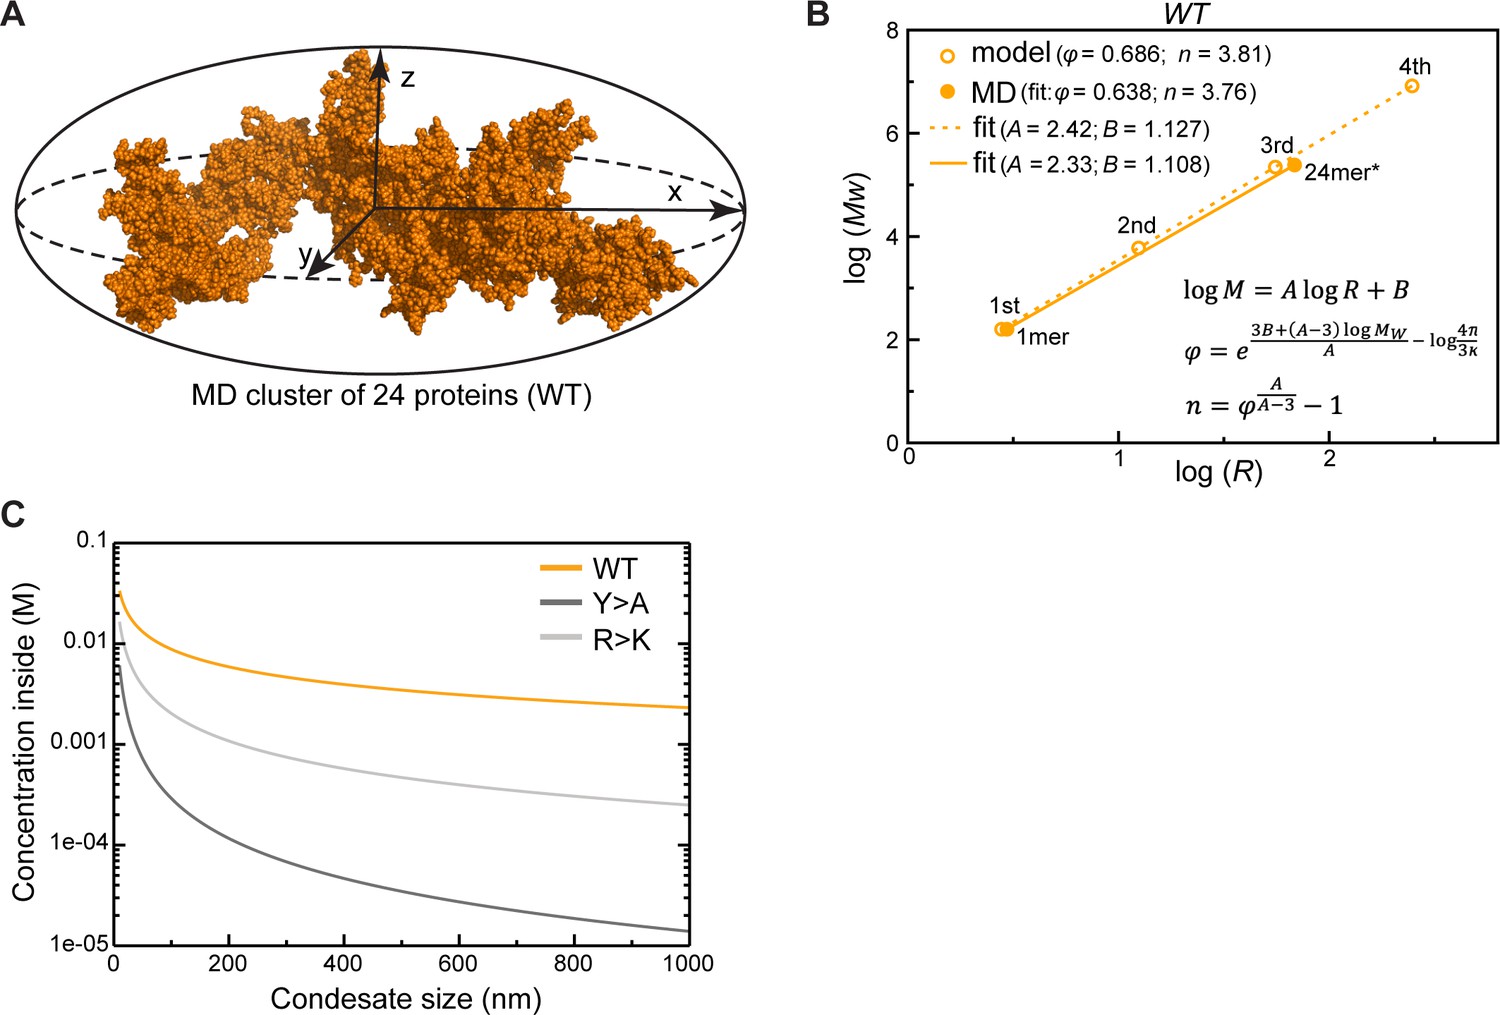
Protein clusters and condensate topology of Lge11-80.
(A) A 24-protein cluster for Lge11-80 WT fitted to an ellipsoid with radii corresponding to x, y, z components of Rg. Protein atoms are shown as spheres. (B) Power-law relationship between mass and size of WT protein clusters over four iterations of the fractal model (open circles) with the applied molecular dynamics (MD)-derived valency (n) and compactness (φ) together with the parameters describing the MD clusters of 1 or 24 proteins (filled circles); the corresponding linear regression trends are shown with dashed and solid lines, respectively, with slope (A) and intercept (B) values indicated in the legend. The φ and values used in the model and given in the legend correspond to the averages over 24 protein copies, while those corresponding to the MD clusters were directly extracted from the slopes and the intercepts of the linear fits performed according to the equations given in the plot (Equations 9, 12, 13 in Appendix 1). All averaging was done over the last 0.3 µs of the multi-chain MD trajectories. The size of the 24-protein MD cluster was estimated as the radius of the sphere with an equivalent apparent volume as the gyration ellipsoid. (C) Dependence of protein concentration inside a condensate on its apparent size as predicted by the fractal model.
Figure 5—figure supplement 2

Parameters used in the fractal model for different Lge11-80 variants (related to Figures 5 and 6).
Radius of gyration (Rg), valency (n), and compactness (φ) averaged over the last 0.3 µs of molecular dynamics (MD) trajectories for all 24 copies. Slope (A) and intercept (B) of the linear regression for the log R vs. log Mw plot are derived from the model (Equations 10, 11 in Appendix 1).
-
Figure 5—figure supplement 2—source data 1
Numerical data shown in the figure (fractal model parameters).
- https://cdn.elifesciences.org/articles/80038/elife-80038-fig5-figsupp2-data1-v3.xlsx
Figure 6 with 1 supplement
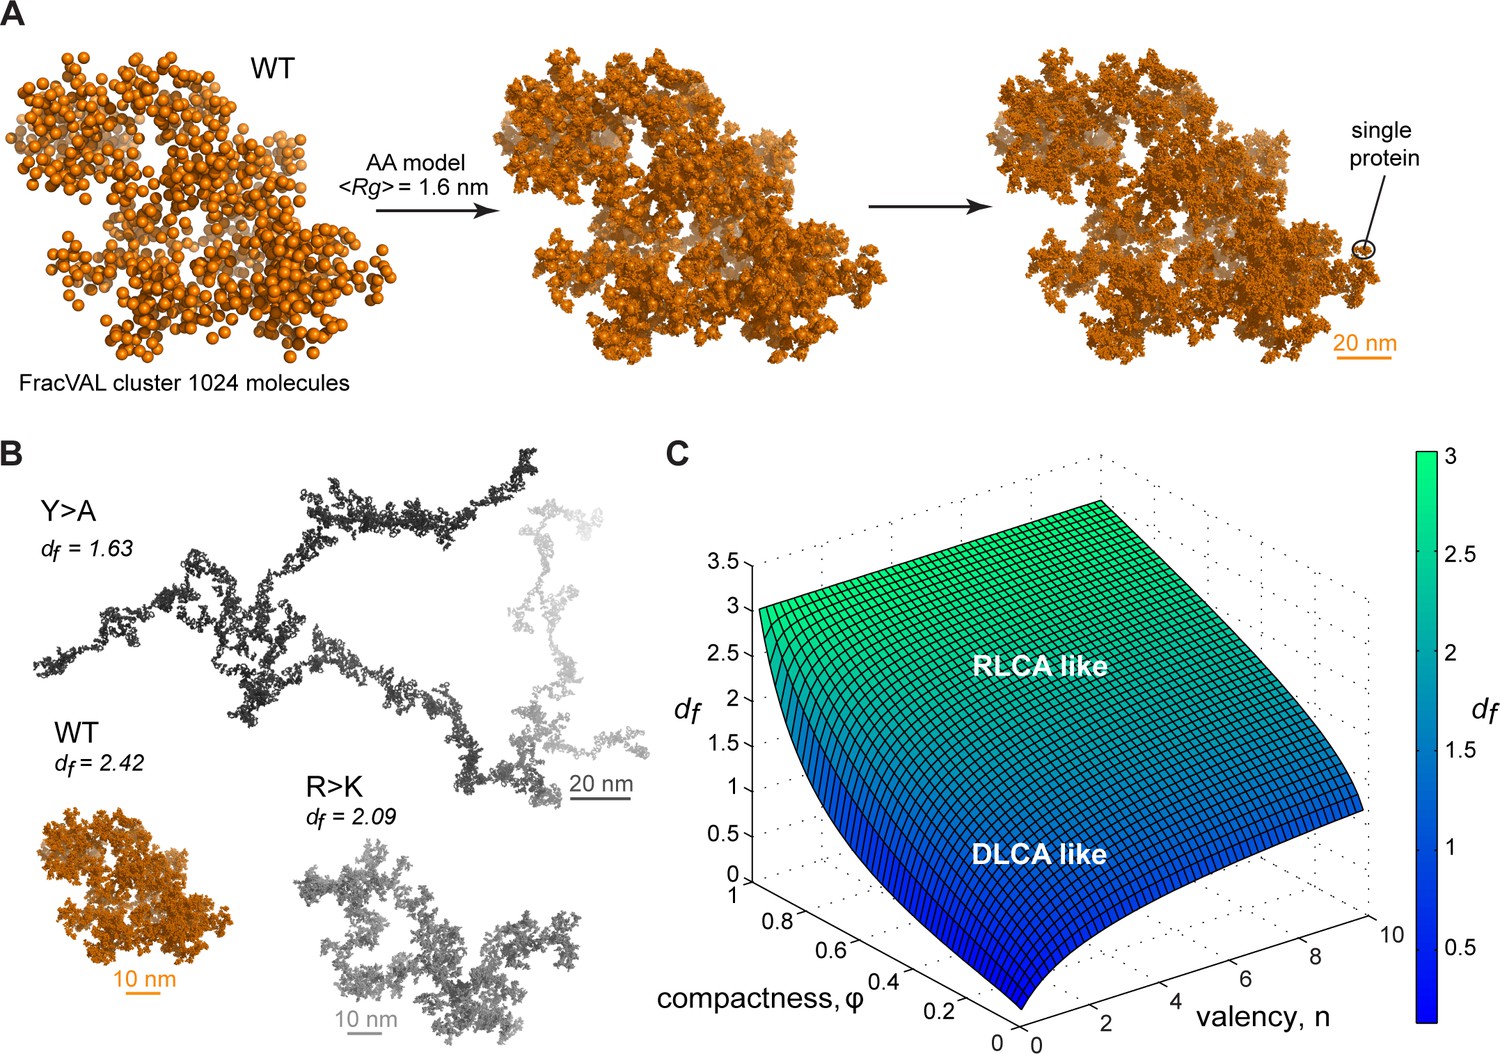
Reconstruction of the large-scale condensate architecture with atomistic resolution.
(A) Transformation of a coarse-grained 1024 particle cluster obtained by FracVAL algorithm to an all-atom representation. The cluster was reconstructed using the fractal dimension df and the averaged Rg value derived from multi-chain simulations of Lge11-80 WT. (B) Representative 1024-protein clusters for Lge11-80 variants at all-atom resolution (see Videos 4–6 to zoom in). (C) The non-linear dependence of the fractal dimension df on φ and as given by the model formalism (see Equation 10, Appendix 1). The surface is colored according to the corresponding df values (see the scale bar).
-
Figure 6—source data 1
Numerical data used in panel C.
- https://cdn.elifesciences.org/articles/80038/elife-80038-fig6-data1-v3.zip
Figure 6—figure supplement 1

Partitioning of dextran of different sizes into condensates formed by Lge11-80 WT.
(A) Lge11-80 condensates are permeable to dextran of different sizes (partition ratio ≥1). Mean and st. dev. are indicated. n=100 condensates. (B) Condensates were incubated with TRITC-labeled dextran (final dextran concentration 0.05 mg/ml) for 15 min at 20°C and imaged by DIC and fluorescence microscopy. Scale bar, 10 µm.
-
Figure 6—figure supplement 1—source data 1
Dextran partitioning raw data used in panels A and B.
- https://cdn.elifesciences.org/articles/80038/elife-80038-fig6-figsupp1-data1-v3.zip
Videos
Video 1
Fusion of Lge11-80 WT condensates in solution.
Protein concentration 1 µM. Scale bar, 5 µm.
Video 2
Fusion of Lge11-80 R>K condensates in solution.
Protein concentration 10 µM. Scale bar, 5 µm.
Video 3
Lge11-80 polypeptides self-associate in the crowed environment.
All-atom, explicit-solvent molecular dynamics (MD) simulation with 24 copies, corresponding to the concentration of ~7 mM, of WT Lge11-80. The movie shows the complete 1 µs of the simulated trajectory with a 1 ns step. Proteins are shown in sphere representation. The 24 molecules are highlighted in orange, while the periodic images of the central simulation box are shown in gray. Note that the periodic images exhibit identical movements as the molecules in the central box. Scale bar corresponds to 5 nm.
Video 4
Zoom-in of the internal organization of the WT Lge11-80 condensate at all-atom resolution.
1024-particle cluster was obtained by the FracVAL algorithm and transformed to an all-atom representation (see Methods). Protein atoms are shown as spheres. Video shows ×10 magnification.
Video 5
Zoom-in of the internal organization of the R>K Lge11-80 condensate at all-atom resolution.
1024-particle cluster was obtained by the FracVAL algorithm and transformed to an all-atom representation (see Methods). Protein atoms are shown as spheres. Video shows ×15 magnification.
Video 6
Zoom-in of the internal organization of the Y>A Lge11-80 condensate at all-atom resolution.
1024-particle cluster was obtained by the FracVAL algorithm and transformed to an all-atom representation (see Methods). Protein atoms are shown as spheres. Video shows ×30 magnification.
Tables
Table 1
Details of simulated systems including composition, effective molar and mass protein concentration, size of the simulated cubic box, simulation time, and the number of replicas.
| Name | Protein | Water | Na+ | Cl- | [Protein], mM | [Protein], g/l | Box size, nm | MD time, µs | Replicas |
|---|---|---|---|---|---|---|---|---|---|
| Lge1 1–80 WT | 1 | 23674 | 44 | 50 | 2.3 | 20.7 | 9.0 | 1 | 2 |
| Lge1 1–80 Y>A | 1 | 23742 | 44 | 50 | 2.3 | 17.7 | 9.0 | 1 | 2 |
| Lge1 1–80 R>K | 1 | 23673 | 44 | 50 | 2.3 | 20.0 | 9.0 | 1 | 2 |
| Lge1 1–80 WT 24 copies | 24 | 182056 | 351 | 495 | 6.9 | 62.5 | 18.0 | 1 | 1 |
| Lge1 1–80 Y>A 24 copies | 24 | 183407 | 351 | 495 | 6.9 | 45.0 | 18.0 | 1 | 1 |
| Lge1 1–80 R>K 24 copies | 24 | 217857 | 413 | 557 | 5.8 | 50.8 | 19.0 | 1 | 1 |
Key resources table
| Reagent type (species) or resource | Designation | Source or reference | Identifiers | Additional information |
|---|---|---|---|---|
| Gene (Saccharomyces cerevisiae) | LGE1 | SGD databank | YPL055C | Mutants used in this work were described in Gallego et al., 2020 |
| Strain, strain background (Escherichia coli) | BL21 CodonPlus (DE3)-RIL | Stratagene | #200131 | Chemically competent cells |
| Other | (TRITC)-labeled dextran, Mw 155 KDa | Sigma-Aldrich | #T1287 | Final concentration 0.05 mg/ml |
| Other | (TRITC)-labeled dextran, Mw 65–85 KDa | Sigma-Aldrich | #T1162 | Final concentration 0.05 mg/ml |
| Other | (TRITC)-labeled dextran, Mw 2000 KDa | Thermo Fisher | #D7139 | Final concentration 0.05 mg/ml |
| Other | Dylight 488 NHS-Ester | Thermo Fisher | #46402 | Methods in this paper |
| Software, algorithm | ImageJ 1.53t | https://imagej.nih.gov/ij | Version 1.53t | |
| Software, algorithm | GraphPad Prism 7.0e | https://www.graphpad.com | Version 7.0e |
Additional files
-
Supplementary file 1
Technical summary on molecular dynamics (MD) results.
- https://cdn.elifesciences.org/articles/80038/elife-80038-supp1-v3.xlsx
-
Supplementary file 2
Diffusion summary.
- https://cdn.elifesciences.org/articles/80038/elife-80038-supp2-v3.xlsx
-
MDAR checklist
- https://cdn.elifesciences.org/articles/80038/elife-80038-mdarchecklist1-v3.pdf
Download links
A two-part list of links to download the article, or parts of the article, in various formats.
Downloads (link to download the article as PDF)
Open citations (links to open the citations from this article in various online reference manager services)
Cite this article (links to download the citations from this article in formats compatible with various reference manager tools)
Protein compactness and interaction valency define the architecture of a biomolecular condensate across scales
eLife 12:e80038.
https://doi.org/10.7554/eLife.80038


