Cellular composition and circuit organization of the locus coeruleus of adult mice
- Neuroscience Graduate Program, Baylor College of Medicine, United States
- Department of Neuroscience, Baylor College of Medicine, United States
- Jan and Dan Duncan Neurological Research Institute at Texas Children’s Hospital, United States
- University of Houston, United States
- Department of Electrical and Computer Engineering, University of Houston, United States
- Center for NeuroEngineering and Cognitive Science, University of Houston, United States
- Department of Ophthalmology, Baylor College of Medicine, United States
Figures
Figure 1
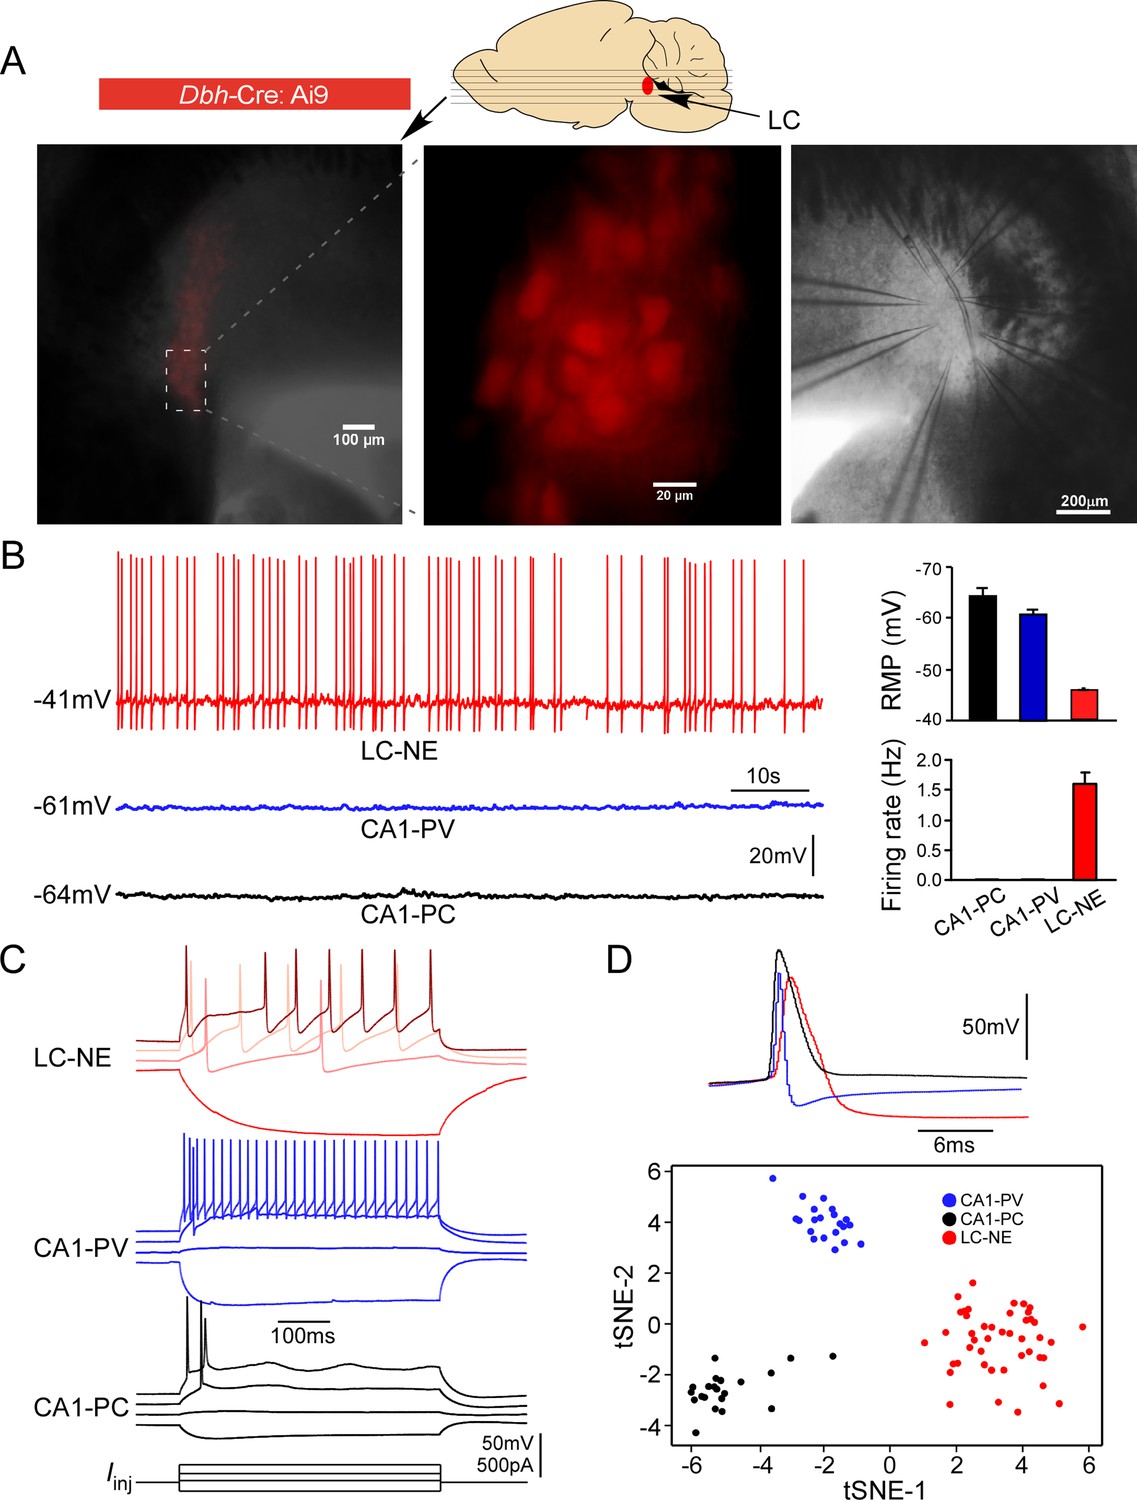
Electrophysiological properties of locus coeruleus/norepinephrine (LC/NE) neurons.
(A) Horizontal slices prepared from Dbh-cre:Ai9 mice for multicell patch-clamp recordings of LC/NE neurons. (B) Spontaneous firing of LC-NE neurons at rest and their more depolarized resting membrane potential (RMP) compared to hippocampal CA1 pyramidal cells (PC) and parvalbumin-expressing interneurons (PV). The representative trace for each cell type at rest is shown on the left. Right: average RMP (top, n=20 for CA1-PC and CA1-PV, n=289 for LC/NE, CA1-PC vs. LC/NE, p<0.0001; CA1-PV vs. LC/NE, p<0.0001) and average firing frequency (bottom, n=20 for CA1-PC and for CA1-PV; n=30 for LC/NE; CA1-PC vs. LC/NE, p<0.001; CA1-PV vs. LC/NE, p<0.001) of LC/NE neurons compared to hippocampal CA1-PC and CA-PV neurons. (C) The membrane potential response to the step stimulation protocol (10 pA incremental) of LC/NE neurons compared to CA1-PC and CA1-PV neurons. Scale bar, vertical 50 mV for the potential, 500 pA for the injected currents. (D) Individual action potential (AP) of three types of neurons (top) and tSNE of their intrinsic electrophysiology properties (bottom).
Figure 2 with 4 supplements
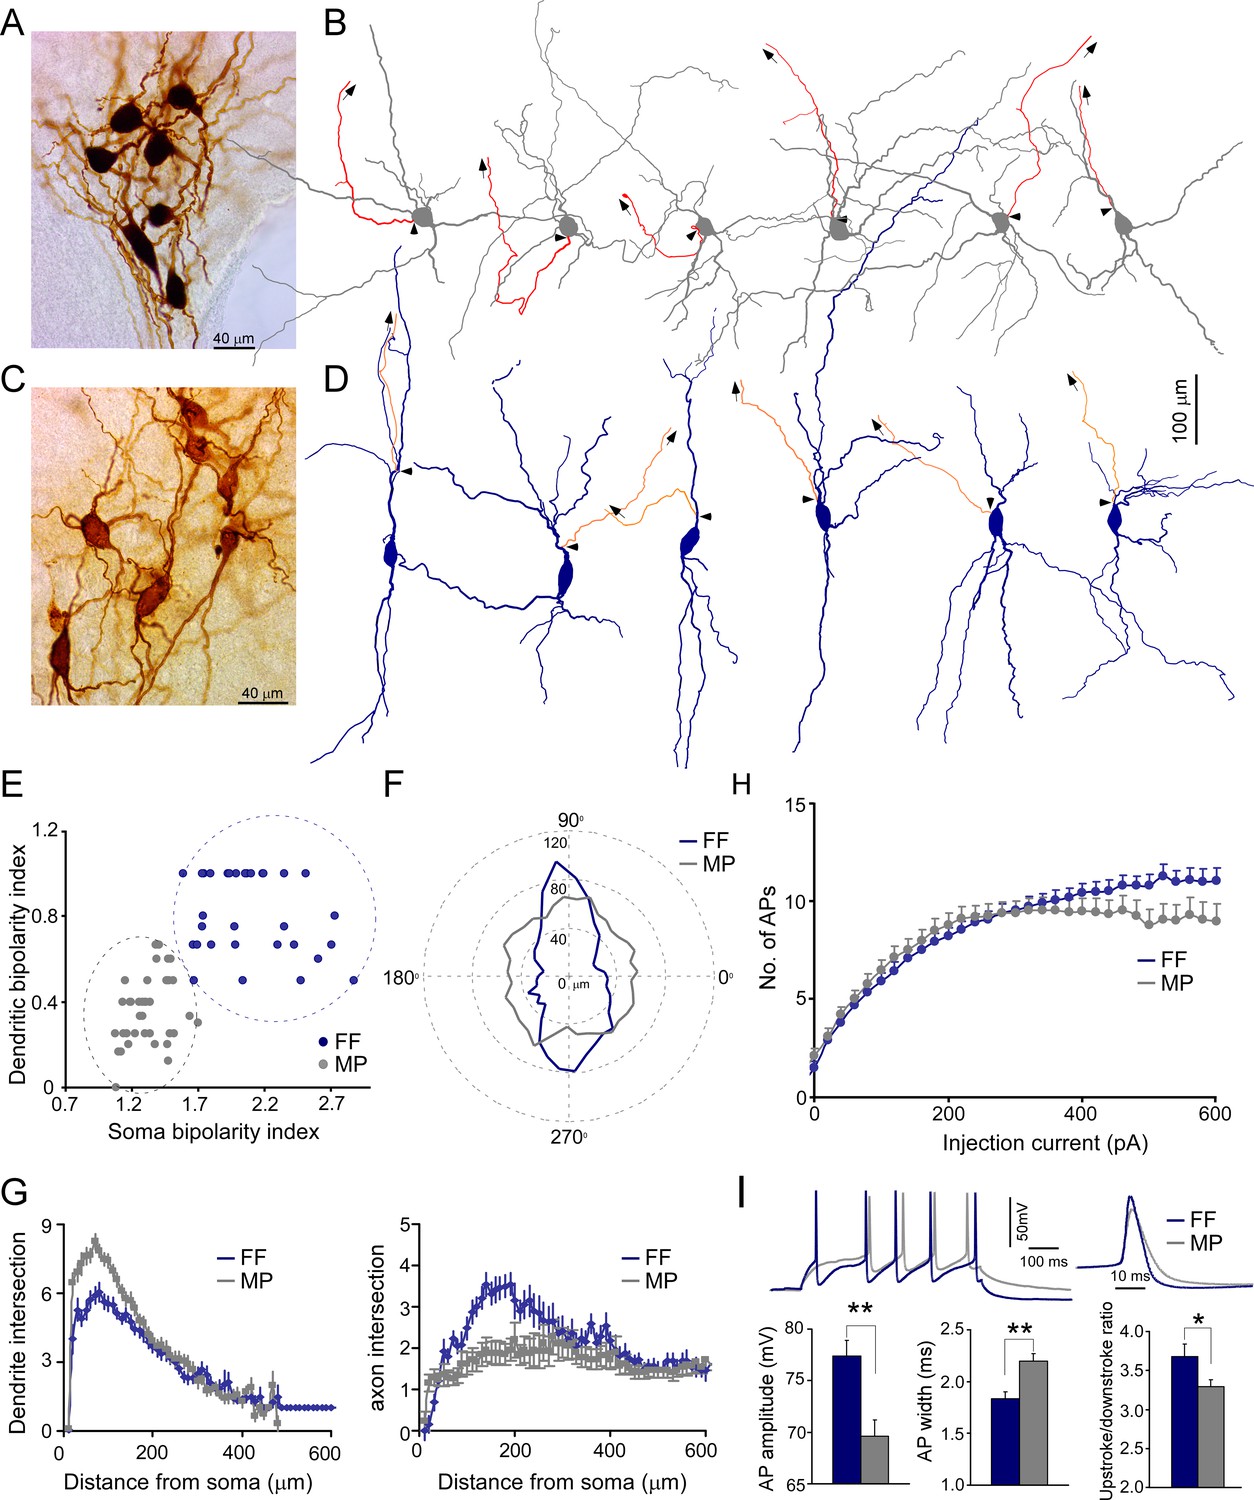
Two morphological cell types of locus coeruleus/norepinephrine (LC/NE) neurons.
(A) A micrograph shows seven morphologically recovered LC/NE neurons, most of which are multipolar cells (MP). (B) Morphological reconstruction of six MPs. The dendrite and soma in gray and the axon in red. The axon is shown only partially, and the arrows indicate the trajectory of the major axonal branch. The triangles indicate the origin of the axon. (C) A micrograph shows seven morphologically recovered LC/NE neurons, most of which are fusiform cells (FF). (D) Morphological reconstruction of six FFs. The dendrite and soma in dark blue, and the axon in orange. The axon is shown only partially, and the arrows indicate the trajectory of the major axonal branch. The triangles indicate the origin of the axon. (E) Plotting the bipolarity index of the soma (x-axis) against the bipolarity index of dendritic arborization (y-axis; n=31 for FF and n=39 for MP). (F) The dendritic length as a function of dendritic orientation of FF and MP. Each radius represents the dendritic length from the soma center at a certain degree. Each morphology is rotated to ensure its major soma axis aligns with the x-axis (90–270°) in the 2D space. Zero in the plot indicates the center of the soma (n=31 for FF, n=39 for MP). (G) Left: Sholl analysis of dendritic arbors of MP and FF (counting the number of dendritic intersections that occur at fixed distances from the soma in concentric circles). FF vs. MP: F(1) = 132.9; p<0.0001 with two-way ANOVA, n=32 for FF and n=36 for MP. Right: Sholl analysis of axonal arbors of MP and FF. FF vs. MP: F(1) = 87.3; p<0.0001, n=25 for FF and n=31 for MP. (H) The membrane responses (the number of action potentials (APs) evoked) to increasing current step injections in FF and MP (FF: n=39; MP, n=37; F(1) = 29.5; *p<0.001 with two-way ANOVA). (I) Electrophysiological differences between cell types. Top: two representative firing traces in response to suprathreshold depolarizing current injections into MP and FF (left), and individual AP from MP and FF (right). Bottom: average AP amplitude (left; FF, n=19; MP, n=41; **p<0.01), average AP half-width (middle; FF, n=19; MP, n=41; **p<0.01), and upstroke/downstroke ratio of AP (right; FF, n=19; MP, n=41; *p<0.05). Also see Figure 2—figure supplements 1–4 and Figure 2—source data 1.
-
Figure 2—source data 1
Electrophysiological features of FF and MP.
- https://cdn.elifesciences.org/articles/80100/elife-80100-fig2-data1-v2.docx
Figure 2—figure supplement 1
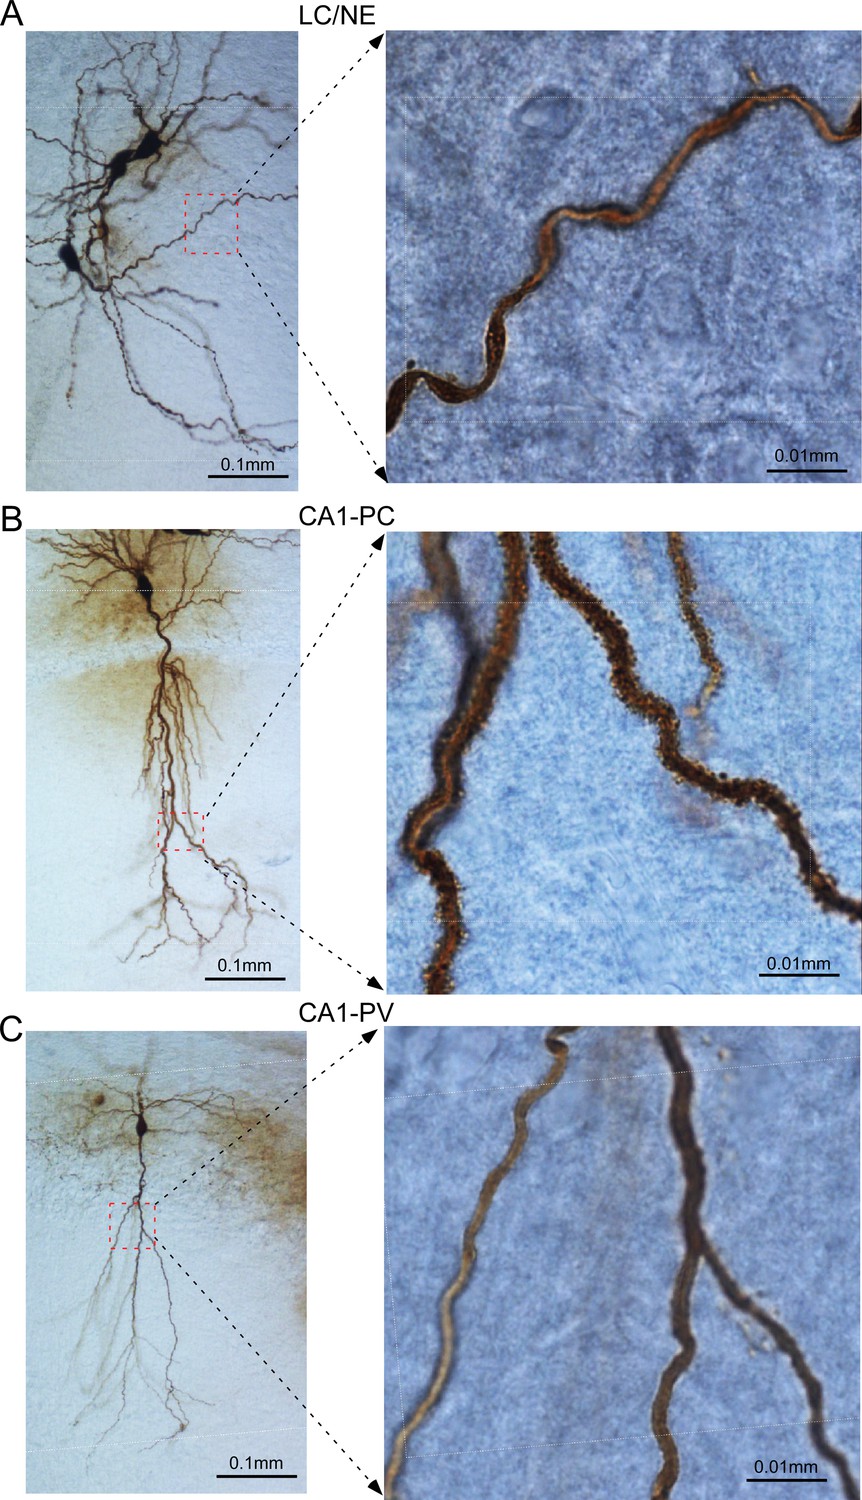
Dendrites of locus coeruleus/norepinephrine (LC/NE) neurons compared to CA1 hippocampal pyramidal neurons (CA1-PCs) and PV-expressing interneuron (CA1-PV).
(A) Left: a photomicrograph depicting the morphological recovery of three LC/NE neurons; Right: high-magnification view of a dendritic section (squared on the left with red dash line) of one of the same LC/NE neurons. (B) Left: a photomicrograph depicting the morphological recovery of a CA1-PC; Right: high-magnification view of dendritic sections (squared on the left with red dash line) of the same CA1-PC. (C) Left: a photomicrograph depicting the morphological recovery of a CA1-PV; right: high-magnification view of dendritic sections (squared on the left with red dash line) of the same CA1-PV.
Figure 2—figure supplement 2
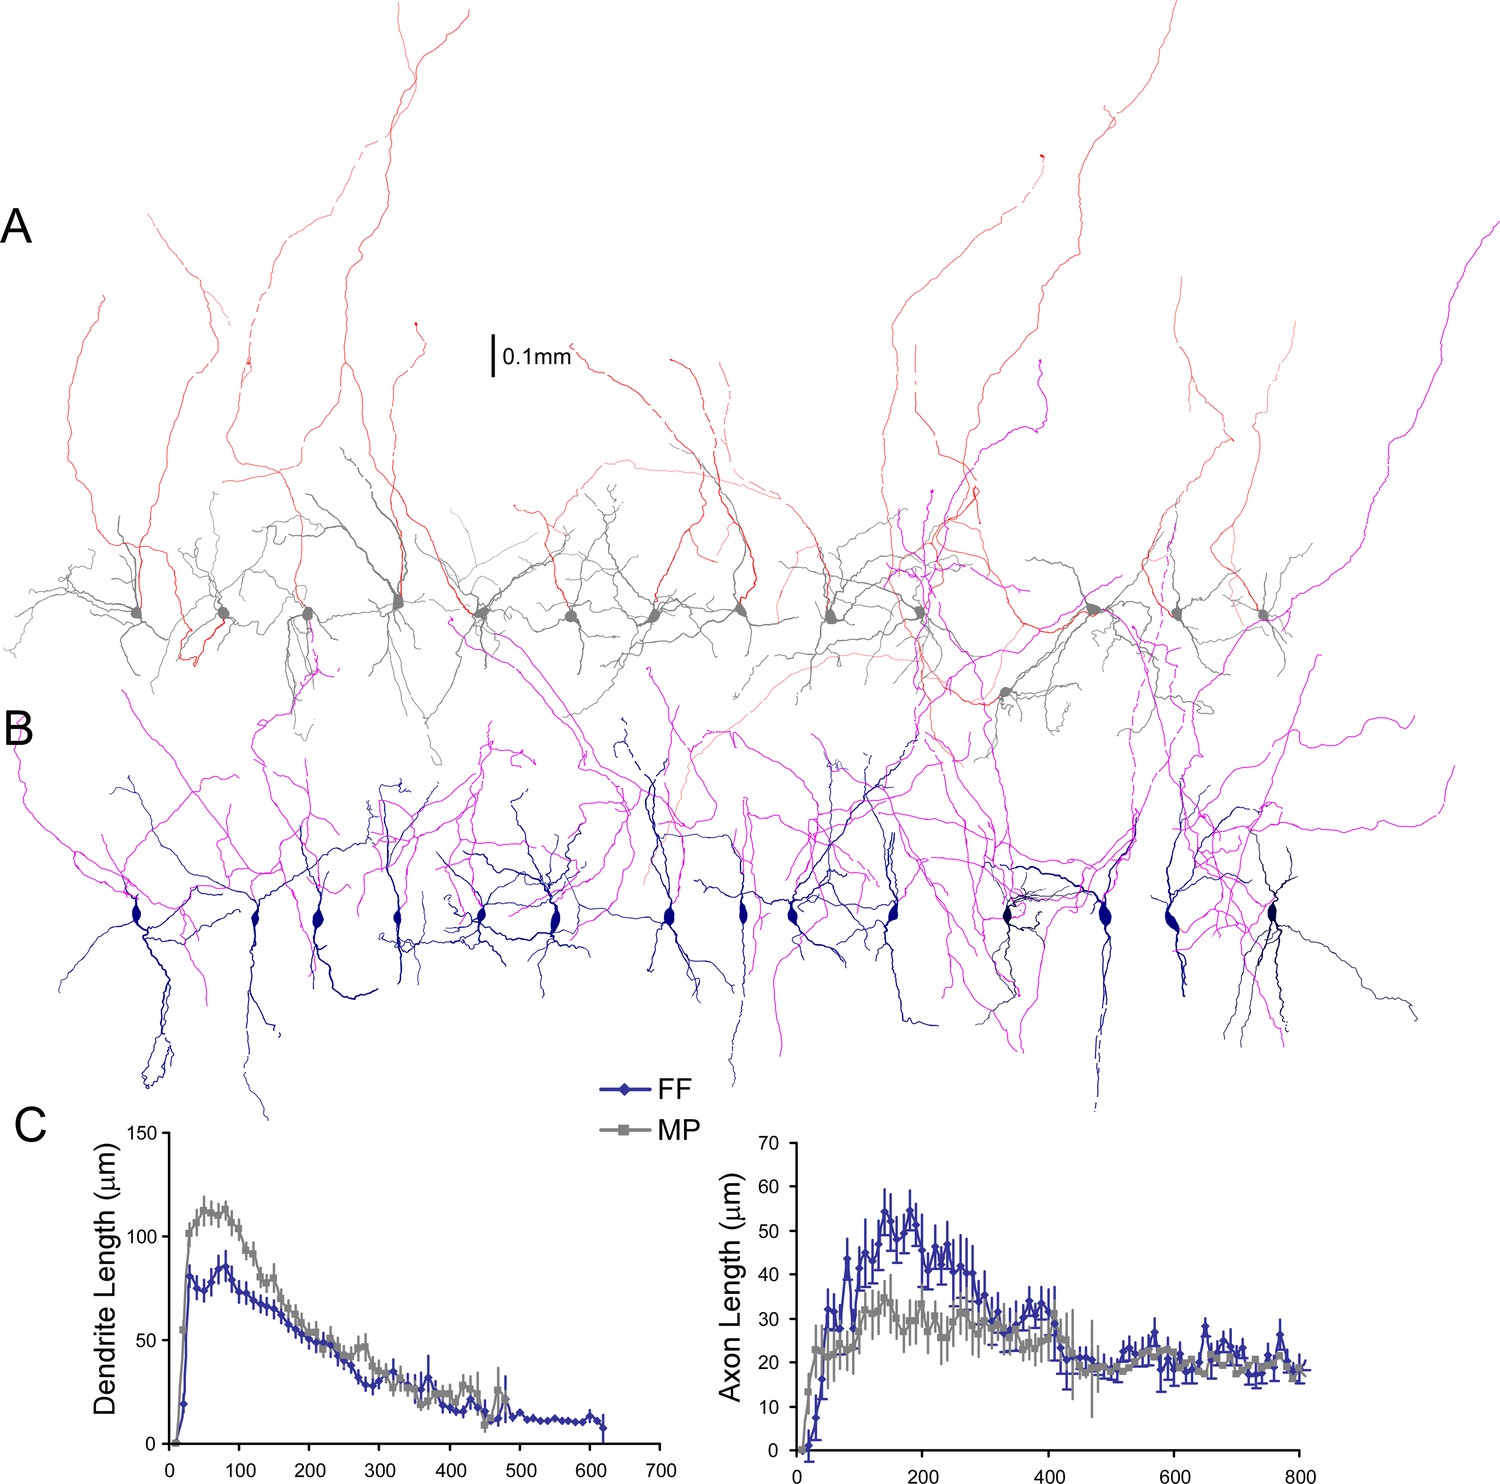
Comparison of axonal and dendritic arbors of two locus coeruleus/norepinephrine (LC/NE) morphological cell types.
(A) Morphology of multipolar cells (MPs) including all axonal trees remained in slices. The dendrite and soma are shown in gray and the axon is shown in red. (B) Morphology of fusiform cells (FFs) including all axonal trees remained in slices. The dendrite and soma are shown in dark blue, and the axon is shown in purple. (C) Sholl analysis of length of both axonal and dendritic arbors of MP and FF. Left: dendrite length (FF vs. MP: F(1)=130.6; p<0.0001 with two-way ANOVA, n=32 for FF and n=36 for MP). Right: axonal length (FF vs. MP: F(1)=47.3; p<0.0001 with two-way ANOVA, n=25 for FF and n=31 for MP).
Figure 2—figure supplement 3
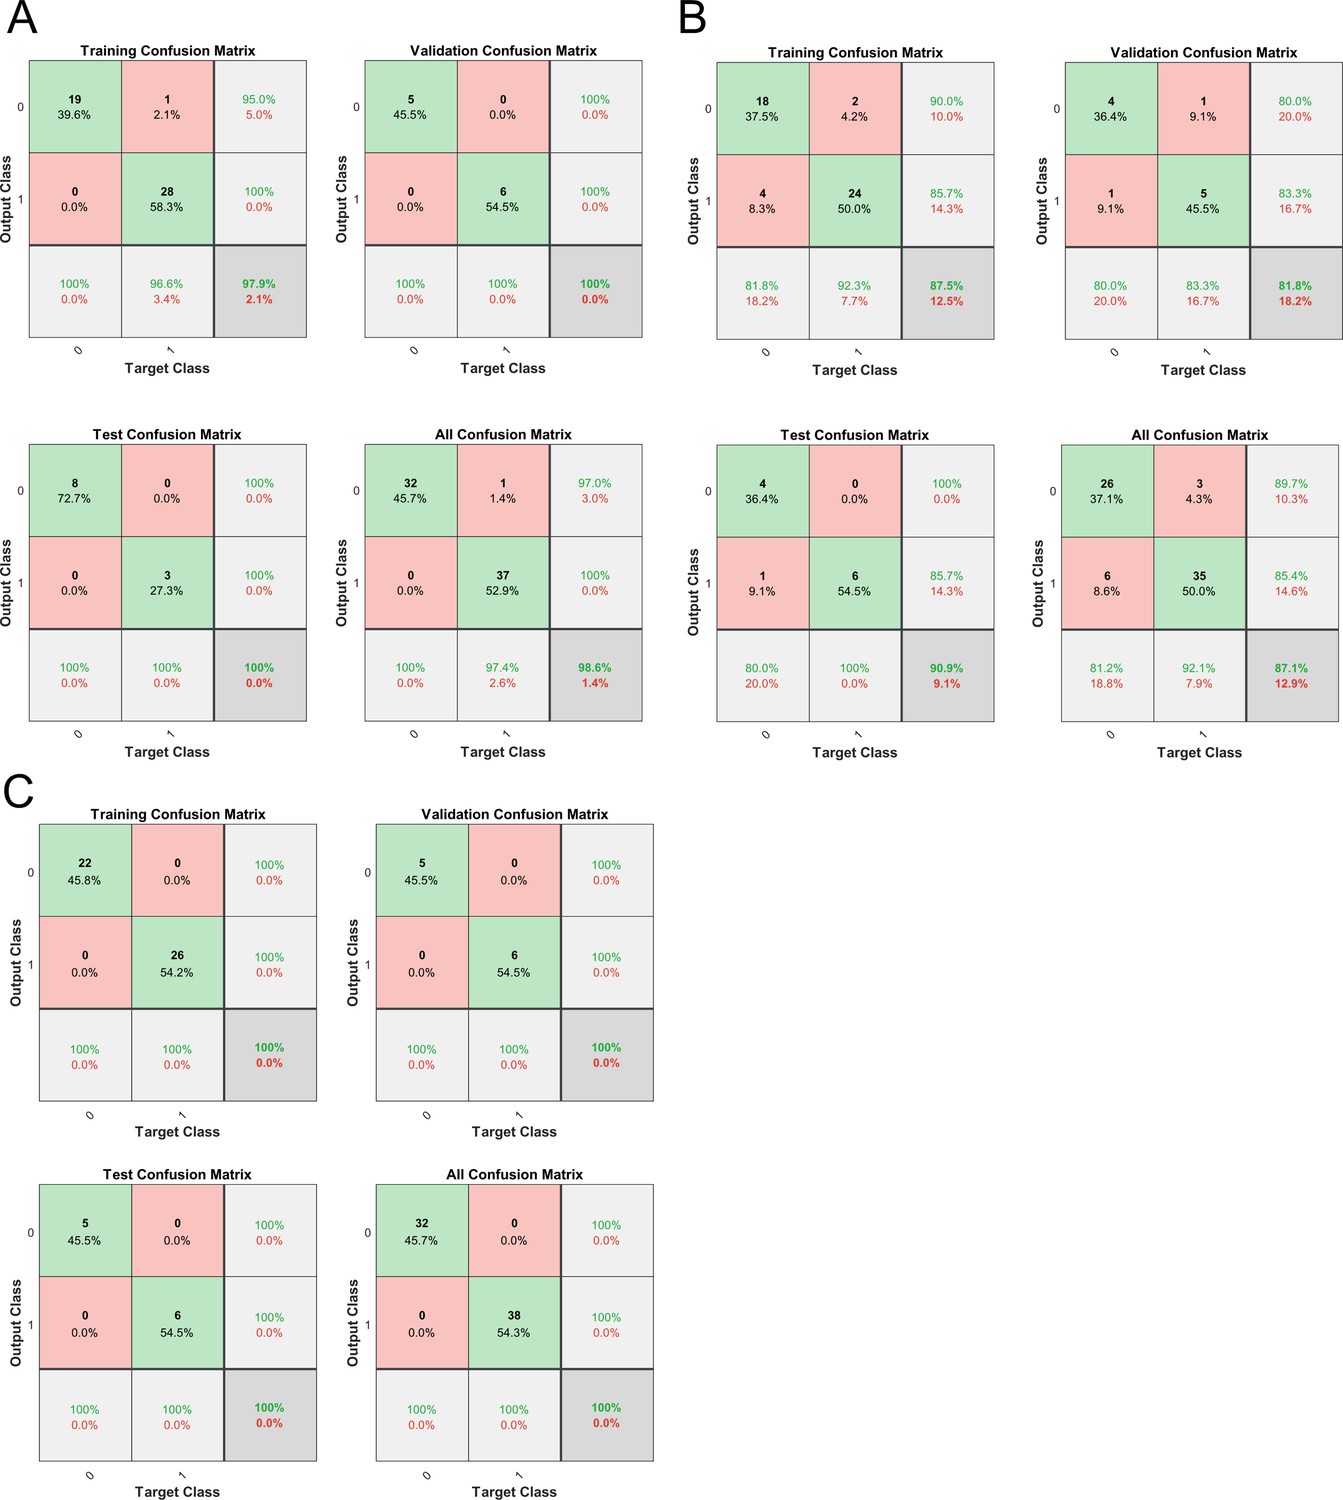
Machine learning to distinguish two locus coeruleus/norepinephrine (LC/NE) morphological cell types.
(A) Classification performance with one feature alone (the shape of the cell body, i.e., the ratio of major to the minor axis of a fitted ellipse). (B) Classification performance with another feature alone (the fraction of dendrites originated around the major axis of the fitted ellipse of the soma). (C) Classification performance with both features.
Figure 2—figure supplement 4
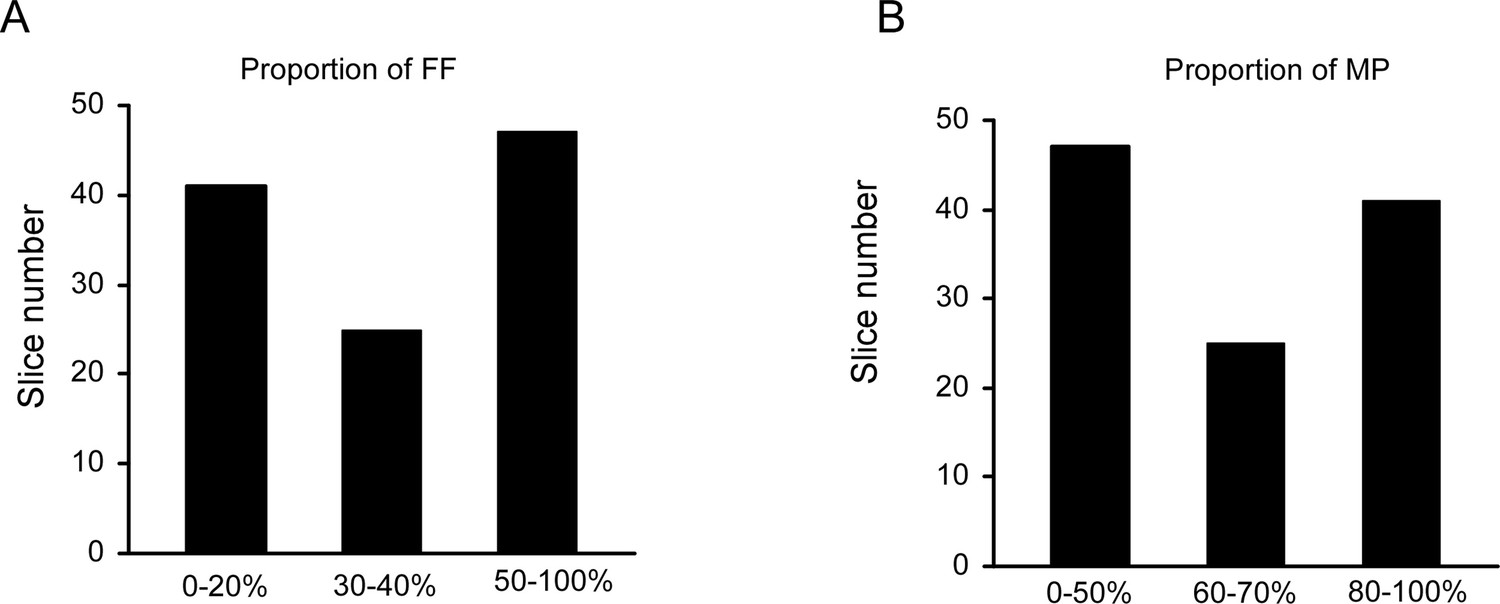
The proportion of FF or MP across all individual recording sets (slices).
(A) Histogram of the proportion of FF across all slices. (B) Histogram of the proportion of MPs across all slices.
Figure 3
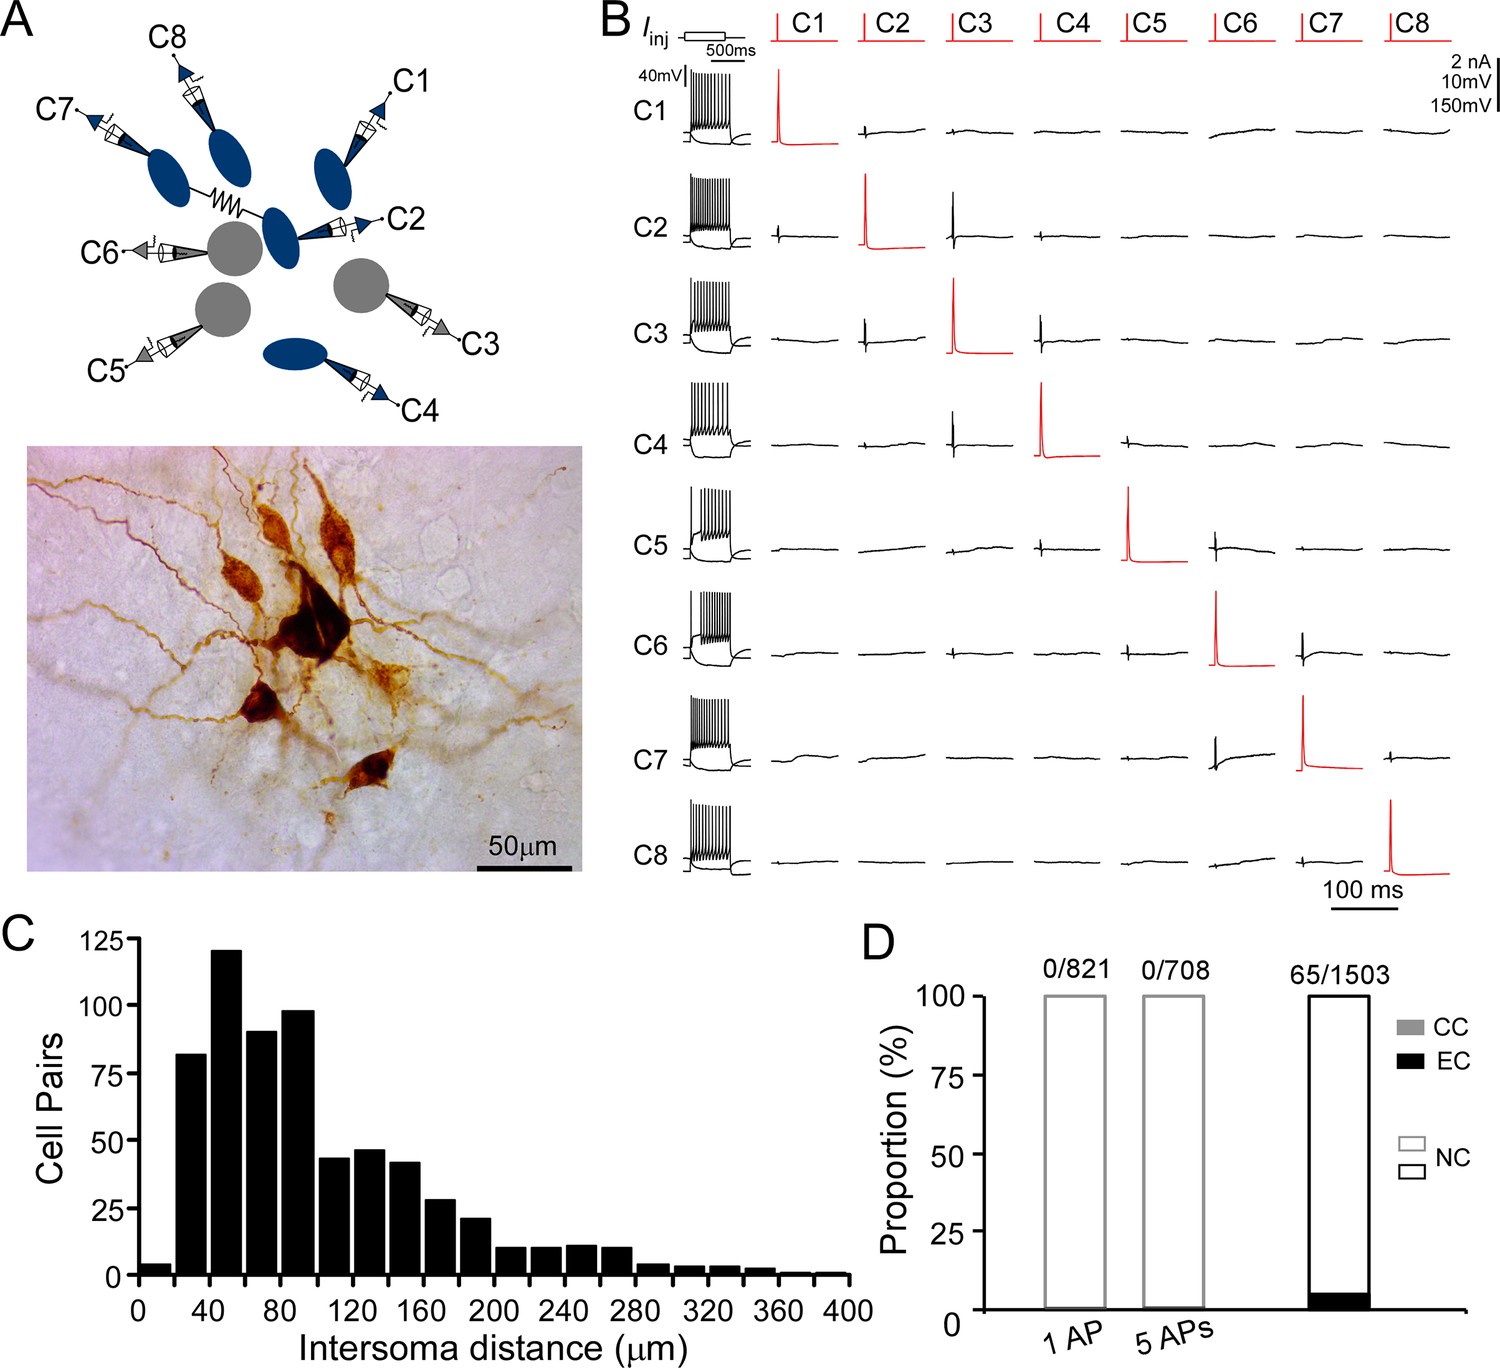
Chemical and electrical transmission between locus coeruleus/norepinephrine (LC/NE) neurons.
(A) Simultaneous patch-clamp recording of eight LC neurons with their morphology being post hoc recovered. Cell 7 and Cell 2 are electrically coupled. (B) The membrane responses of eight LC neurons to a hyperpolarizing current injection (bottom trace) and suprathreshold depolarizing current injection (upper trace) and pairwise testing of synaptic connection (or any other type of interactions) between eight LC neurons. Red traces indicate action potential (AP) evoked in each presynaptic cell and the average traces of the potential postsynaptic responses are shown in black. No visible membrane hyperpolarization or depolarization following each AP was detected in any cell pair. Vertical scale bar: 2nA for current injection, 10 mV for the traces in postsynaptic cells, 150 mV for AP evoked in presynaptic cells. The traces for electrical coupling not shown. (C) Inter-soma distance of all tested cell pairs. The majority of cell pairs have an inter-soma distance <150 µm. (D) The proportion of chemical connections (CC), electrical connections (EC), and non-connection (NC) out of all tested connection pairs. No chemical connection was detected with single AP or a train of APs (5 APs at 20 Hz) across all tested pairs, but electrical connections were sparsely identified in a small subset of cell pairs.
Figure 4

Electrical coupling between locus coeruleus/norepinephrine (LC/NE) neurons.
(A) A micrograph shows eight morphologically recovered LC/NE neurons. (B) The relative position of eight neurons (with an assigned number) and their connections. (C) Pairwise testing between eight cells as shown in (A) reveals electrical coupling between Cell 1 and Cell 4. No sign of electrical coupling between the rest of cell pairs. Vertical scale bar, 4 mV for the potential traces with no current injections, 100 mV for the traces evoked by injected currents. (D) Estimates of the coupling coefficient in both directions (R1 and R2) are plotted against each other, indicating that most contacts lack significant rectification. The data are fitted with a straight-line function (R2=0.75, p<0.001). (E) Electrical connectivity rate as a function of the inter-soma distance (ISD). (F) Electrical connectivity rate at different ages (PND: postnatal day). N.S.: no significant difference. (G) Electrical connectivity rate between neurons of same type or different types across all cell pairs. ***p<0.0001. (H) Electrical connectivity rate as a function of ISD imposed by cell types. (I) Coupling coefficients in two homotypic types of electrical coupling (within-cell type) and one heterotypic type of electrical coupling (among the different cell types). *p<0.05.
Figure 5
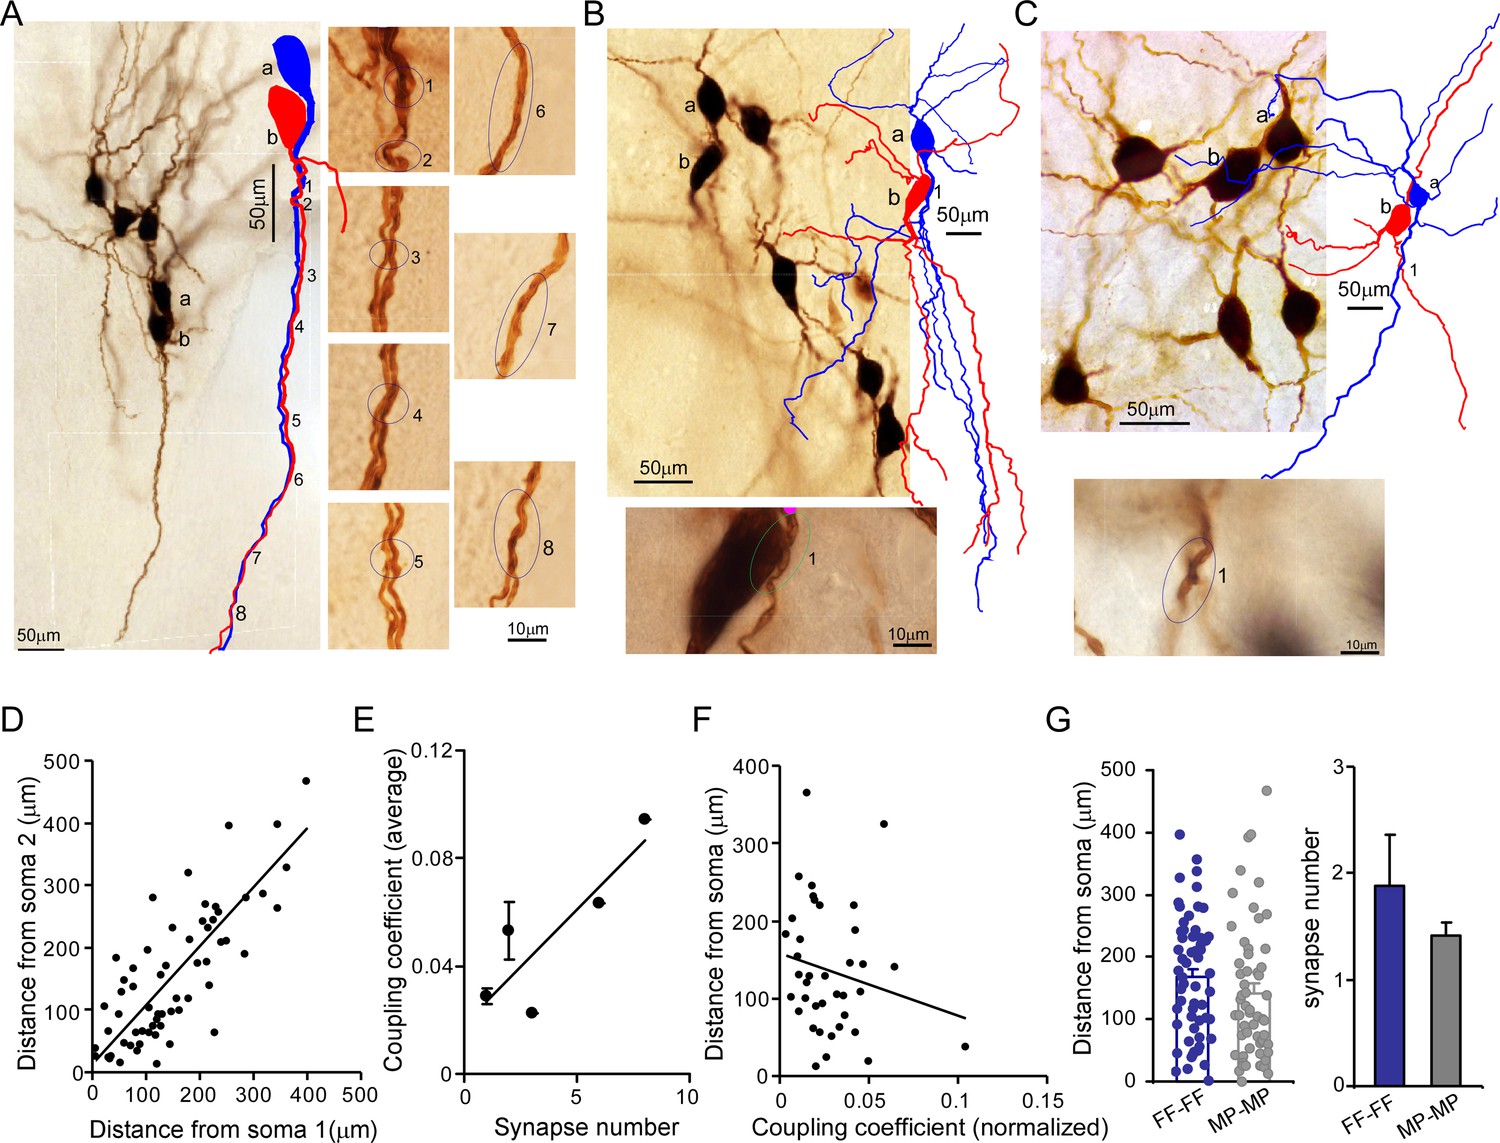
Putative electrical synapses in locus coeruleus/norepinephrine (LC/NE) neurons.
(A) Left: a microphotograph depicting six morphologically recovered LC/NE neurons (simultaneously recorded), among which Cell a and Cell b were identified as an electrically coupled pair. Multiple putative dendrodendritic electrical synapses can be identified after their morphology was reconstructed (as labeled 1 from 8). Right: a high-magnification view of each putative electrical synapse as shown on the left. (B) Top: a microphotograph depicting seven morphologically recovered LC/NE neurons, among which Cell a and Cell b were identified as a electrically coupled pair. A putative somatodendritic electrical synapse was identified after their morphology was reconstructed (as labeled as 1). Bottom: a high-magnification view of the putative electrical synapse as shown on the top. (C) Top: a microphotograph depicting six morphologically recovered LC/NE neurons, among which Cell a and Cell b were identified as a electrically coupled pair. A putative dendrodendritic electrical synapse was identified (as labeled as 1). Bottom: a high-magnification view of this putative electrical synapse as shown on the top. (D) Dendritic distances from the putative electrical synapse to the soma of Neuron 1 (Soma 1) are plotted against the distance to the soma of Neuron 2 (Soma 2) for each putative electrical synapse formed between two LC neurons. Correlation coefficient r=0.79, p<0.01. The slope of the straight line is 0.66. (E) The putative synapse number was plotted against the coupling coefficient for each pair. r=0.86, p<0.05. (F) The distances from each putative synapse to two somata were averaged and then plotted against the coupling coefficient of each pair. The coupling coefficient was normalized if a electrically coupled pair had multiple putative synapses. r=–0.19. (G) Comparing the dendritic distance of putative synapses to the soma and the putative synapse number between two homotypic electrical coupling types (FF-FF vs. MP-MP: p=0.19 in the dendritic distance; p=0.43 in the putative synapse number).
Figure 6
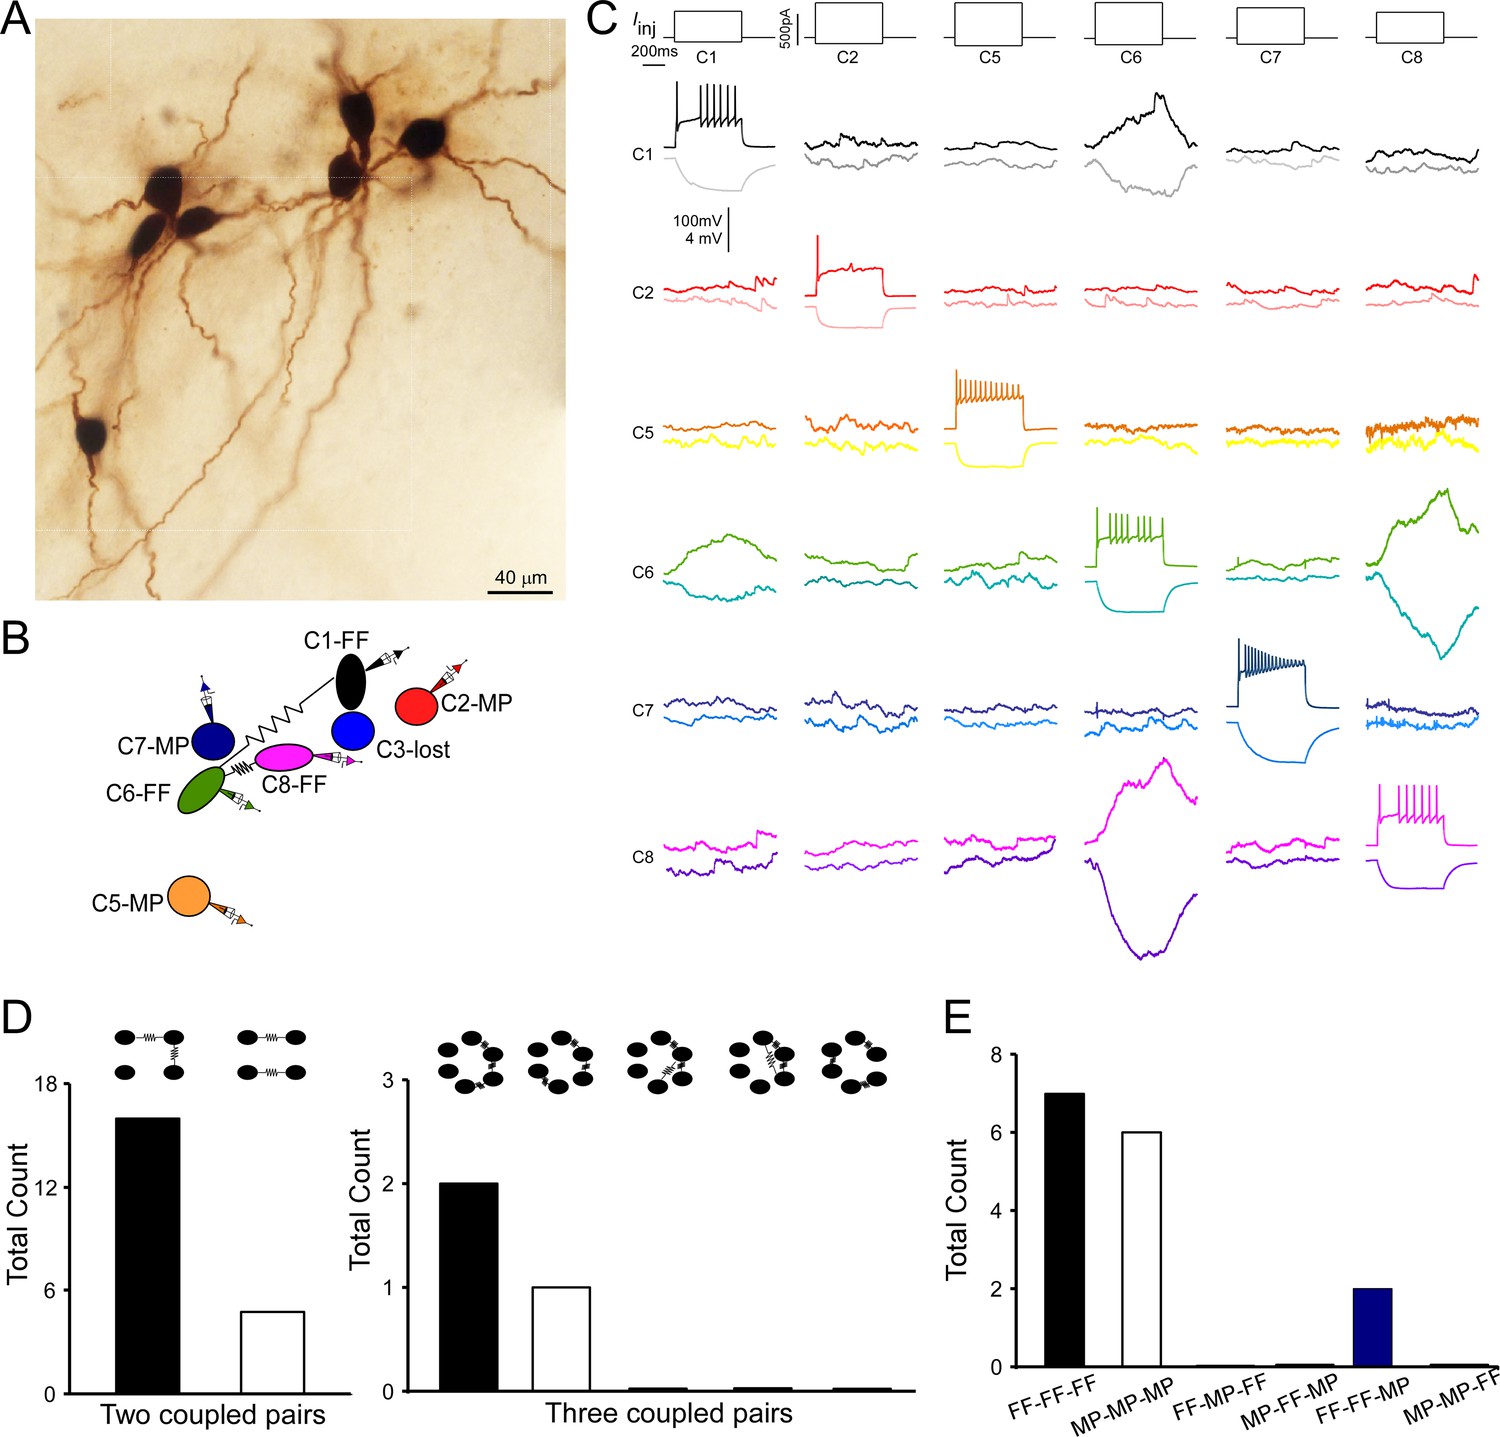
Multiple electrically coupled pairs identified in a cohort of locus coeruleus/norepinephrine (LC/NE) neurons.
(A) A micrograph shows six morphologically recovered LC/NE neurons. (B) The relative position of six neurons (with assigned number) depicted as above and their connections. (C) Pairwise testing between six cells as shown in (A) reveals electrical coupling between Cell 1 and Cell 6, and between Cell 6 and Cell 8. No sign of electrical coupling between the rest of cell pairs. Vertical scale bar, 4 mV for the potential traces with no current injections, 100 mV for the traces evoked by injected currents. (D) The counts of multiple electrically coupled pairs identified from individual multicell recording sets with all possible arranging patterns (top). (E) The cell-type identity of each cell in those inter-connected coupled pairs presented in (D), and the frequency for each possible combination.
Figure 7

Electrically coupled homotypic locus coeruleus (LC) subnetworks.
(A) In two electrical connections between LC neurons, comparing observed ratio (chain/non-chain pattern) vs the ratios predicted by Model 1 (random connectivity), Model 2 (cell-type-specific), and Model 3 (cell type and spatial-specific) suggests a chain-like rule dictating electrical connections. (B) In three electrical connections between LC neurons, observed ratio (chain/non-chain pattern) vs. the ratios predicted by Model 1 (random connectivity), Model 2 (cell-type-specific), and Model 3 suggests a chain-like rule dictating electrical connections. Error bars are standard deviations estimated by bootstrap method. ***p≤0.001, *p<0.05. (C) A sagittal view of the LC with predominant cell types for each subdivision (adopted from Loughlin et al., 1986) and the proposed electrically coupled homotypic subnetworks in the LC. Spindle-shaped: fusiform cell; round-shaped: multipolar cells. Each electrical connection form between cell pairs of same type and each connected pair is connected with each other like a chain within each LC subregion. A: anterior; P: posterior; V: ventral; D: dorsal.
Additional files
Download links
A two-part list of links to download the article, or parts of the article, in various formats.
Downloads (link to download the article as PDF)
Open citations (links to open the citations from this article in various online reference manager services)
Cite this article (links to download the citations from this article in formats compatible with various reference manager tools)
Cellular composition and circuit organization of the locus coeruleus of adult mice
eLife 12:e80100.
https://doi.org/10.7554/eLife.80100


