A CRISPR screen in intestinal epithelial cells identifies novel factors for polarity and apical transport
- Institute of Cell Biology, Medical University of Innsbruck, Austria
- Institute of Histology and Embryology, Medical University of Innsbruck, Austria
- Institute of Developmental Immunology, Medical University of Innsbruck, Austria
- Department of Paediatrics I, Medical University of Innsbruck, Austria
Figures
Figure 1 with 1 supplement
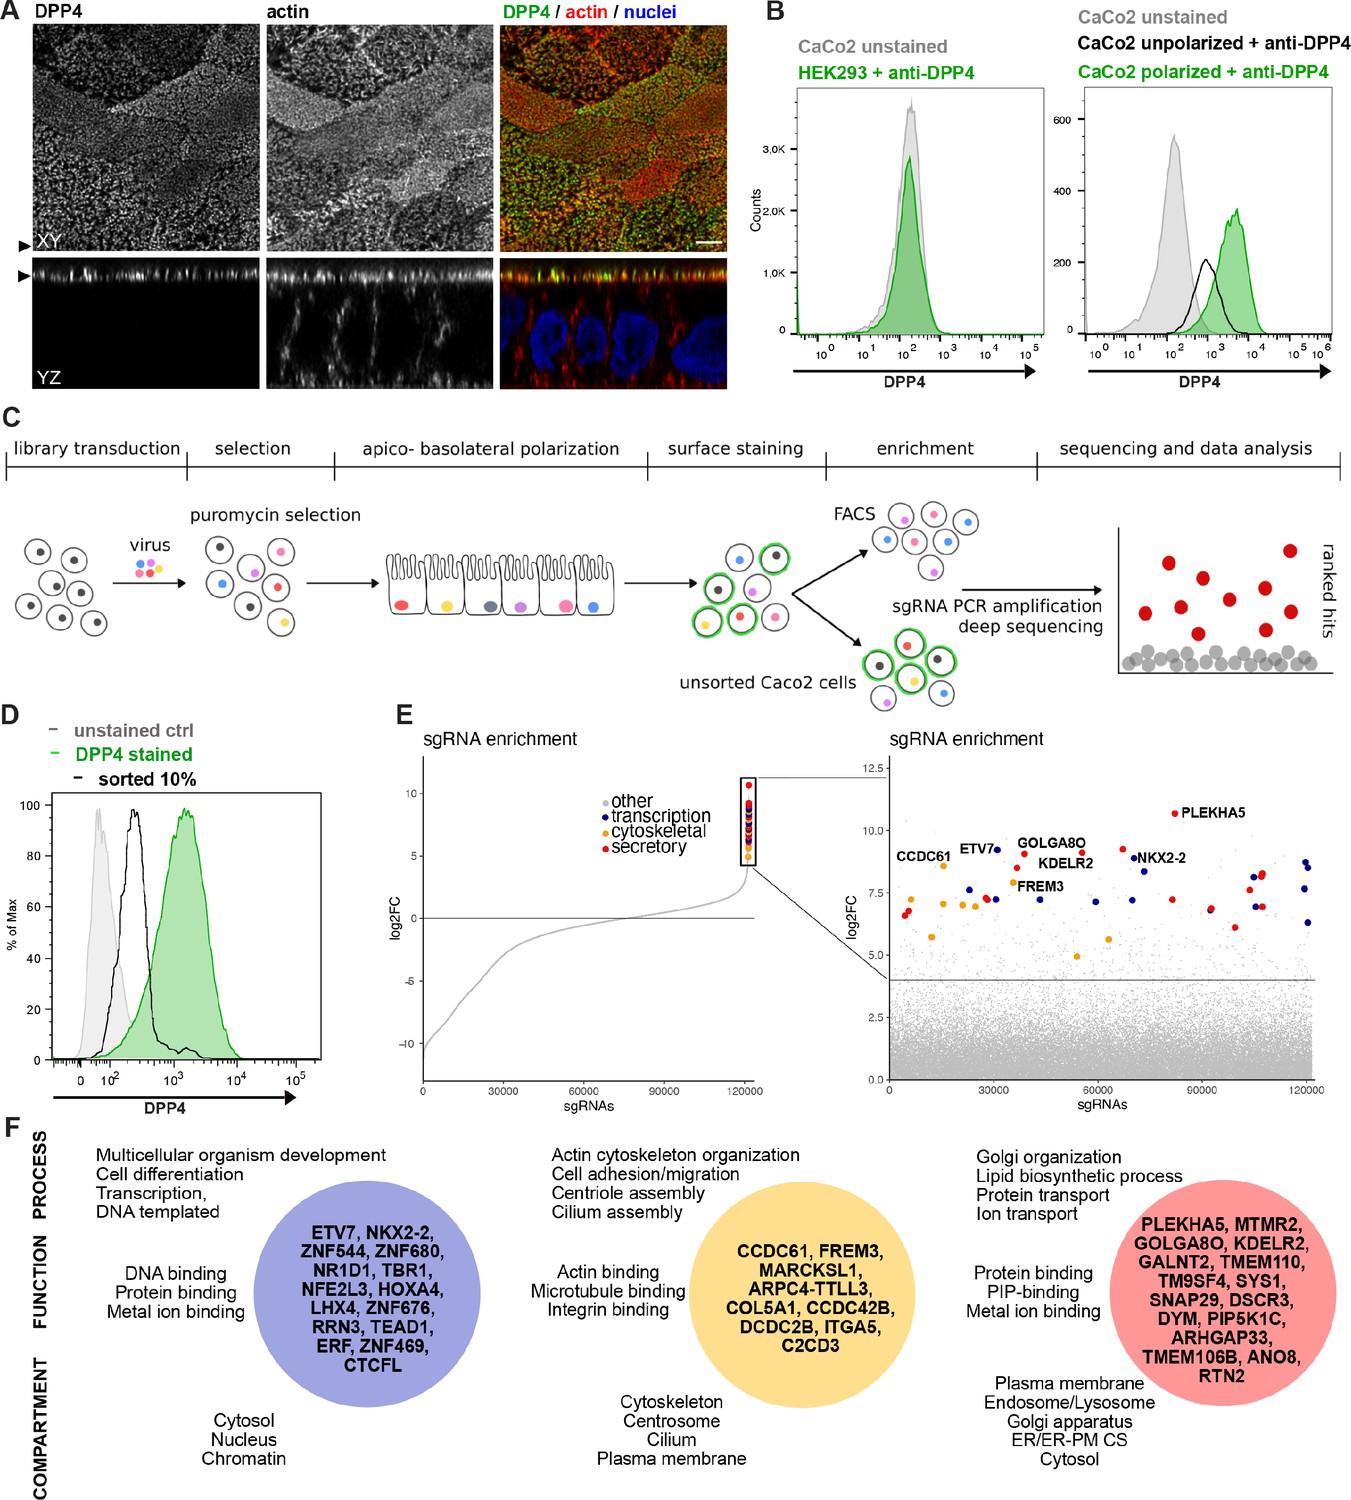
A CRISPR-mediated loss-of-function screen in polarized enterocytes.
(A) Dipeptidylpeptidase 4 (DPP4) localizes to the apical brush-border of polarized enterocytes and can be detected with a specific antibody at its extracellular stalk domain. Top view (XZ) and lateral view (YZ) of a polarized CaCo2 monolayer. Scale = 5 µm. (B) During polarization, apical DPP4 is increased due to polarized traffic and surface expansion, which can be measured by flow cytometry (right panel, CaCo2 unpolarized versus polarized). HEK293T cells, not expressing DPP4, serve as quality control for staining specificity. (C) CaCo2-Cas9 cells are transduced with the lentiGuide-Puro library and selected with puromycin. After selection, CaCo2 cells are seeded to confluent monolayers and cultured for apico-basolateral polarization. Subsequently, cells are detached, stained, and subjected to fluorescence-activated cell sorting (FACS). Sorted and unsorted control cells are processed for gDNA extraction and genomically integrated CRISPR constructs are amplified by PCR. Finally, PCR products of sorted and unsorted cell populations are analyzed by next-generation sequencing and sgRNAs are ranked by their enrichment in the sorted vs. unsorted cell polpulation. (D) Sorting was performed for 10% of the cells, with lowest surface-signal intensity, thereby enriching for the cell population that had lost 90% of surface DPP4 signal, due to efficient CRISPR targeting. (E) 89 single-guide RNAs were significantly enriched in the sorted cell population. (F) Factors enriched in the sorted cell population could functionally be associated with secretory traffic, cytoskeletal architecture, or transcription, in a manual gene -ontology analysis.
Figure 1—figure supplement 1
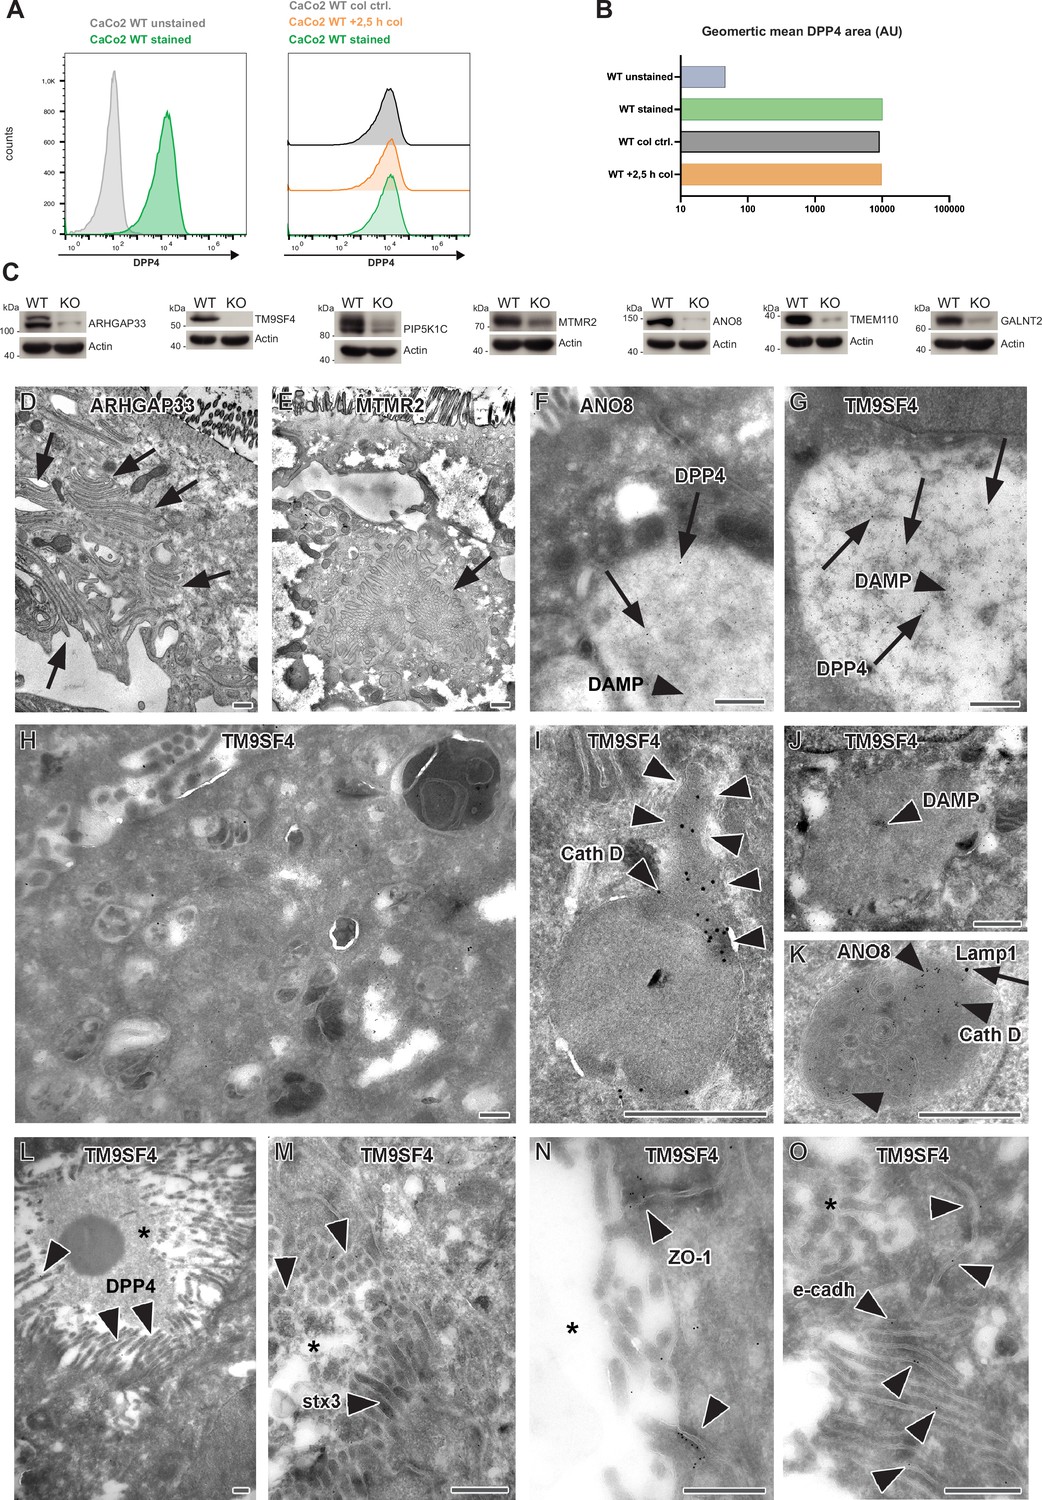
Colchine treatment of CaCo2 WT cells, validation of additional gRNA targeting, and complementary ultrastructure and immunoelectron microscopy on the phenotype of selected, polarized KO cells.
(A) A flow cytometry assay was performed as described for our CRISPR screen. CaCo2 WT cells were polarized for 3 weeks and subsequently detached. After detachment, cells were either stained immediately for surface-DPP4 und subjected to flow cytometry or treated with 20 µM of colchicine for 2,5 hr. After 2.5 hr, colchicine-treated cells and corresponding control cells (incubation in FACS buffer for 2.5 hr) were stained for surface-DPP4 and subjected to flow cytometry measurements. No change in surface DPP4 signal can be detected upon induction of vacuolar apical compartments (VAC) with colchicine. (B) Quantification of surface-DPP4 signal of colchicine-treated and untreated cells. Induction of VAC formation with colchicine does not cause a reduction in surface DPP4 signal. (C) Generation of knockout (KO) cell lines of seven candidates with additional gRNAs. Protein levels that may remain in KO cells after CRISPR targeting were determined by Western blotting compared with wild-type (WT) cells. Beta-actin was used as loading control. Molecular size markers are depicted in kDa. (D) Paracellular microvilli a/o numerous interdigitations in cryo-fixed ARHGAP33 KO cells. (E) Intracellular microvillar cluster in cryo-fixed MTMR2 KO cell. (F) Mislocalized DPP4 (arrows) in a huge, acidic (i.e., DAMP-positive: arrow head) compartment in ANO8 KO cell. (G) Mislocalized DPP4 (arrows) in a huge DAMP-positive (arrowhead) compartment in TM9SF4 KO cell. (H–K) Normal late endosomal and lysosomal organelles as observed after serum starvation overnight. (H) Overview of TM9SF4 KO cell. (I) Reformed lysosome with cathepsin D immunogold label concentrated at its tubular part (outlined by arrowheads) in TM9SF4 KO cell. (J) Weak DAMP-immunogold label (arrow head) within newly formed lysosome/protolysosome in TM9SF4 KO cell. (K) Lamp1 (arrow) and cathepsin D (arrow heads) immunogold label in normal lysosome in ANO8 KO cell. (L) Ectopic DPP4 immunogold label (arrow heads) at basolateral, paracellular microvilli in TM9SF4 KO cell. (M) Ectopic stx3 immunogold label (arrowheads) at basolateral, paracellular microvilli TM9SF4 KO cell. (N) ZO1 immunogold label (arrowheads) at ectopic, basolateral tight junctions associated with paracellular microvillar spot (asterisk marks intercellular space) in TM9SF4 KO cell culture. (O) E-cadherin immunogold label (arrowheads) at basolateral adherens junctions adjacent to a paracellular microvillar spot (asterisk marks intercellular space) in TM9SF4 KO cell culture. (D–O) Scale = 500 nm.
Figure 2

Gene ontology (GO) analysis of hits obtained in a CRISPR-mediated loss-of-function screen in polarized CaCo2 cells.
(A) Schematic representation of significantly enriched genes obtained from a CRISPR screening approach, grouped and organized according to their associated GO terms. (B) GO association analysis of the seven factors that were chosen for CRISPR screen readout validation and further characterization. CC, cellular compartment; MF, molecular function; BP, biological process.
Figure 3
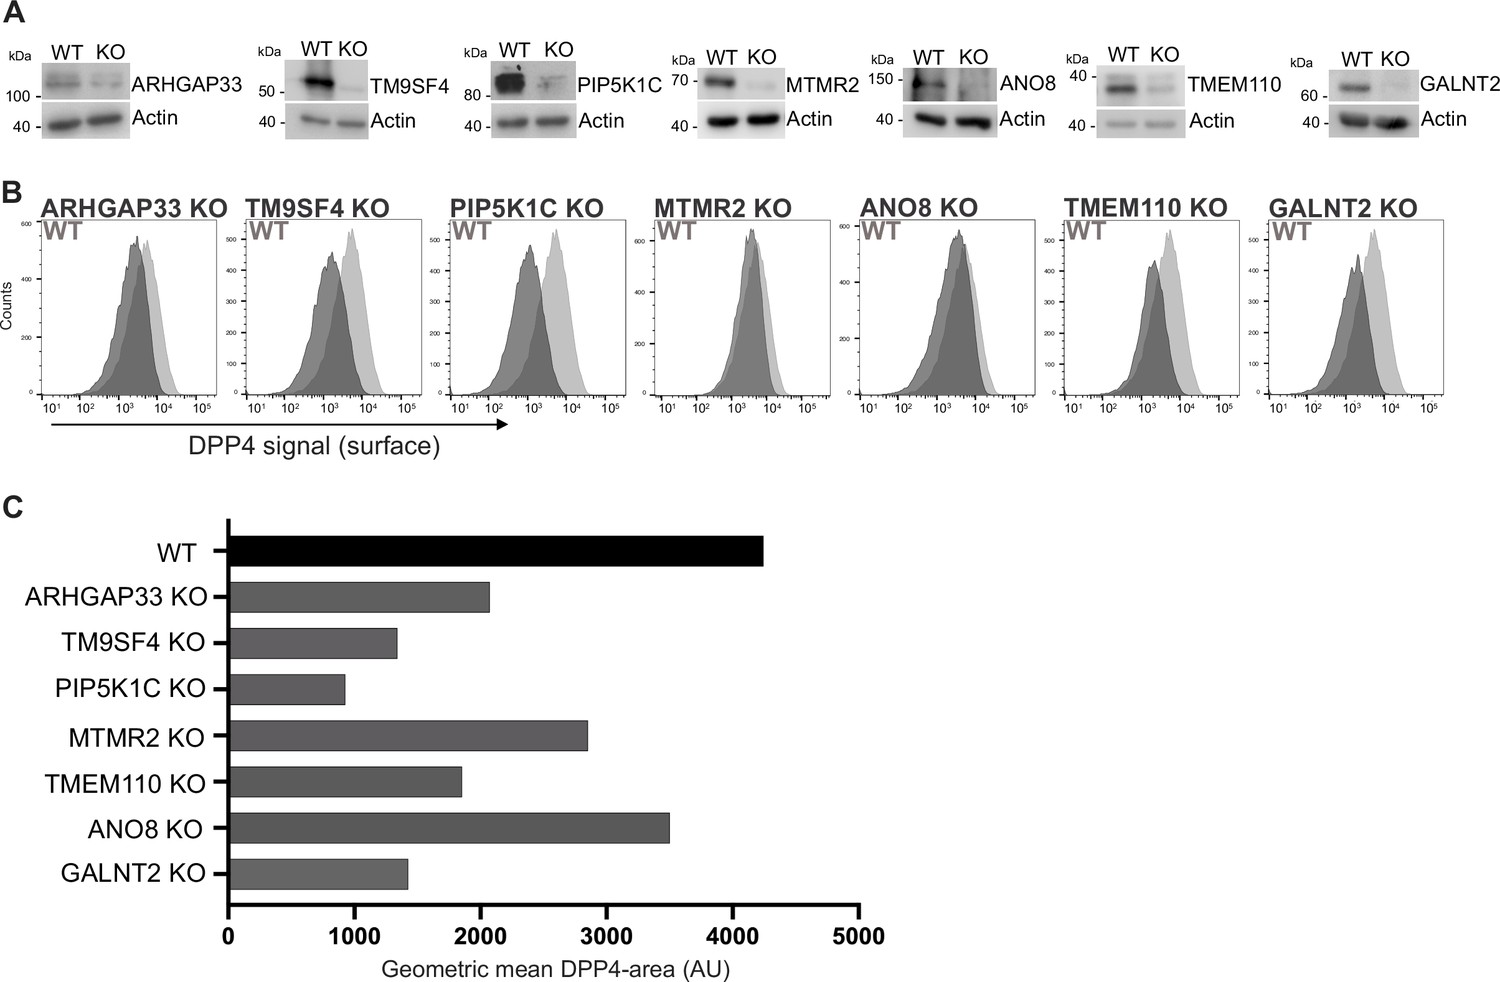
Validation of selected candidates identified in a CRISPR-mediated loss-of-function screen.
(A) Generation of clonal knockout (KO) cell lines of seven candidates chosen for primary CRISPR screen validation and further analysis. Any remaining protein levels in the KO clones after CRISPR targeting were determined by Western blotting compared with wild-type (WT) cells. Beta-actin was used as loading control. Molecular size markers are depicted in kDa. (B) The effect of the respective KOs on DPP4 surface transport, in KO cell lines. Cell lines were polarized for 18 days and then subjected to flow cytometry to determine the KO effect on DPP4 surface targeting. (C) Geometric means of DPP4-area (DPP4 intensity on the cellular surface) were determined of respective cell lines. All KO cell lines show varying extents of DPP4 surface reduction, with PIP5K1C-KO displaying the strongest and ANO8-KO the mildest effect.
Figure 4
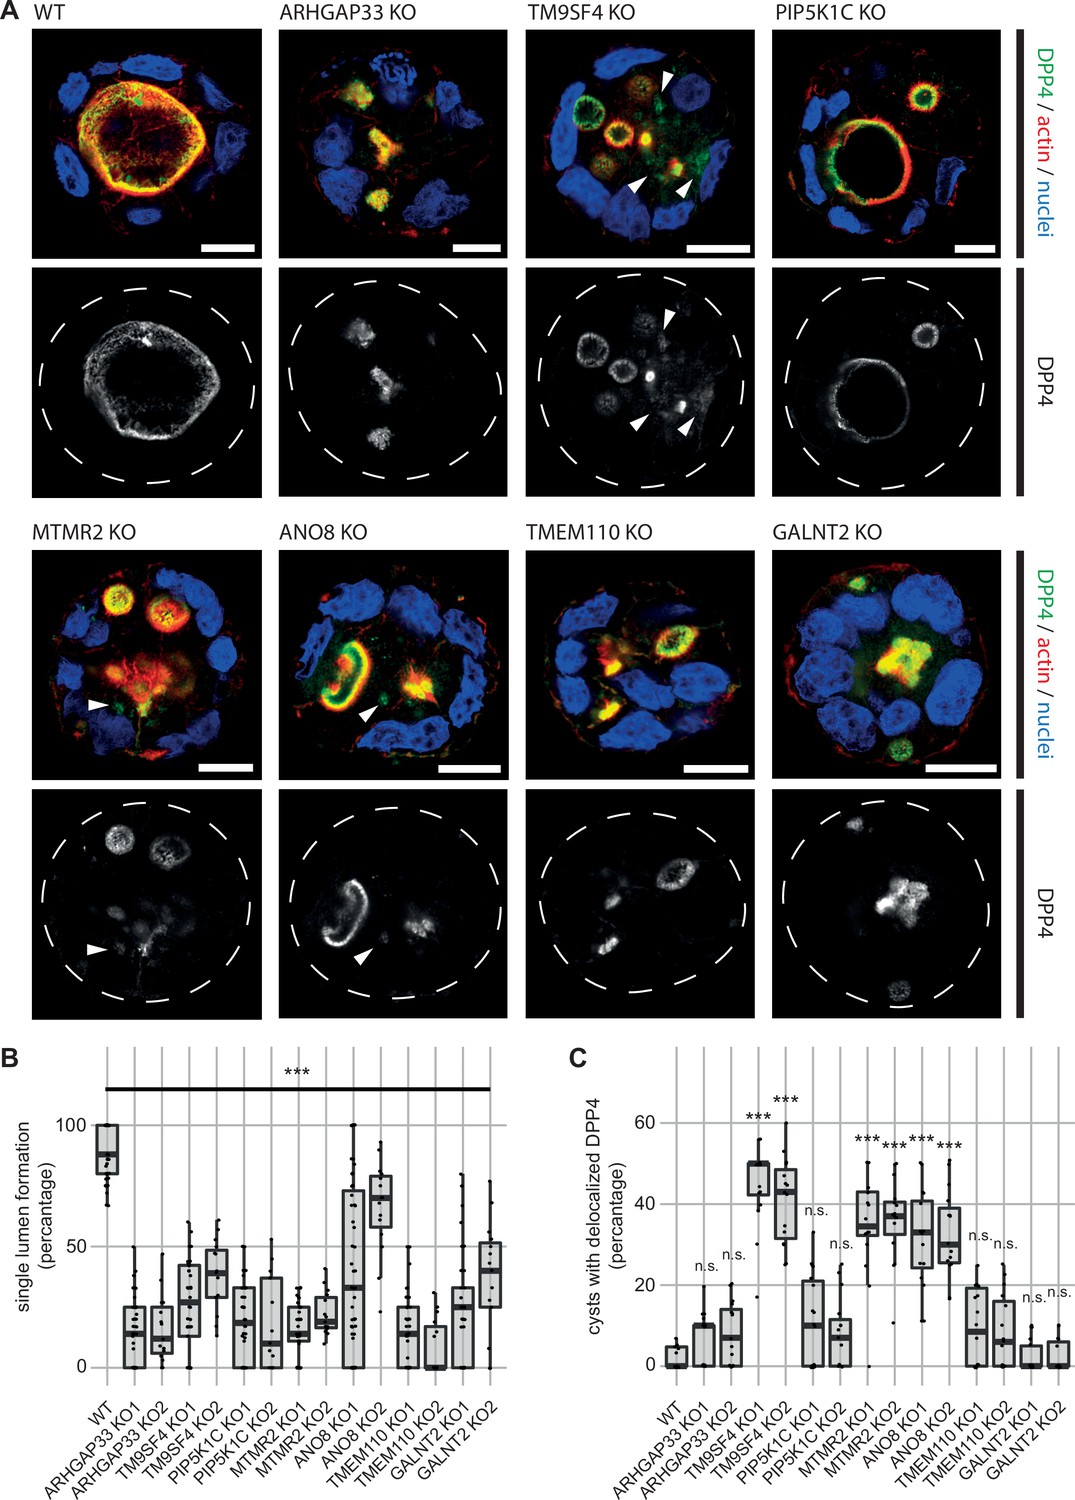
3D cyst cultures demonstrate disrupted epithelial polarity.
(A) 3D cyst assay were performed with WT and KO cultures. Immunofluorescence micrographs of 3D cysts generated from WT and KO cell lines. All knockdown cell lines form multiple lumina or no lumina. DPP4 localizes to actin-rich structures in al KO cell lines and additionally, to intracellular, actin-negative compartments in TM9SF4-, MTMR2- and ANO8-KO clones (white arrowheads). Scale = 10 µm. (B) Single central lumen formation was quantified. The percentage of cysts with a single central lumen is substantially decreased in the respective KO cells lines (dot box plot, Mann–Whitney U test. ***p< 0.005, n ≥ 100 cells per condition). (C) Delocalized DPP4 in cysts was quantified (dot box plot, Mann–Whitney U test. ***p<0.005, n.s., not significant).
Figure 5
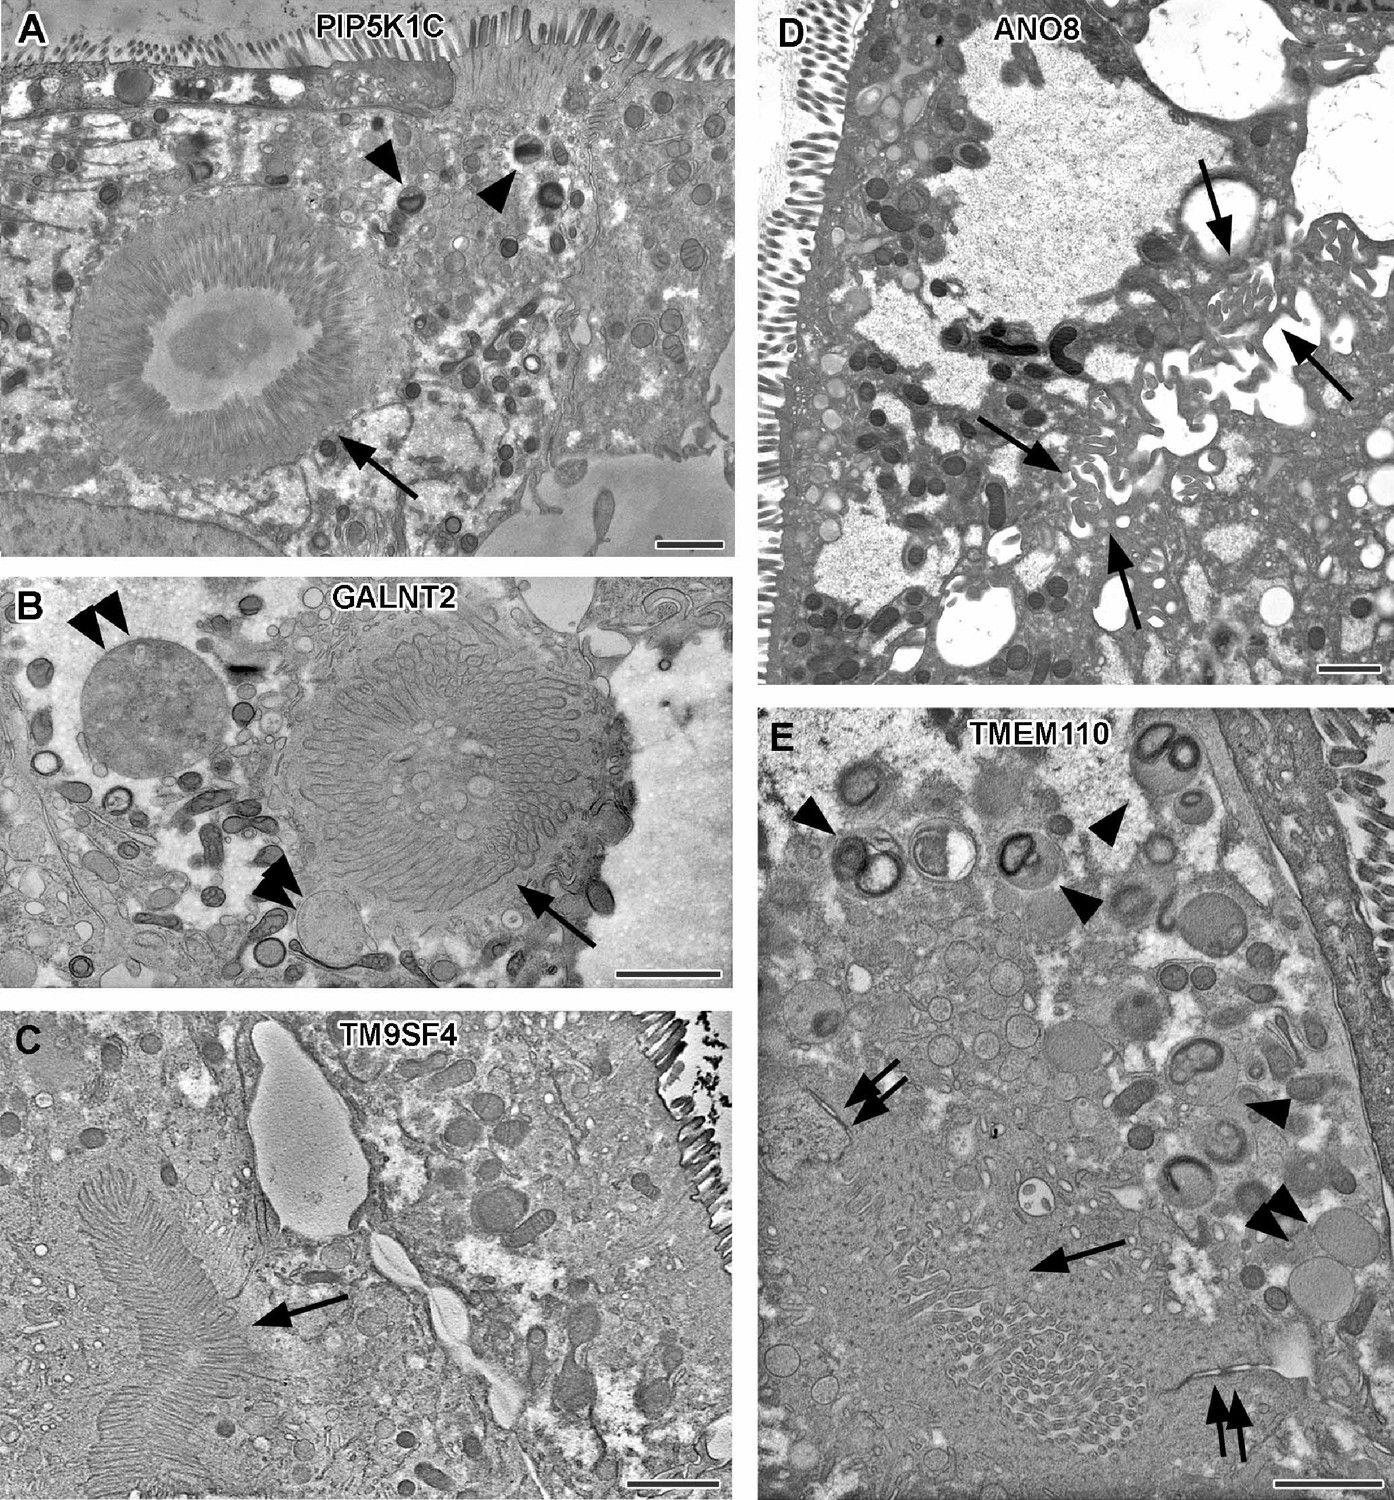
Electron micrographs with various configurations of abundant ectopic microvilli reflect polarity defects in 18-day-old 2D cultures of selected CaCo2 knockout (KO) cell lines.
(A) Distinct intracellular lumen, lined by ectopic brush-border and adjacent terminal web, thus, a typical microvillus inclusion (arrow) inside a PIP5K1C-KO cell. Arrowheads mark lysosomes. (B) Spherical intracellular mass of tangled microvilli associated with ectopic terminal web (arrow) inside a GALNT2-KO cell. Double arrowheads mark enlarged late endocytic organelles. (C) Paracellular, basolateral spot of densely packed microvilli plus associated ectopic terminal web (arrow) in polarized TM9SF4-KO-cell culture. (D) Numerous, slightly bent microvilli facing widened intercellular space (arrows) in polarized ANO8-KO cell culture. (E) Paracellular microvillar spot with adjacent ectopic terminal web (arrow) and associated cell junctions (double arrows) in polarized TMEM110-KO cell culture. Arrowheads mark lysosomes, double arrowhead marks poorly structured late endocytic organelles. (A–E) Scale = 1 µm.
Figure 6

Ultrastructure of late endocytic and lysosomal organelles in CaCo2 wildtype (WT) cells versus selected knockout (KO) cell lines of cryo-fixed 18-day-old polarized filter cultures under steady-state conditions.
(A, B) WT CaCo2 cells with normal endosomes and lysosomes: multivesicular bodies (MVBs) with varying contents (regarding intraluminal vesicle [ILV] number, size, and staining patterns), different types of (autophago)lysosomes (arrowheads), all filled with clearly stained, finely granular material plus membrane remnants (i.e., multilamellar bodies), and/or opaque, amorphous residues (i.e., dense-core lysosomes). Double arrowheads mark examples of inconspicuous spherical organelles with weakly stained, quite homogeneous granular contents harboring only sporadic ILVs and/or other structured components, interpreted as kind of endolysosome (Bright et al., 2016). (C) Large, poorly structured putative endolysosome (double arrowhead), virtually the predominant type of late endocytic and/or catabolic organelles in ANO8 KO at steady state. (D) Moderately sized and enlarged putative endolysosomes (double arrowheads) in PIP5K1C KO cells. (E) Enlarged putative endolysosome (arrowhead), the predominant type of late endocytic/catabolic organelles in TM9SF4 KO cells. (F) Moderately enlarged putative endolysosomes (double arrowheads) occurring together with normal lysosomes in ARHGAP33 KO cells. (G) Enlarged putative endolysosomes (double arrowheads) occurring together with slightly smaller lysosomes in MTMR2 KO cells. Arrows mark lateral microvilli. (A–G) Scale = 500 nm.
Figure 7
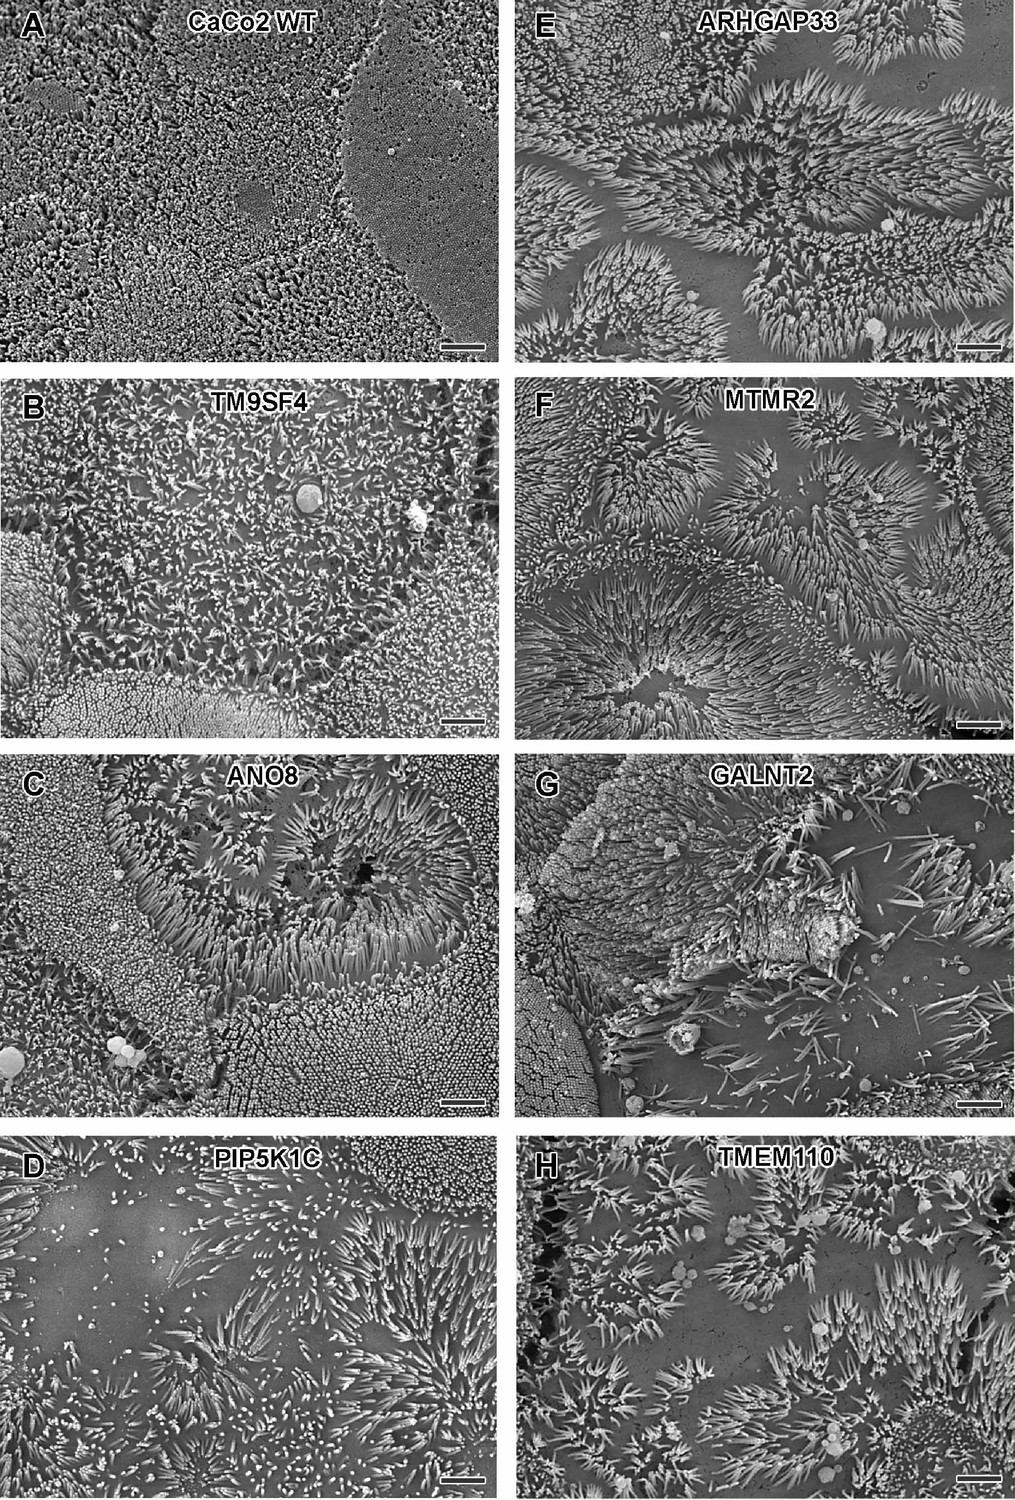
Scanning electron microscopy (SEM) surface views on apical microvilli of 18-day-old polarized CaCo2 wildtype (WT) cells versus knockout (KO) cells.
(A) CaCo2 WT cells with dense, quite uniform brush-border. (B–H) Patchy distribution of partly abnormal microvilli characterize the apical surface of all KO cell lines specified here. (A–H) Scale = 2 µm.
Figure 8 with 2 supplements
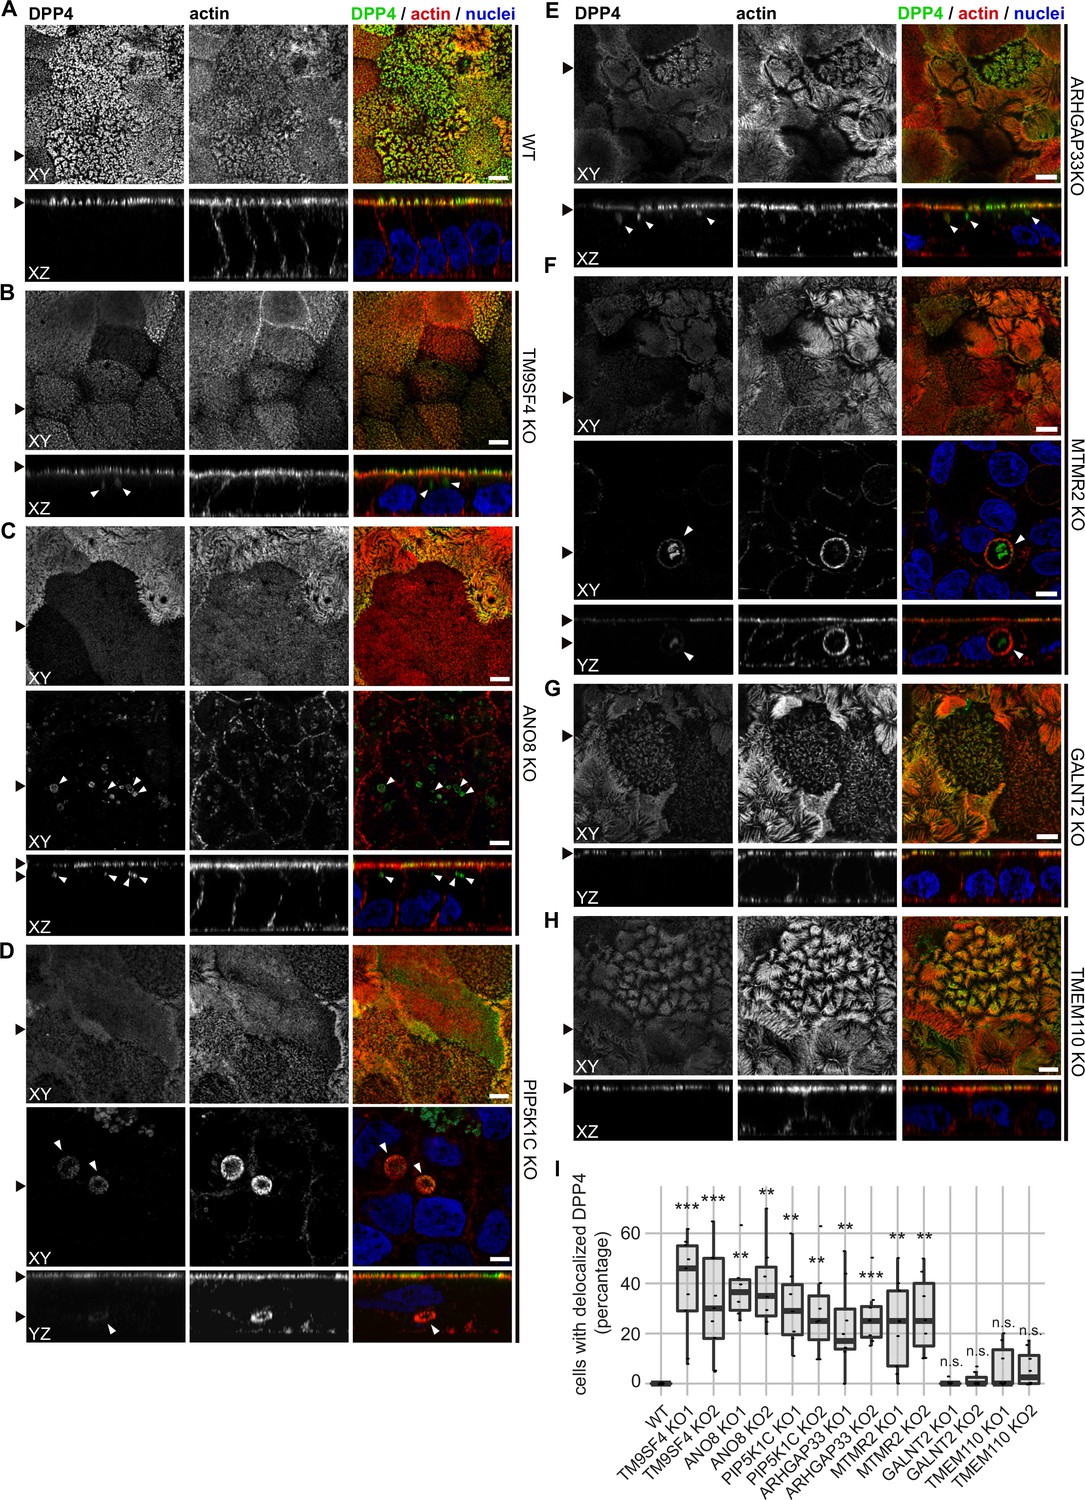
Confocal micrographs of DPP4 and actin immunofluorescence staining from wildtype (WT) and respective knockout (KO) cell lines.
(A) DPP4 localization is restricted to the actin-rich microvillus brush-border in WT cells. (B, C) DPP4 can still be targeted to the apical plasma membrane, but also mislocalizes to subapical compartments in TM9SF4- (B) and ANO8-KO (C) cells (white arrowheads). (D) PIP5K1C-KO cell lines display large, DPP4- and actin-positive, basolateral compartments (white arrowheads). (E) DPP4 mislocalizes to subapical compartments in ARHGAP33-KO cells (white arrowheads). (F) MTMR2-KO cell lines display large, actin-rich basolateral compartments, that also show DPP4 (white arrowheads). (G, H) In GALNT2- and TMEM110-KO cells, DPP4 localizes strictly to the apical plasma membrane. (I) Delocalized DPP4 in polarized CaCo2 cells was quantified (dot box plot, Mann–Whitney U test. **p<0.01, ***p<0.005, n.s., not significant, n ≥ 100 cells per condition). XY = top view of polarized monolayer; XZ/YZ = lateral view of polarized monolayer. Scale = 5 µm.
Figure 8—figure supplement 1
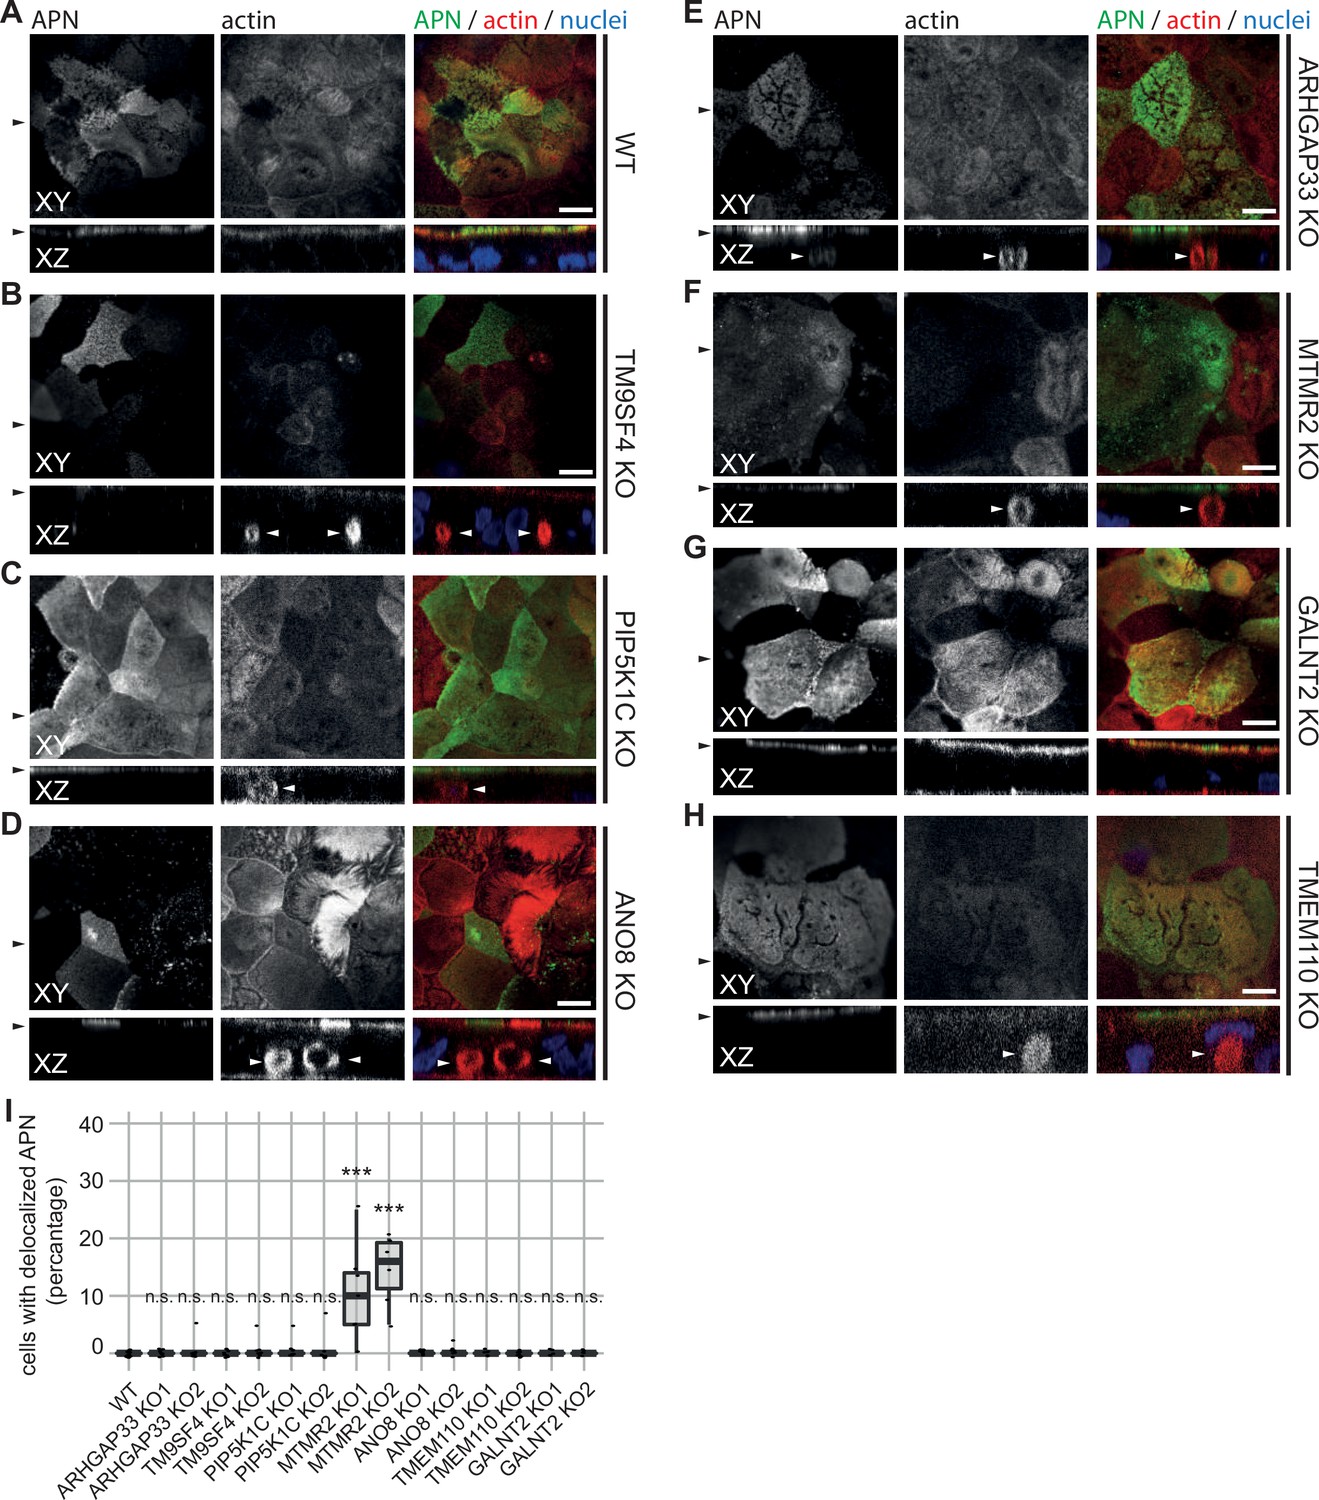
Confocal micrographs of aminopeptidase N (APN) and actin immunofluorescence staining from wildtype (WT) and respective knockout (KO) cell lines.
(A) APN localization is restricted to the actin-rich microvillus brush-border in WT cells. (B–D) APN localization is restricted to the actin-rich microvillus brush-border in TM9SF4-, PIP5K1C-, and ANO8-KO cells. Additionally, intracellular actin-positive compartments are detected (white arrowheads). (D) ARHGAP33-KO cell lines display large, APN- and actin-positive, intracellular compartments (white arrowheads). (E) DPP4 mislocalizes to subapical compartments in ARHGAP33-KO cells (white arrowheads). (F) APN localization is restricted to the actin-rich microvillus brush-border in MTMR2-KO cells. Additionally, intracellular actin-positive compartments are detected (white arrowheads). (G, H) In GALNT2- and TMEM110-KO cells, DPP4 localizes strictly to the apical plasma membrane. (A–H) XY = top view of polarized monolayer; XZ/YZ = lateral view of polarized monolayer. Scale = 5 µm. (I) Delocalized APN in polarized CaCo2 cells was quantified (dot box plot, Mann–Whitney U test. ***p<0.005, n.s., not significant, n ≥ 100 cells per condition).
Figure 8—figure supplement 2
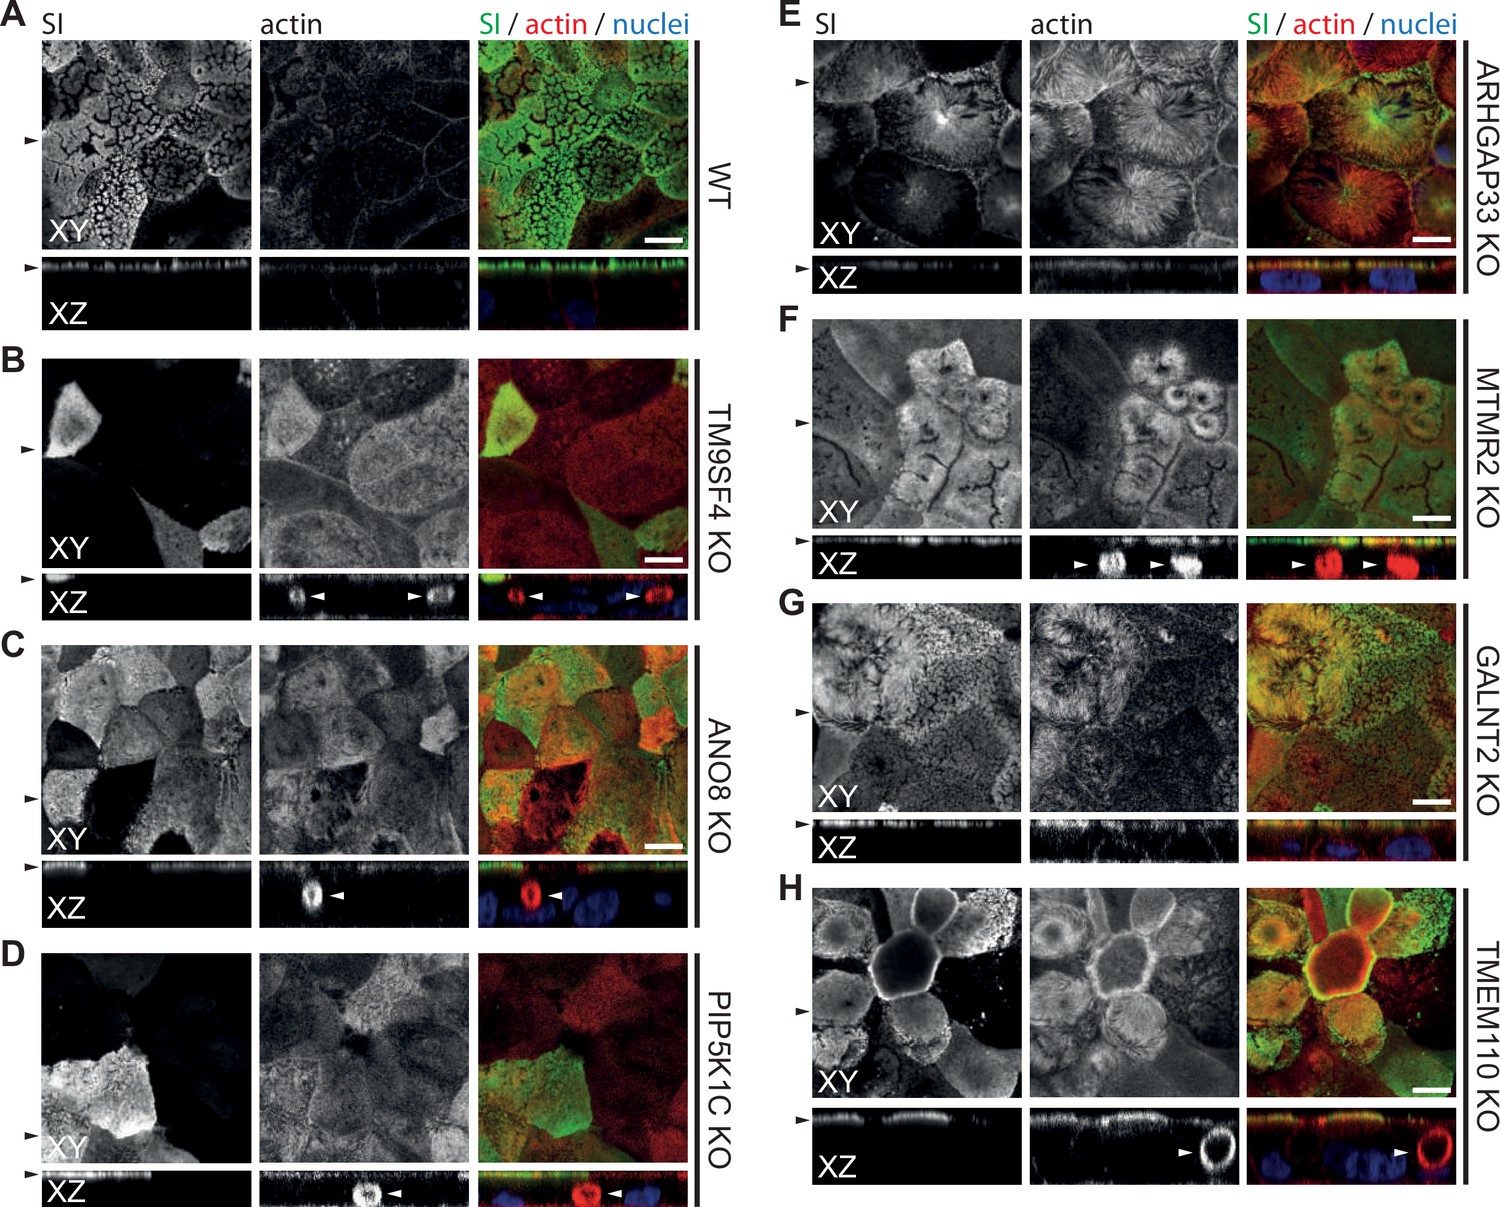
Confocal micrographs of surcase-isomaltase (SI) and actin immunofluorescence staining from wildtype (WT) and respective knockout (KO) cell lines.
(A) SI localization is restricted to the actin-rich microvillus brush-border in WT cells. (B–H) KO of indicated genes does not alter the localization of SI localization is restricted to the actin-rich microvillus brush-border. XY = top view of polarized monolayer; XZ/YZ = lateral view of polarized monolayer. Scale = 5 µm.
Figure 9

Confocal micrographs of syntaxin-3 (stx3) and actin immunofluorescence staining from wildtype (WT) and respective knockout (KO) cell lines.
(A) stx3 localizes strictly to the apical plasma membrane in WT cells. (B) stx3 abberantly localizes to a subapical compartment in TM9SF4-KO cells. (C) ANO8-KO cell lines display apical localization of stx3. (D) stx3 mislocalizes to large, basolateral, actin-rich compartments in PIP5K1C-KO cells, reminiscent of microvillus inclusions. (E) stx3 localizes to subapical compartments in ARHGAP33-KO cells. (F) stx3 mislocalizes to large, basolateral actin-rich compartments in MTMR2-KO cells. (G, H) GALNT2- and TMEM110-KO cell lines display apical localization of stx3. XY = top view of polarized monolayer; XZ/YZ = lateral view of polarized monolayer. (I) Delocalized stx3 in polarized CaCo2 cells was quantified (dot box plot, Mann–Whitney U test. **p<0.01, ***p<0.005, n.s., not significant, n ≥ 100 cells per condition). XY = top view of polarized monolayer; XZ/YZ = lateral view of polarized monolayer. Scale = 5 µm.
Figure 10
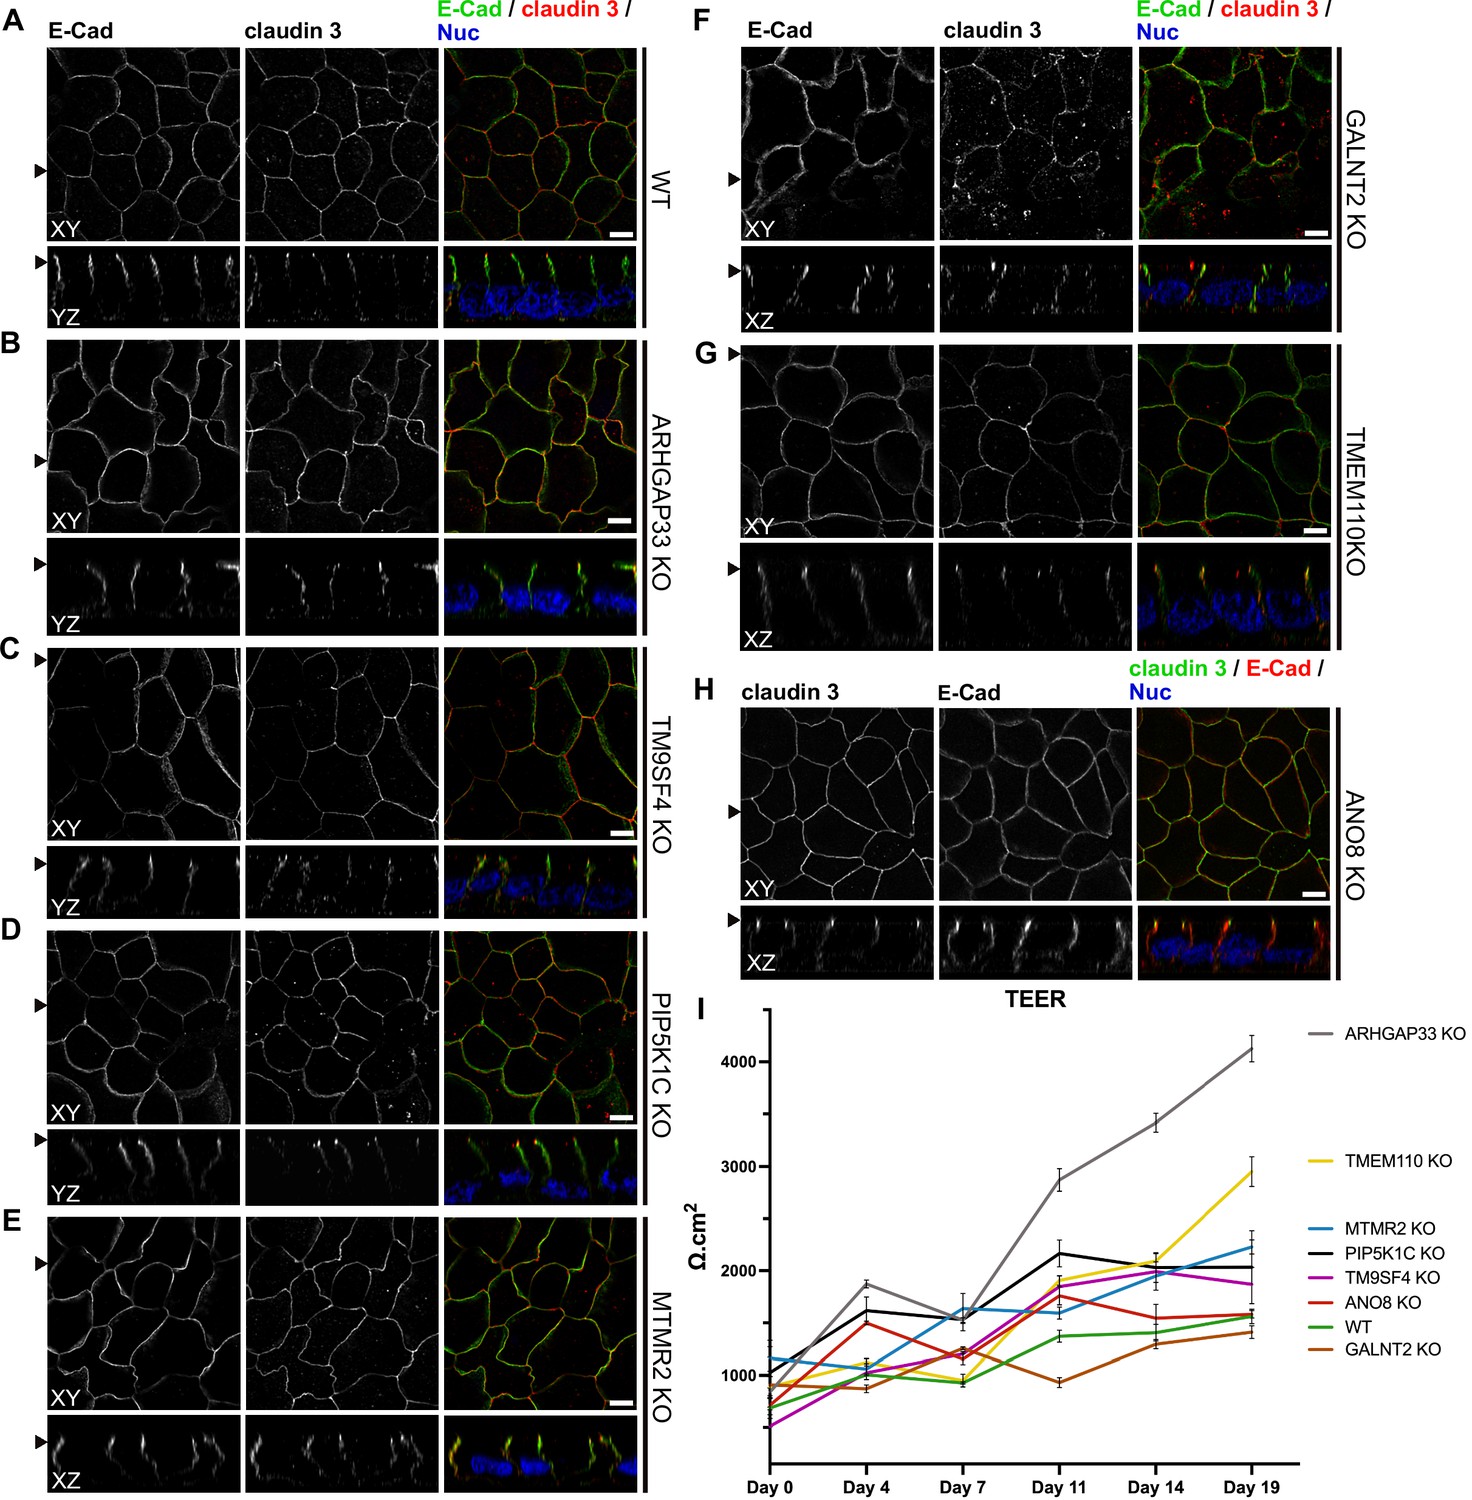
Confocal micrographs of E-cadherin and claudin 3 immunofluorescence staining from wildtype (WT) and respective knockout (KO) cell lines.
(A) Localization of E-cadherin and claudin 3 in WT cells, where E-cadherin is distributed over the basolateral plasma membrane and claudin 3 is enriched at apical domains, but can also be found at basolateral membrane regions. (B–H) ARHGAP33-, TM9SF4-, PIP5K1C-, MTMR2-, GALNT2-, TMEM110-, and ANO8-KO cell lines show basolateral E-cadherin localization as well as claudin 3 enrichment at apical and lateral domains, similar to WT cells (A). Scale = 5 µm. (I) TEER measurements of WT and respective KO clones. TEER of ARHGAP33-KO cells increases substantially around day 7 of the measurement. Measurements are depicted as means with standard deviation. XY = top view of polarized monolayer; XZ/YZ = lateral view of polarized monolayer; scale = 5 µm.
Figure 11
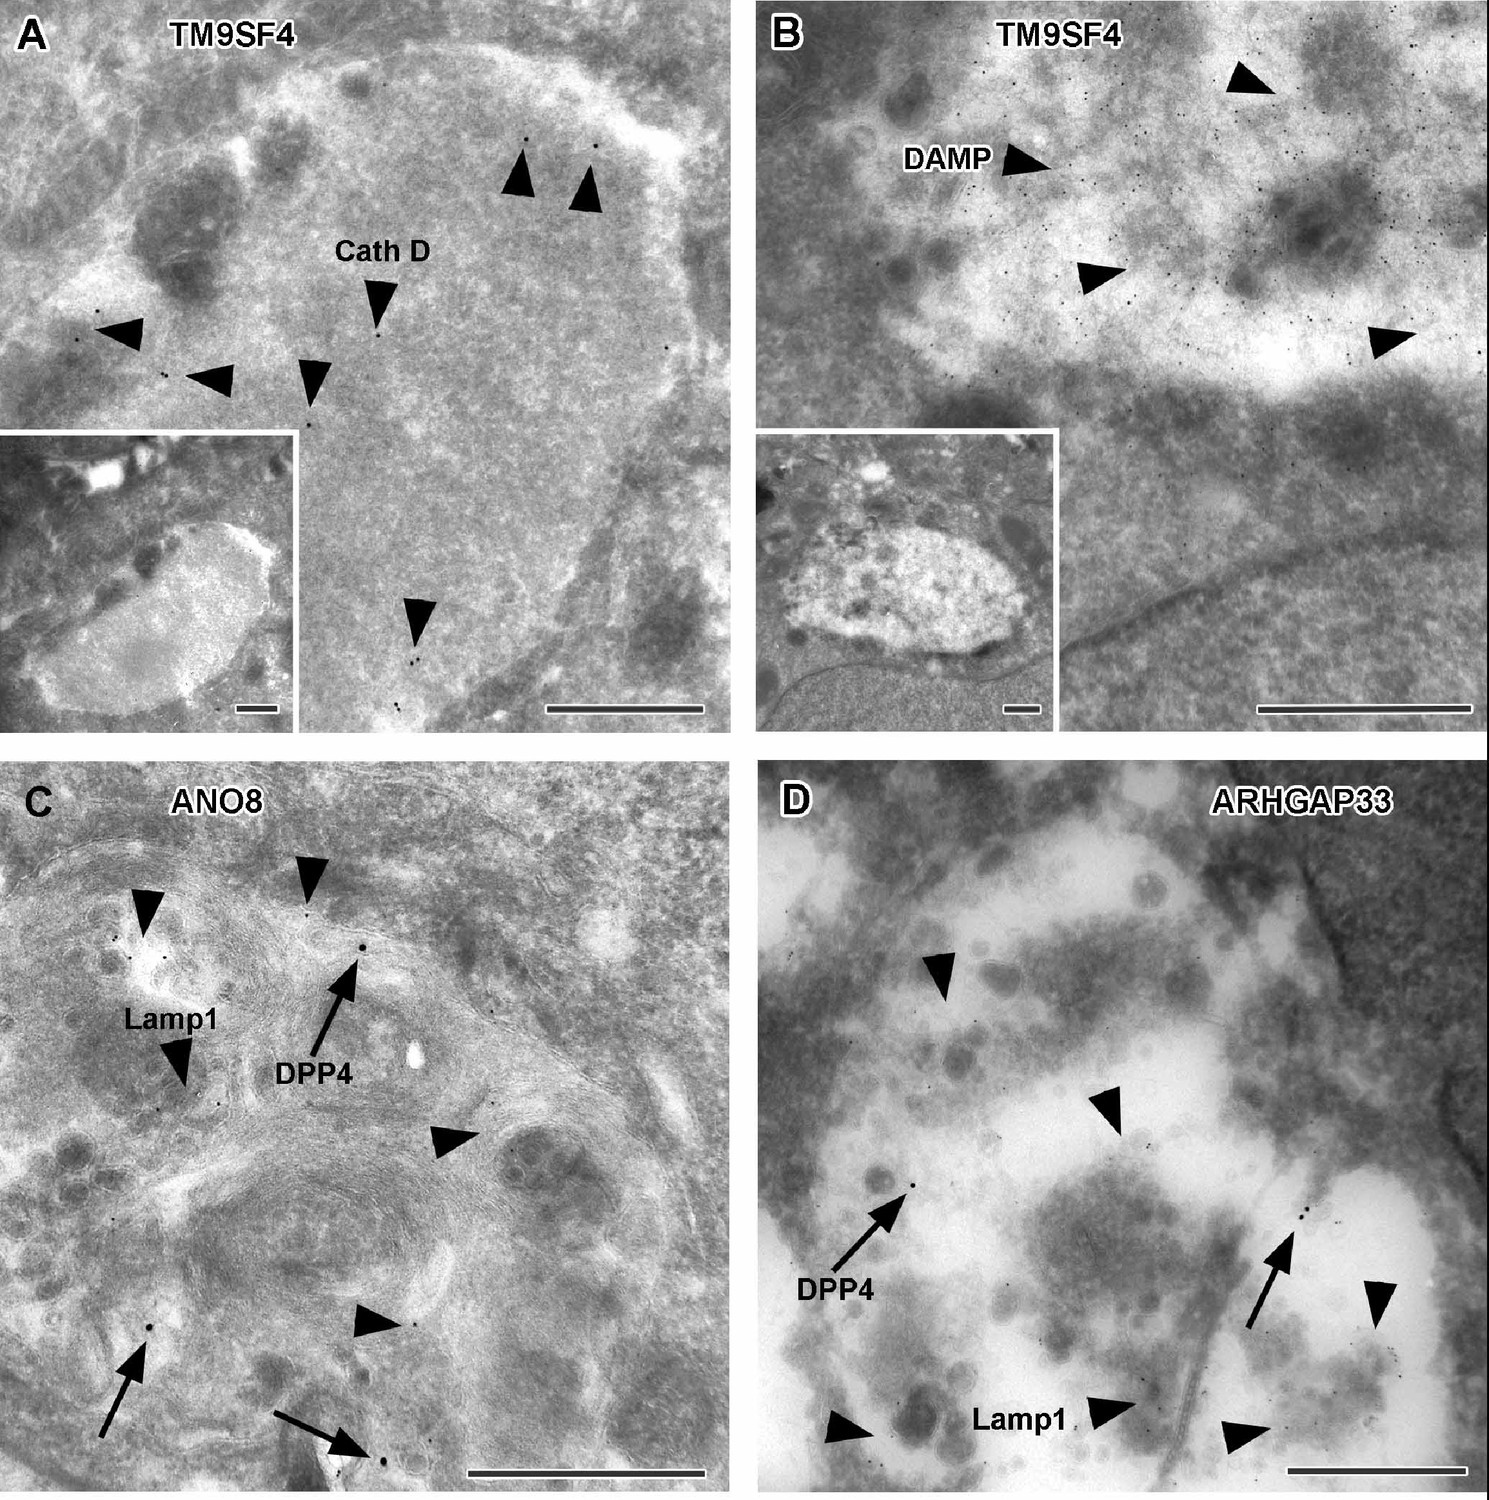
Immunoelectron microscopy of late endocytic and catabolic organelles in selected CaCo2 knockout (KO) cells.
(A, B) Enlarged, poorly structured endolysosomes in TM9SF4 KO cells showing distinct cathepsin D and DAMP-immunogold label (arrowheads) indicative of their acidic contents. Inserts show respective overviews of the depicted organelles. (C, D) Mislocalized DPP4 (arrows) colocalizing with LAMP1 (arrowheads) in enlarged compartments in ANO8 and ARHGAP33-KO cells. (A–D) Scale = 500 nm.
Figure 12

Confocal micrographs of Lamp1 immunofluorescence staining from wildtype (WT) and respective knockout (KO) cell lines.
(A–D) The Lamp1-positive compartments appear enlarged upon KO of TM9SF4 (B) and localize to basolateral regions upon KO of ARHGAP33 (C) (white arrowheads). Scale = 5 µm.
Figure 13
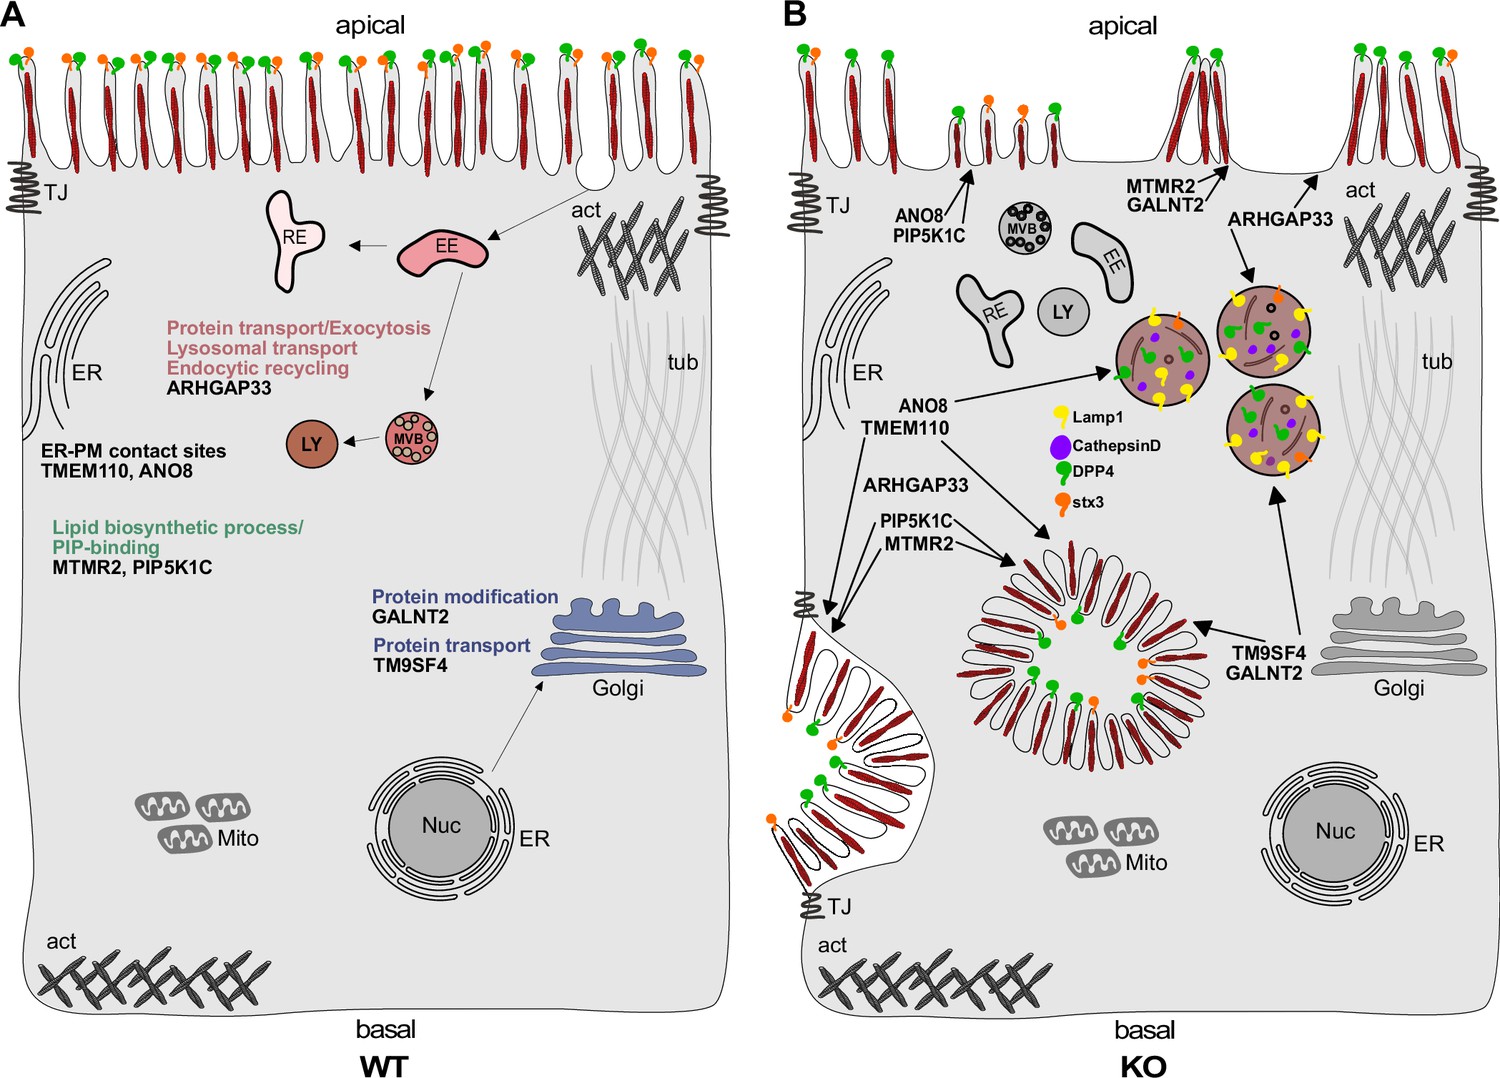
Simplified scheme of the phenotypes observed upon knockout (KO) of ARHGAP33, TM9SF4, PIP5K1C, MTMR2, GALNT2, ANO8, and TMEM110.
(A) Scheme of a healthy enterocyte. The investigated factors for screen validation and further phenotypic characterization are displayed together with their associated gene ontology (GO) terms. (B) KOs of ARHGAP33, TM9SF4, PIP5K1C, MTMR2, GALNT2, ANO8, and TMEM110 lead to the formation of microvillus inclusions and lateral pseudo-apical domains with microvilli. KO of ARHGAP33, TM9SF4, and ANO8 leads to the formation of enlarged late endosomal/lysosomal compartments positive for Lamp1 and cathepsin D and that contain the apical markers DPP4 and stx3. All KOs additionally lead to aberrant, 'tipi-like' assemblies of apical microvilli.
Additional files
-
Supplementary file 1
Raw screen sequencing data and GO analyses.
- https://cdn.elifesciences.org/articles/80135/elife-80135-supp1-v3.xlsx
-
Supplementary file 2
Synopsis of phenotype characteristics of CaCo2-WT versus TM9SF4-, ANO8-, PIP5K1C-, ARHGAP333-, MTMR2-, and TMEM110-KO cells.
- https://cdn.elifesciences.org/articles/80135/elife-80135-supp2-v3.zip
-
Supplementary file 3
Phenotype quantification of CaCo2-WT versus TM9SF4-, ANO8-, PIP5K1C-, ARHGAP333-, MTMR2-, and TMEM110-KO cells.
ELY, endolysosomes; LY, lysosomes; MVI, microvillus inclusions; latMV, lateral microvillar assemblies; par MV, paracellular microvillar clusters.
- https://cdn.elifesciences.org/articles/80135/elife-80135-supp3-v3.zip
-
MDAR checklist
- https://cdn.elifesciences.org/articles/80135/elife-80135-mdarchecklist1-v3.pdf
Download links
A two-part list of links to download the article, or parts of the article, in various formats.
Downloads (link to download the article as PDF)
Open citations (links to open the citations from this article in various online reference manager services)
Cite this article (links to download the citations from this article in formats compatible with various reference manager tools)
A CRISPR screen in intestinal epithelial cells identifies novel factors for polarity and apical transport
eLife 12:e80135.
https://doi.org/10.7554/eLife.80135


