The centrosomal protein 83 (CEP83) regulates human pluripotent stem cell differentiation toward the kidney lineage
- Department of Nephrology and Medical Intensive Care, Charité-Universitätsmedizin Berlin, Germany
- Molecular and Translational Kidney Research, Max Delbrück Center for Molecular Medicine in the Helmholtz Association, Germany
- Department of Pathology, Faculty of Veterinary Medicine, Cairo University, Egypt
- Berlin Institute of Health, Germany
- Department of Nephrology and Hypertension, Hannover Medical School, Germany
- Technology Platform Pluripotent Stem Cells, Max Delbrück Center for Molecular Medicine in the Helmholtz Association, Germany
- Department of Pediatrics, Section of Developmental Biology, University of Colorado School of Medicine, Anschutz Medical Campus, United States
Figures
Figure 1 with 2 supplements
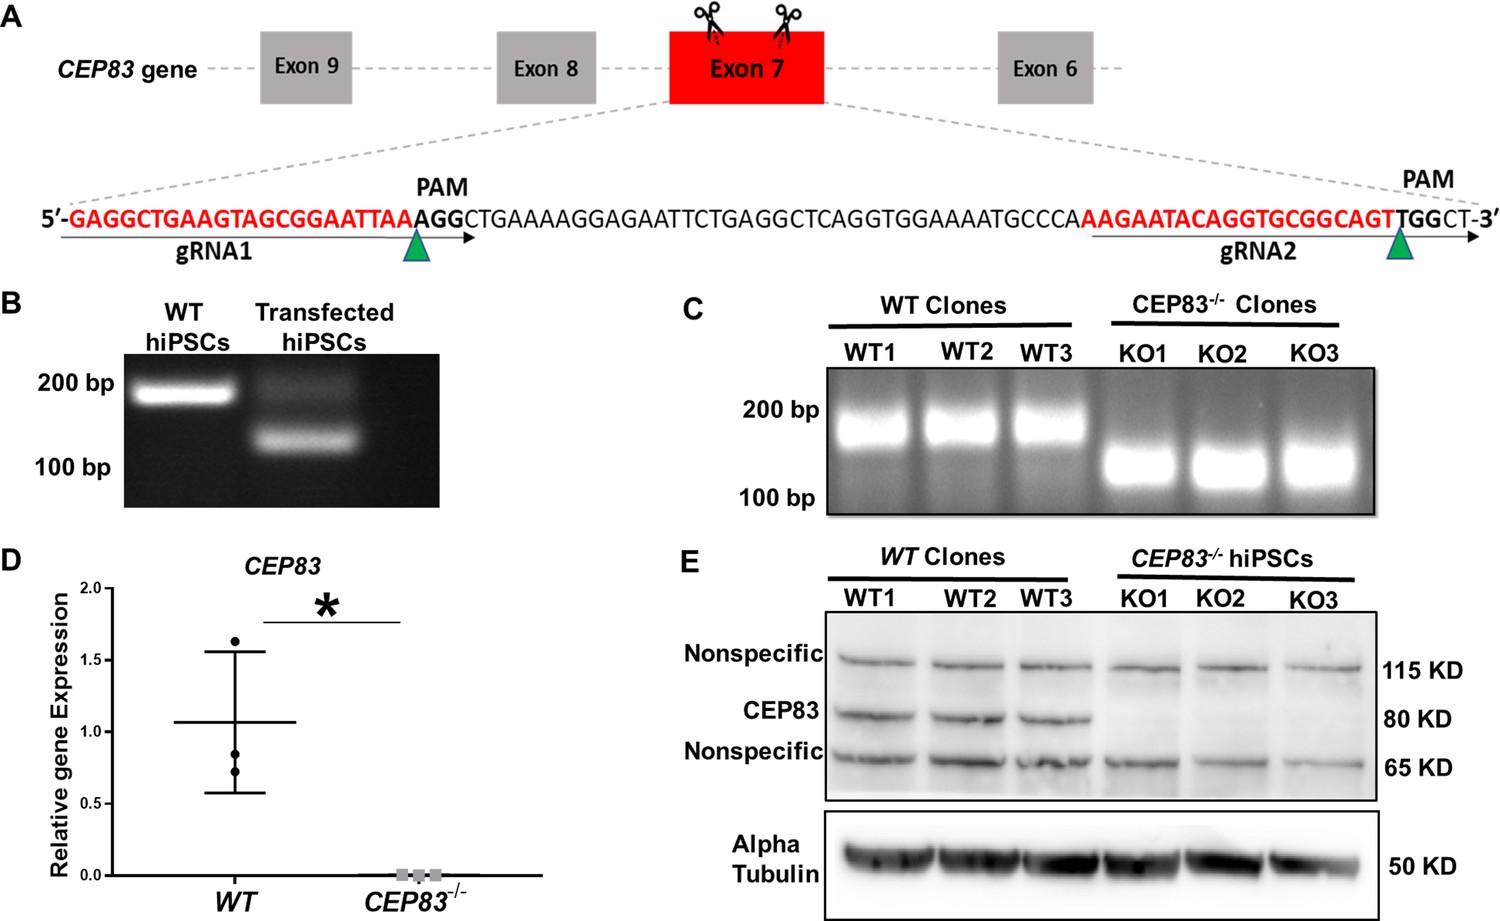
Generation of centrosomal protein 83 (CEP83)-deficient human pluripotent stem cells.
(A) Schematic of the experimental approach to induce a deleting mutation in exon 7 of the CEP83 gene (as described in the methods section). (B) DNA extracted from pooled transfected cells was subjected to PCR, targeting the predicted deletion site in the CEP83 gene. In addition to the 182 bp fragment present in untransfected wildtype (WT) cells, an approximately 120 bp fragment was detected in transfected cells, corresponding to the induced deletion in exon 7. (C) Three clones (CEP83−/− clones KO1, KO2, KO3) carried 62–74 bp deletions within CEP83 exon 7, which led to an induction of premature stop codons or frameshift mutation on both alleles of CEP83. Three wildtype clones (WT1, WT2, and WT3) were used as controls. (D) Quantitative RT-PCR for a fragment corresponding to the deleted region in CEP83 exon 7 produced a detectable signal in RNA extracts from WT clones but not CEP83−/− clones. (E) Immunoblotting of WT and CEP83−/− clones using a CEP83 antibody targeting the C-terminal region of the protein (see Methods for details) indicated a complete loss of the 83 KD band corresponding to CEP83 protein in the three KO clones compared with the three WT clones. Data are mean ± SD.*p<0.05 and **p<0.01 vs. WT. See Figure 1—source data 1 and 2. See also Figure 1—figure supplements 1–2.
-
Figure 1—source data 1
The file contains detailed original PCR gels and immunoblots.
- https://cdn.elifesciences.org/articles/80165/elife-80165-fig1-data1-v2.pdf
-
Figure 1—source data 2
Excel sheet shows RT-qPCR data for mRNA expression of CEP83 in WT and knockout hiPSCs.
- https://cdn.elifesciences.org/articles/80165/elife-80165-fig1-data2-v2.xlsx
-
Figure 1—source data 3
File contains uncropped PCR gels and immunoblots.
- https://cdn.elifesciences.org/articles/80165/elife-80165-fig1-data3-v2.zip
Figure 1—figure supplement 1
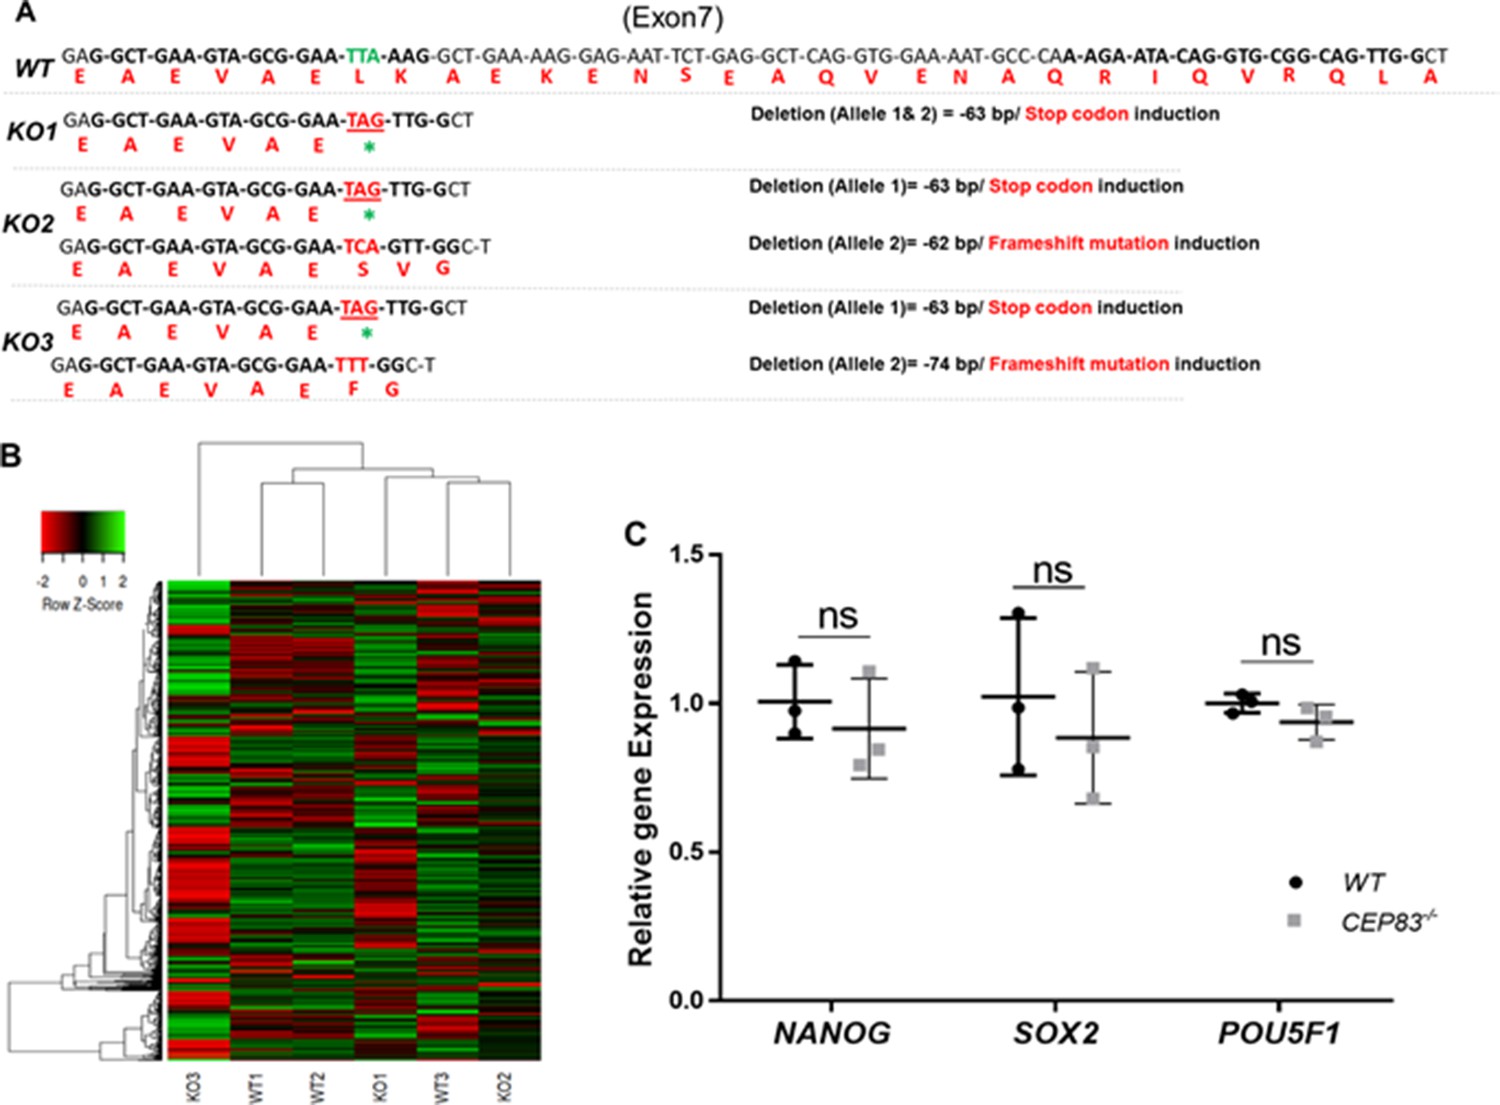
CEP83−/− human-induced pluripotent stem cells (hiPSCs) retain global iPCS cell gene expression signatures and express pluripotency markers.
(A) Alignment of the modified KO clones mRNA and expected amino acid sequences with WT revealed induction of stop codon on both strands of KO1 clone. While KO2 clone shows induction of stop codon on one allele and frameshift mutation within the second allele with 62 bp deletion. KO3 clone sequence shows induction of stop codon on one allele and frameshift mutation with 74 bp deletion in the second allele. (B) Heatmap showing the expression of the top 1000 highly variable genes (see Methods, with a selection of transcripts per million ≥10) within WT (WT1, WT2, and WT3) and CEP83−/− hiPSCs (KO1, KO2, and KO3) clones. Unbiased hierarchical clustering of clones indicates that gene expression similarity is not driven by WT or KO status. (C) RT-PCR shows no significant differences in the expression of pluripotency markers NANOG, SOX2, and POU5F1 between WT and CEP83−/− hiPSCs. n=3 hiPSCs clones per group. Data are mean ± SD. ns, not significant.
Figure 1—figure supplement 2
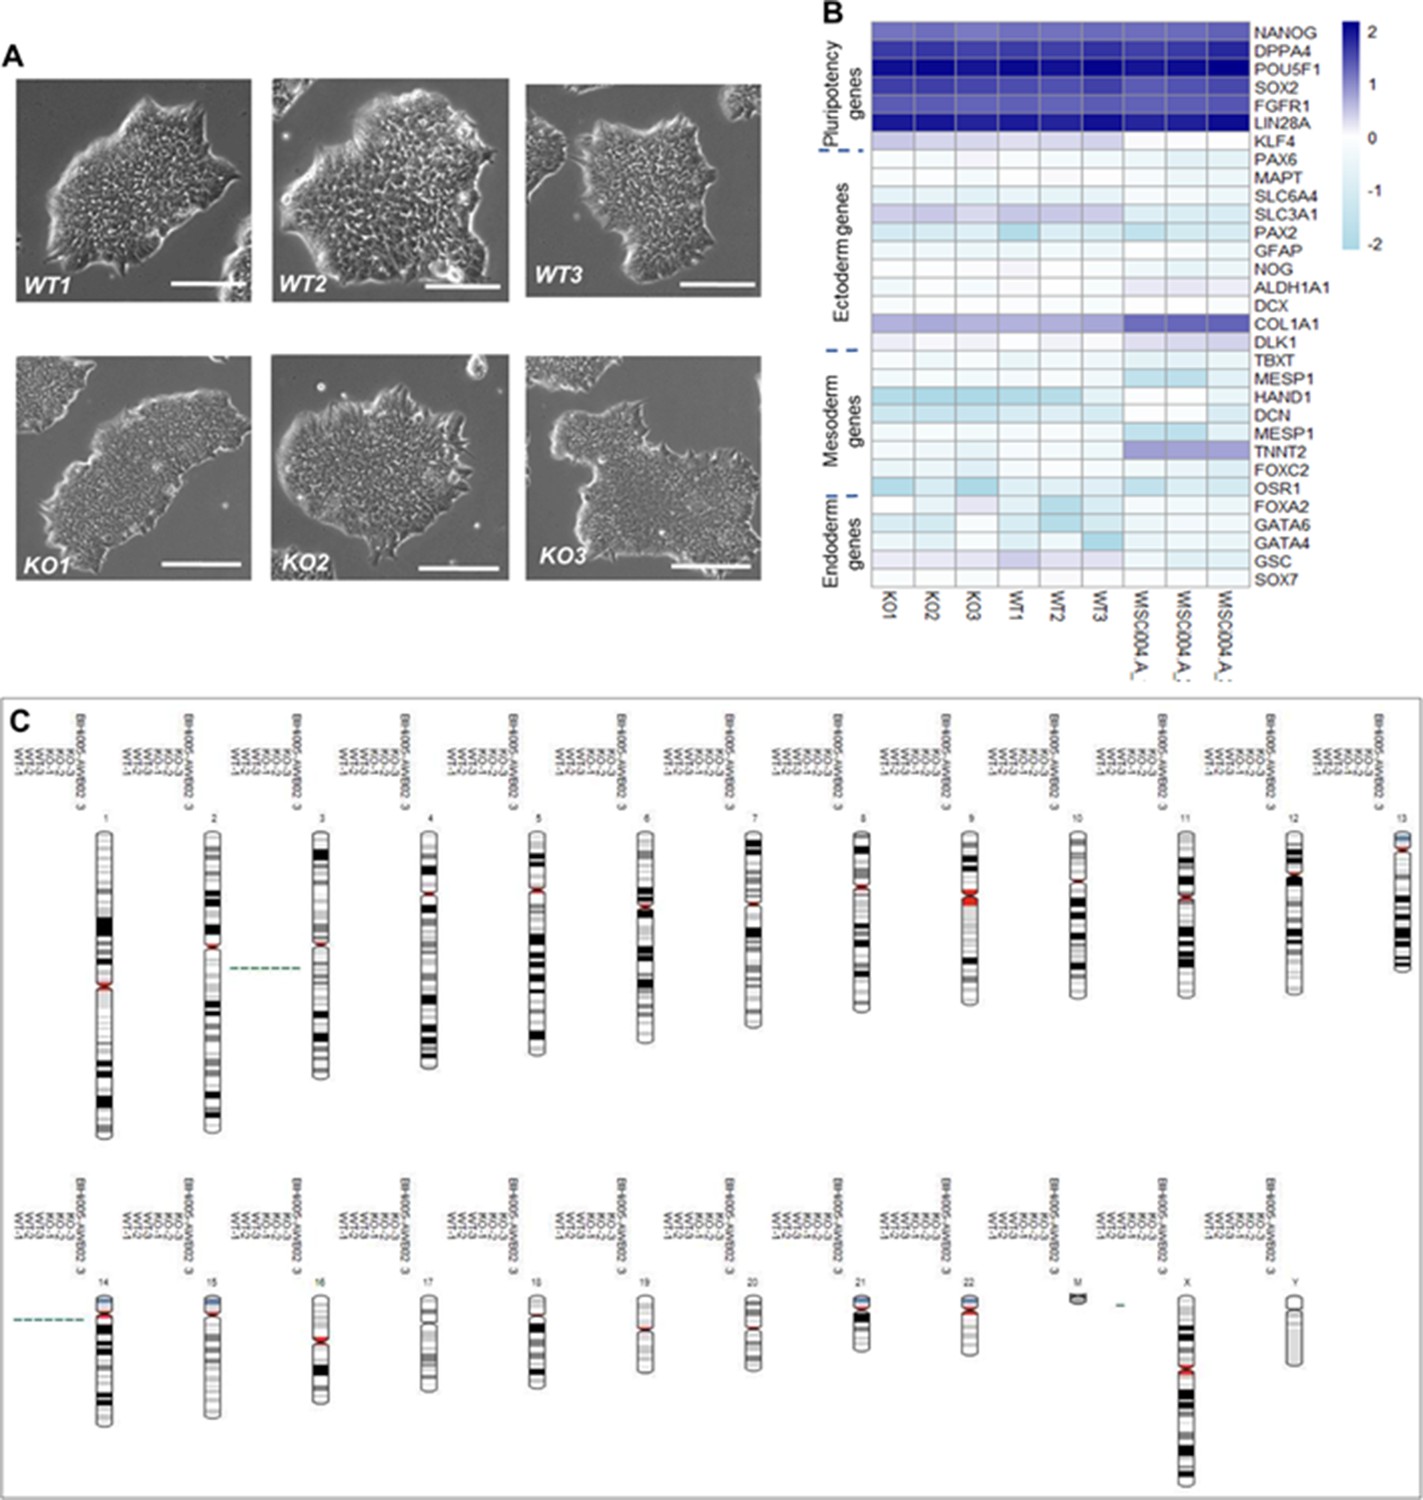
Phenotypical, molecular, and genetic characterization of CEP83−/− human-induced pluripotent stem cells (hiPSCs) versus the wildtype hiPSCs.
(A) CEP83−/− hiPSCs clones (KO1, KO2, and KO3) show similar morphology to the WT clones (WT1, WT2, and WT3) under the bright field microscope, scale bar = 200 µm. (B) Using bulk RNA sequencing data, transcripts per million values for marker genes for pluripotency, ectodermal, mesodermal, and endodermal cells were plotted across the samples (KO1, KO2, KO3, WT1, WT2, and WT3). In addition, gene expression of the six samples was compared to three wildtype hiPSCs (WISCi004-A, also referred to as IMR90-4 iPS derived from female lung fbroblasts) that were previously published (Hariharan et al., 2019). (C) The three WT clones, three KO clones, and the parental population were karyotyped using single nucleotide polymorphism - analysis, demonstrating unaffected integrity of karyotypes. Two aberrations (one gain on Chr3 and one gain on Chr14) present in BIHi005-A were previously reported (https://hpscreg.eu/cell-line/BIHi005-A, Berlin Institute of Health Stem Cell Core Facility).
Figure 2 with 1 supplement
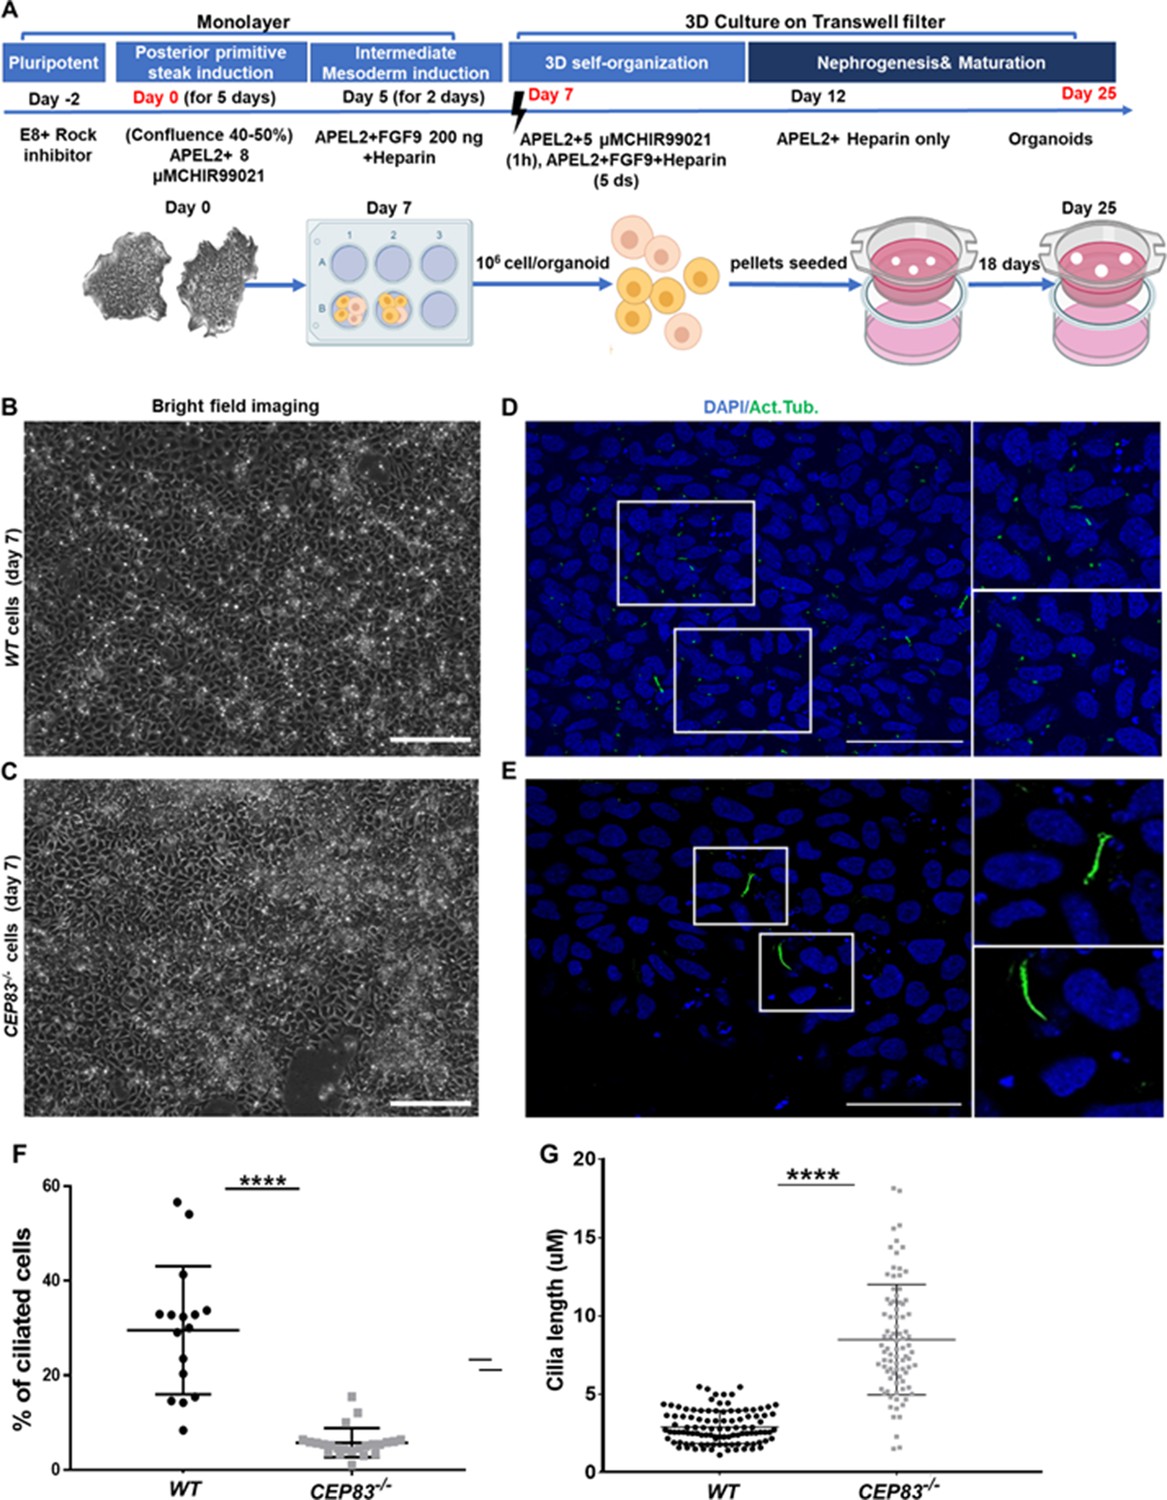
Differentiation of CEP83−/− human-induced pluripotent stem cells (hiPSCs) to intermediate mesoderm cells (day 7) is associated with defective ciliogenesis.
(A) The schematic illustrates the applied differentiation protocol of hiPSCs, as previously described by Takasato et al., 2015. (B–C) WT and CEP83−/− cells on 7 days of culture (D7) of differentiation did not show overt morphological differences by brighfield microscopy. (D–E) Representative images of WT and CEP83−/− cells on D7, immunostained for acetylated tubulin (green) and nuclei (DAPI, blue), revealing fewer and elongated cilia in CEP83−/− cells. (F) Quantitative analysis of the percentage of ciliated cells in WT and CEP83−/− cells (D7). (G) Quantitative analysis of the ciliary length in WT and CEP83−/− cells (D7). n=3 clones per group. ****p<0.0001. Bar = 50 μm. See Figure 2—figure supplement 1.
Figure 2—figure supplement 1
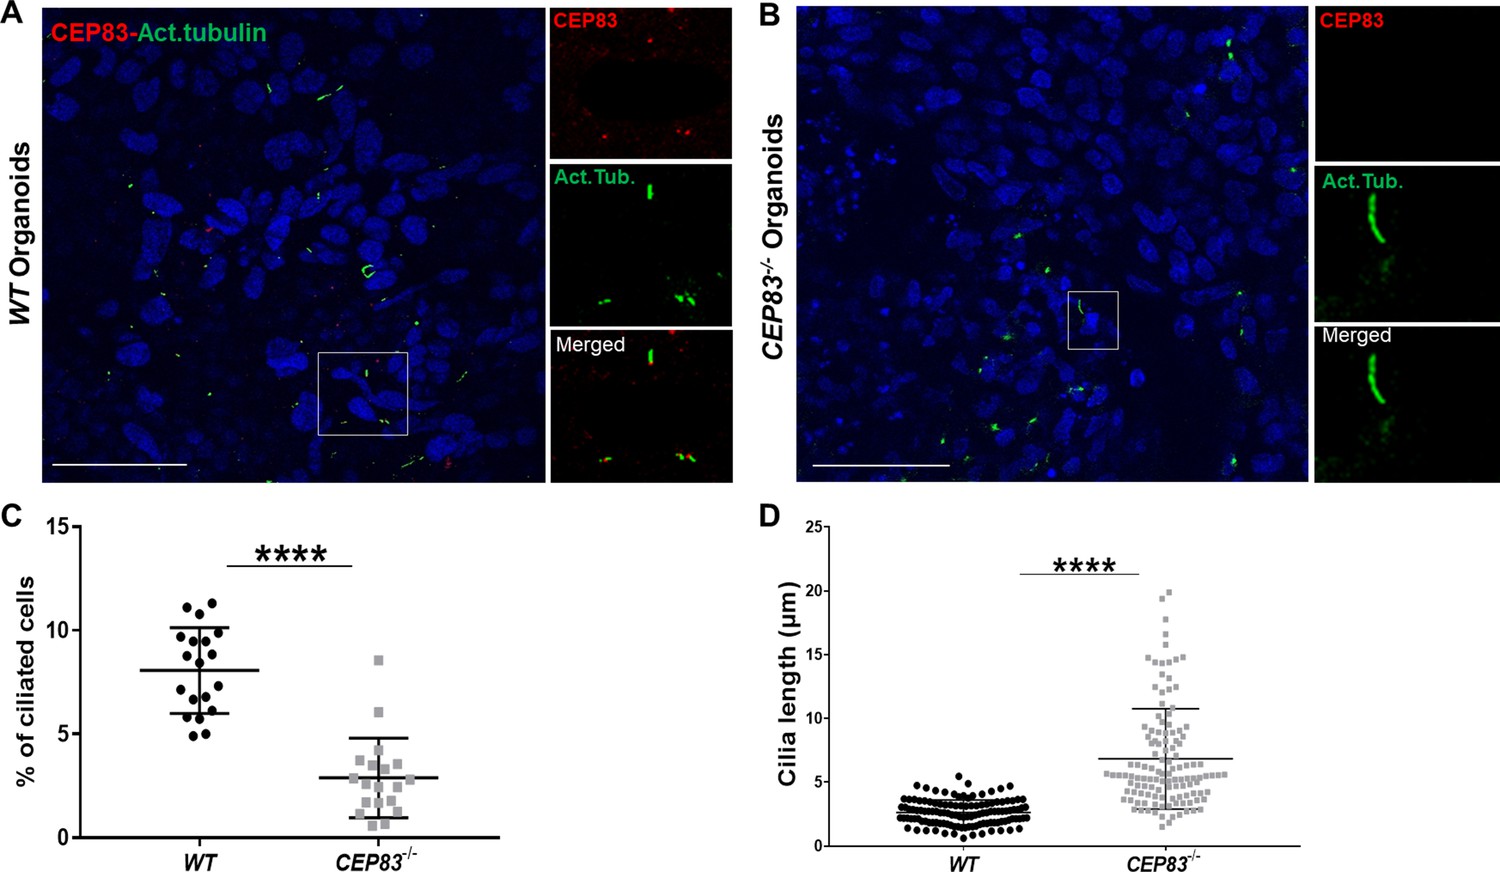
Loss of CEP83 in organoids results in defective ciliogenesis.
(A) Immunofluorescence staining of wildtype (WT) and CEP83−/− organoids for acetylated tubulin (green), CEP83 protein (red), and nuclear staining 4',6-diamidino-2-phenylindole dihydrochloride (DAPI). Note CEP83 localization at the base of the cilium in WT organoids. (B) Quantitative analysis of ciliated cells showing downregulation of the number of ciliated cells in CEP83−/− organoids, associated with longer cilium formation (C). n=3 clones per group. Data are mean ± SD. ****p<0.0001. Panel A–B: Bar = 50 μm.
Figure 3 with 2 supplements
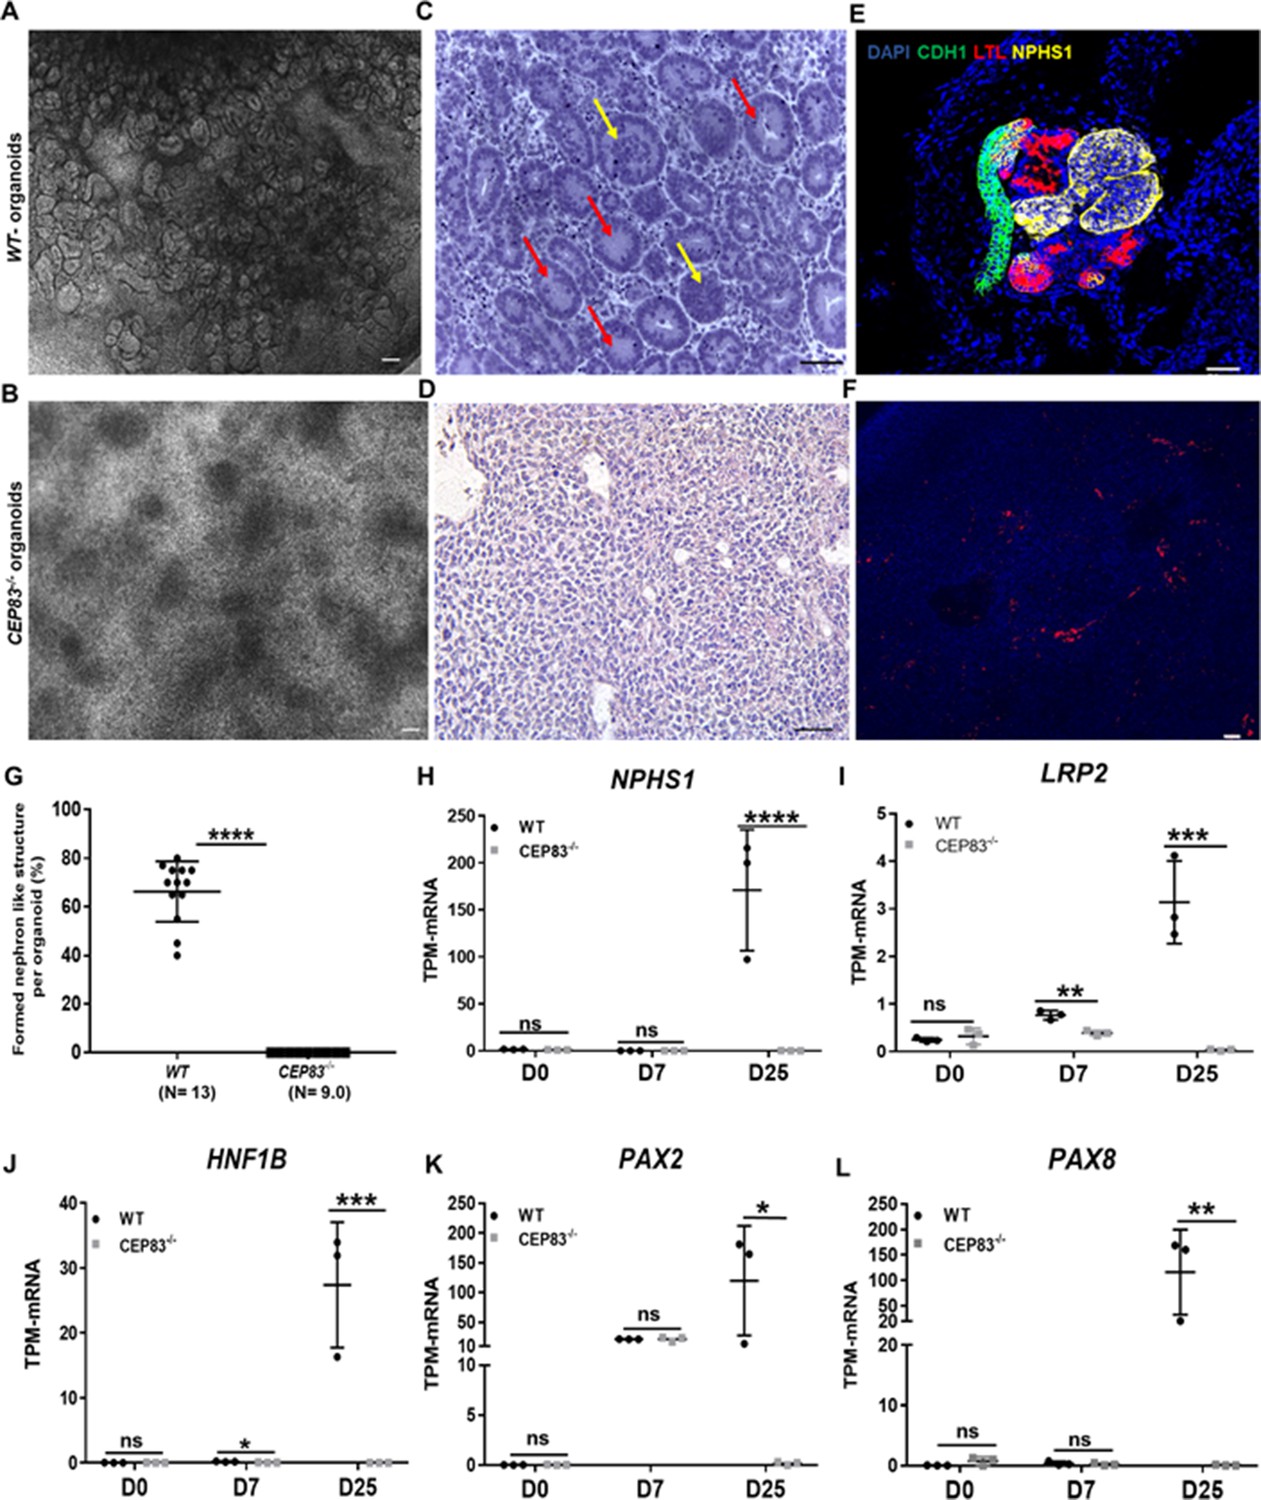
Defective kidney organoid differentiation from CEP83-deficient pluripotent stem cells.
(A, B) Brightfield images of organoids after a total of 25 days of culture (D25) indicate the formation of multiple kidney-like structures in WT organoids (A), whereas CEP83−/− organoids are composed of uniform clusters (B). (C, D) Representative images of hematoxylin-eosin–stained sections of organoids. WT organoids (C) display glomerulus-like (yellow arrows) and tubular (red arrow) components, whereas CEP83−/− organoids (D) are composed of monomorphic mesenchymal-like cells. (E–F) Whole mounting immunostaining of organoids for NPHS1 (podocyte marker), LTL (proximal tubule marker), and CDH1 (distal tubule marker) indicates segmented nephron-like structures in WT organoids (E), and the absence of such structures in CEP83−/− organoids (F). (G) Quantitative analysis of brightfield images indicating the estimated percentage of organoid area composed of nephron-like structures, organoids were collected from three different experiments. (H–L) Gene expression (transcripts per million [TPM]) of NPHP1 (H), LRP2 (I), HNF1B (J), PAX2 (K), and PAX8 (L) in WT and CEP83−/− cells at the indicated time points based on bulk RNA sequencing. n=3 clones per group. Data are mean ± SD. *p<0.05, **p<0.01, ***p<0.001, and ****p<0.0001. ns = not significant. Panels A–F: Bar = 50 μm. See Figure 3—source data 1 and 2. See also Figure 3—figure supplements 1–2.
-
Figure 3—source data 1
The data shows the quantitative analysis of the percent of nephron formation per organoid in knockout organoids versus WT organoids.
- https://cdn.elifesciences.org/articles/80165/elife-80165-fig3-data1-v2.xlsx
-
Figure 3—source data 2
The sheet shows the plotted TPM values of mRNA sequencing analysis in Figure 3L-H for the expression of renal epithelial marker genes in KO and WT at days 0, 7, and 25 of the differentiation.
- https://cdn.elifesciences.org/articles/80165/elife-80165-fig3-data2-v2.xlsx
Figure 3—figure supplement 1
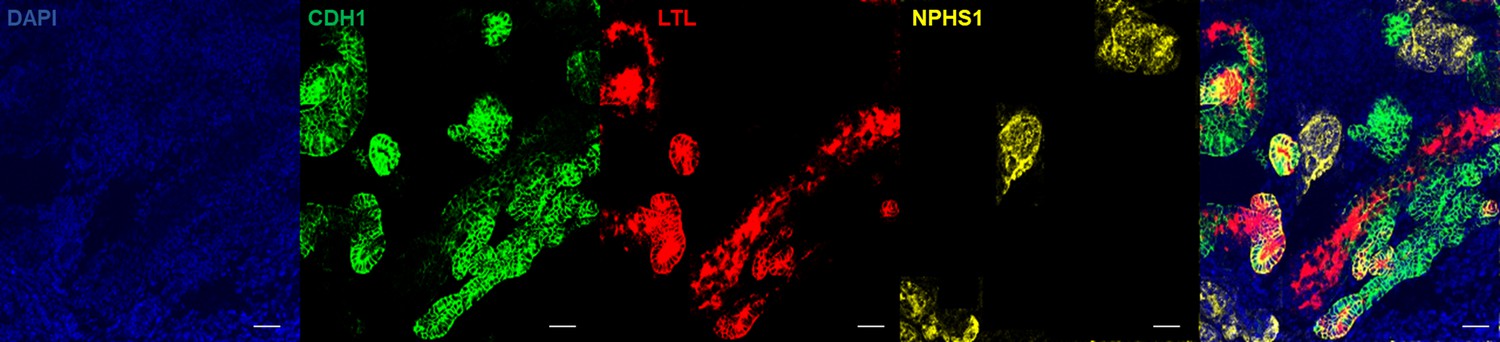
Whole mount immunostaining of the wildtype organoids shows positive staining for NPHS1 (podocyte marker), LTL (proximal tubule marker), and CDH1 (distal tubule marker).
Bar = 50 µm.
Figure 3—figure supplement 2
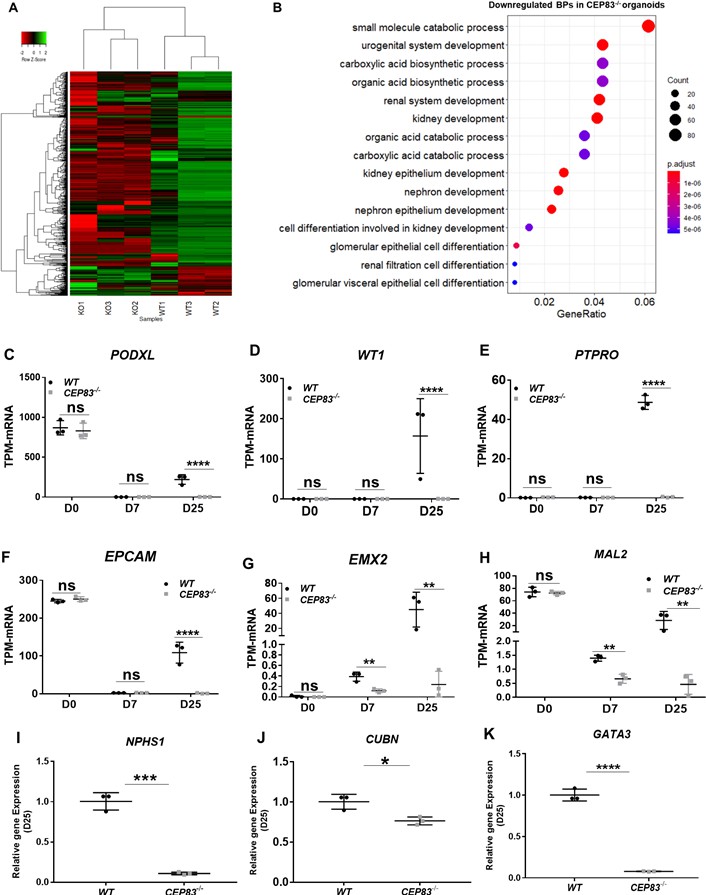
mRNA analysis of organoids differentiated for 7+ (18) days indicates marked differences in global gene expression in CEP83−/− (KO1–KO3) compared to wildtype (WT1–WT3) organoids.
(A) Heatmap displaying the expression of the top 1000 highly variable genes (see Methods, transcripts per million [TPM] ≥10) using bulk RNA within WT (WT1, WT2, WT3) and CEP83−/− (KO1, KO2, KO3) organoids. Hierarchical clustering of clones indicating that global gene expression is profoundly different in WT and KO organoids. Ontology analysis of the biological processes (BPs) using the top 100 downregulated genes (based on fold change values) in CEP83−/− organoids (TPM >2, fold change >1.5, p-value calculated on log10 TPM <0.05) using DOSE and cluster profile packages in R2. The analysis shows downregulation of many BPs associated with kidney development in CEP83-mutated organoids, as shown in the dot plot (B). Bulk RNA sequencing shows downregulation of specific renal epithelial cells marker genes at day 25, including (C–E) PODXL, WT1, and PTPRO for podocytes, (F– H) EPCAM, EMX2, and MAL2 marker genes for the distal nephron precursor cells. RT-PCR confirms that the expression of some nephron markers, including (I) NPHS1 (podocytes), (J) CUBN (proximal tubules), and (K) GATA3 (distal tubules and collecting duct) was significantly downregulated in CEP83−/− organoids. n=3 clones per group. Data are mean ± SD. *p<0.05, **p<0.01, ***p<0.001, and ****p<0.0001. ns = not significant.
Figure 4 with 3 supplements
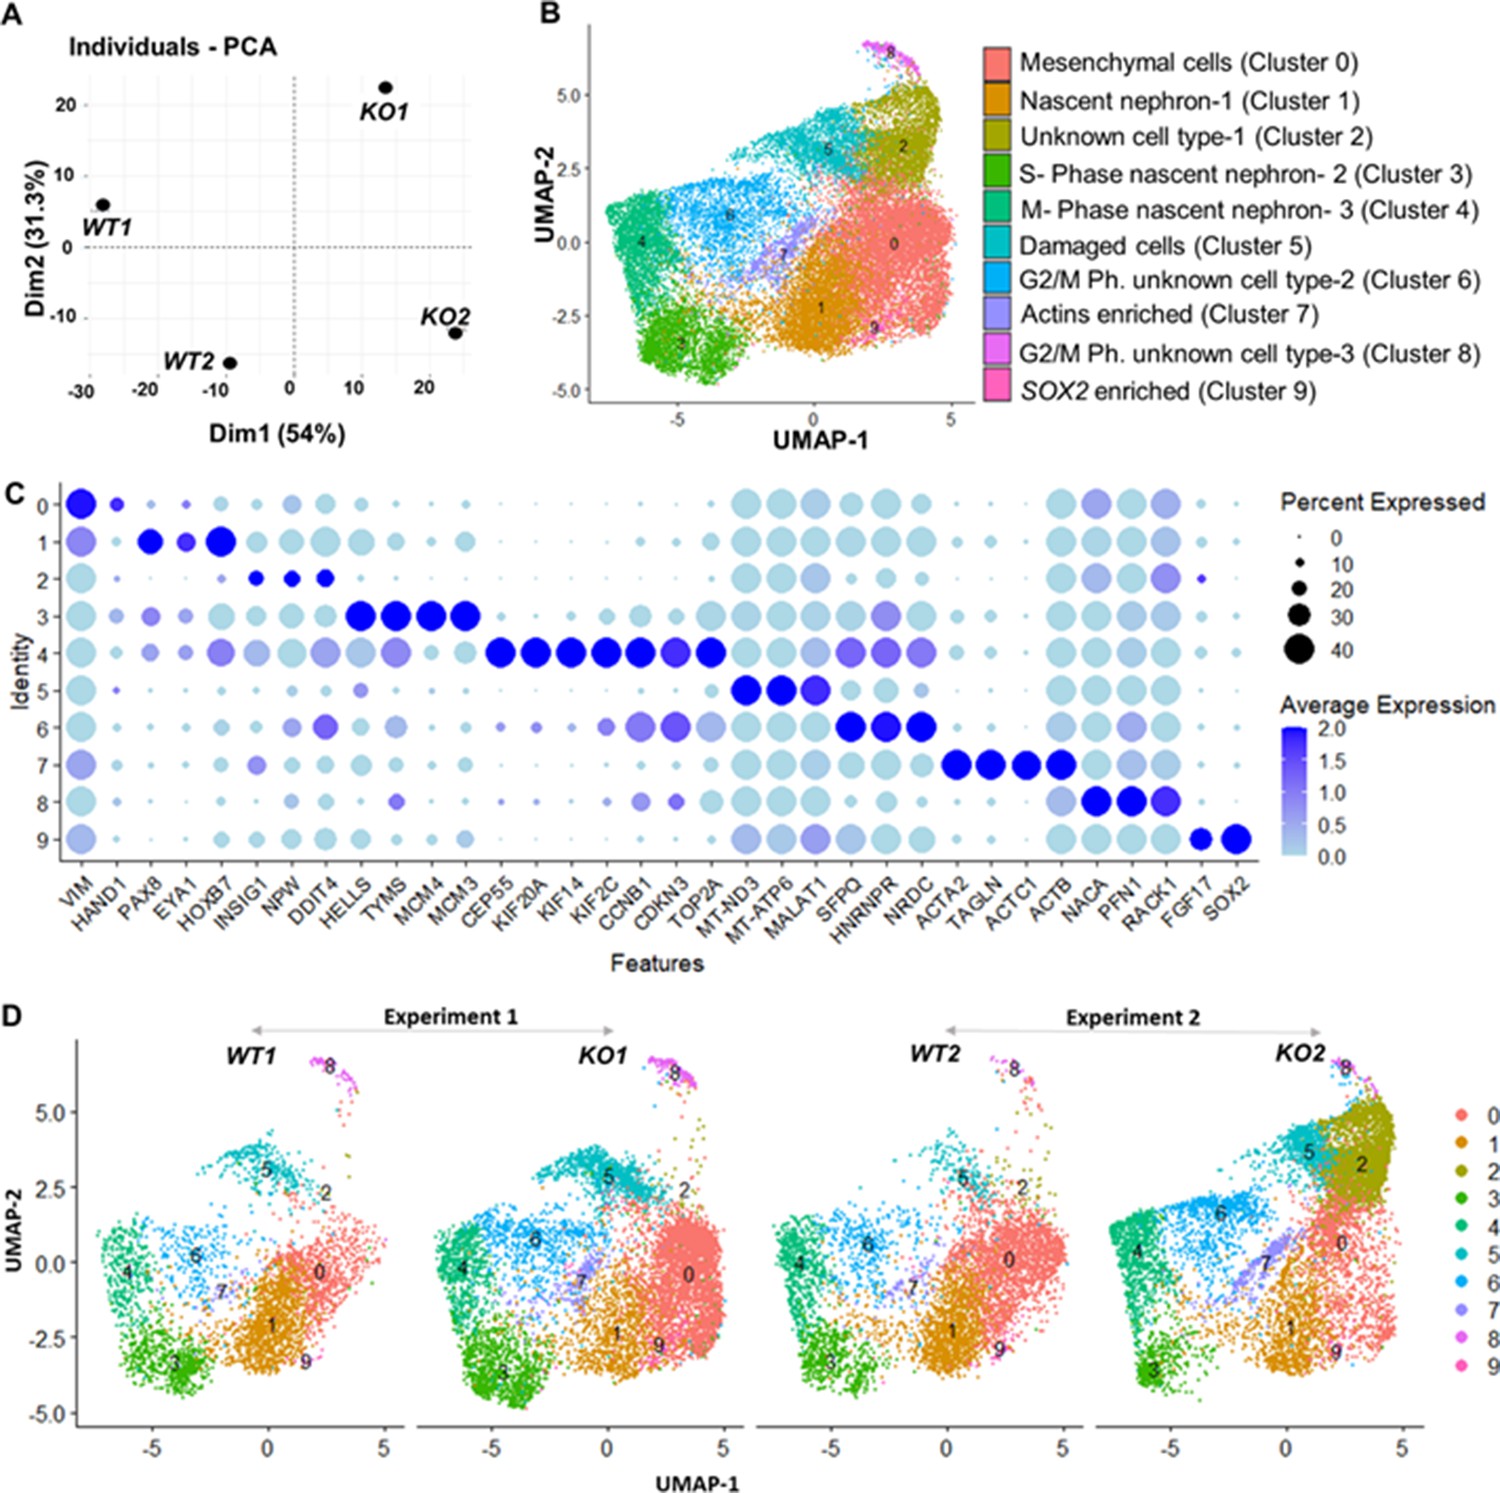
Gene expression differences of wildtype (WT) and CEP83−/− D7 monolayers based on bulk and single-cell transcriptomics.
(A) Principal component analysis (PCA) of WT (WT1, WT2) and CEP83−/− (KO1, KO2) cells at day 7 using the average gene expression of the top highly variable 1000 genes in pseudo-bulk scRNA sequencing data. The % variation explained by each PCA axis is indicated in brackets. (B) PCA eigenvalues indicate that the principal components, Dim 1 (54%) and Dim 2 (31.3%), account for 85.3% of the expression differences. Dim 1 separates the WT samples from the KO samples, while Dim 2 separates experiment 1 (WT1, KO1) from experiment 2 (WT2, KO2). (B) Uniform manifold approximation and projection (UMAP) of scRNA-seq profiles from 27,328 cells from two wildtype clones (WT1, WT2) and two CEP83−/− clones (KO1, KO2) derived from two separate experiments (experiment 1: WT1, KO1; experiment 2: WT2, KO2). Unbiased clustering resulted in 10 clusters, and (C) dot plots show expression of selected marker genes of each cluster. (D) UMAP plots for WT and KO samples show the distribution of all clusters per sample (N=2 per group) in B–D. See Figure 4—figure supplements 1–3. Source data is available as described in section (Data availability).
Figure 4—figure supplement 1
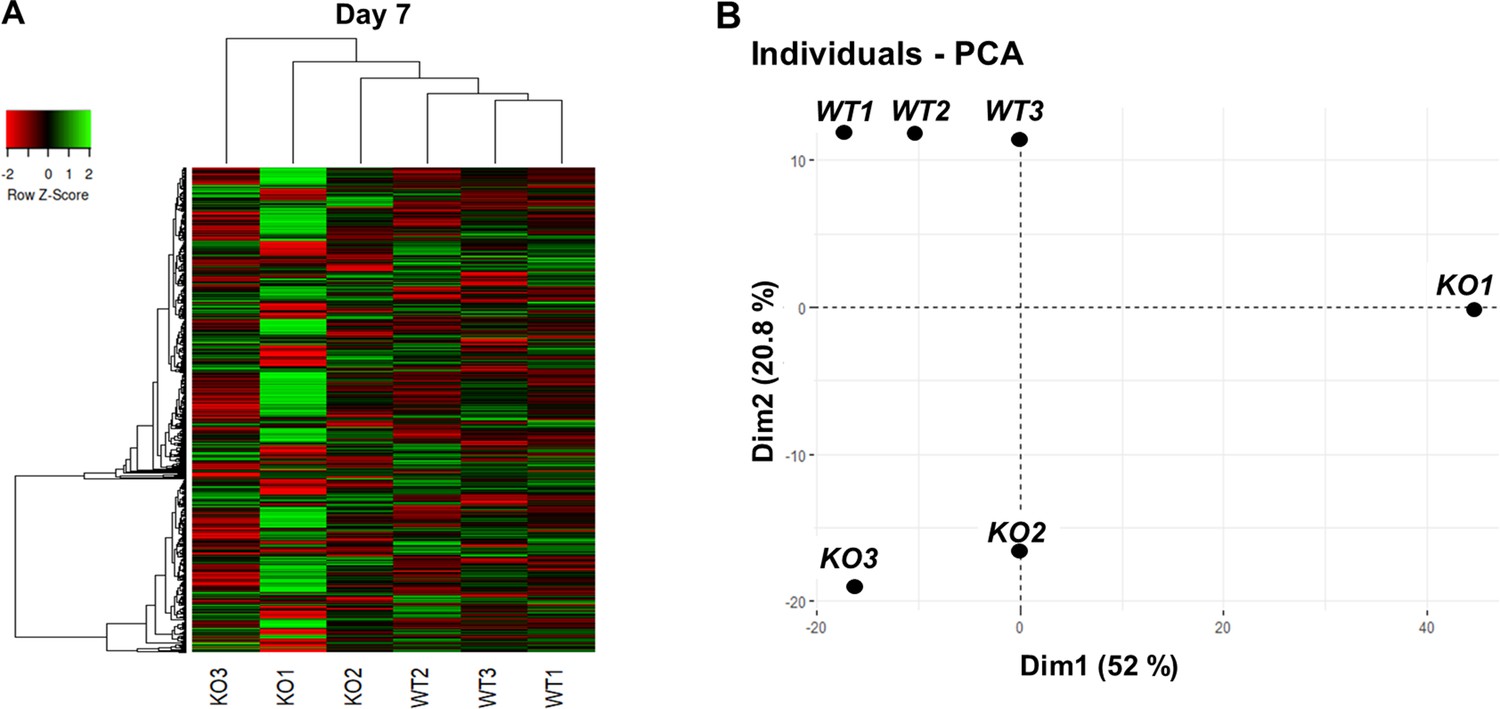
Bulk RNA sequencing shows mild overall gene expression differences between WT and CEP83-deficient cells at day 7 of differentiation.
(A) Heat map of bulk RNA-seq data showing the most highly variable 1000 genes (see Methods, maximum transcripts per million ≥10) within wildtype (WT1, WT2, and WT3) and CEP83−/− (KO1, KO2, and KO3) clones at day 7 of differentiation. Unbiased hierarchical clustering of clones separates CEP83−/− and WT transcriptomes. (B) Principal component analysis (PCA) of WT (WT1, WT2, WT3) and CEP83−/− (KO1, KO2, KO3) cells at day 7 using the average gene expression of the top highly variable 1000 genes in bulk RNA sequencing data. The % variation explained by each PCA axis is indicated in brackets. PCA eigenvalues indicate that the principal components, Dim 1 (52%) and Dim 2 (20.8%), account for 85.3% of the expression differences. Dim 1 separates the KO1 sample from the other samples, while Dim 2 separates experiment 1 (WT1, WT2, WT3) and (KO1, KO2, KO3).
Figure 4—figure supplement 2
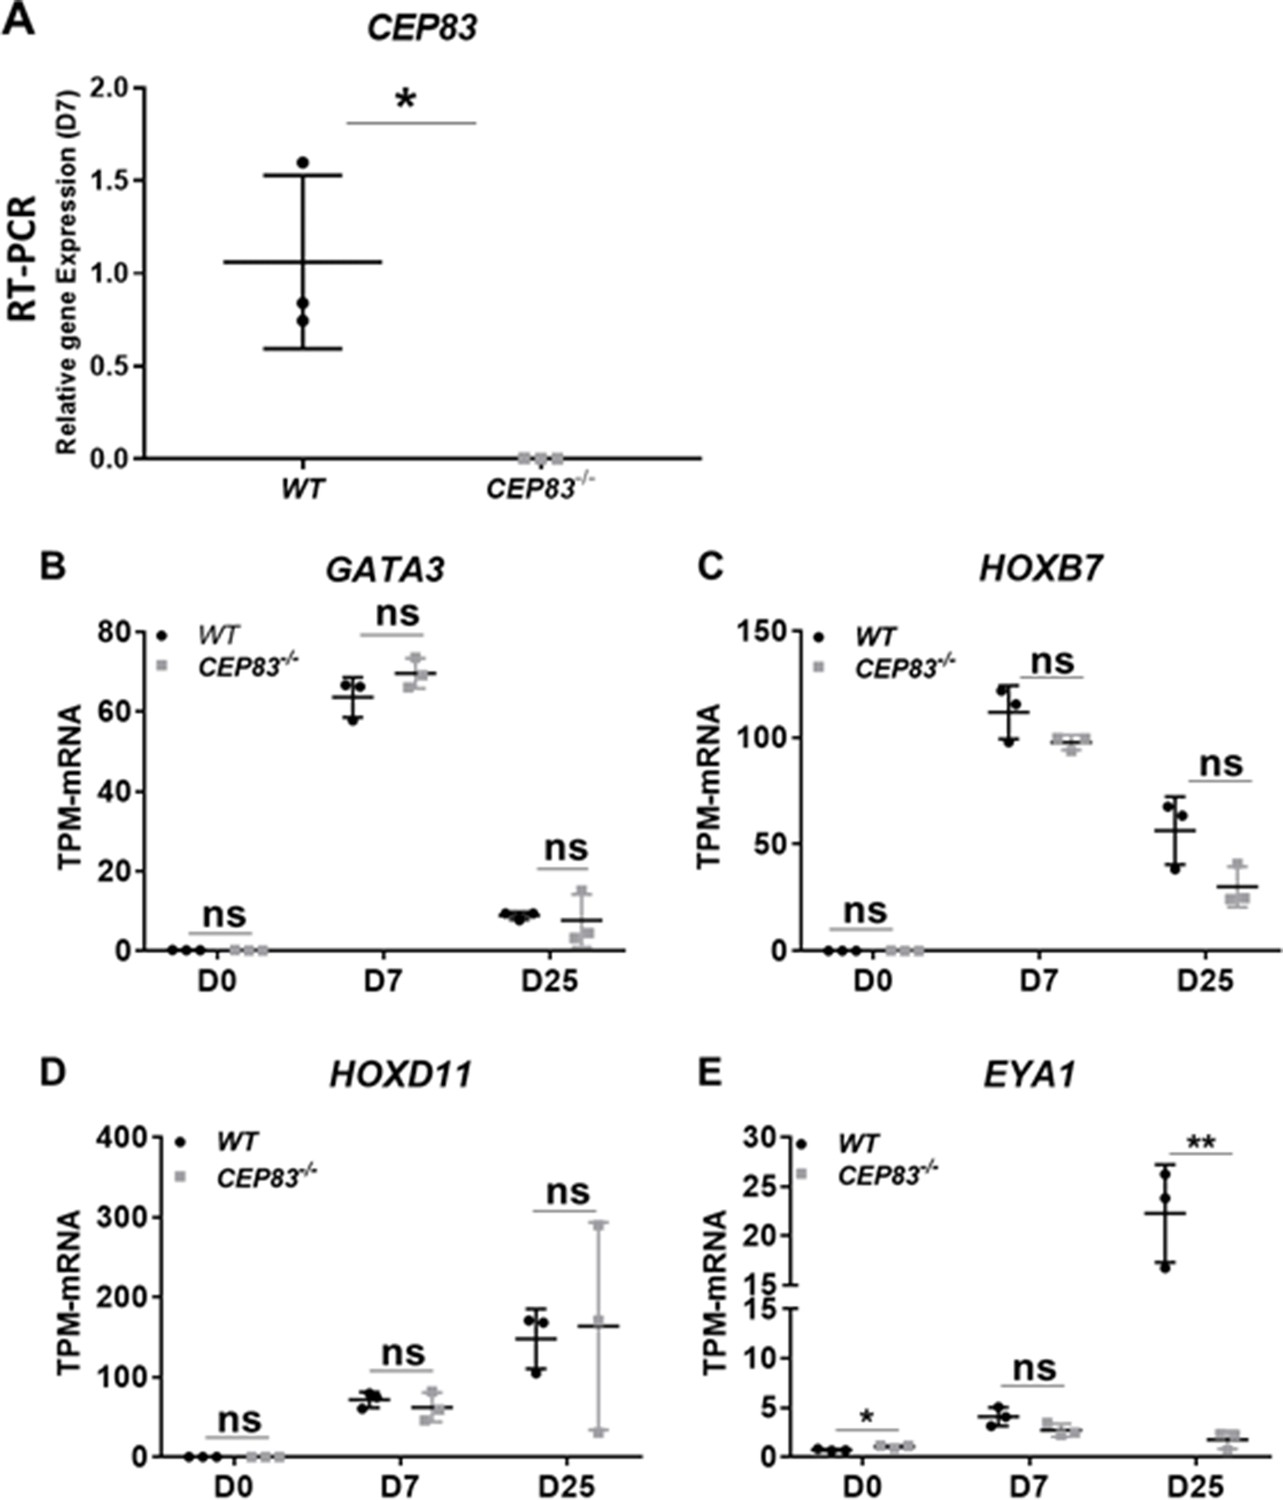
Expression of intermediate mesoderm marker genes in WT and CEP83−/− human-induced pluripotent stem cells (hiPSCs) after 7 days of differentiation in a monolayer culture.
(A) mRNA expression of CEP83 was significantly downregulated in the CEP83−/− clones on day 7. The expression was investigated in bulk RNA seq data and confirmed by RT-PCR. (B–C) Using bulk RNA sequencing data, the expression of ureteric bud marker genes including GATA3 and HOXB7 shows no significant change between WT and mutated cells at days 0, 7, and 25. While, (C–D) MM marker genes including HOXD11 and EYA1 show no significant difference between WT and CEP83−/− cells on days 0, 7, and 25 except EYA1 show significant downregulation in the mutated cells on day 25. n=3 clones per group. Data are mean ± SD. *p<0.05 and **p<0.01. ns = not significant.
Figure 4—figure supplement 3
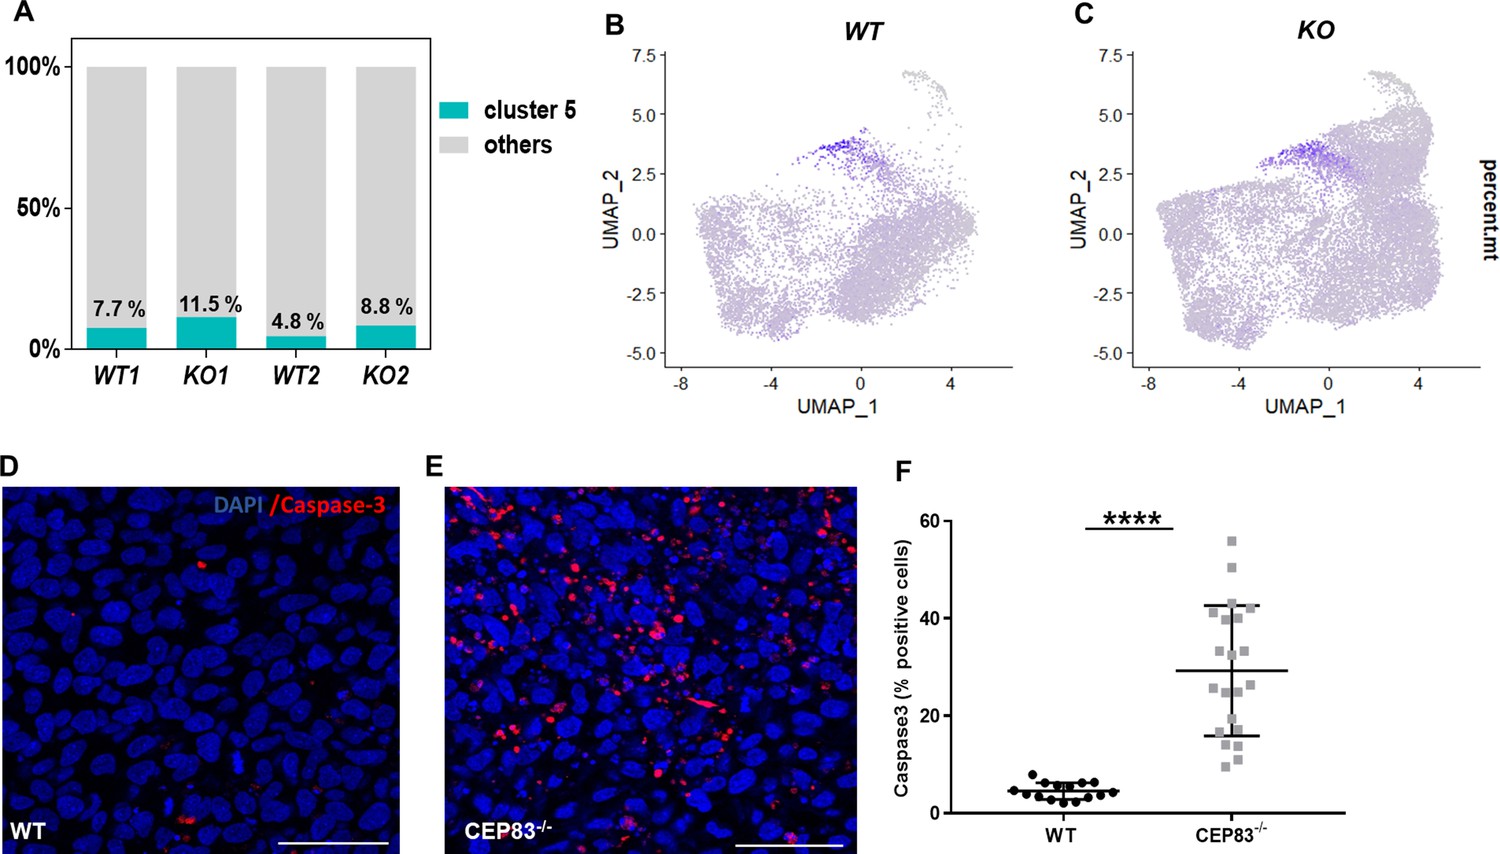
CEP83 loss induces apoptosis at day 7 of differentiation.
(A) Single-cell RNA sequencing data shows that the cell proportion of damaged cells (cluster 5) in the wildtype samples (WT1, WT2) is numerically lower than that in CEP83−/− cells (KO1, KO2). (B, C) Feature plots of the percentage of mitochondrial RNAs (percent.mt) in WT and CEP83−/− cells demonstrating an upregulation in cluster 5. (D, E, F) Staining of day 7 cells for active caspase 3 indicates significantly more apoptotic cells in CEP83−/− compared to WT cells. n=2 clones per group in A–E, and n=3 clones per group in F–H. ****p<0.0001. Panel D–E: Bar = 50 μm.
Figure 5 with 3 supplements
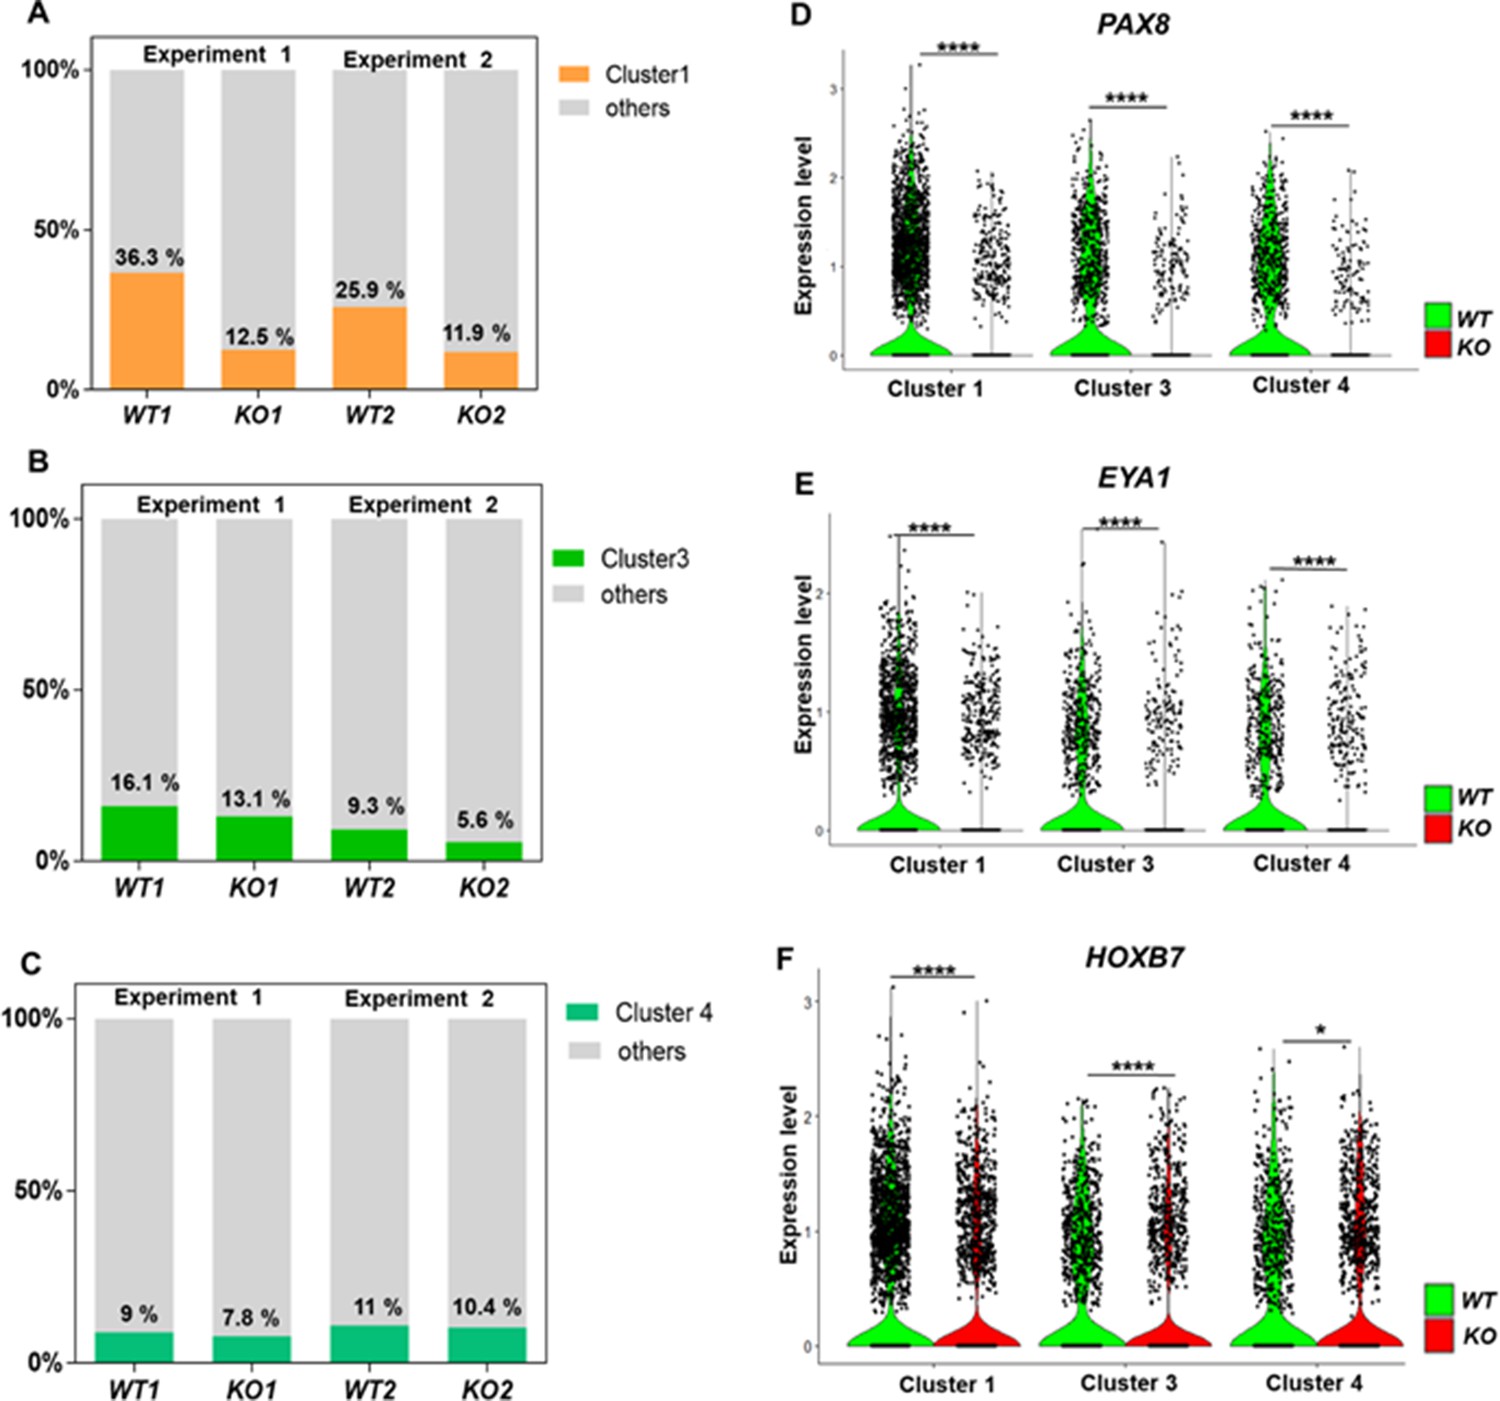
Defective kidney progenitor differentiation from CEP83−/− cells after 7 days of monolayer induction.
(A, B, C) Proportions of cells from kidney progenitor clusters 1 (A), 3 (B), and 4 (C) among wildtype (WT1, WT2) and CEP83−/− (KO1, KO2) cells. (D, E, F) Violin plots of gene expression of kidney progenitor genes PAX8 (D), EYA1 (E), and HOXB7 (F) within kidney progenitor clusters 1, 3, and 4 comparing wildtype (WT) and CEP83−/− (KO) cells. N=2 per group. *p<0.05 and ****p<0.0001. Figure 5—figure supplements 1–2. Source data is available as described in section (Data availability).
Figure 5—figure supplement 1
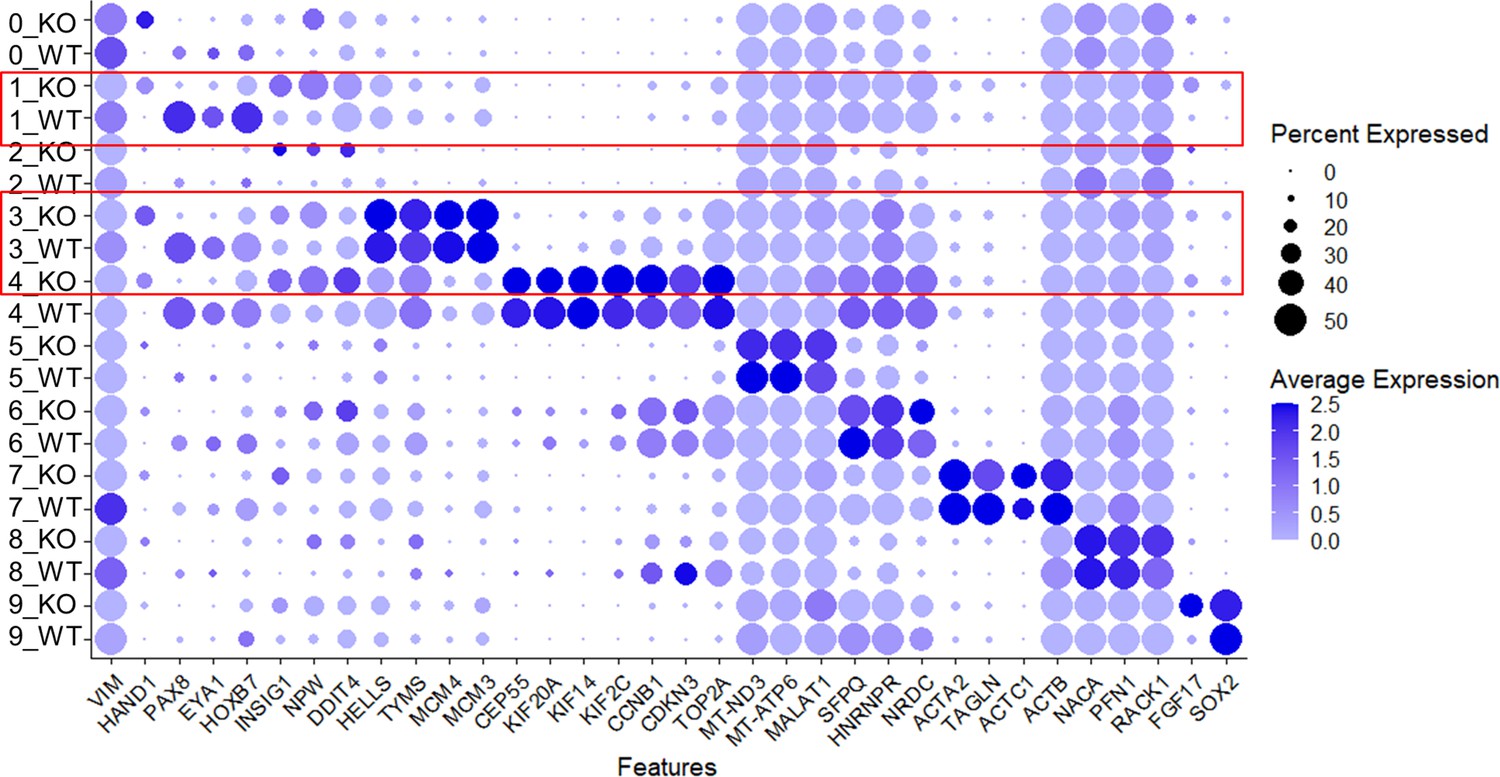
Expression of selected genes per cluster and per group (WT vs. CEP83−/−).
Please note downregulated expression of nephron progenitor genes PAX8, EYA1, and HOXB7 in clusters 1, 3, and 4 (marked in red) in CEP83−/− cells.
Figure 5—figure supplement 2
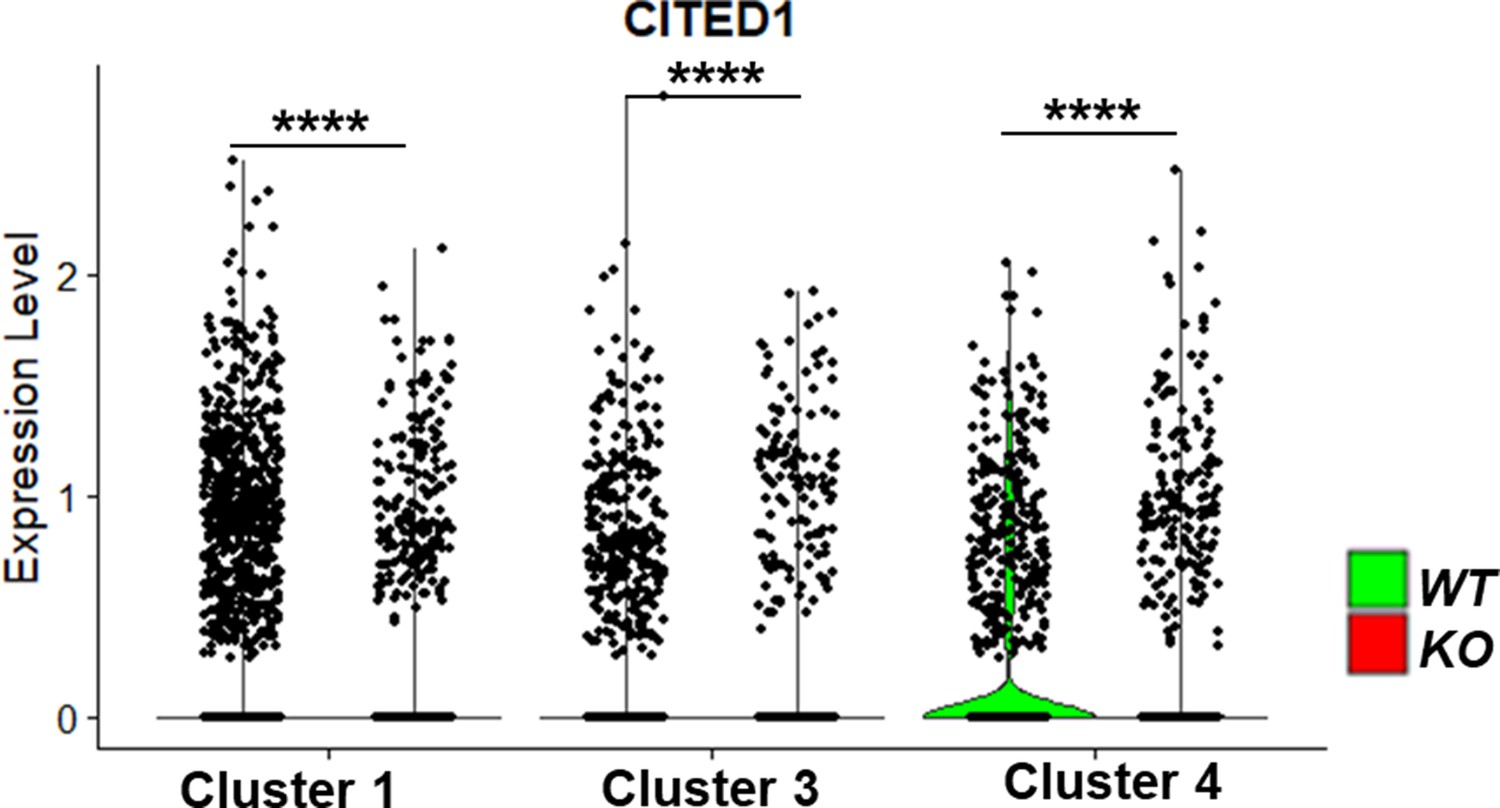
Violin plots of gene expression of kidney progenitor gene CITED1 within kidney progenitor clusters 1, 3, and 4 comparing wildtype (WT) and CEP83−/− (KO) cells.
N=2 per group. ****p<0.0001.
Figure 5—figure supplement 3
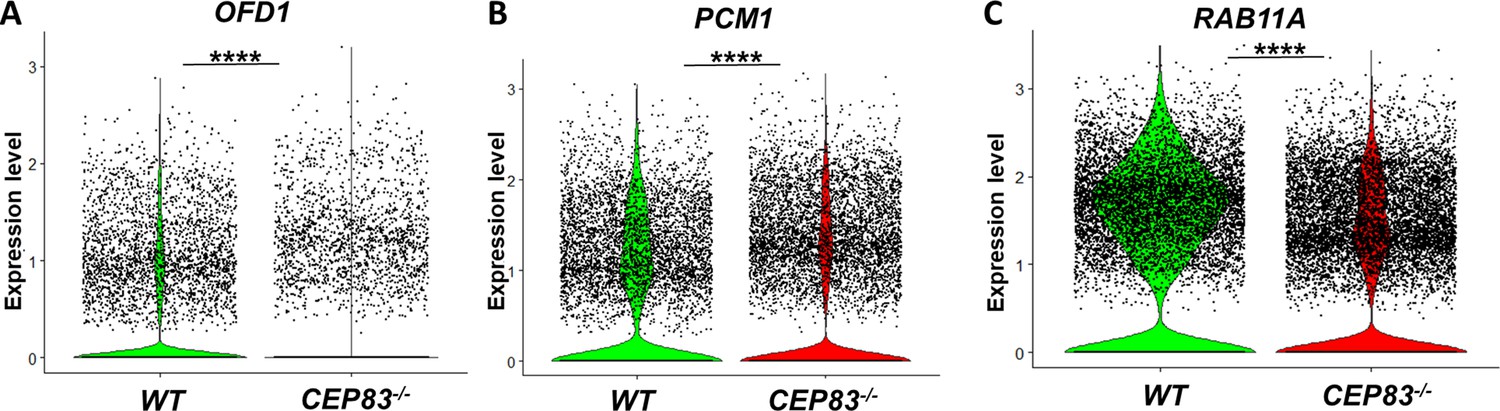
Violin plots of single-cell RNA sequencing show downregulated expression of genes encoding ciliary proteins in CEP83−/− cells, including (A) the basal body protein oral-facial-digital type I OFD1, (B) pericentriolar material-1 (PCM1), and (C) RAS oncogene family 11 A (RAB11A).
The three genes are essential for primary cilium formation, and their loss results in defective ciliogenesis (Mugford et al., 2008b; Mae et al., 2013; Mahlapuu et al., 2001). Data are derived from two biological replicates per group. ****p<0.0001.
Figure 6 with 3 supplements
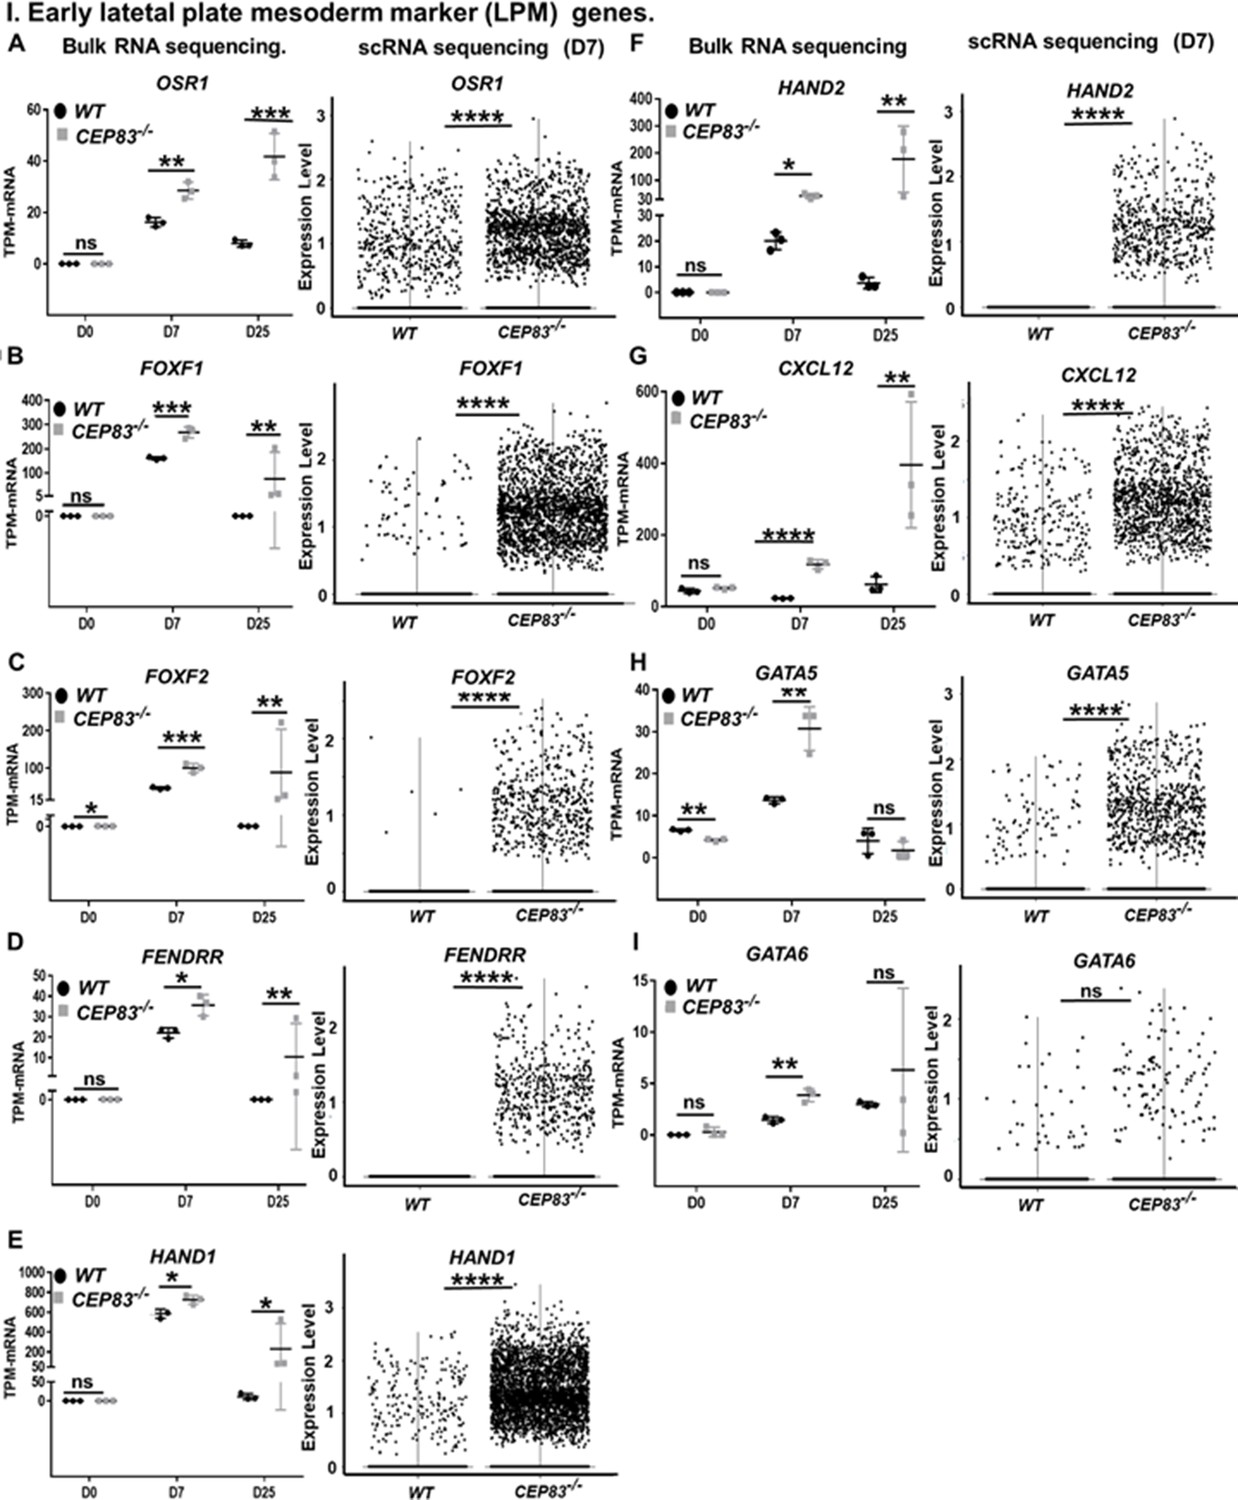
CEP83−/− cells upregulate expression of genes characteristic of early lateral plate mesoderm (LPM).
(A–I) Expression of early LPM markers OSR1 (A), FOXF1 (B), FOXF2 (C), FENDRR (D), HAND1 (E), HAND2 (F), CXCL12 (G), GATA5 (H), and GATA6 (I) in wildtype (WT) and CEP83−/− cells at day 0 (D0), day 7 (D7), and day 25 (D25) according to bulk RNA-sequencing (left panels) and at D7 according to single-cell RNA (scRNA) sequencing (right panels). N=3 clones per group for bulk RNA seq. N=2 clones per group for scRNA-seq. Expression units are mean transcripts per million (TPM) ± SD. *p<0.05, **p<0.01, ***p<0.001, and ****p<0.0001. ns = not significant. See Figure 6—figure supplements 1–3. See also Figure 6—source data 1. Check data availability section for other source data.
-
Figure 6—source data 1
The sheet shows the plotted TPM values of mRNA sequencing analysis in Figure 6 for the expression of lateral plate mesoderm marker genes between the KO and WT at days 0, 7, and 25 of the differentiation.
- https://cdn.elifesciences.org/articles/80165/elife-80165-fig6-data1-v2.xlsx
Figure 6—figure supplement 1
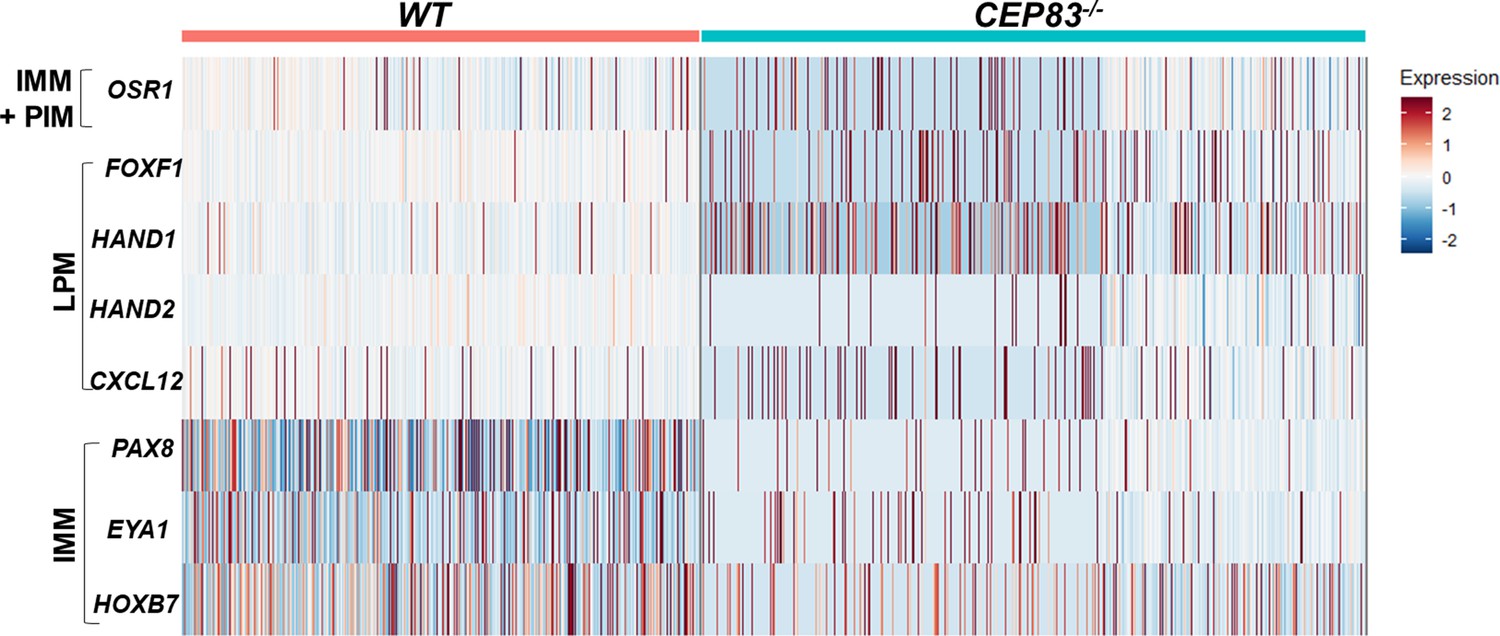
CEP83−/− cells upregulate lateral plate mesoderm (LPM) genes in mesenchymal cells cluster and nascent nephron progenitor clusters.
The heatmap shows that the log fold change of the average expression (default setting in Seurat package) of LPM and intermediate mesoderm (IM) genes in the WT cells (8123 cells) and the knockout cells (10,431 cells) derived from the mesenchyme cells cluster (cluster 0) and the three nascent nephron clusters (1, 3, and 4). Scoring for cells expression for both LPM including: FOXF1, HAND1, HAND2, and CXCL12, and IM genes including: PAX8, EYA1, and HOXB7 were done in R. Each cell was scored 0–4 for LPM genes expression. 0, 1, 2, 3, and 4 mean that cell express no LPM genes, 1 gene, 2 genes, 3 genes, and 4 genes, respectively. Statistical analysis comparing LPM scores for WT and KO cells using wilcoxon rank sum test showed that KO cells significantly upregulate the expression of LPM genes. The same scoring analysis was done for the expression of the IM genes, where the cells got a score from 0 to 3 for IM genes expression. Interestingly, the KO cells showed significant downregulation of the IM genes expression.
Figure 6—figure supplement 2
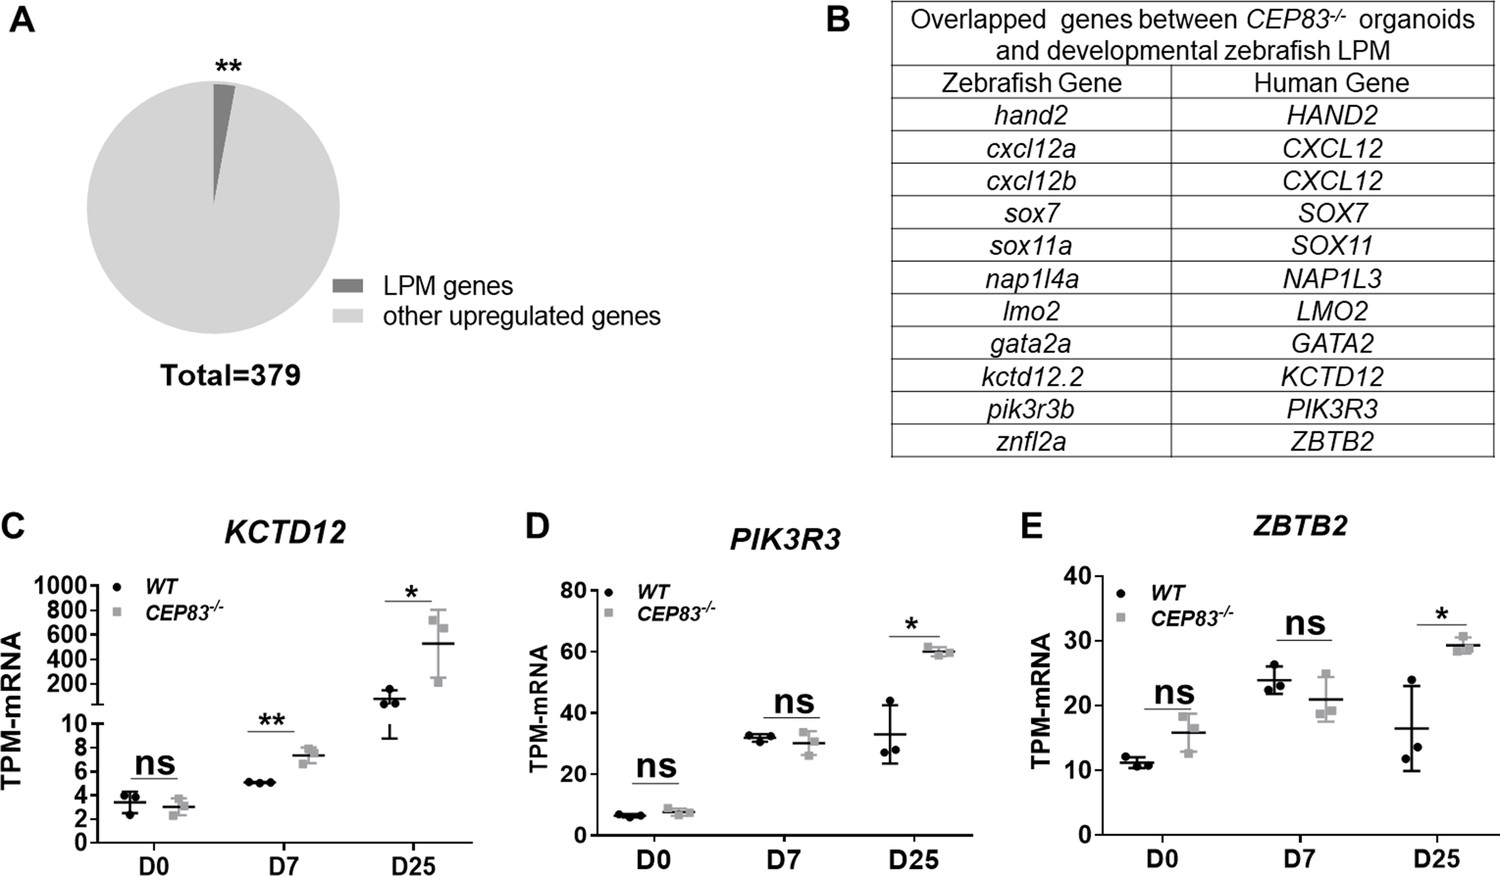
CEP83−/− organoids show significant enrichment compared to developmental zebrafish lateral plate mesoderm (LPM) single-cell RNA (scRNA) data.
The expression of the upregulated genes by CEP83−/− organoids on day 25 was compared with the top 20 genes per cluster of zebrafish LPM scRNA data (Prummel et al., 2020). The analysis showed significant enrichment (A), with 11 zebrafish genes overlapped with 10 human genes (B). (C, D, and E) show the significant upregulation of three overlapped genes with zebrafish LPM including KCTD12, PIK3R3, and ZBTB2, respectively. n=3 clones per group. Data are mean ± SD. *p<0.05, and **p<0.01. ns = not significant.
Figure 6—figure supplement 3
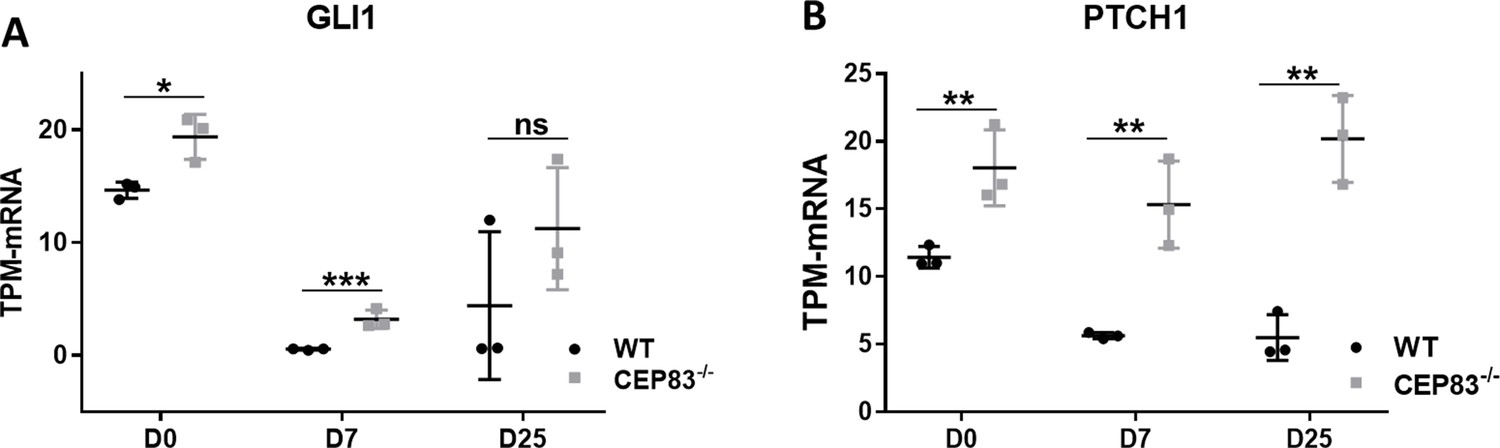
Upregulation of hedgehog signaling components in CEP83−/− cells.
Bulk RNA sequencing data shows significant upregulation of (A) GLI1, and (B) PTCH1, at days 0, 7, and 25. n=3 clones per group. Data are mean ± SD. *p<0.05, **p<0.01, and ***p<0.001. ns = not significant.
Figure 7
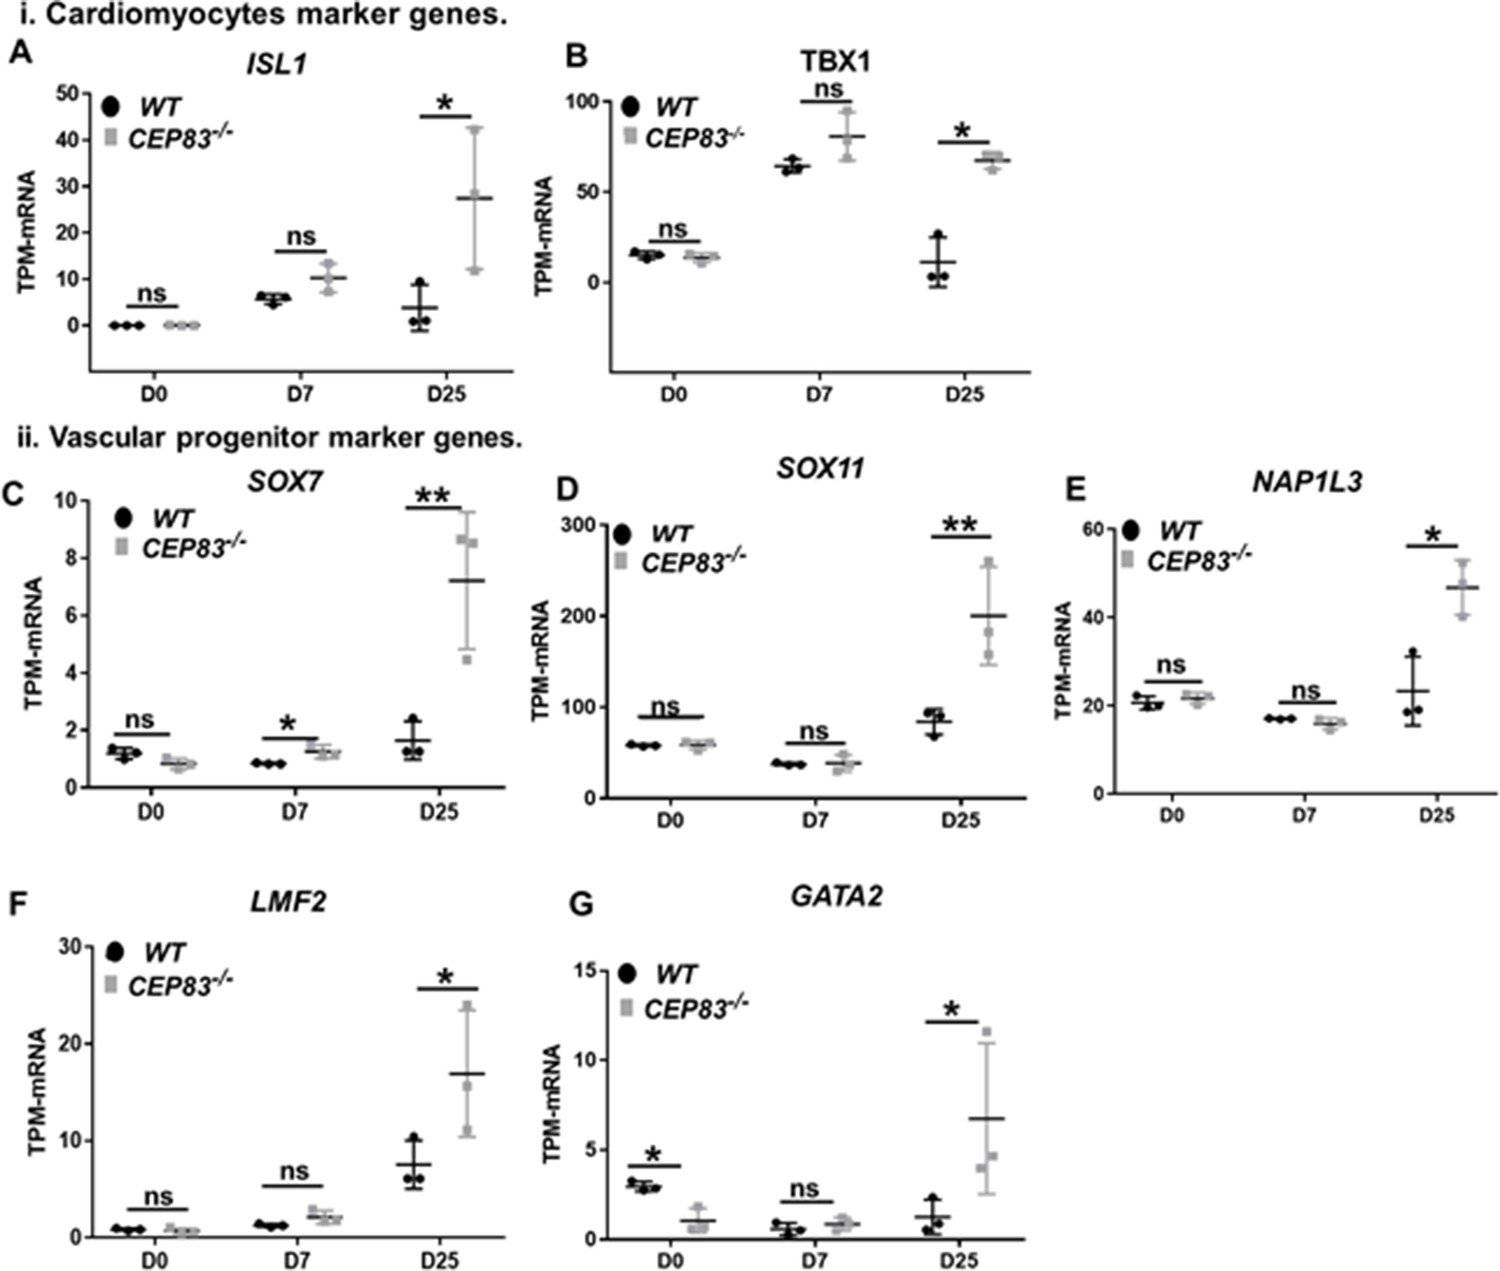
CEP83−/− cells upregulate expression of genes characteristic of cardiomyocyte progenitors and vascular progenitors.
(A–G) Expression of cardiomyocyte markers ISL1 (A), TBX1 (B), and vascular progenitor markers SOX7 (C), SOX11 (D), NAP1L3 (E), LMO2 (F), and GATA2 (G) in wildtype (WT) and CEP83−/− cells at day 0 (D0), day 7 (D7), and day 25 (D25) according to bulk RNA-sequencing. N=3 clones per group for bulk RNA seq. Expression units are mean transcripts per million (TPM) ± SD. *p<0.05, and **p<0.01. ns = not significant. See Figure 6—figure supplement 2. See also Figure 7—source data 1. Check the data availability section for other source data.
-
Figure 7—source data 1
The sheet shows the plotted TPM values of mRNA sequencing analysis in Figure 7 for the expression of cardiomyocytes and vascular progenitors marker genes between the KO and WT at days 0, 7, and 25 of the differentiation.
- https://cdn.elifesciences.org/articles/80165/elife-80165-fig7-data1-v2.xlsx
Figure 8
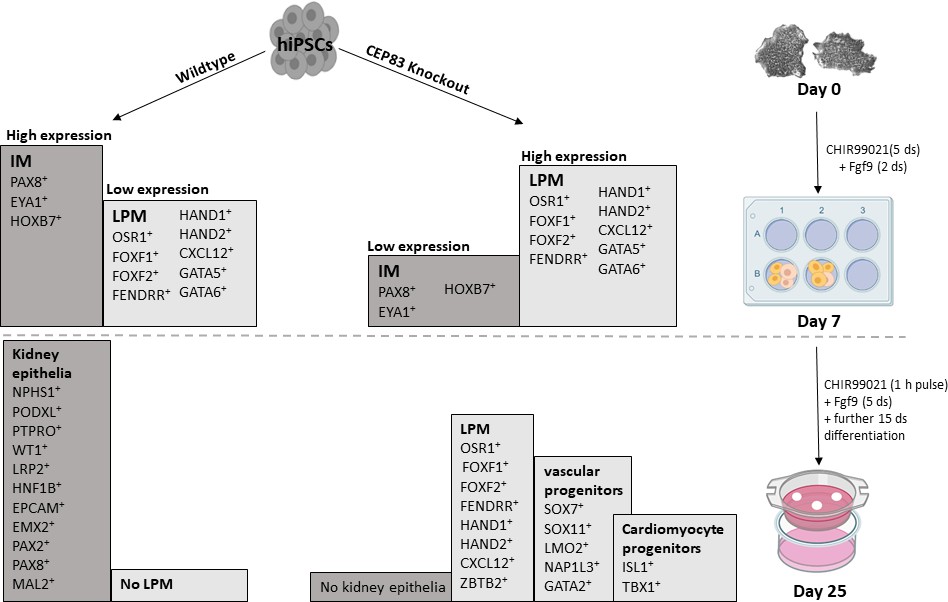
Schematic model outlining the functional differences between wildtype and CEP83 knockout cells during the course of differentiation of human pluripotent stem cells toward kidney cells.
IM, intermediate mesoderm; LPM, lateral plate mesoderm.
Additional files
-
MDAR checklist
- https://cdn.elifesciences.org/articles/80165/elife-80165-mdarchecklist1-v2.docx
-
Supplementary file 1
The table shows the primers list used in the qPCR.
- https://cdn.elifesciences.org/articles/80165/elife-80165-supp1-v2.docx
-
Supplementary file 2
The table shows the list of primary antibodies used in IF staining.
- https://cdn.elifesciences.org/articles/80165/elife-80165-supp2-v2.docx
Download links
A two-part list of links to download the article, or parts of the article, in various formats.
Downloads (link to download the article as PDF)
Open citations (links to open the citations from this article in various online reference manager services)
Cite this article (links to download the citations from this article in formats compatible with various reference manager tools)
The centrosomal protein 83 (CEP83) regulates human pluripotent stem cell differentiation toward the kidney lineage
eLife 11:e80165.
https://doi.org/10.7554/eLife.80165


