High-content synaptic phenotyping in human cellular models reveals a role for BET proteins in synapse assembly
- Stanley Center for Psychiatric Research, Broad Institute of MIT and Harvard, United States
- Department of Stem Cell and Regenerative Biology, Harvard University, United States
- Imaging Platform, Broad Institute of MIT and Harvard, United States
Figures
Figure 1 with 5 supplements

Development of an automated, high-content human synaptic phenotyping platform.
(a) Schematic of stable integration of a doxycycline-responsive NGN2 (iNGN2) cassette into human pluripotent stem cells (hPSCs). TALENs were used to insert iNGN2 into the AAVS1 safe harbor locus of the PPP1R12C gene. (b) Summary of human-induced neuron (hN) protocol. hPSCs are differentiated into neural progenitor like cells using extrinsic inhibition of BMP, SMAD, and Wnt in combination with doxycycline-driven transient ectopic NGN2 expression. Zeocin is used as a selective agent. Neural progenitor-like cells were then incubated with neurotrophins in addition to the anti-mitotic agent floxuridine. hNs are then maintained in neurobasal medium and neurotrophins. (c) Flowchart of the high-content synaptic screening platform. One day after automated seeding of hNs and hpAs (using a liquid handler, day 5 of hN differentiation), a random plate is selected for assessing plating consistency (Columbus script). On day 18, treatments (shown here as small molecules at 3 µM) are administered in triplicate for 72 hr using a liquid handler; two plates are used as sentinel or reference. On day 21, co-cultures are then stained for synaptic markers using the liquid handler and high-content images are acquired using the Opera Phenix (Perkin Elmer). Data are then processed through CellProfiler and Screener to quantify the number and area of SYNAPSIN1 puncta on MAP2-expressing neurites, the area of MAP2-positive neurites, the number of DAPI-positive nuclei, and the density of SYNAPSIN1 puncta on MAP2-expressing neurites (Z-score). (d) Representative images of hNs co-cultured with hpAs and stained for SYNAPSIN1 (red) and MAP2 (green). Cells are counterstained with DAPI (blue). Scale: 100 pixels. Insets: arrows show SYNAPSIN1 puncta localized on MAP2-positive neurites. (e, f) Acceptance criteria for plating consistency. Plating consistency for each batch is determined using a Columbus script by quantifying detected hN nuclei per well (e) as well as the intra-plate covariance (f) of the randomly selected plate on day 6 after hN differentiation. Circles represented the number of neuronal nuclei detected per well from the plates randomly selected on day 6 (one day after seeding the co-culture). Thresholds for inclusion (red dashed lines) are set as above 4000 detected hN nuclei per well and below 12,000 detected hN nuclei per well (e) and a covariance below 8% across the plate (f). n = 1 x 96 well-plate per Batch which corresponds to 60 wells per 96-well plate per Batch. Error bars are shown as mean +/- SEM. (g) Quantification of the density of SYNAPSIN1 puncta on MAP2 neurites after incubation with SYNAPSIN siRNA versus control conditions. n = 6 wells for each condition; ***p<0.0001, ANOVA with Dunnett’s post hoc test. Error bars are shown as SEM.
Figure 1—figure supplement 1
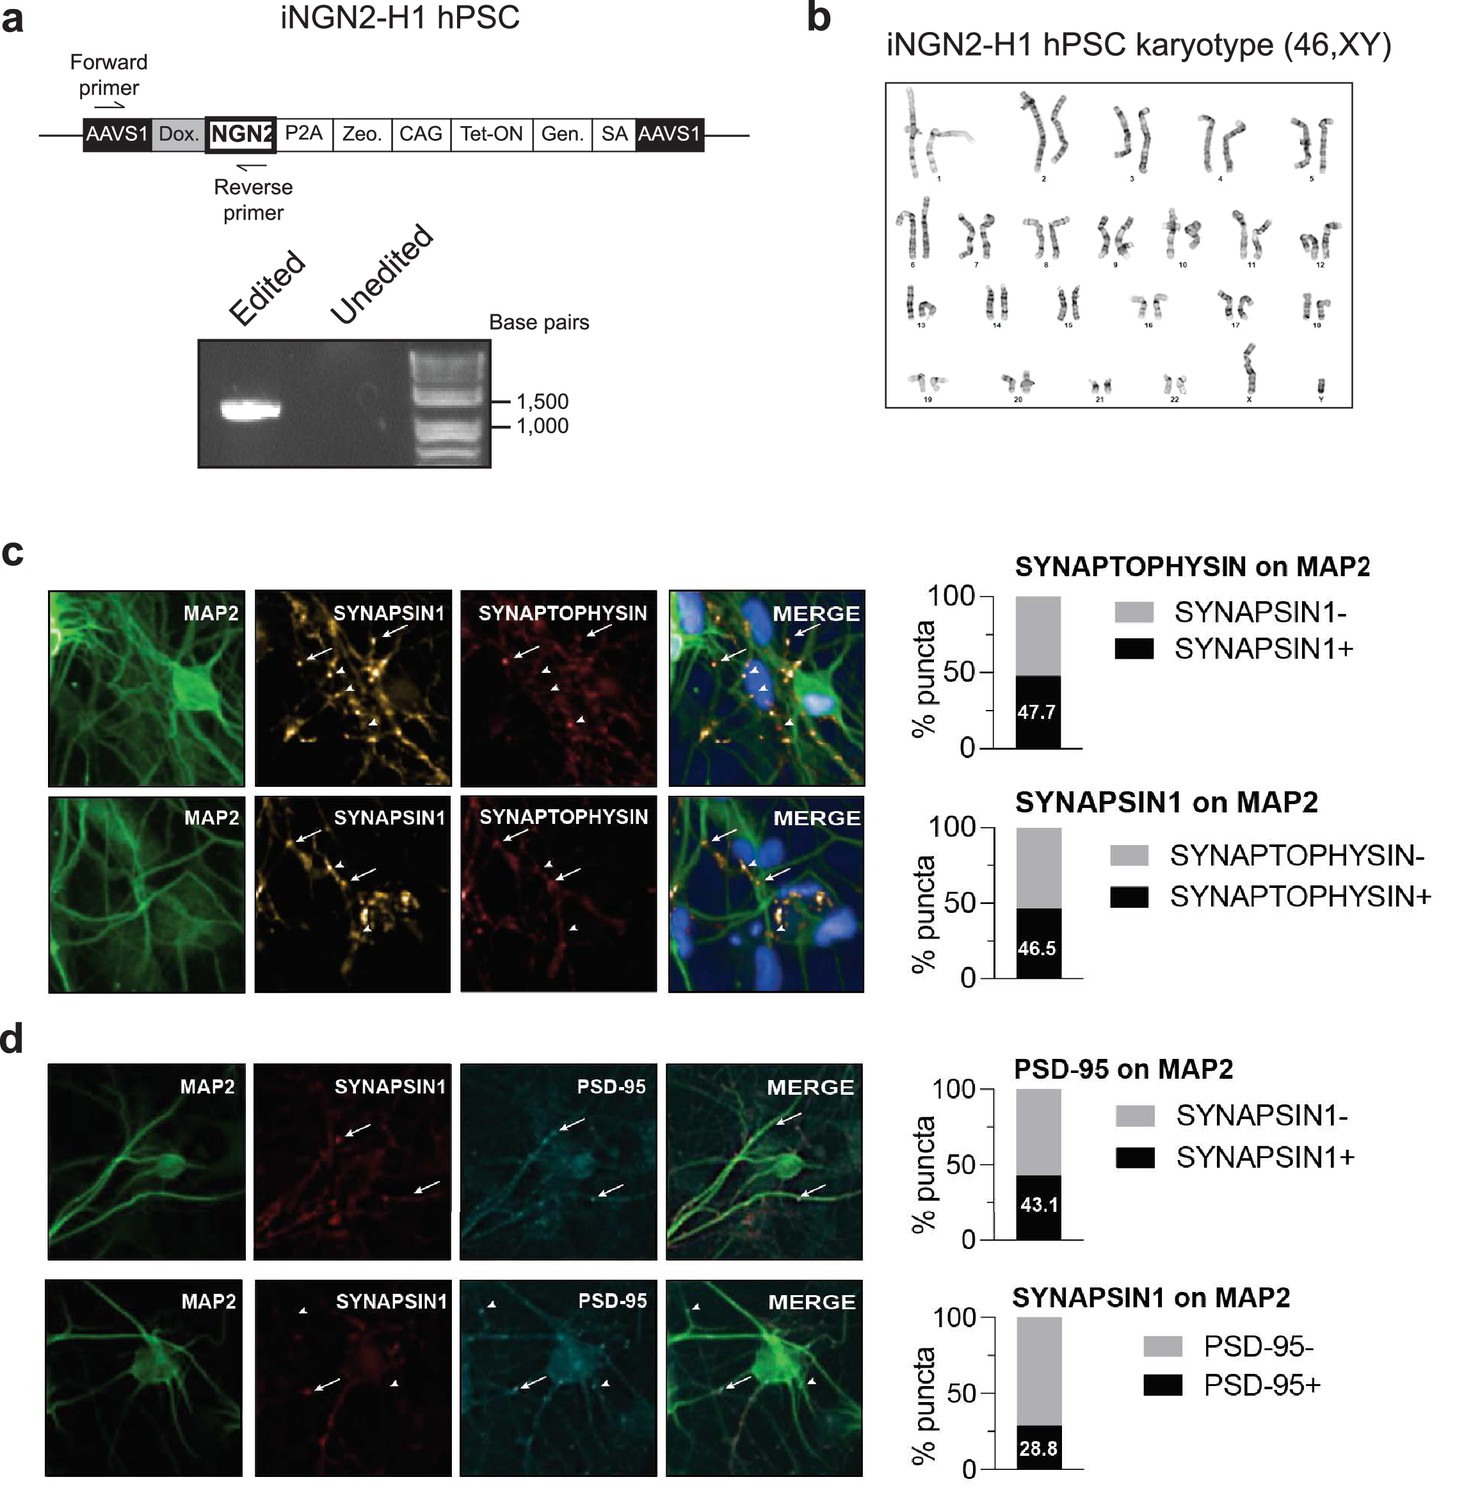
Validation of stably integrated iNGN2 cassette in human pluripotent stem cells (hPSCs) and additional synaptic markers.
(a) Design of the PCR genotyping strategy for validation of stable integration of the iNGN2 cassette in the AAVS1 safe harbor locus of the H1 genome. (b) Cytogenetic analysis performed by Cell Line Genetics on iNGN2-hPSCs demonstrating an apparently normal karyotype 46,XY. (c) Example images (left) and quantification (right) of SYNAPSIN1 on MAP2 co-localized with the presynaptic marker synaptophysin (n = 3 wells, 28 fields). (d) Example images (left) and quantification (right) of SYNAPSIN1 on MAP2 co-localized with the postsynaptic marker PSD-95 (n = 3 wells, 16 fields, >10 puncta/field threshold).
Figure 1—figure supplement 2
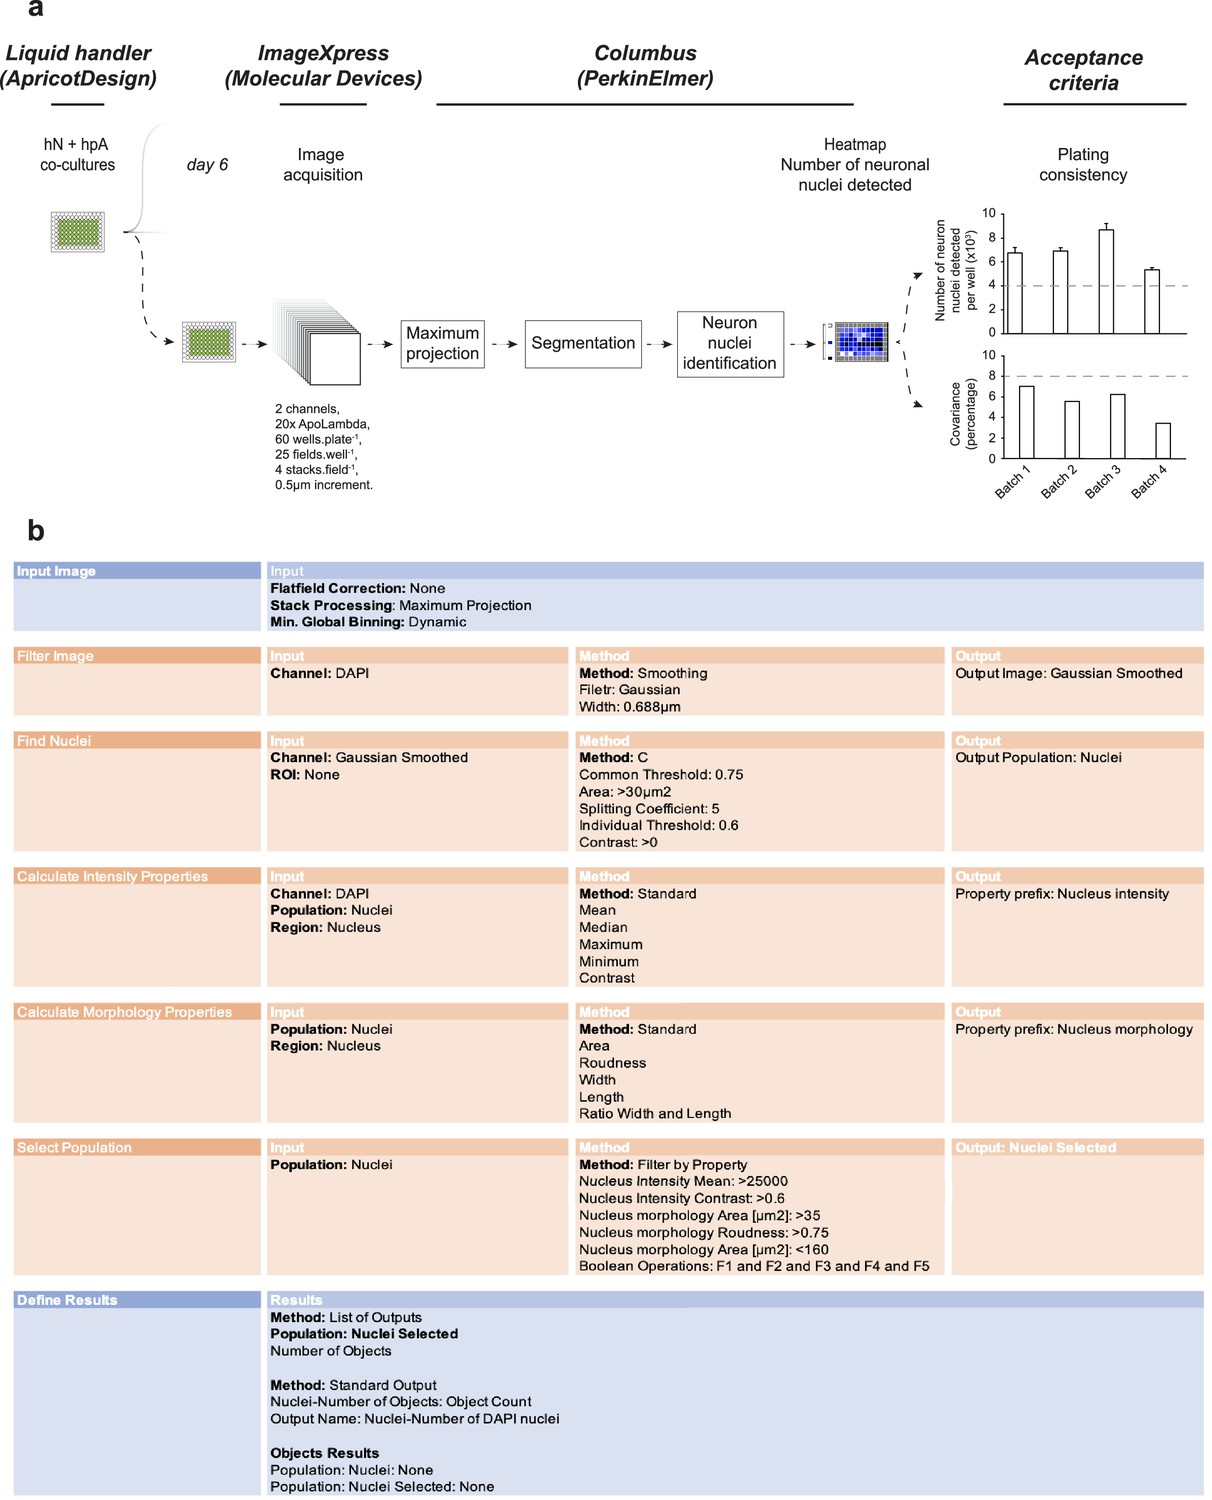
Columbus script to evaluate acceptance criteria for each batch of cultures.
(a) One day after seeding cells, a random plate among the batch is selected, stained against MAP2, and counterstained with DAPI. Images are acquired through ImageXpress (Molecular Devices) and uploaded to Columbus (PerkinElmer). DAPI projected images are filtered and the hN nuclei identified based on the intensity, morphology, contrast, area, roundness, and MAP2-positive soma. hN nuclei are then counted and the intra-plate covariance is calculated. Acceptance criteria for inclusion of each batch of human co-cultures are set above 4000 hN nuclei detected, and a covariance below 8% as depicted by the gray dashed lines (also shown in Figure 1). (b) Columbus script for assessment of the number of neuronal DAPI-positive nuclei.
Figure 1—figure supplement 3
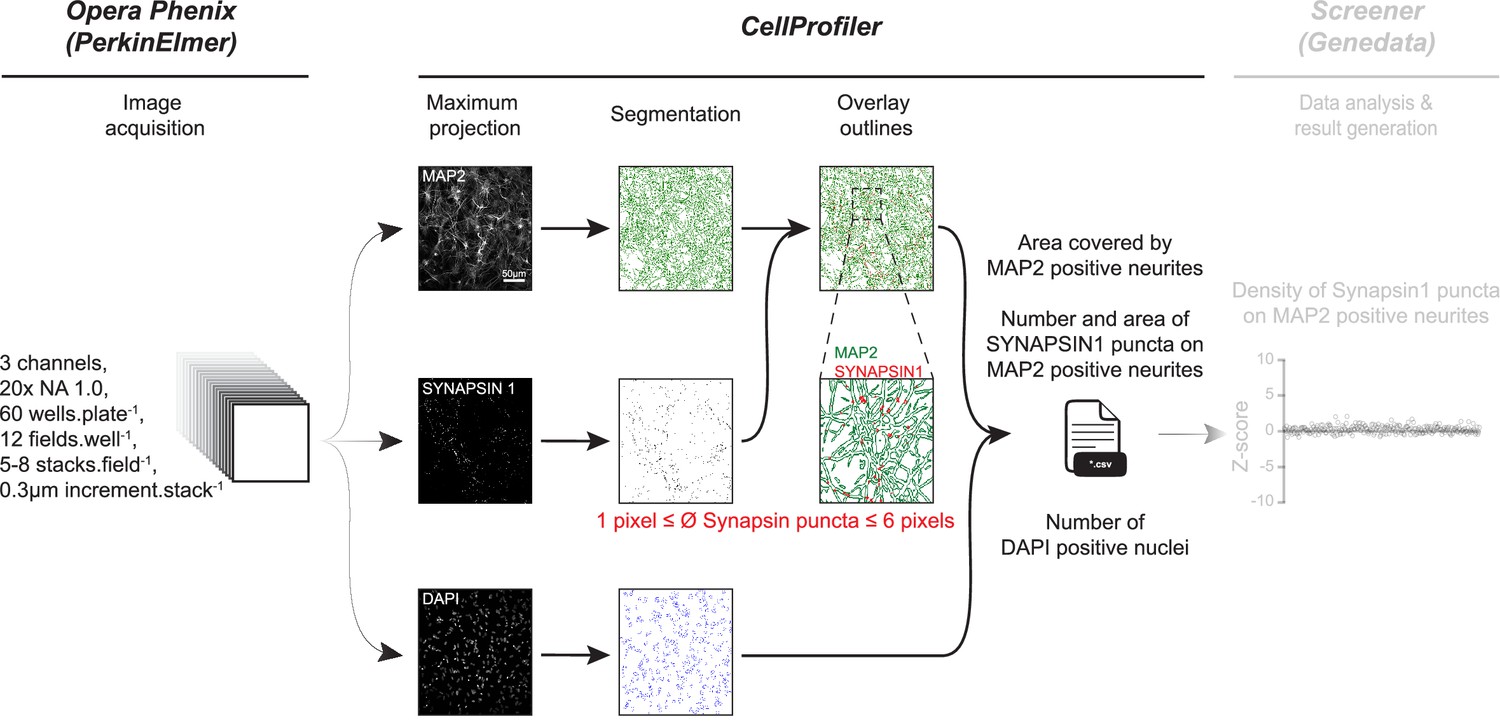
Overview of automated layered profiling and quantitative analysis of SYNAPSIN1 puncta on MAP2 neurites (ALPAQAS).
For each acquired field, 5–8 stacks of MAP2, SYNAPSIN1, and DAPI channels are projected in a single plane before segmentation. A colocalization module then assigns the relationship between the identified SYNAPSIN1 puncta contained within or partly touching the MAP2 neurite objects. The area covered by MAP2 neurites and the number of SYNAPSIN1 puncta on MAP2 neurites from each field are then exported to a *.csv spreadsheet.
Figure 1—figure supplement 4
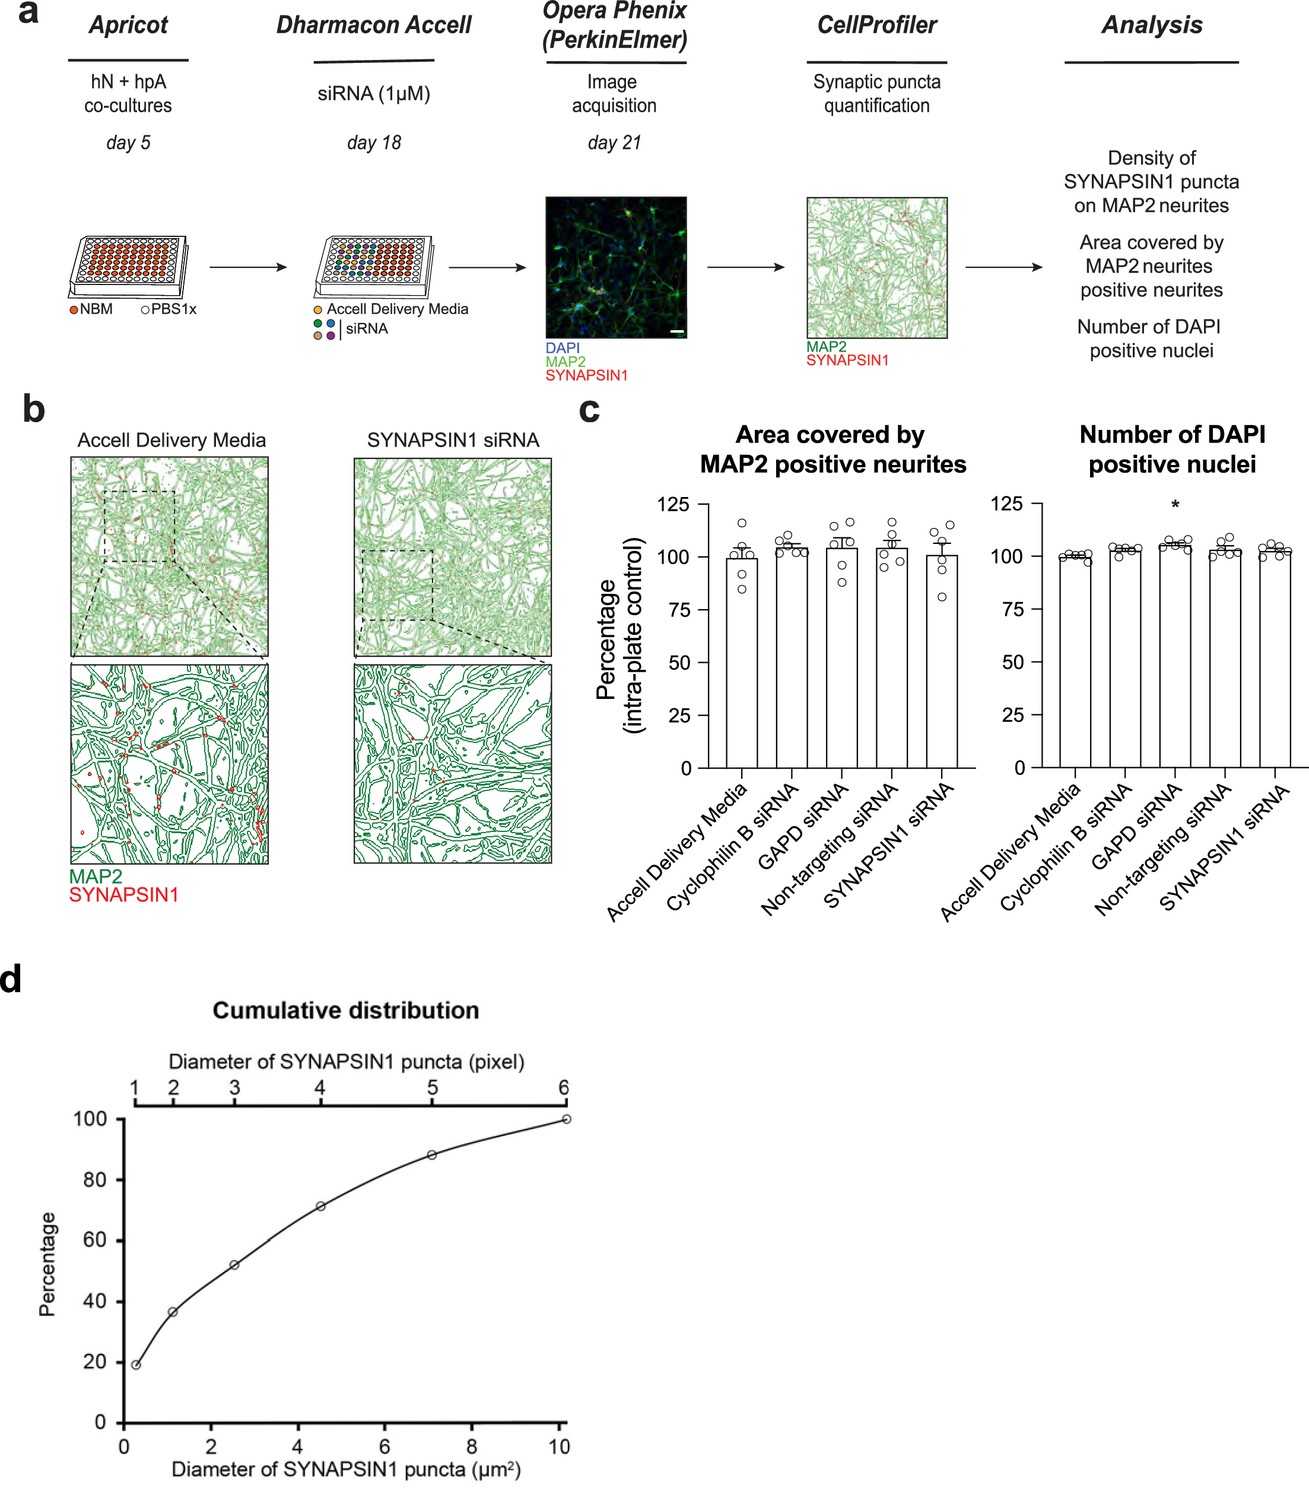
ALPAQAS detects SYNAPSIN1 knock-down.
(a) Schematic of siRNA delivery. hN + hpA co-cultures were untreated or incubated on day 18 with SYNAPSIN1 or control siRNA (1 µM) for 72 hr, stained and processed through the synaptic assay. Scale bar = 100 pixel. (b) Examples of output from CellProfiler showing overlay of SYNAPSIN1 puncta (red) on MAP2-expressing neurites (green) from untreated and SYNAPSIN1 siRNA-treated conditions. (c) Histograms showing the MAP2-positive neurite coverage and the number of DAPI-positive nuclei after incubation with SYNAPSIN1 siRNA versus control conditions. n = 6 wells for each condition; *p<0.05, ANOVA with Dunnett’s post hoc test. (d) Cumulative distribution of the diameter of SYNAPSIN1 puncta.
Figure 1—figure supplement 5
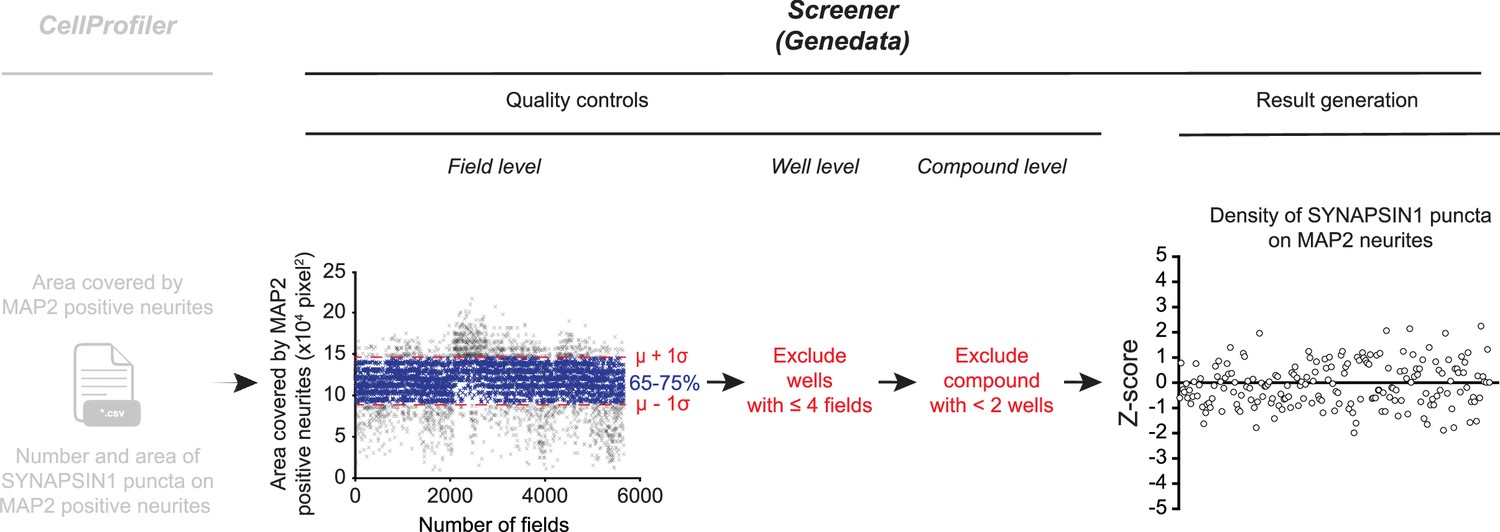
Workflow supported by Genedata.
CellProfiler *.csv files (field level) are uploaded with a Genedata parser and filtered through three quality control steps: (i) for each individual field (cross) the area covered by MAP2 must fall within ± 1 standard deviation (σ) to the intra-batch mean (µ) MAP2 coverage (blue crosses represent accepted fields shown within red dashed lines; gray crosses indicated fields that are rejected), (ii) exclusion of the well if ≤4 fields remain following the first quality control step; (iii) exclusion of conditions with one well remaining following the well-level quality control. Data are then imported into Genedata Screener and pattern correction algorithms are leveraged for calculation of Z-score values of the density of SYNAPSIN1 puncta on MAP2 neurites for each condition tested.
Figure 2 with 1 supplement
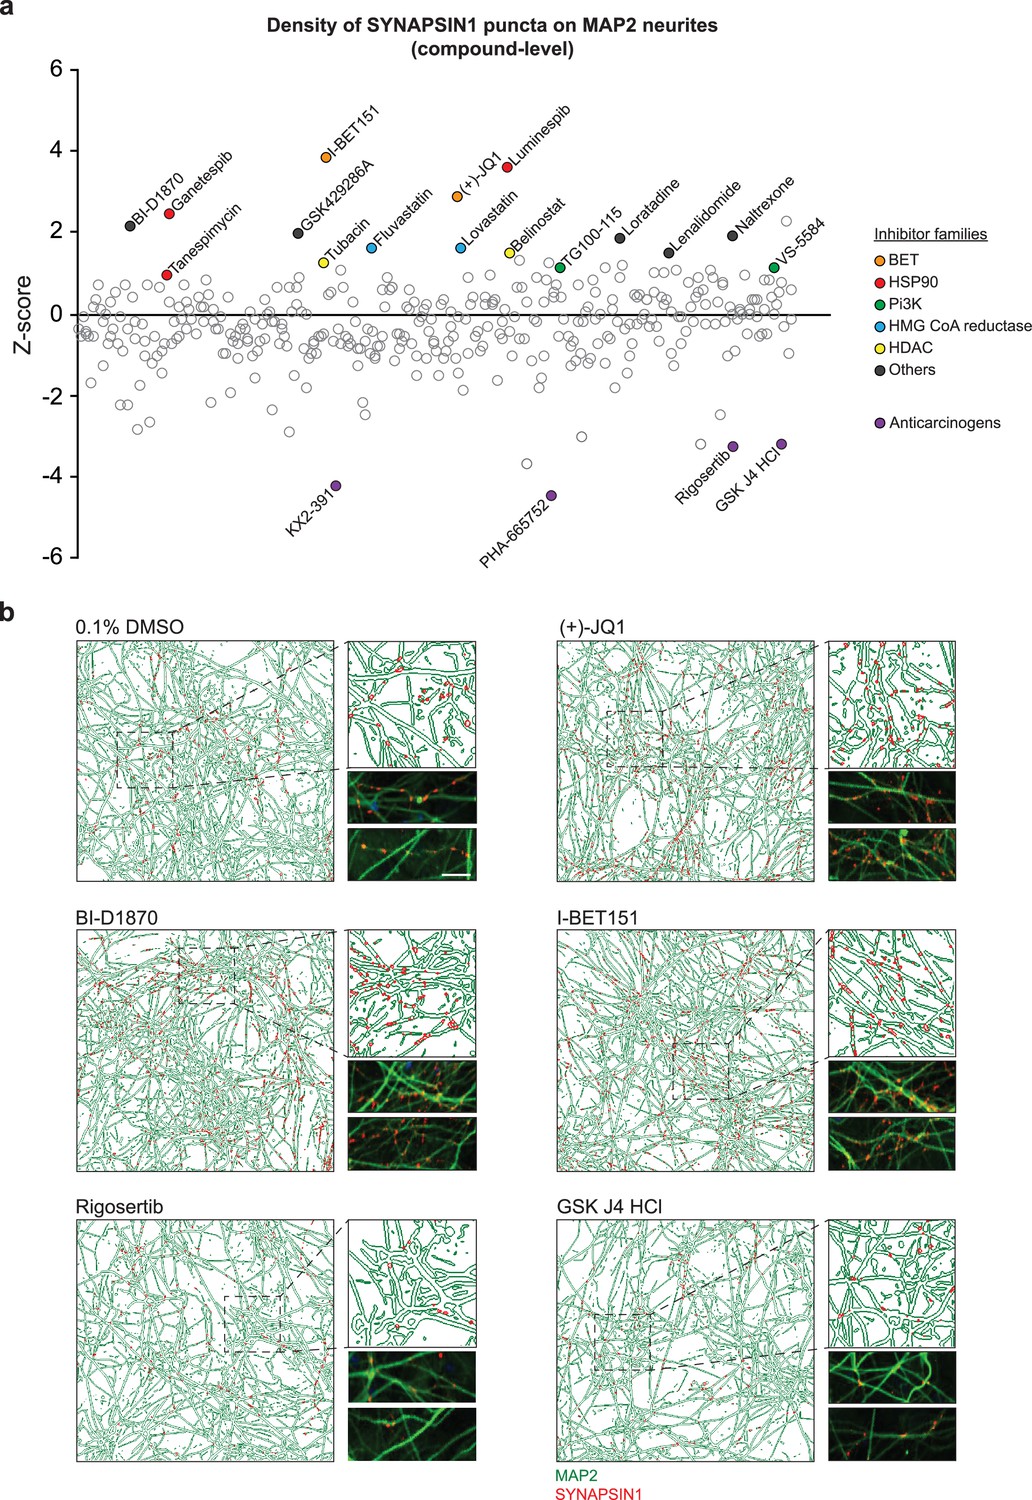
Primary screening results for 376 small molecules.
(a) Z-score values for the density of SYNAPSIN1 on MAP2-expressing neurites for hN + hpA co-cultures incubated with small molecules in triplicate at 3 µM for 72 hr starting on day 18 of neuronal differentiation (each circle represents the small molecule level aggregate of the replicates). The effects of each individual small molecule were assessed using our in silico pipelines. Small molecules that increased presynaptic density and were selected for further validation are indicated by colored circles. Those in purple are anticarcinogens that reduced presynaptic density and were not selected for further validation. (b) Representative immunofluorescence images and CellProfiler output images (field-level) of human co-cultures treated with either 0.1% DMSO, (+)-JQ1, BI-D1870, I-BET151, Rigosertib, or GSK J4 HCl. Scale bar = 1 µm. Note the increase in SYNAPSIN1 puncta on MAP2-expressing neurites following (+)-JQ1, BI-D1870, and I-BET151 compared to 0.1% DMSO control, and the decrease in SYNPASIN1 puncta following treatment with Rigosertib and GSK J4 HCl.
Figure 2—figure supplement 1
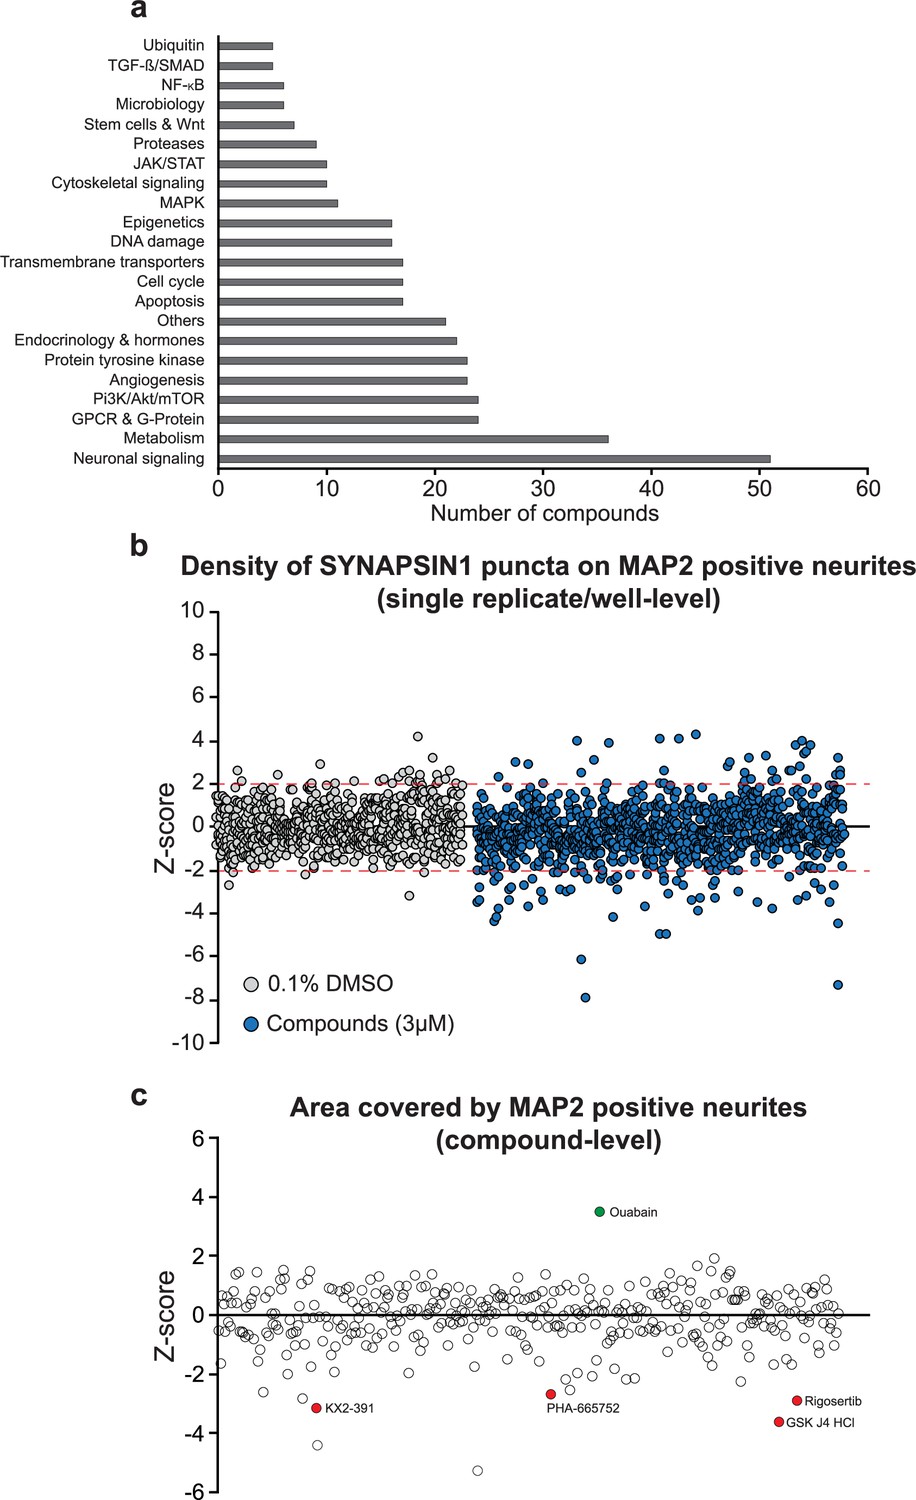
Small molecules used in the primary screen.
(a) Number of small molecules per pathway used in the primary screen. (b, c) Small molecules were screened at 3 µM in triplicate for 72 hr. 13 small molecules did not meet quality control requirements. 92.94% of the control and treated wells had a Z-score for synaptic density between –2 and +2 as depicted by the red dashed lines (b). Values are presented as Z-score of the density of SYNAPSIN1 puncta on MAP2-positive neurites (b, each circle represents either a DMSO or a small molecule treated well) or the area covered by MAP2-expressing neurites (c, each circle represents the aggregate value of the triplicate). Small molecules decreasing the area covered by MAP2-positive neurites are indicated by circles filled in red, and one small molecule increasing the area covered by MAP2-positive neurites is indicated by circle filled in green.
Figure 3 with 5 supplements
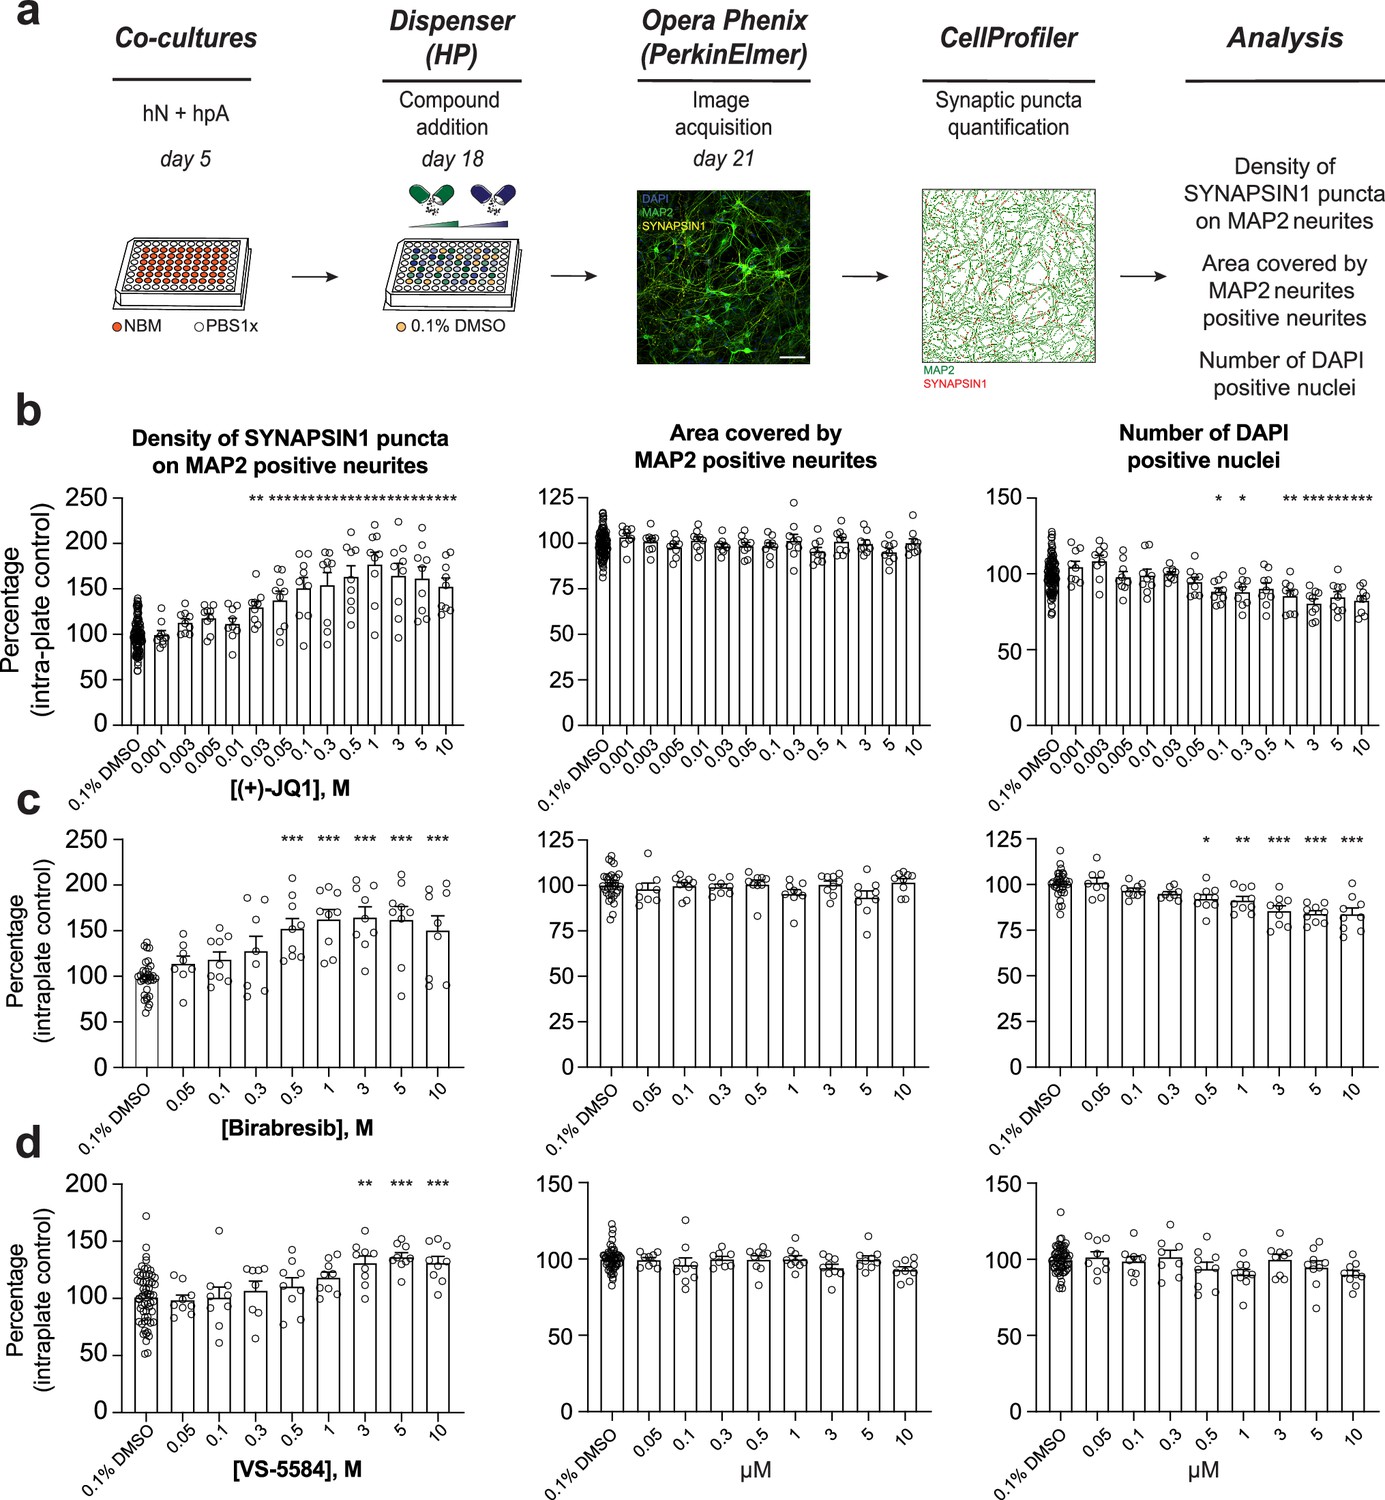
Secondary validation reveals potent small molecules increasing presynaptic density.
(a) Workflow for the dose–response assay. hN + hpA co-cultures were treated on day 18 with selected small molecules at various concentrations or 0.1% DMSO for 72 hr, stained and processed through the synaptic assay on day 21. Scale bar = 100 pixel. (b–d) Concentration responses for three small molecules (two BET inhibitors [(+)-JQ1, Birabresib] and VS-5584) increasing human presynaptic density (left). The impact on the area covered by MAP2-positive neurites (middle) and toxicity (number of DAPI-positive nuclei; right) are also shown. Data are quantified by percentage of intra-plate control (0.1% DMSO) represented as mean values ± SEM, n = 3 biological replicates, n = 3 technical replicates. *p<0.05, **p<0.01, ***p<0.001; one-way ANOVA with Dunnett’s multiple comparisons test.
Figure 3—figure supplement 1
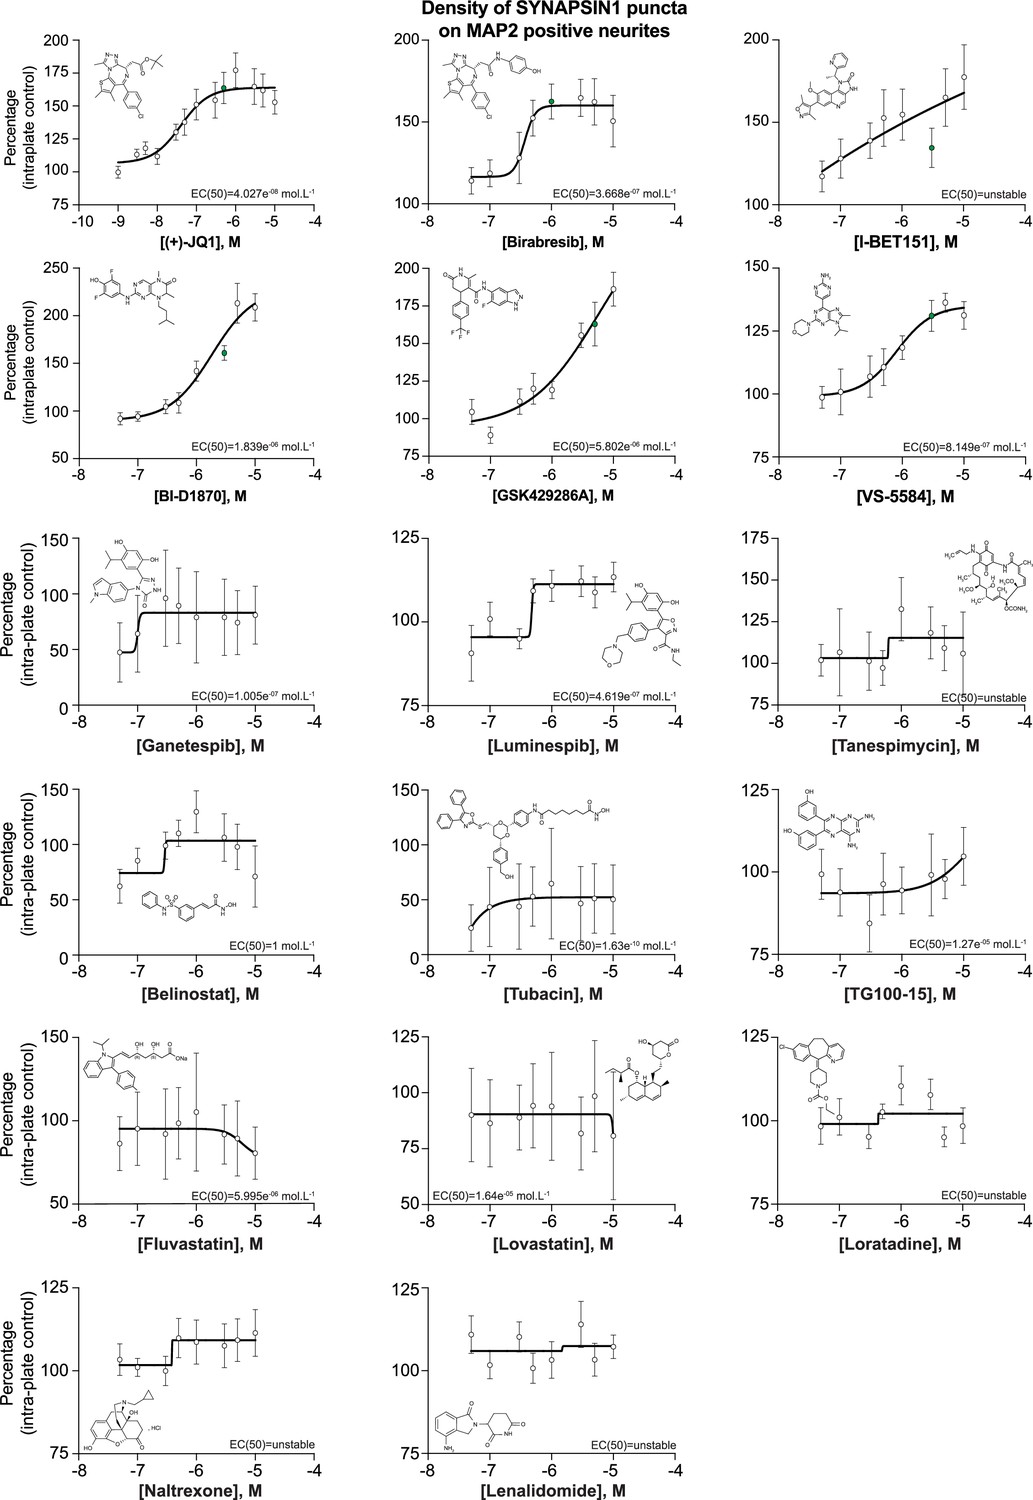
Dose–response curves for the impact of 17 selected small molecules on human presynaptic density.
Human co-cultures were treated on day 18 with 0.1% DMSO or the 17 selected small molecules at various concentrations for 72 hr, stained and processed through the synaptic assay. Dose–response curves show the density of SYNAPSIN1 puncta on MAP2-expressing neurites (same data in histogram format shown in Figure 3—figure supplement 2). Green dots represent the optimal concentration of the chosen small molecules. EC(50) and curves were calculated and drawn using PRISM software. Data are quantified by percentage of intra-plate control (0.1% DMSO) represented as mean values ± SEM, n = 3 biological replicates, n = 3 technical replicates.
Figure 3—figure supplement 2
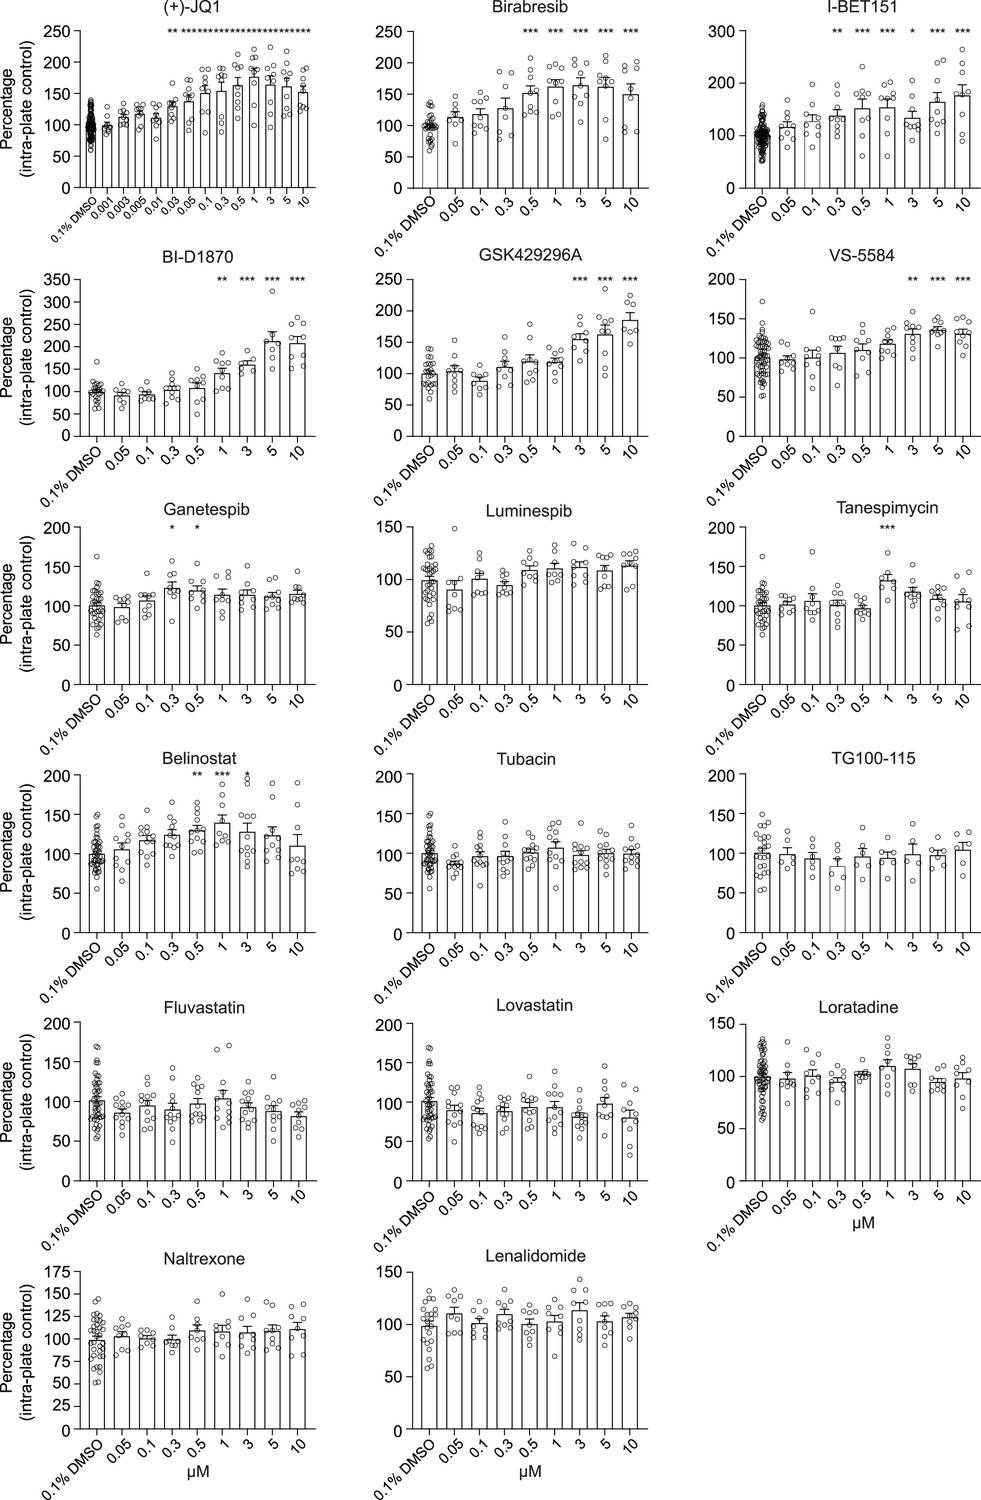
Histograms for the impact of 17 selected small molecules on human presynaptic density.
Human co-cultures were treated on day 18 with 0.1% DMSO or the 17 selected small molecules at various concentrations for 72 hr, stained and processed through the synaptic assay. Histograms show the density of SYNAPSIN1 puncta on MAP2-expressing neurites (same data in dose–response curve format shown in Figure 3—figure supplement 1 and for (+)-JQ1, Birabresib, and VS-5584 in Figure 3; all data are included together here for comparison). Data are quantified by percentage of intra-plate control (0.1% DMSO) represented as mean values ± SEM, n = 3 biological replicates, n = 3 technical replicates. *p<0.05; **p<0.01, ***p<0.001; one-way ANOVA with Dunnett’s multiple comparisons test.
Figure 3—figure supplement 3
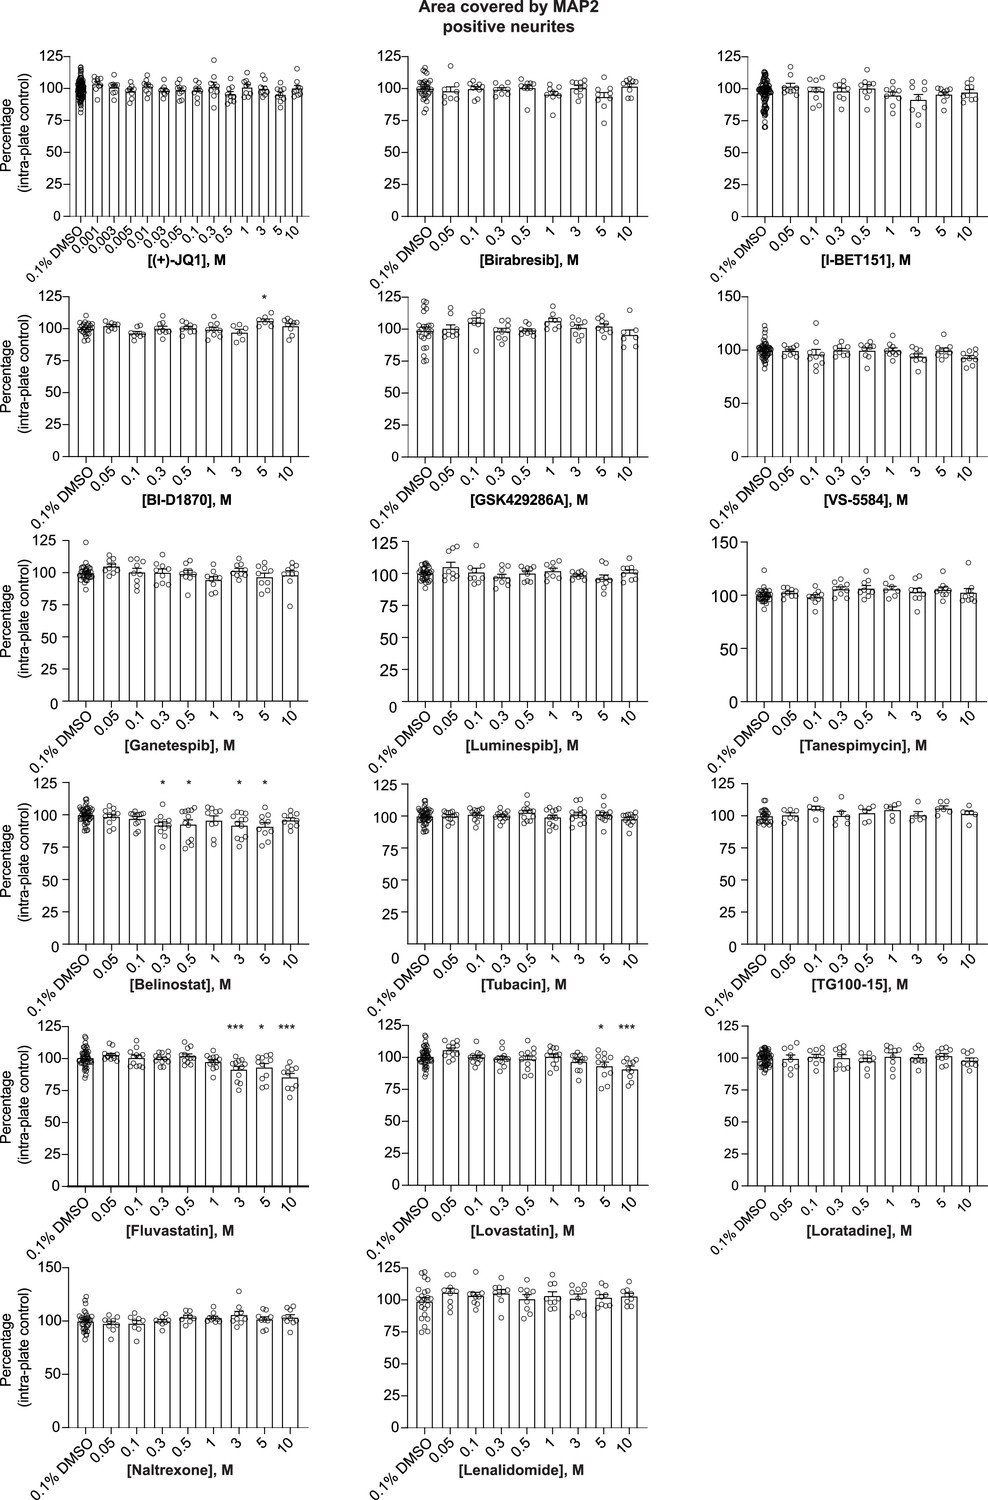
Histograms for the impact of 17 selected small molecules on the area covered by MAP2.
Human co-cultures were treated on day 18 with 0.1% DMSO or the 17 selected small molecules at various concentrations for 72 hr, stained and processed through the synaptic assay. Histograms show the area covered by MAP2 (same data for (+)-JQ1, Birabresib, and VS-5584 shown in Figure 3; all data are included together here for comparison). Each circle represents the value of one replicate. Data are quantified by percentage of intra-plate control (0.1% DMSO) represented as mean values ± SEM, n = 3 biological replicates, n = 3 technical replicates. *p<0.05, **p<0.01, ***p<0.001; one-way ANOVA with Dunnett’s multiple comparisons test.
Figure 3—figure supplement 4
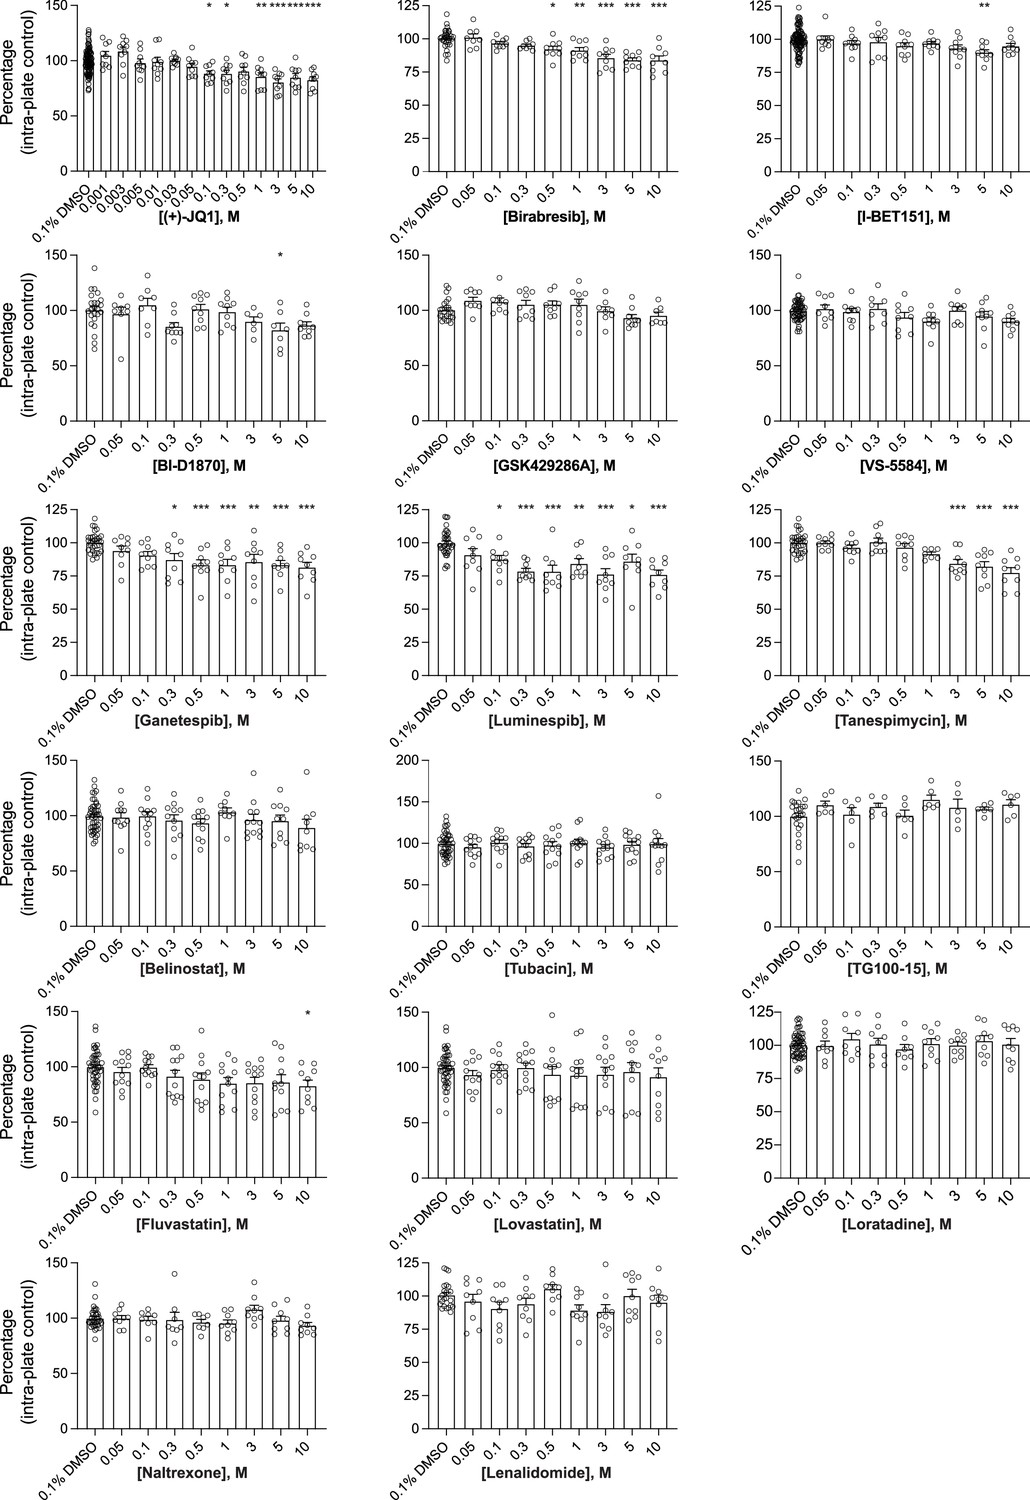
Histograms for the impact of 17 selected small molecules on the number of DAPI-positive nuclei.
Human co-cultures were treated on day 18 with 0.1% DMSO or the 17 selected small molecules at various concentrations for 72 hours, stained and processed through the synaptic assay. Histograms show the number of DAPI-positive nuclei (same data for (+)-JQ1, Birabresib, and VS-5584 shown in Figure 3; all data are included together here for comparison). Each circle represents the value of one replicate. Data are quantified by percentage of intra-plate control (0.1% DMSO) represented as mean values ± SEM, n = 3 biological replicates, n = 3 technical replicates. *p<0.05, **p<0.01, ***p<0.001; one-way ANOVA with Dunnett’s multiple comparisons test.
Figure 3—figure supplement 5
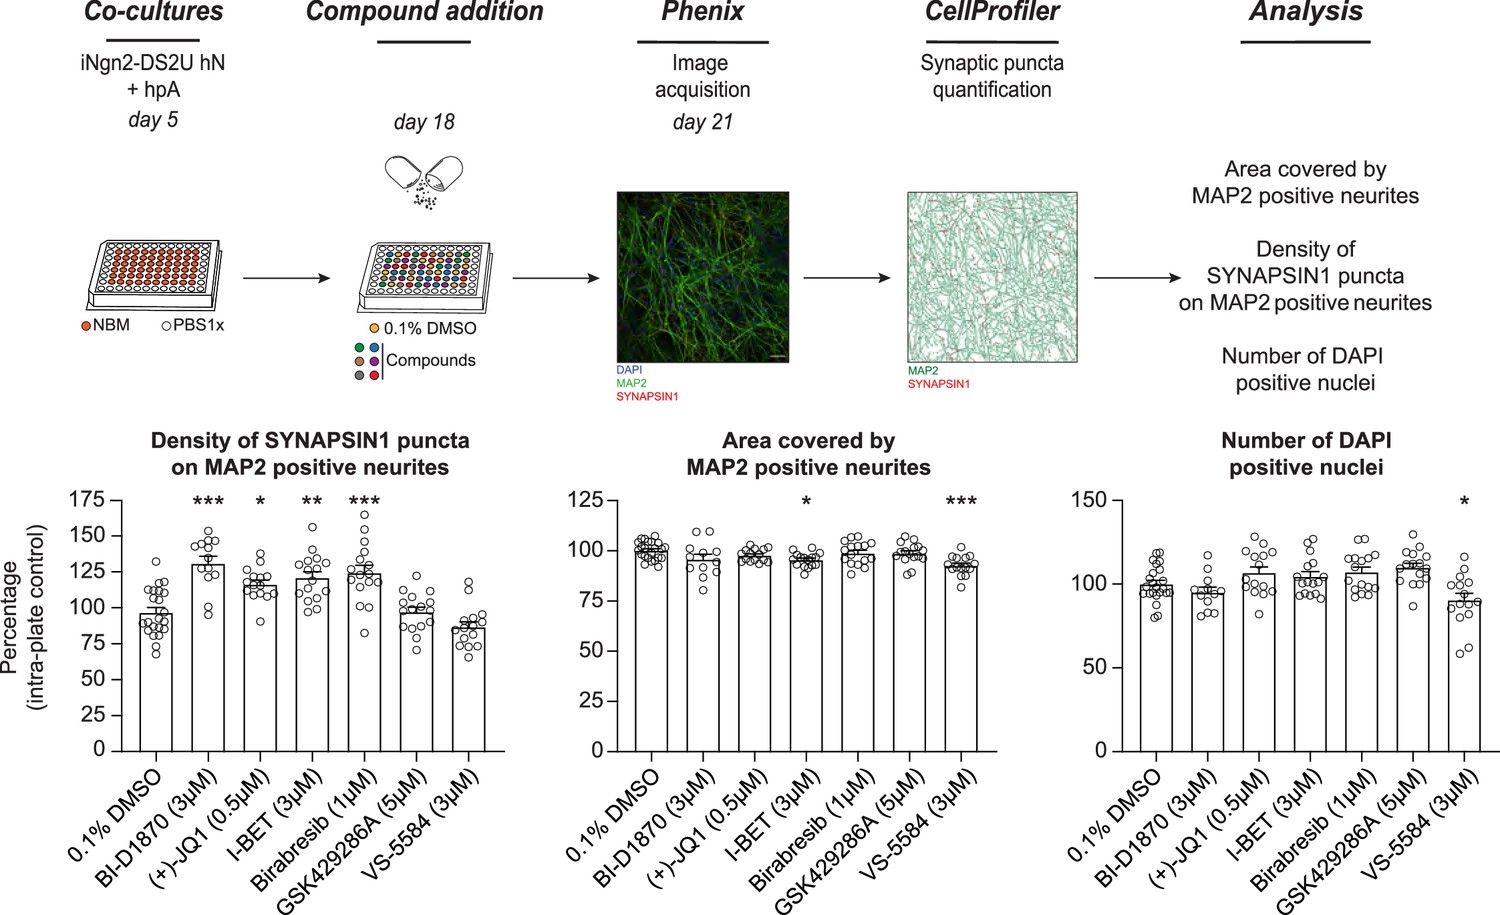
The effect of BET inhibition on presynaptic density is reproducible across cell lines.
hNs were generated using an independent cell line (iNgn2-DS2U human iPSCs), co-cultured with hpAs, treated on day 18 with 0.1% DMSO or selected small molecules at the optimal concentrations for 72 hr, stained and processed through the synaptic assay. Histograms show the density of SYNAPSIN1 puncta on MAP2-positive neurons (left), the area covered by MAP2-expressing neurites (middle), and the number of DAPI-positive nuclei (right). Data are quantified by percentage of intra-plate control (0.1% DMSO) represented as mean values ± SEM, n = 2 biological replicates, n = 8 technical replicates. *p<0.05, **p<0.01, ***p<0.001; one-way ANOVA with Dunnett’s multiple comparisons test. Scale bar = 100 pixel.
Figure 4 with 1 supplement
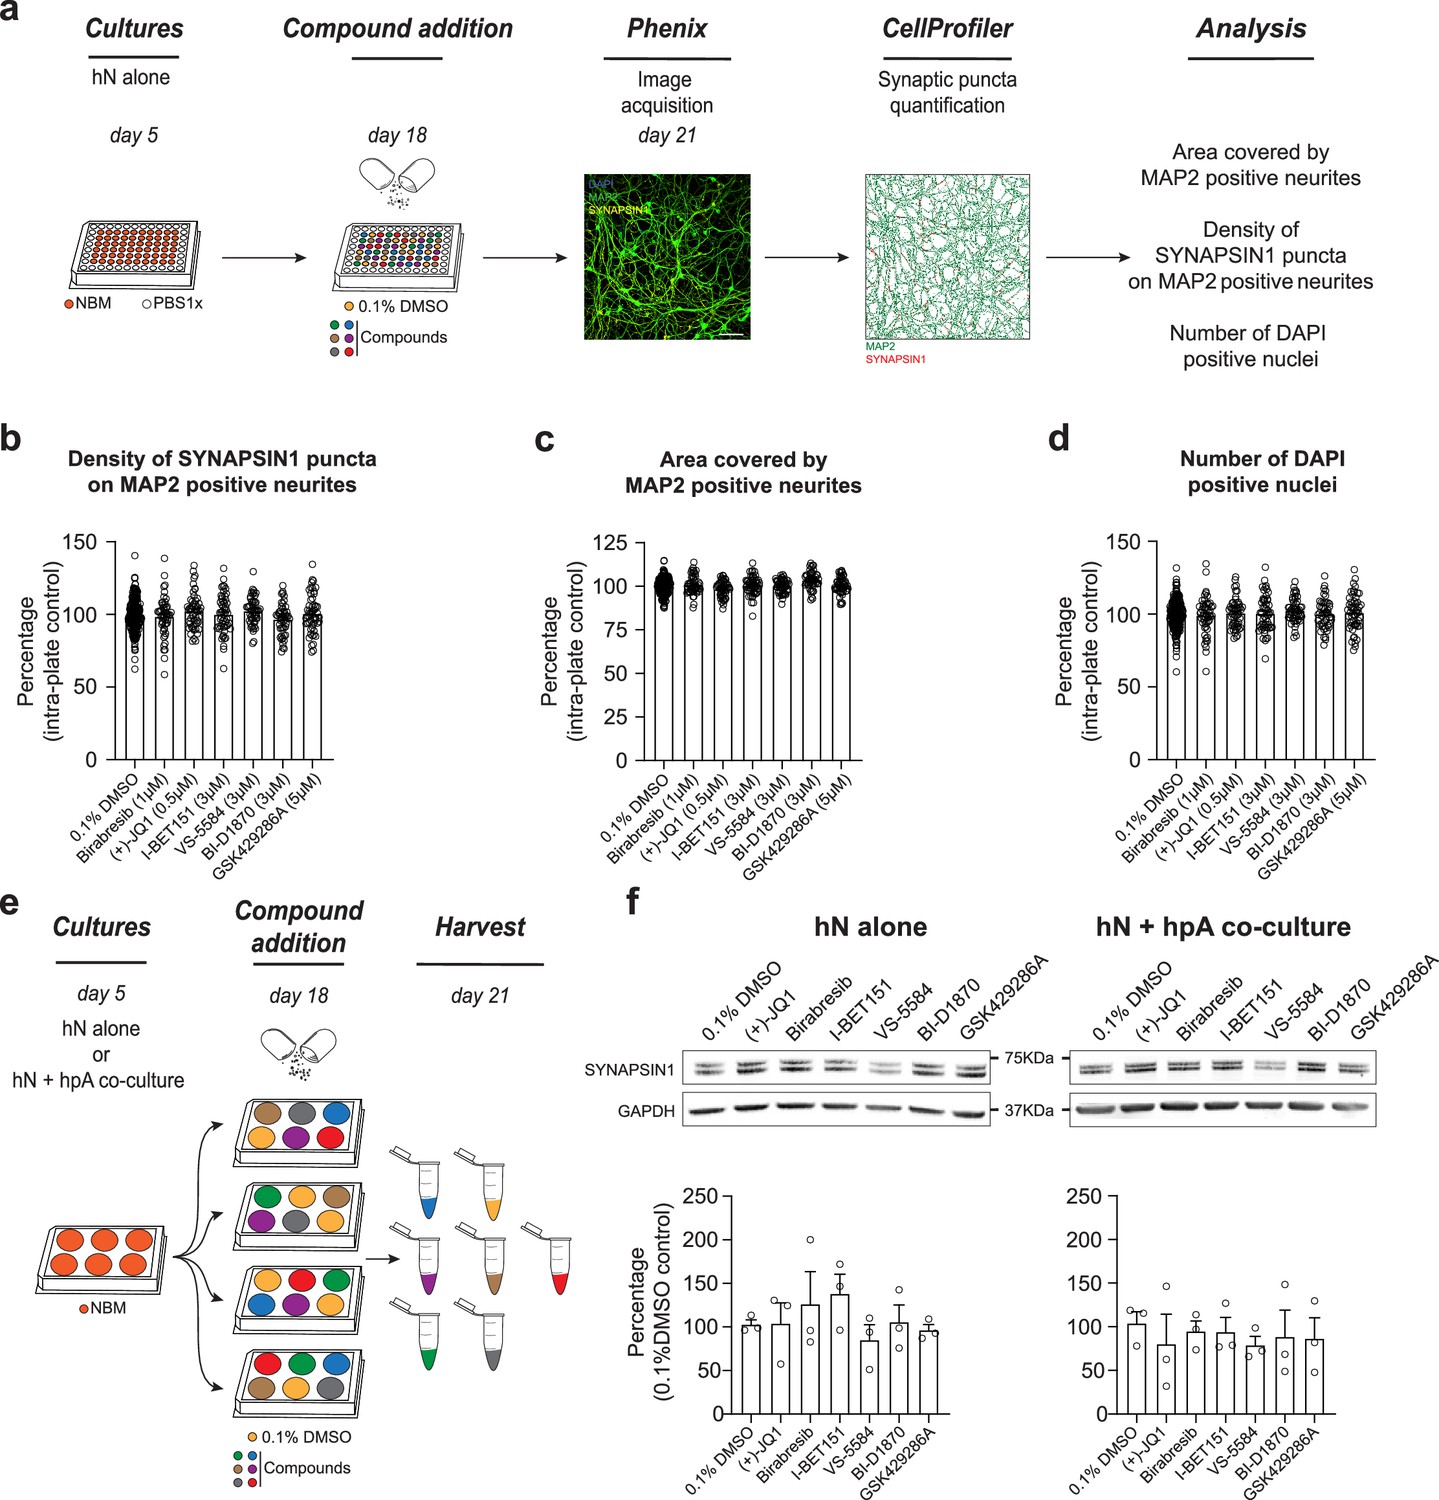
Astrocytes play a critical role in mediating response to small molecules.
(a) Workflow for small molecule validation in the absence of hpAs. Scale bar = 100 pixel. (b–d) In the absence of hpAs, none of the selected small molecules affected SYNAPSIN1 density of hNs, in contrast to the co-culture condition analyzed in parallel. The area covered by MAP2-positive neurites and cell viability was also not impacted as compared to intra-plate DMSO controls. Error bars are shown as mean +/- SEM. (e) Schematic of the preparation of the immunoblot samples. (f) Representative images of immunoblots and quantification of SYNAPSIN1 normalized to GAPDH and presented as a percentage of DMSO control in both hN alone and hN + hpA co-culture conditions. Note that SYNAPSIN1 protein expression levels were not impacted in any condition. n = 3 biological replicates (f). Error bars are shown as mean +/- SEM.
-
Figure 4—source data 1
Source of western blots for SYNAPSIN1 as well as GAPDH loading control following small molecule treatment versus DMSO control.
- https://cdn.elifesciences.org/articles/80168/elife-80168-fig4-data1-v1.zip
Figure 4—figure supplement 1
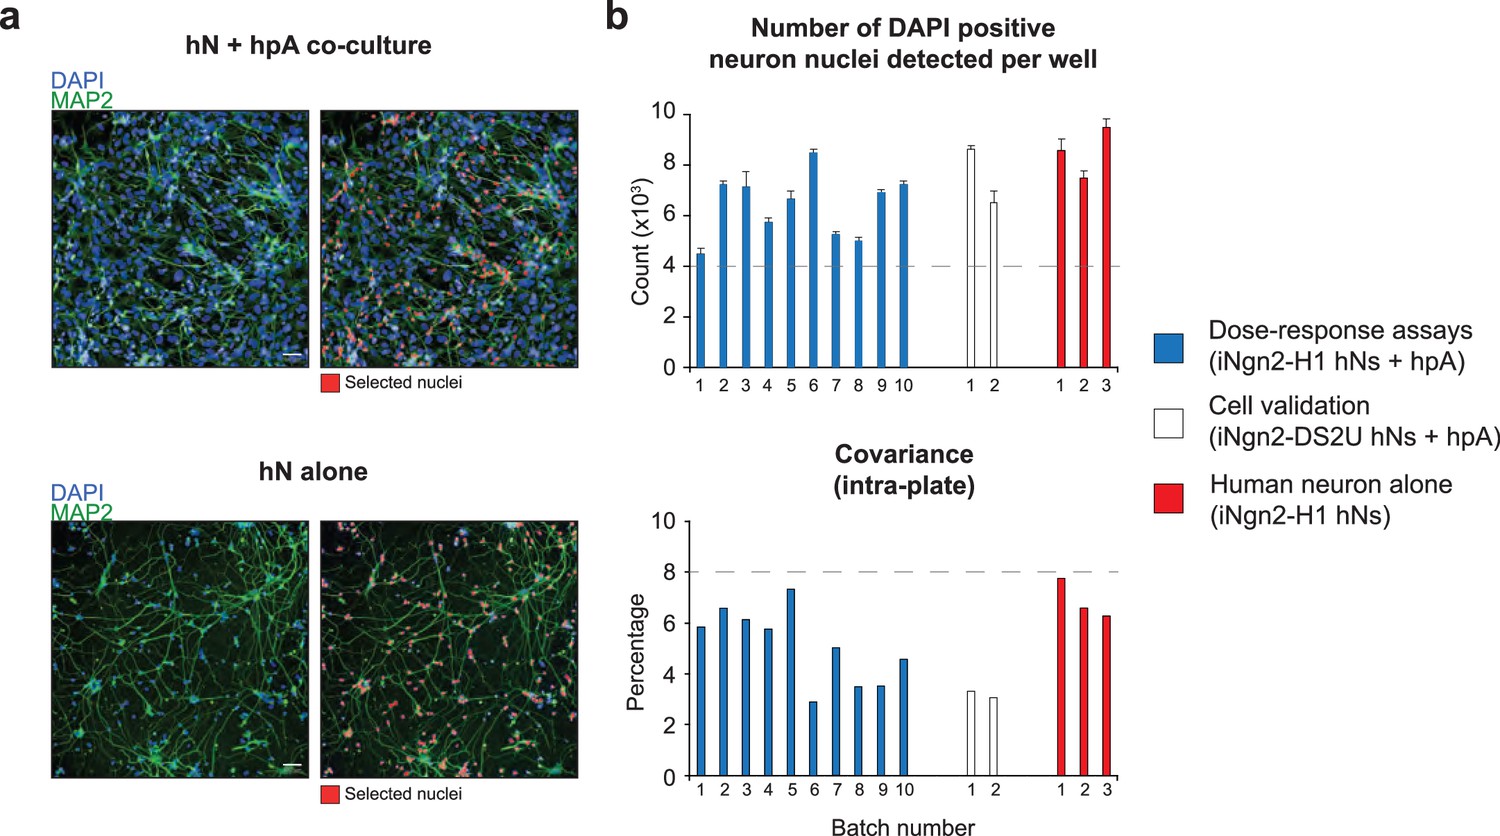
Acceptance criteria of all batches.
(a) Representative image of hN + hpA co-culture and hN alone culture fixed 1 d after plating, stained for MAP2 and counterstained with DAPI. In red, hN DAPI-positive nuclei selected through the Columbus script. Scale = 50 µm. (b) Number of DAPI-positive hN nuclei detected per well and intra-plate covariance for each batch used for the dose–response assays, the small molecule validation, and the hN alone experiments. Acceptance criteria for inclusion of each batch of human co-cultures are set above 4000 hN nuclei detected, and a covariance below 8% as depicted by the gray dashed lines. n = 1 x 96 well-plate per Batch which corresponds to 60 wells per 96-well plate per Batch. Error bars are shown as mean +/- SEM.
Figure 5 with 1 supplement
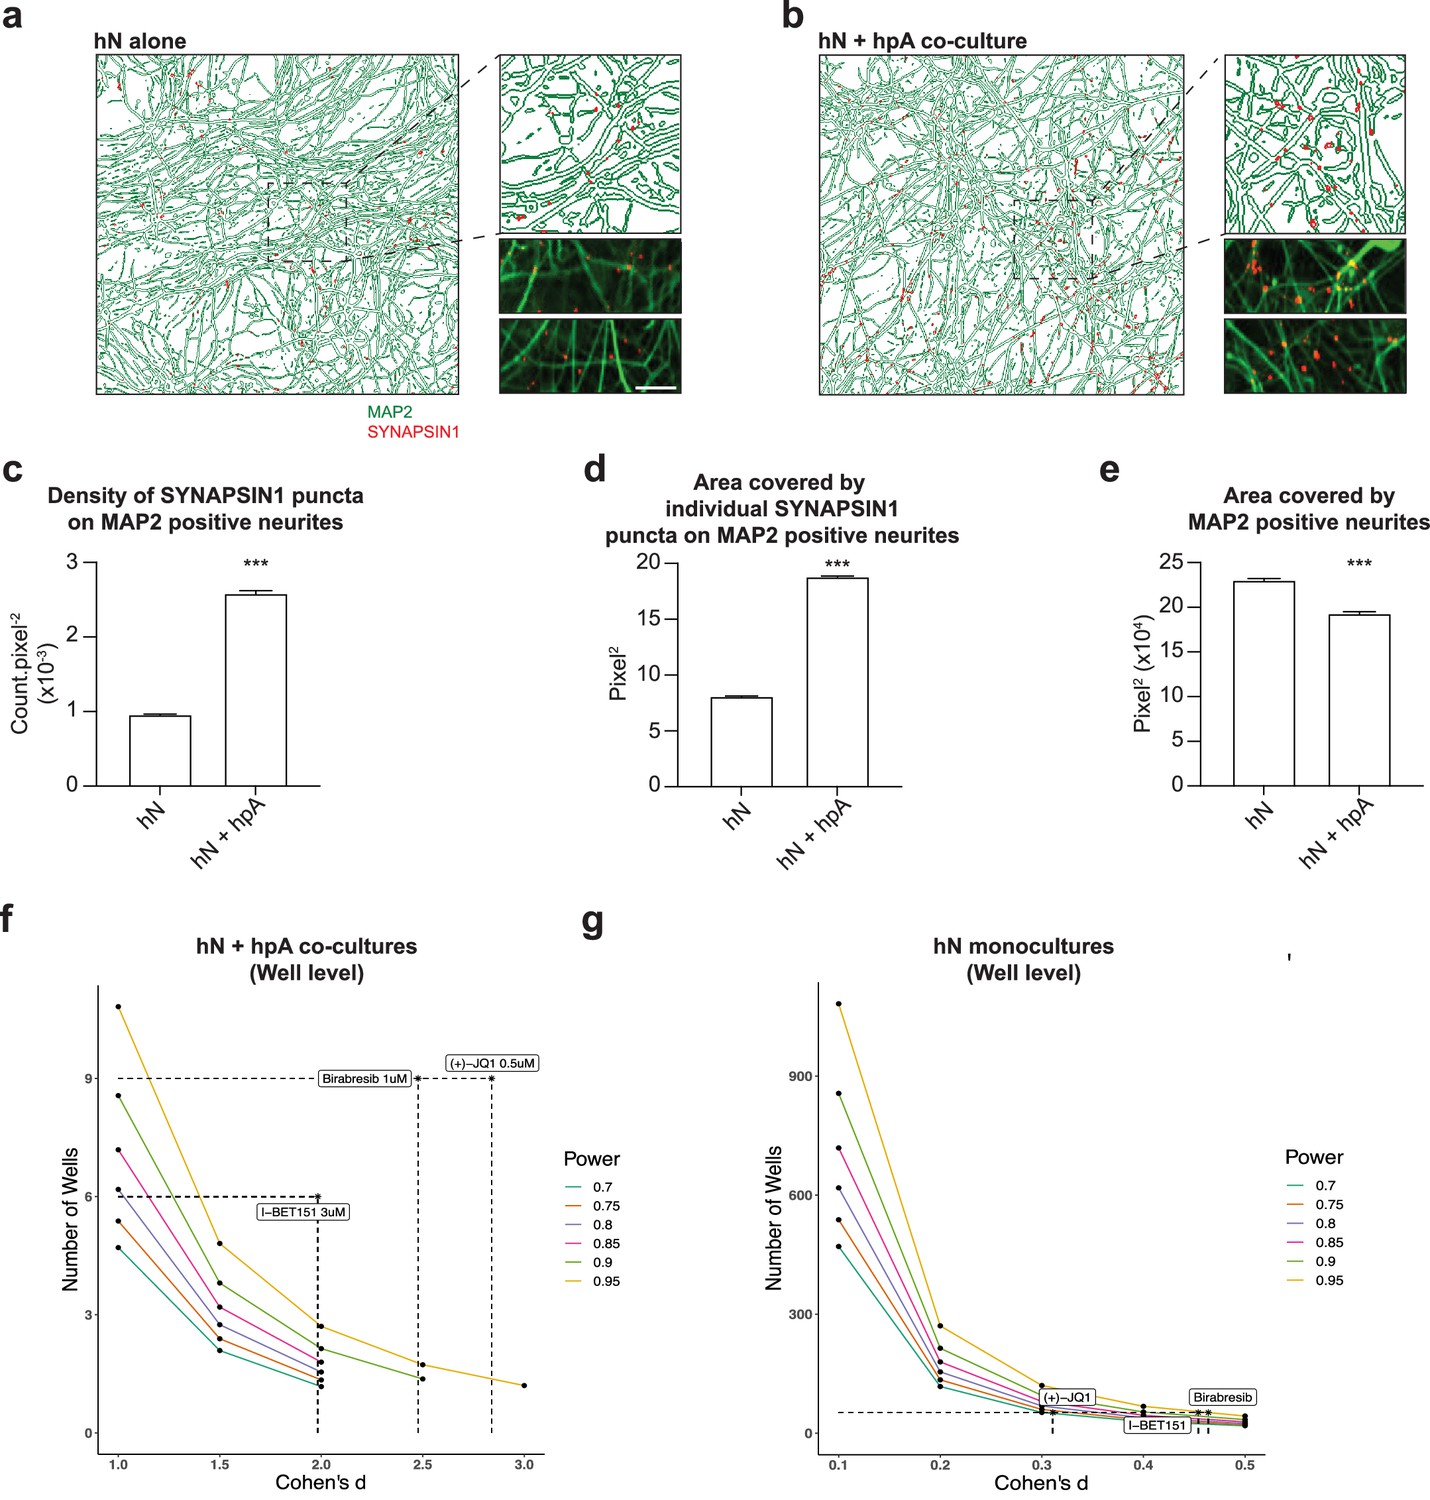
Astrocytes are key regulators of human synapse assembly in vitro.
(a, b) Representative immunofluorescence and CellProfiler output images (field-level) of hN monocultures (a) and hN + hpA co-cultures (b). Scale bar = 1 µm. (c–e) Measurements comparing the density of SYNAPSIN1 puncta on MAP2-positive neurites (c), the area covered by individual SYNAPSIN1 puncta (d) and the area covered by MAP2-positive neurites (e) between hN monocultures and hN + hpA co-cultures. Data are represented as mean values ± SEM, n = 3 biological replicates, n = 8 technical replicates (c–e); n > 1000 fields and n > 50,000 SYNAPSIN1 puncta for each condition (c–e). ***p<0.001; Kolmogorov–Smirnov unpaired t-test. (f, g) Power calculations for hN + hPA co-culture (f) and hN monoculture (g) validation experiments at the well level for the hypothesis ‘greater than.’ Cohen’s d and the number of wells analyzed for each experiment following 0.5 uM (+)-JQ1, 3 uM I-BET151, and 1 uM Birabresib treatment are indicated by the dotted lines.
Figure 5—figure supplement 1
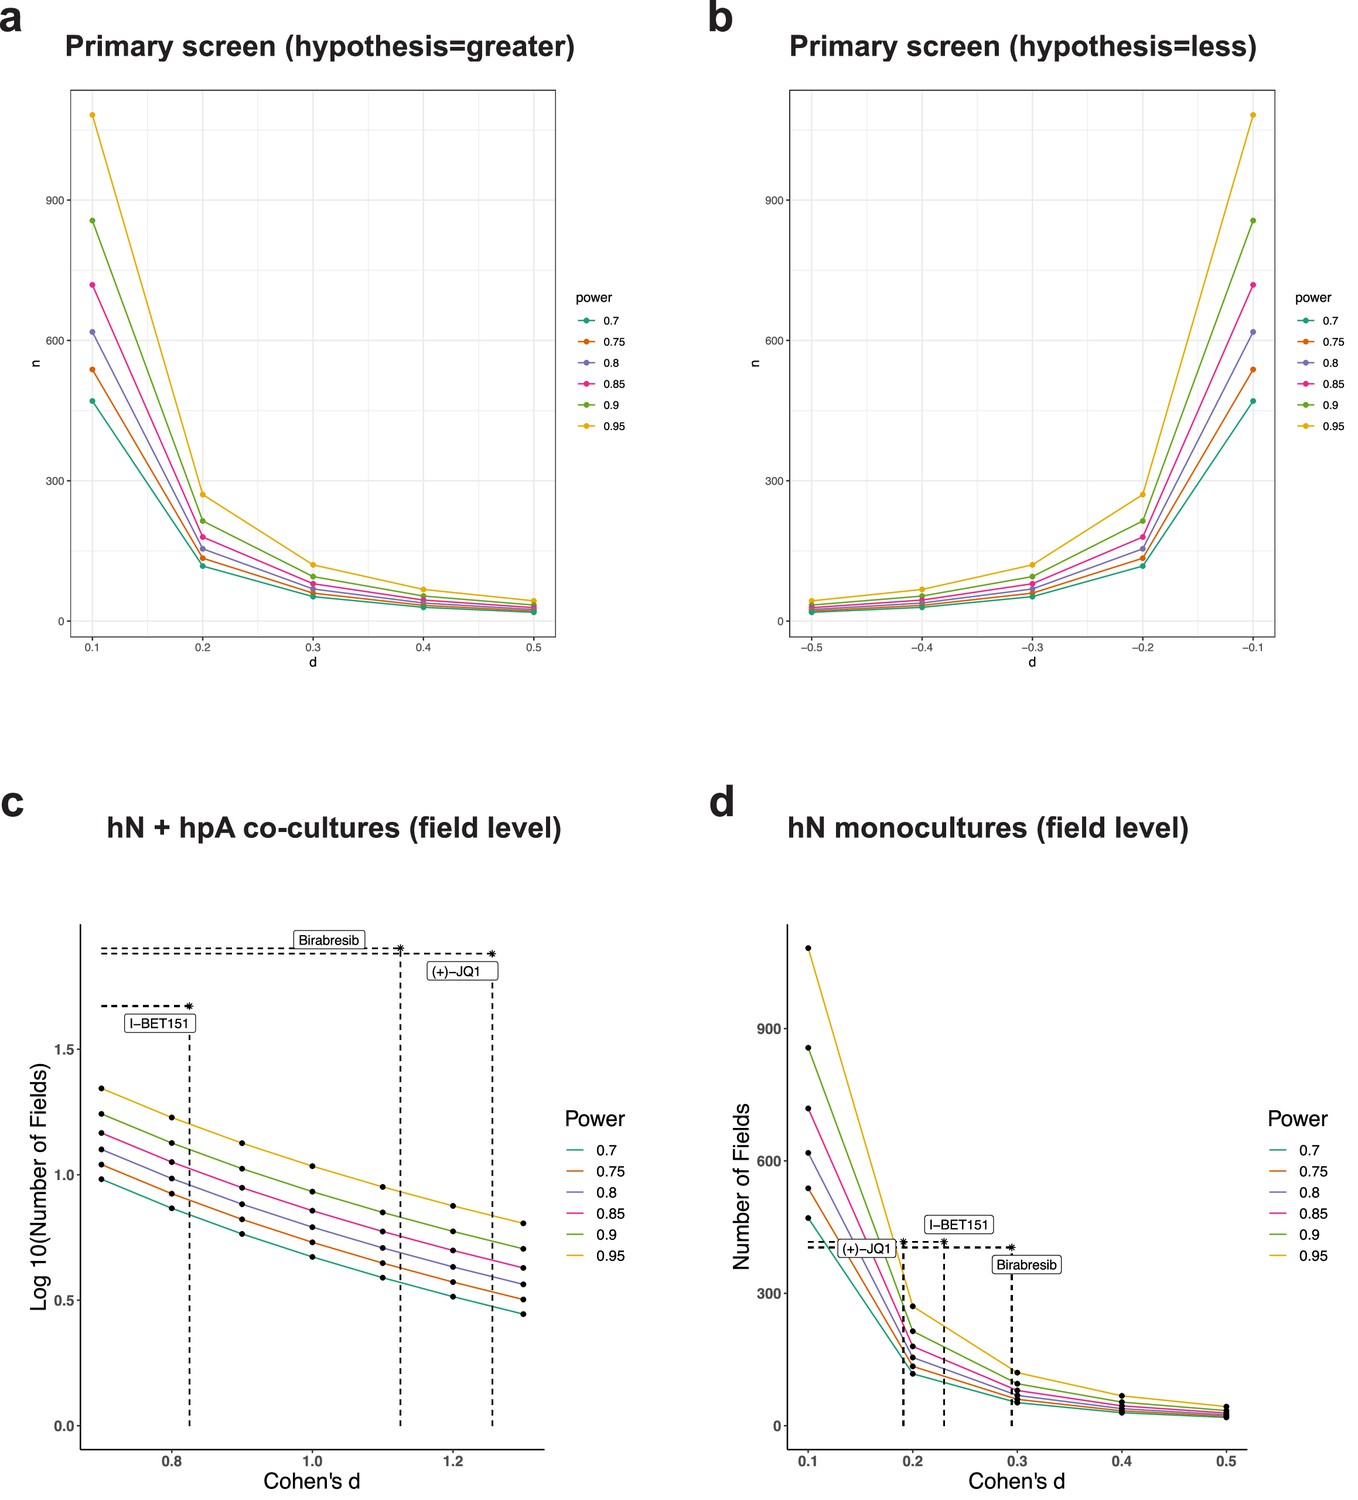
Power calculations for the primary screen and validation experiments.
(a–d) Graphs showing Cohen’s d on the x-axis and different sample sizes on the y-axis, for the primary screen with a hypothesis of ‘greater than’ (a), the primary screen with a hypothesis of ‘less than’ (b), hN + hpA co-cultures at the field level with the hypothesis ‘greater than’ (c), and hN monocultures at the field level with the hypothesis ‘greater than’ (d). Cohen’s d and the number of samples analyzed for each experiment following 0.5 uM (+)-JQ1, 3 uM I-BET151 and 1 uM Birabresib treatment are indicated by the dotted lines.
Figure 6 with 1 supplement
Multiple BET inhibitors enhance synaptic gene expression.
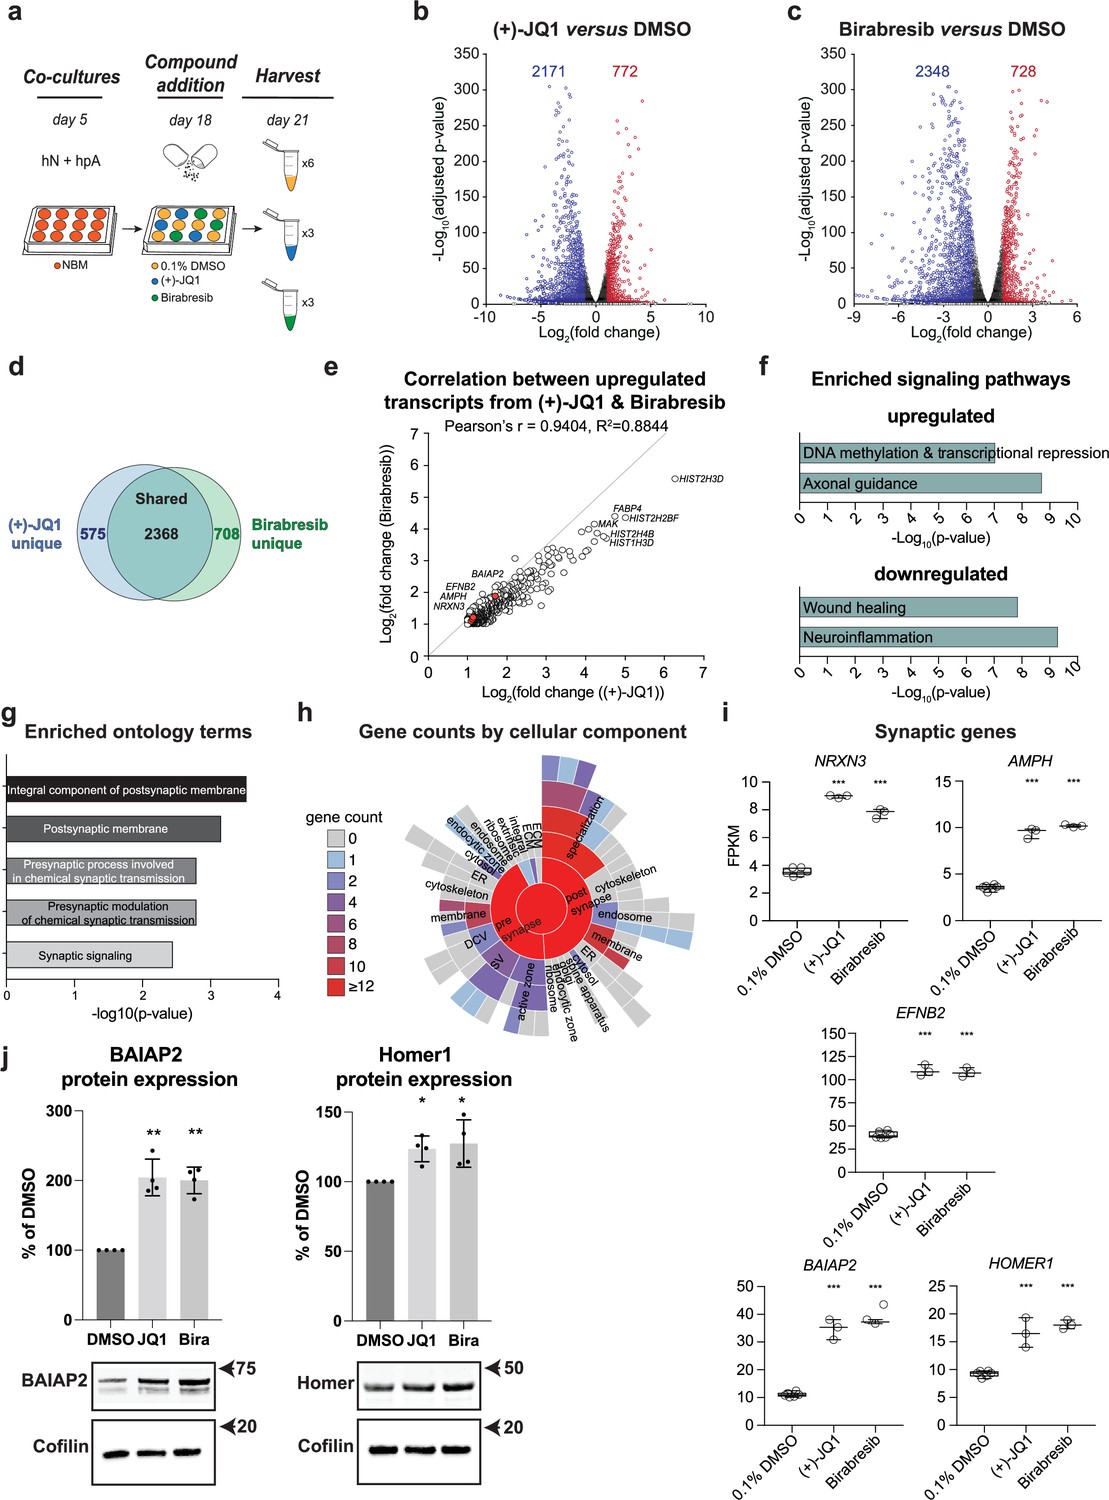
(a) Schematic of mRNA-seq experiment using 3–6 replicates per treatment condition. hN + hpA co-cultures were treated with 0.1% DMSO, 0.5 µM (+)-JQ1 or 1 µM Birabresib for 72 hr prior to harvesting. (b, c) Volcano plots for (+)-JQ1 versus DMSO control (b) and Birabresib versus DMSO control (c). Log2 fold change is shown on the x-axis, with the -log10 of the adjusted p-value shown on the y-axis. Positive fold change reflects an increase in the treatment condition relative to DMSO control. Numbers of significantly differentially expressed genes (DEGs) are shown for each condition. (d) Overlap (shown as number of genes) between DEGs identified with (+)-JQ1 treatment (blue) and DEGs identified with Birabresib treatment (green). (e) Scatterplot of the fold change read counts of the genes upregulated by (+)-JQ1 and Birabresib. Note the strong positive Pearson’s r (94%) correlation between transcripts upregulated by (+)-JQ1 and Birabresib. Select gene examples are highlighted in red. (f) Select canonical pathways identified by IPA for DEGs upregulated in both (+)-JQ1 and Birabresib treatment conditions (top) or downregulated in both (+)-JQ1 and Birabresib treatment conditions (bottom). The x-axis shows -log10 of the p-value for each pathway analysis term. (g) SynGO analysis showing the top 5 significantly enriched cellular component and biological process ontology terms identified using all genes upregulated by (+)-JQ1 and Birabresib. The x-axis shows -log10 of the p-value for each ontology term; the top two terms also met a<1% FDR threshold (h) SynGO analysis sunburst representation showing gene counts of the cellular components identified using all genes upregulated by (+)-JQ1 and Birabresib. (i) Graphs of transcript expression values for pre- and post-synaptic genes. Significance was calculated by Benjamini–Hochberg adjusted Wald test as part of the DEseq2 RNA-seq experiment. n=3 biological replicates. (j) Western blot analysis of BAIAP2 and Homer1 protein expression levels following treatment with DMSO, (+)-JQ1, or Birabresib (n = 4 biological replicates). Top, quantification (shown as % of DMSO control); bottom, example blots. For all figure panels, significance is indicated by *p<0.05, **p<0.01, ***p<0.001 relative to controls.
-
Figure 6—source data 1
Source of western blots for BAIAP2 and Homer1 as well as Cofilin loading control following DMSO, (+)-JQ1, or Birabresib treatment conditions.
Arrowheads indicate bands used for quantification.
- https://cdn.elifesciences.org/articles/80168/elife-80168-fig6-data1-v1.zip
Figure 6—figure supplement 1
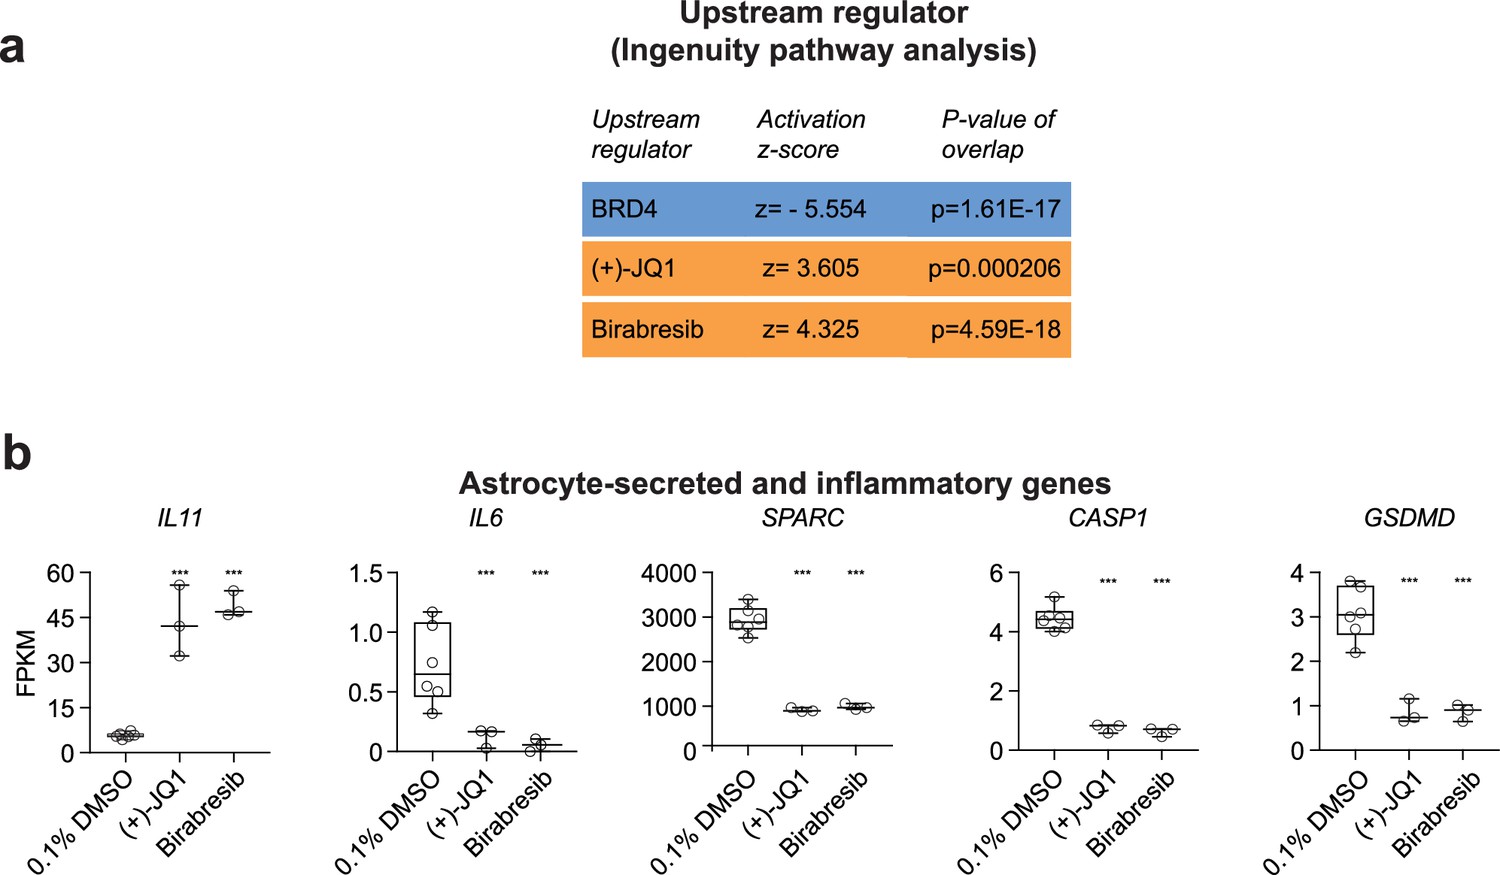
BET proteins and inhibitors are identified as upstream regulators of the differentially expressed genes (DEGs) and BET inhibition impact astrocyte-secreted and pro-inflammatory factors.
(a) DEGs shared between (+)-JQ1 and Birabresib treatment conditions were used as input into ingenuity pathway analysis, and the activation z-scores and p-values of the overlap were quantified. Blue indicates a negative activation z-score (BRD4), and orange indicates a positive activation z-score ((+)-JQ1 and Birabresib). (b) Graphs of transcript expression values for astrocyte-secreted and pro-inflammatory genes in (+)-JQ1 or Birabresib conditions compared to 0.1% DMSO controls. Significance was calculated by Benjamini–Hochberg adjusted Wald test as part of the DEseq2 RNA-seq experiment. ***p<0.001. n>3 biological replicates.
Tables
Key resources table
| Reagent type (species) or resource | Designation | Source or reference | Identifiers | Additional information |
|---|---|---|---|---|
| cell line (Homo sapiens) | WA01 | WiCell Research Institute | H1 | Thomson et al., 1998 |
| cell line (Homo sapiens) | Primary astrocytes | ScienCell Research Laboratories | Cat#1800 | |
| transfected construct (Homo sapiens) | SYNAPSIN1 and control siRNA | Accell Dharmacon | Cat#A-12362-16-0005 and Cat#K-005000-R1-01 | transfected construct (Homo sapiens) |
| antibody | Anti-human SYNAPSIN1 (Rabbit polyclonal) | Millipore | Cat#AB1543 RRID: AB_2200400 | IF (1:1000) WB (1:1000) |
| antibody | Anti-human MAP2 (Chicken polyclonal) | Abcam | Cat#ab5392 RRID: AB_2138153 | IF (1:1000) |
| antibody | Anti-human SYNAPTOPHYSIN (Mouse monoclonal) | Cell Signaling Technology | Cat#9020 RRID: AB_2631095 | IF (1:500) |
| antibody | Anti-human PSD95 (Mouse monoclonal) | Thermo Fisher Scientific | Cat#MA1-046 RRID: AB_2092361 | IF (1:500) |
| antibody | Anti-human GAPDH (Mouse monoclonal) | Millipore | Cat#MAB374 RRID: AB_2107445 | WB (1:1000) |
| antibody | Anti-human HOMER (Rabbit polyclonal) | Synaptic Systems | Cat#160003 RRID: AB_887730 | WB (1:500) |
| antibody | Anti-human BAIAP2 (Rabbit polyclonal) | Thermo Fisher Scientific | Cat#PA5-30386 RRID: AB_2547860 | WB (1:500) |
| antibody | Anti-human COFILIN | Abcam | Cat#ab42824 RRID: AB_879739 | WB (1:1000) |
| recombinant DNA reagent | pAAVS1-iNGN2-Zeo (plasmid) | This study | ||
| sequence-based reagent | Forward NGN2 | This study | PCR primers | AGGAAATGGGGGTGTGTCAC |
| sequence-based reagent | Reverse NGN2 | This study | PCR primers | GAGCTCCTCTGGCGATTCTC |
| commercial assay or kit | DNeasy Blood and tissue kit | Qiagen | Cat#695004 | |
| commercial assay or kit | RLTplus Lysis buffer | Qiagen | Cat#1053393 | |
| commercial assay or kit | RNeasy micro/mini kit | Qiagen | Cat#74034 | |
| chemical compound, drug | Geneticin | Life Technologies | Cat#10131035 | 50 µg.mL–1 |
| chemical compound, drug | SB431542 | Tocris | Cat#1614 | 10 µM; 5 µM |
| chemical compound, drug | XAV939 | Stemgent | Cat#04–00046 | 2 µM; 1 µM |
| chemical compound, drug | LDN-193189 | Stemgent | Cat#04–0074 | 100 nM; 50 nM |
| chemical compound, drug | Doxycycline hyclate | SIgma | Cat#D9891 | 2 µg.mL–1 |
| chemical compound, drug | Y27632 | Stemgent | Cat#04–0012 | 5 mM |
| chemical compound, drug | Zeocin | Invitrogen | Cat#46–059 | 1 µg.mL–1 |
| chemical compound, drug | BDNF | R&D Systems | Cat#248-BD/CF | 10 ng.mL–1 |
| chemical compound, drug | CTNF | R&D Systems | Cat#257-NT-CF | 10 ng.mL–1 |
| chemical compound, drug | GDNF | R&D Systems | Cat#212-GD/CF | 10 ng.mL–1 |
| chemical compound, drug | Floxuridine | Sigma-Aldrich | Cat#F0503-100MG | 10 µg.mL–1 |
| chemical compound, drug | Compound library | SelleckChem | L3500 | |
| software, algorithm | Columbus Acapella | Perkin Elmer | ||
| software, algorithm | CellProfiler | The Broad Institute |
Additional files
-
Supplementary file 1
List of the 376 small molecules used in the primary screen including molecule name, synonyms, library, supplier, catalog number, target, additional notes, and pathway.
- https://cdn.elifesciences.org/articles/80168/elife-80168-supp1-v1.xlsx
-
Supplementary file 2
Power calculations for the primary screen overall, the primary screen by compound, co-cultures at the field level, co-cultures at the well level, neuron monocultures at the field level, and neuron monocultures at the well level.
- https://cdn.elifesciences.org/articles/80168/elife-80168-supp2-v1.xlsx
-
Supplementary file 3
Transcriptional analyses after (+)-JQ1 inhibition.
- https://cdn.elifesciences.org/articles/80168/elife-80168-supp3-v1.xlsx
-
Supplementary file 4
Transcriptional analyses after Birabresib inhibition.
- https://cdn.elifesciences.org/articles/80168/elife-80168-supp4-v1.xlsx
-
Supplementary file 5
SynGO analyses including the GO term ID, domain, name, and p-value.
- https://cdn.elifesciences.org/articles/80168/elife-80168-supp5-v1.xlsx
-
MDAR checklist
- https://cdn.elifesciences.org/articles/80168/elife-80168-mdarchecklist1-v1.docx
Download links
A two-part list of links to download the article, or parts of the article, in various formats.
Downloads (link to download the article as PDF)
Open citations (links to open the citations from this article in various online reference manager services)
Cite this article (links to download the citations from this article in formats compatible with various reference manager tools)
High-content synaptic phenotyping in human cellular models reveals a role for BET proteins in synapse assembly
eLife 12:e80168.
https://doi.org/10.7554/eLife.80168


