Using population selection and sequencing to characterize natural variation of starvation resistance in Caenorhabditis elegans
- Department of Biology, Duke University, United States
- Department of Molecular Biosciences, Northwestern University, United States
- Division of Biology, California Institute of Technology, United States
- Center for Genomic and Computational Biology, Duke University, United States
Figures
Figure 1
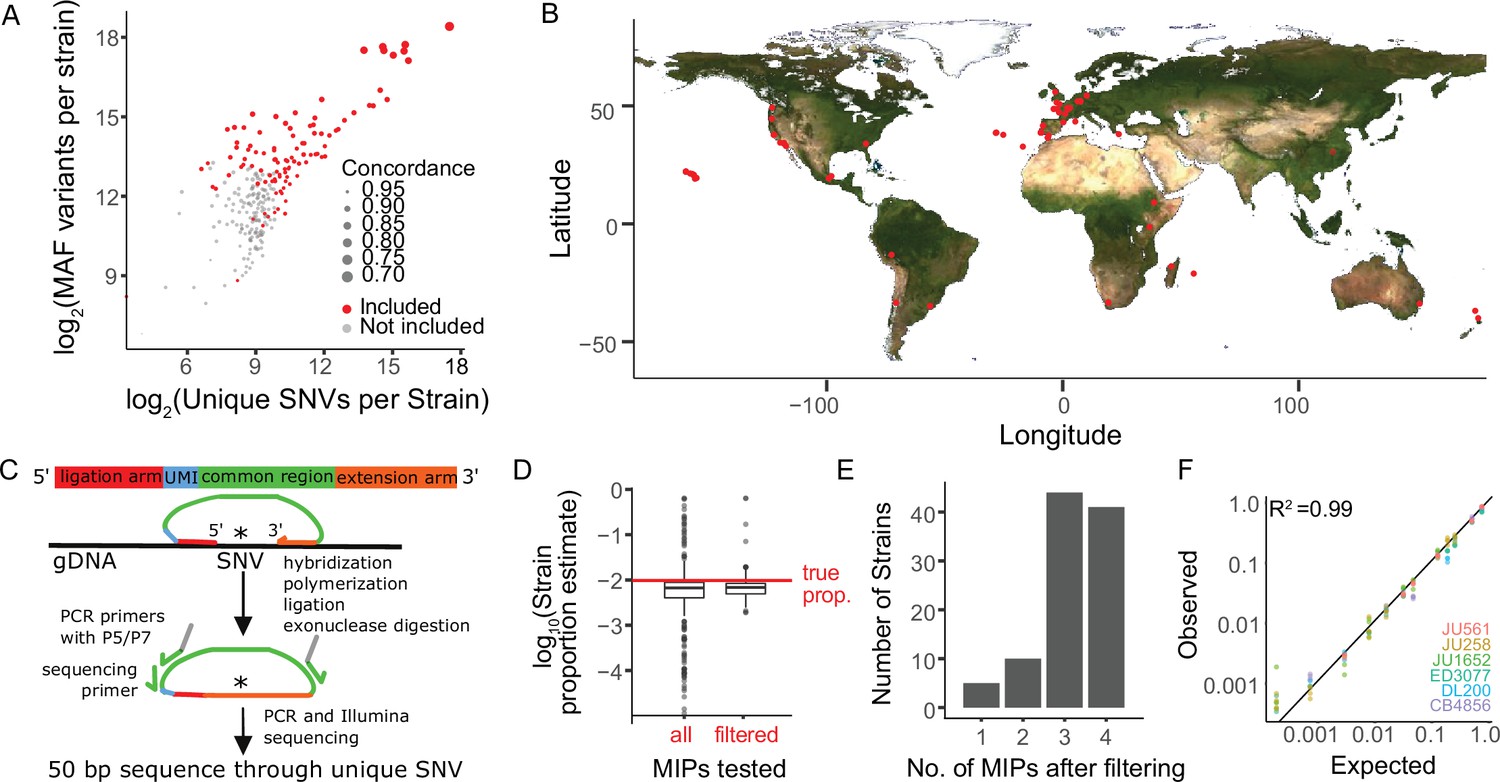
Sensitive and precise measurement of strain frequency in pooled culture using MIP-seq.
(A) The three metrics used to identify the most diverse C. elegans strains are plotted. ‘MAF’ stands for minor allele frequency. Concordance refers to the average pairwise concordance for the focal strain compared to all other strains, which is calculated as the number of shared variant sites divided by the total number of variants for each pair. The strains included in the MIP-seq experiments are in red. (B) Geographic locations of the strains assayed for starvation resistance. (C) Schematic of MIP-seq. MIPs are designed for loci with SNVs unique to each strain. Four MIPs were designed per strain. MIPs are 80 nt long and include ligation and extension arms to match DNA sequence surrounding the SNV, a unique molecular identifier (UMI), and P5 and P7 sequences for Illumina sequencing. MIPs are hybridized to genomic DNA, polymerized, ligated, and used as PCR template to generate an Illumina sequencing library. The alternative-to-total read frequency for each MIP/SNV locus indicates strain frequency. (D) Empirical testing of 412 MIPs with an equimolar mix of genomic DNA from 103 strains to identify reliable MIPs. 321 MIPs passed filtering and were analyzed in the starvation experiment. Outliers for filtered MIPs are for N2, which has hardly any unique SNVs because it is derived from the reference genome. N2 MIPs were included despite poor performance. (E) Number of MIPs per strain of the 321 filtered MIPs that passed filtering. (F) Genomic DNA from seven strains was combined at different known concentrations, and MIP-seq was used to generate a standard curve. Included MIPs all passed filtering. (R2=0.99).
Figure 2 with 4 supplements
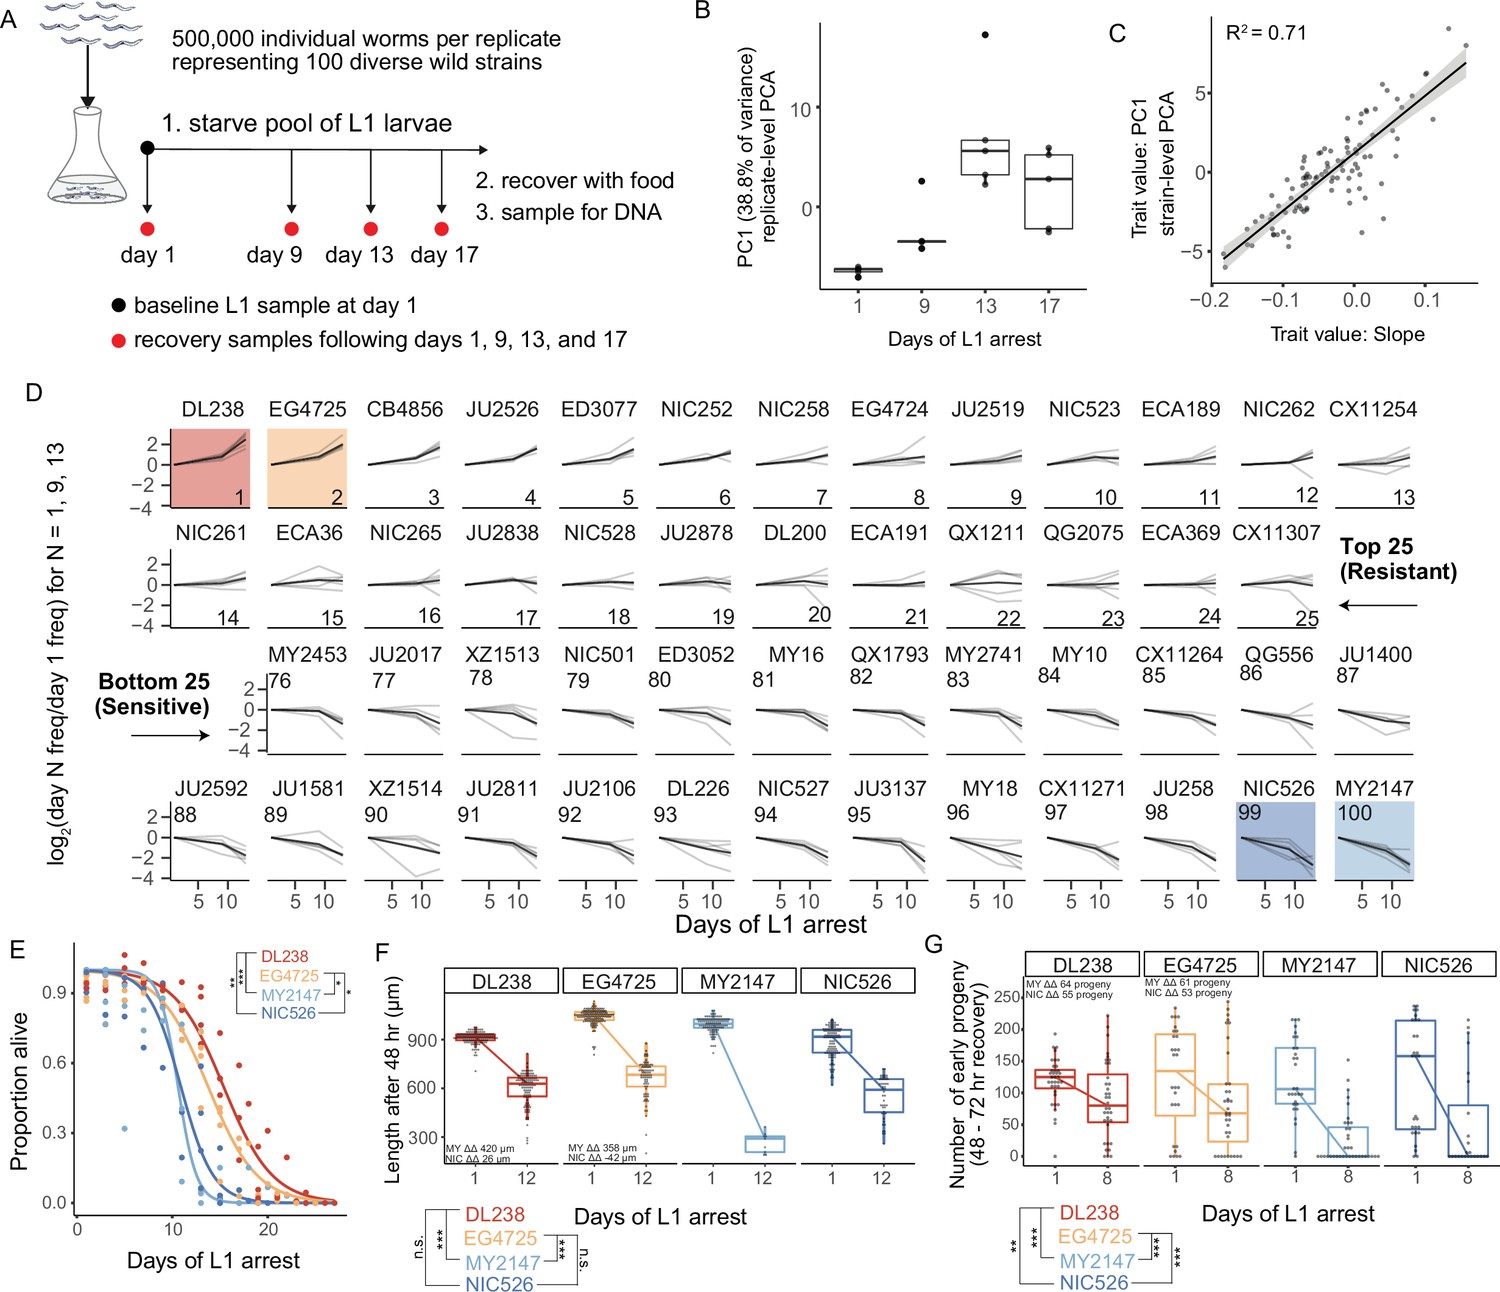
MIP-seq determines relative starvation resistance of 100 strains.
(A) Experimental design. Worms were starved at the L1 stage ('L1 arrest').~5000 L1 larvae per strain were starved (~500,000 total). The population of starved L1 larvae was sampled initially (‘baseline’ on day 1), and then sampled on the days indicated. Samples (except baseline) were recovered with food in liquid culture, reaching adulthood and producing progeny for 1 day, and the entire population was frozen for DNA isolation. Five biological replicates were performed. (B) Principal component 1 of normalized and processed data from all replicates (replicate-level) and strains is plotted, revealing association with duration of starvation. Each point is an individual sample (MIP-seq library). (C) The relationship between two starvation-resistance metrics (Slope and PC1) produced from strain-level data (replicates averaged) is plotted. Each point is a different strain. (D) Log2-normalized strain frequency is plotted over time for the 25 most resistant and 25 most sensitive strains in rank order (based on Slope). Only days 1, 9, and 13 are plotted. See Figure 2—figure supplement 2 for full data. Grey lines are biological replicates and black line is the mean. DL238 and EG4725 are most starvation-resistant, and NIC526 and MY2147 are most sensitive, and they are color-coded accordingly. (E) L1 starvation survival curves are plotted for starvation-resistant and sensitive strains. Individual replicate measurements are included as points to which curves were fit with logistic regression. T-tests on 50% survival time of four biological replicates. (F) Worm length following 48 hours of recovery with food after 1 or 12 days of L1 starvation. (G) Number of progeny produced between 48 and 72 hr of recovery on food following 1 or 8 days of starvation. (F,G) ΔΔ indicates effect size of interaction between duration of starvation and strain data plotted in that panel compared to the strain listed (the difference in differences between strains’ mean length at days 1 and 12 or between mean number of progeny at days 1 and 8). ‘MY’ is an abbreviation for MY2147 and ‘NIC’ is an abbreviation for NIC526. Linear mixed-effects model; one-way p-value of interaction between duration of starvation and strain. (E–G) ***p<0.001, **p<0.01, *p<0.05.
-
Figure 2—source data 1
Source data for manual starvation resistance assays of wild strains.
- https://cdn.elifesciences.org/articles/80204/elife-80204-fig2-data1-v2.xlsx
Figure 2—figure supplement 1
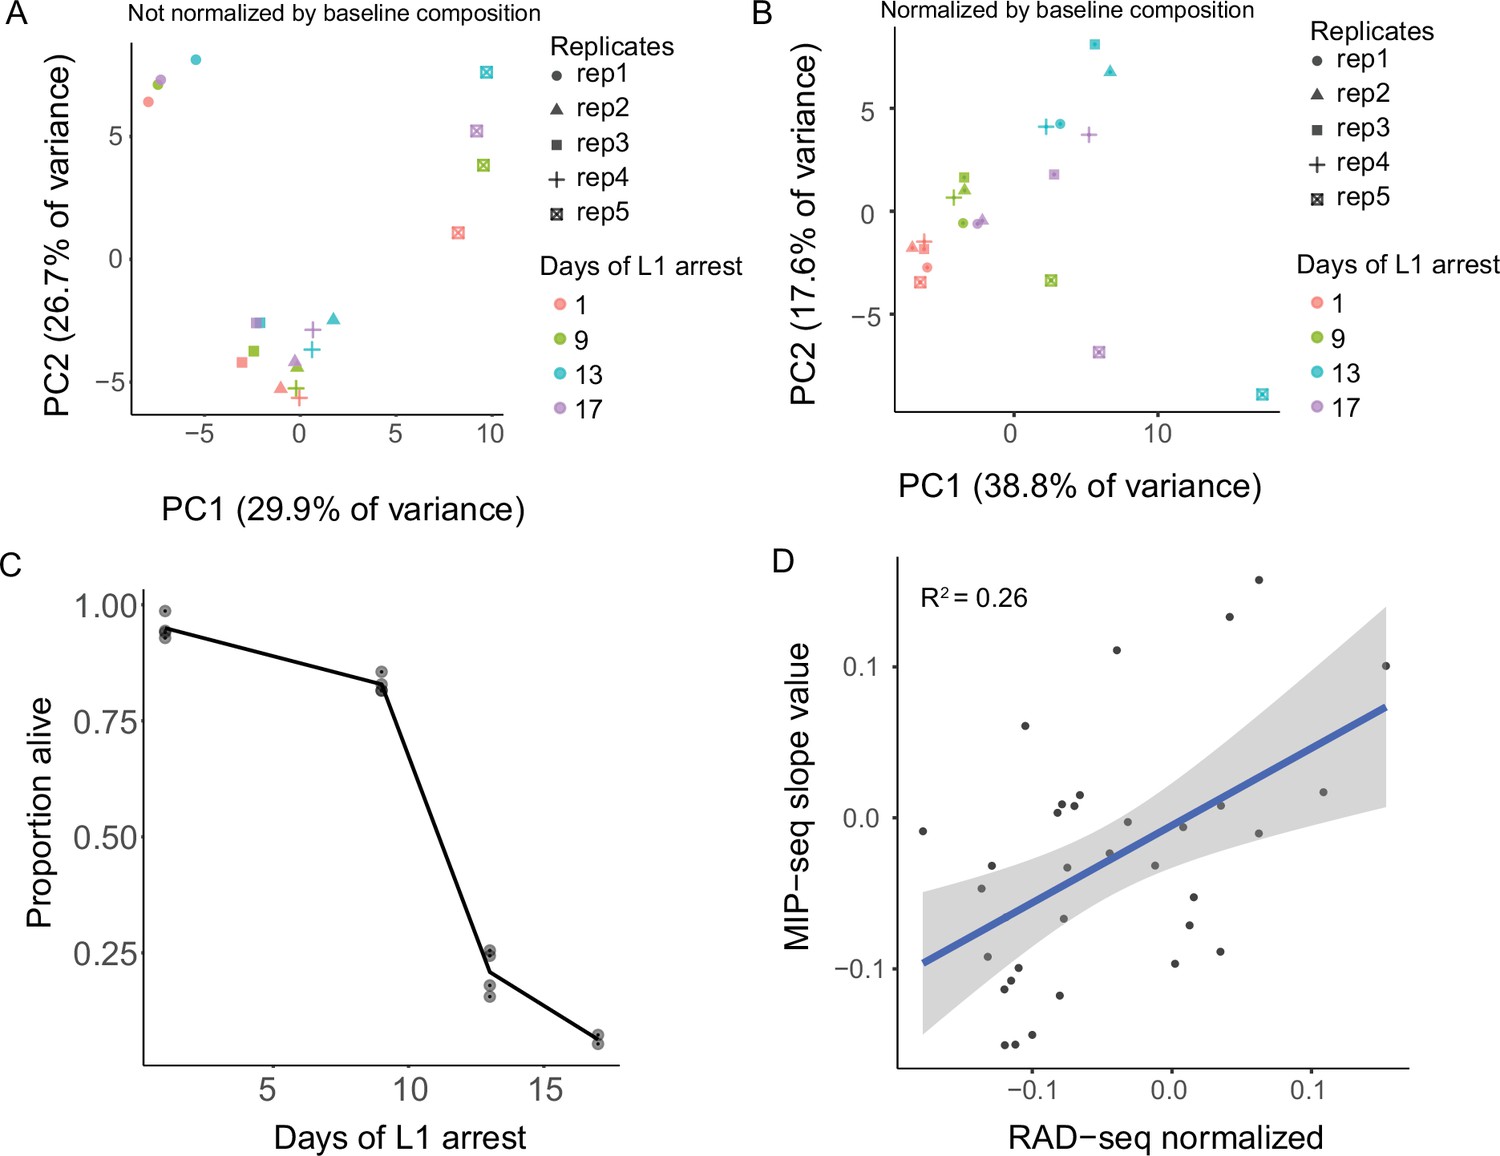
MIP-seq data analysis and comparison to RAD-seq analysis of starvation resistance.
(A) PCA of all replicates and recovery time points assayed not normalized by baseline composition. Samples cluster by replicate. (B) PCA of all replicates and recovery time points normalized by baseline composition of each replicate pool on day 1 of starvation without recovery (See Figure 2A). PC1 is plotted in Figure 2B. (C). Survival of cultures used to collect samples for MIP-seq experiment (Figure 2) at days 1, 9, 13, and 17. (D) Comparison of MIP-seq trait value Slope to similar trait value derived from published results using RAD-seq for population sequencing (Webster et al., 2018). Thirty-four strains included in both experiments are plotted. RAD-seq results are based on only a single replicate, and the vast majority of reads from RAD-seq do not cover unique SNV greatly limiting sequencing depth at informative loci. R2 = 0.26 (p=0.002).
Figure 2—figure supplement 2
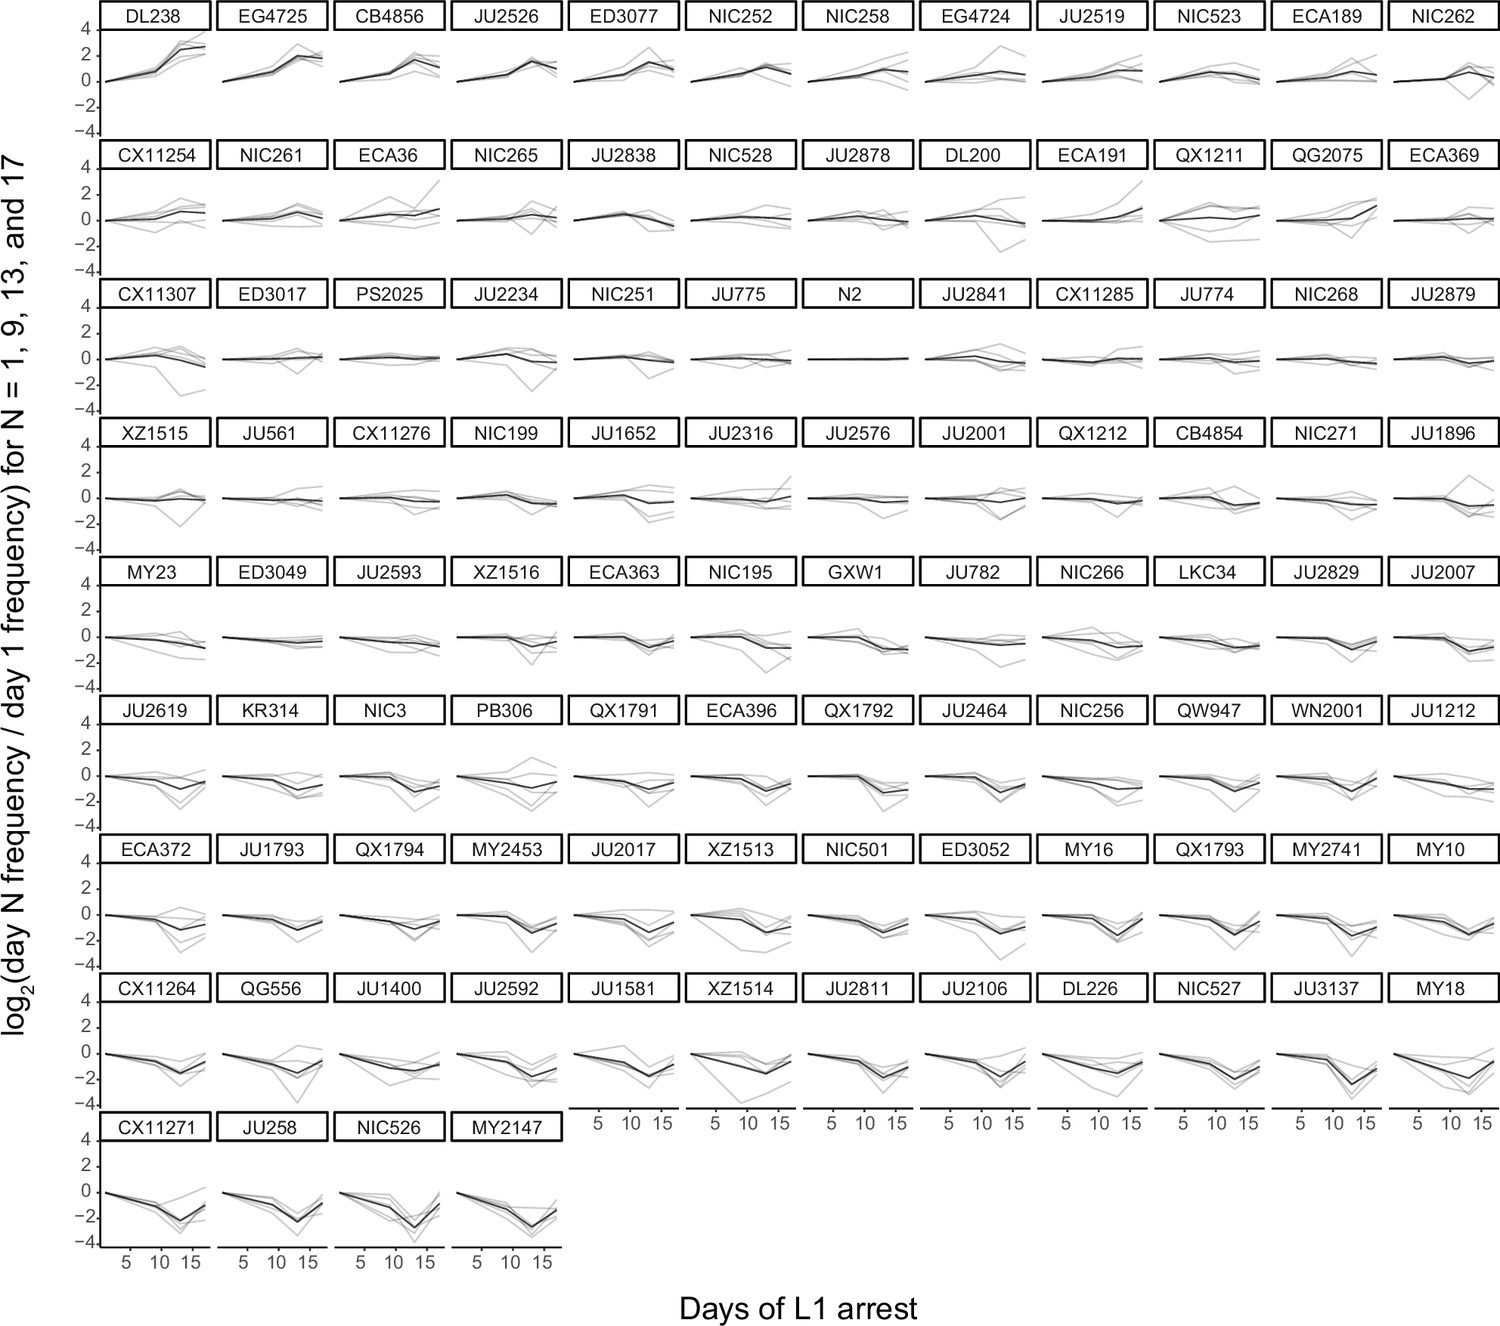
MIP-seq strain frequencies throughout starvation for all strains assayed.
MIP-seq replicates were first normalized by baseline and then by day 1. Strains are rank-ordered from most starvation-resistant to most sensitive by Slope trait values. Gray lines are individual replicates and black lines are the mean for each strain.
Figure 2—figure supplement 3
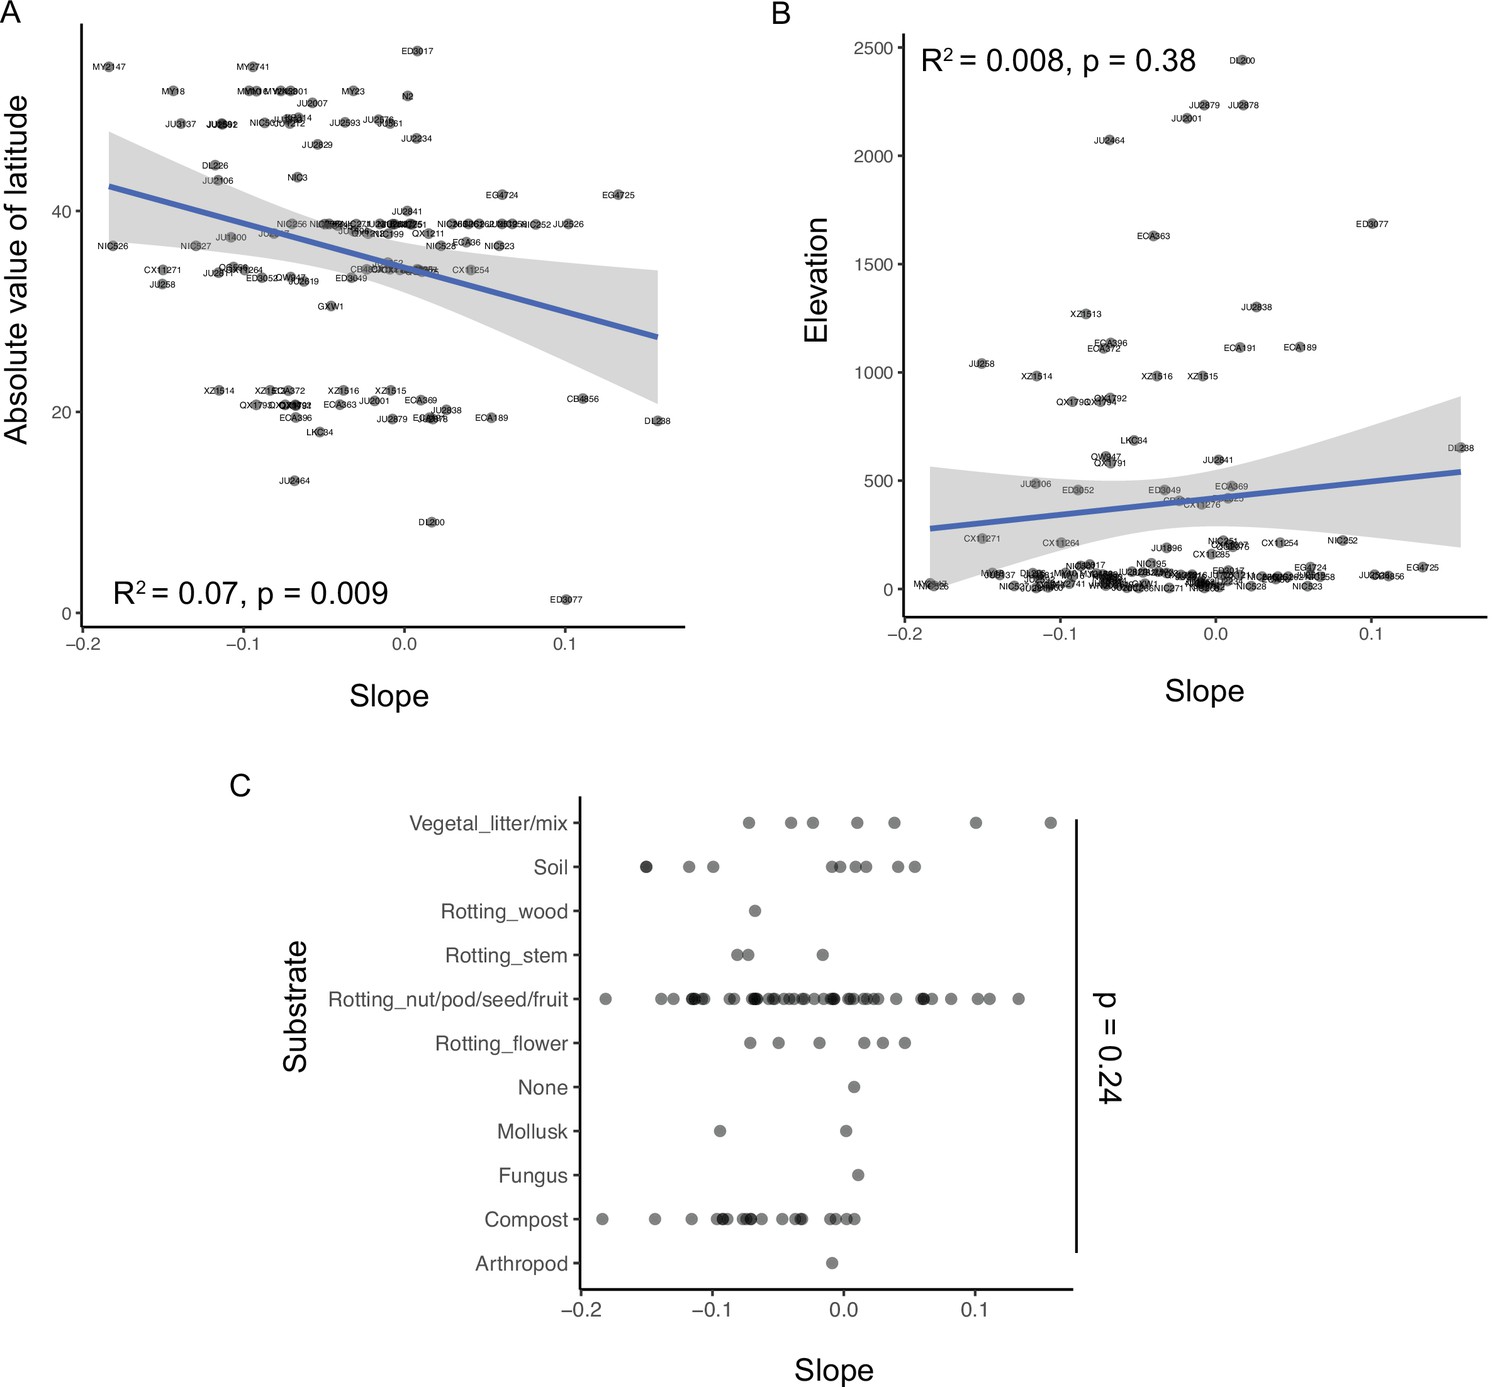
Starvation resistance of wild strains is associated with latitude at collection site, but not elevation or substrate.
(A) ‘Slope’ trait value for each strain plotted against the absolute value of its latitude of collection. R2 = 0.07, p = 0.009. (B) ‘Slope’ trait value for each strain plotted against the elevation from which strains were collected. R2 = 0.008, p = 0.38. (A–B) Significance determined by t-test on t-statistic of slope coefficient from linear model. (C) Slope trait values plotted for strains collected from each type of substrate. One-way ANOVA across all substrates, p = 0.24.
Figure 2—figure supplement 4
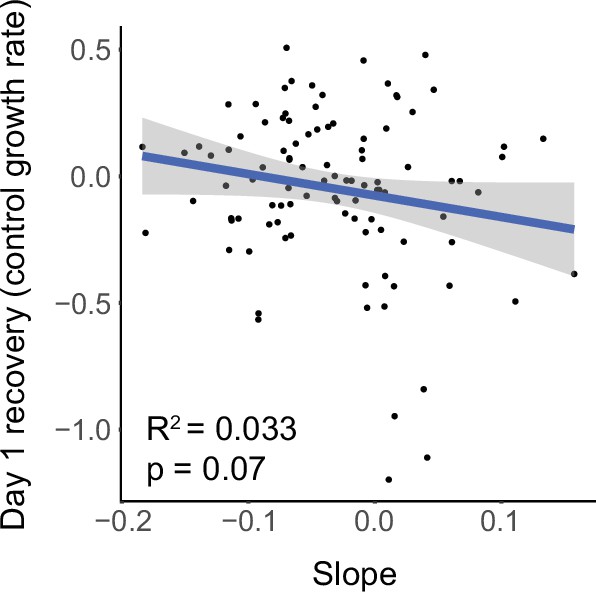
Starvation resistance is negatively correlated with growth rate.
Slope trait value is plotted against ‘Early Growth’ trait value calculated by determining which strains became over- or under-represented after recovery from day 1 of L1 starvation relative to baseline composition at day 1 of L1 starvation. R2 = 0.033, significance determined by t-test on t-statistic of slope coefficient from linear model.
Figure 3 with 1 supplement
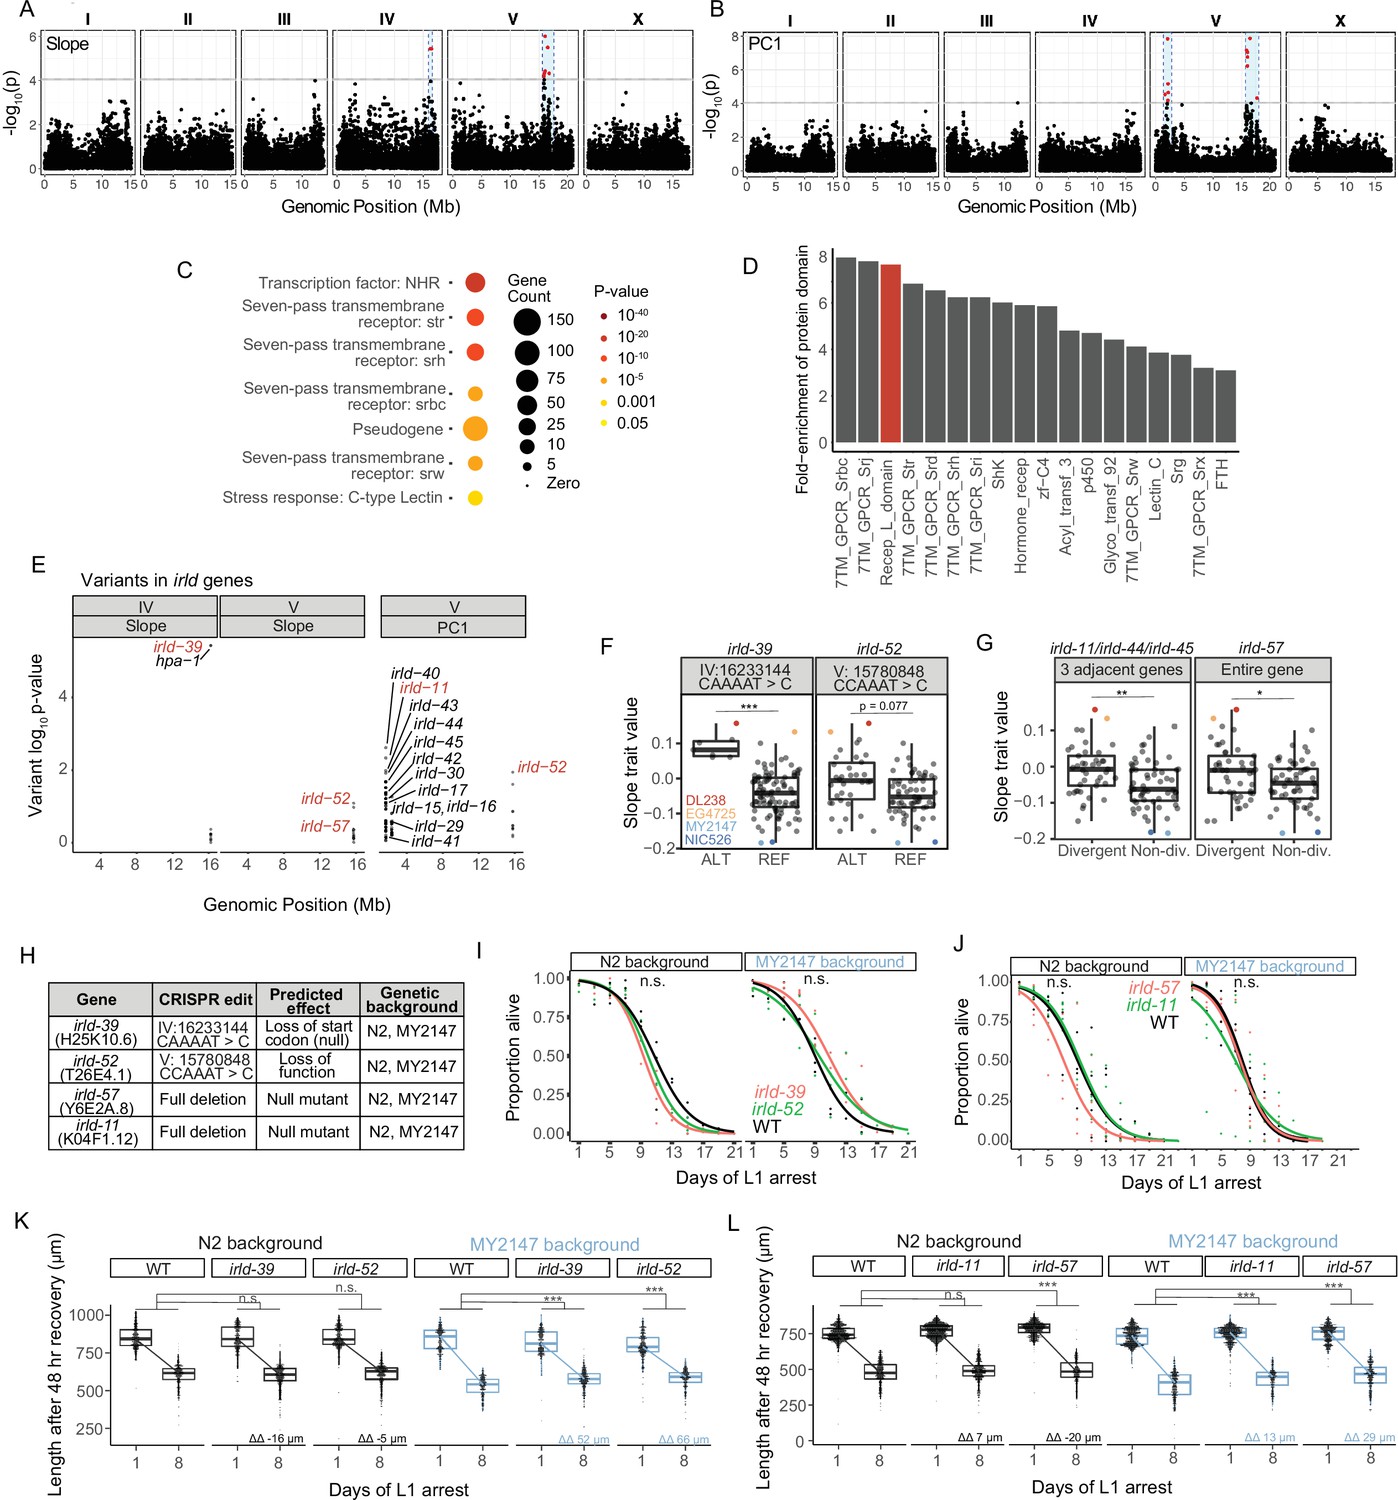
Genetic variation in the irld gene family underlies differences in starvation resistance.
(A) GWA output using Slope as a trait value. Significant QTL intervals are IV: 15939340–16613710 and V: 15660911–17615557. (B) GWA output using PC1 as a trait value. Significant QTL intervals are V: 1345848–2764788 and V: 15775895–18065050. (C) WormCat Category 3 enrichments for all genes with variants in the QTL. (D) Fold-enrichment of protein domains significantly enriched among genes with variants in QTL. A hypergeometric p-value was calculated for each of 102 protein domains present, and a Bonferroni-corrected p-value of 0.00049 was used as a threshold to determine significance. Red indicates the receptor L domain, which is found in irld genes. (E) All variants in irld genes that are within significant QTL and their association with the starvation-resistance traits, Slope and PC. Each gene name is shown next to the most significant variant for that gene, but multiple variants are plotted for each gene when present. Red indicates genes selected for functional validation. (F) Slope trait values for strains based on whether they have ALT and REF alleles for specific irld-39 and irld-52 variants predicated to disrupt protein function. The irld-52 variant p-value is p=0.007 for the PC1 trait value (only the Slope trait value is shown here). Significance determined from GWA fine mapping. (G) Slope trait values for strains based on whether they are hyper-divergent or not at irld-11 and irld-57 loci. T-test on trait values between hyper-divergent and non-divergent strains. (F–G) DL238, EG4725, NIC526, and MY2147 are color-coded as indicated. (H) The four irld genes selected for genome editing and the edits generated for each. For irld-39 and irld-52, N2 and MY2147 have the REF allele and were edited to have the ALT allele. irld-11 and irld-57 are hyper-divergent in DL238 and EG2745 backgrounds, so full gene deletions were generated in N2 and MY2147 backgrounds. (I) L1 starvation survival assays on irld-39 and irld-52 ALT alleles in N2 and MY2147 backgrounds. There were no significant differences between strains within a background. (J) L1 starvation survival assays on irld-11 and irld-57 deletions in N2 and MY2147 backgrounds. There were no significant differences between strains within a background. (K–L). Worm length following 48 hr recovery with food after 1 or 8 d of L1 starvation for indicated genotypes. Linear mixed-effects model; one-way p-value for interaction between strain and duration of starvation; 4–5 biological replicates per condition. ΔΔ indicates effect size of interaction between duration of starvation and strain compared to control (the difference in differences between strains’ mean length at days 1 and 8). (F,G,K,L) ***p<0.001, **p<0.01, *p<0.05, n.s. not significant.
-
Figure 3—source data 1
Source data for starvation resistance assays of irld strains.
- https://cdn.elifesciences.org/articles/80204/elife-80204-fig3-data1-v2.xlsx
Figure 3—figure supplement 1
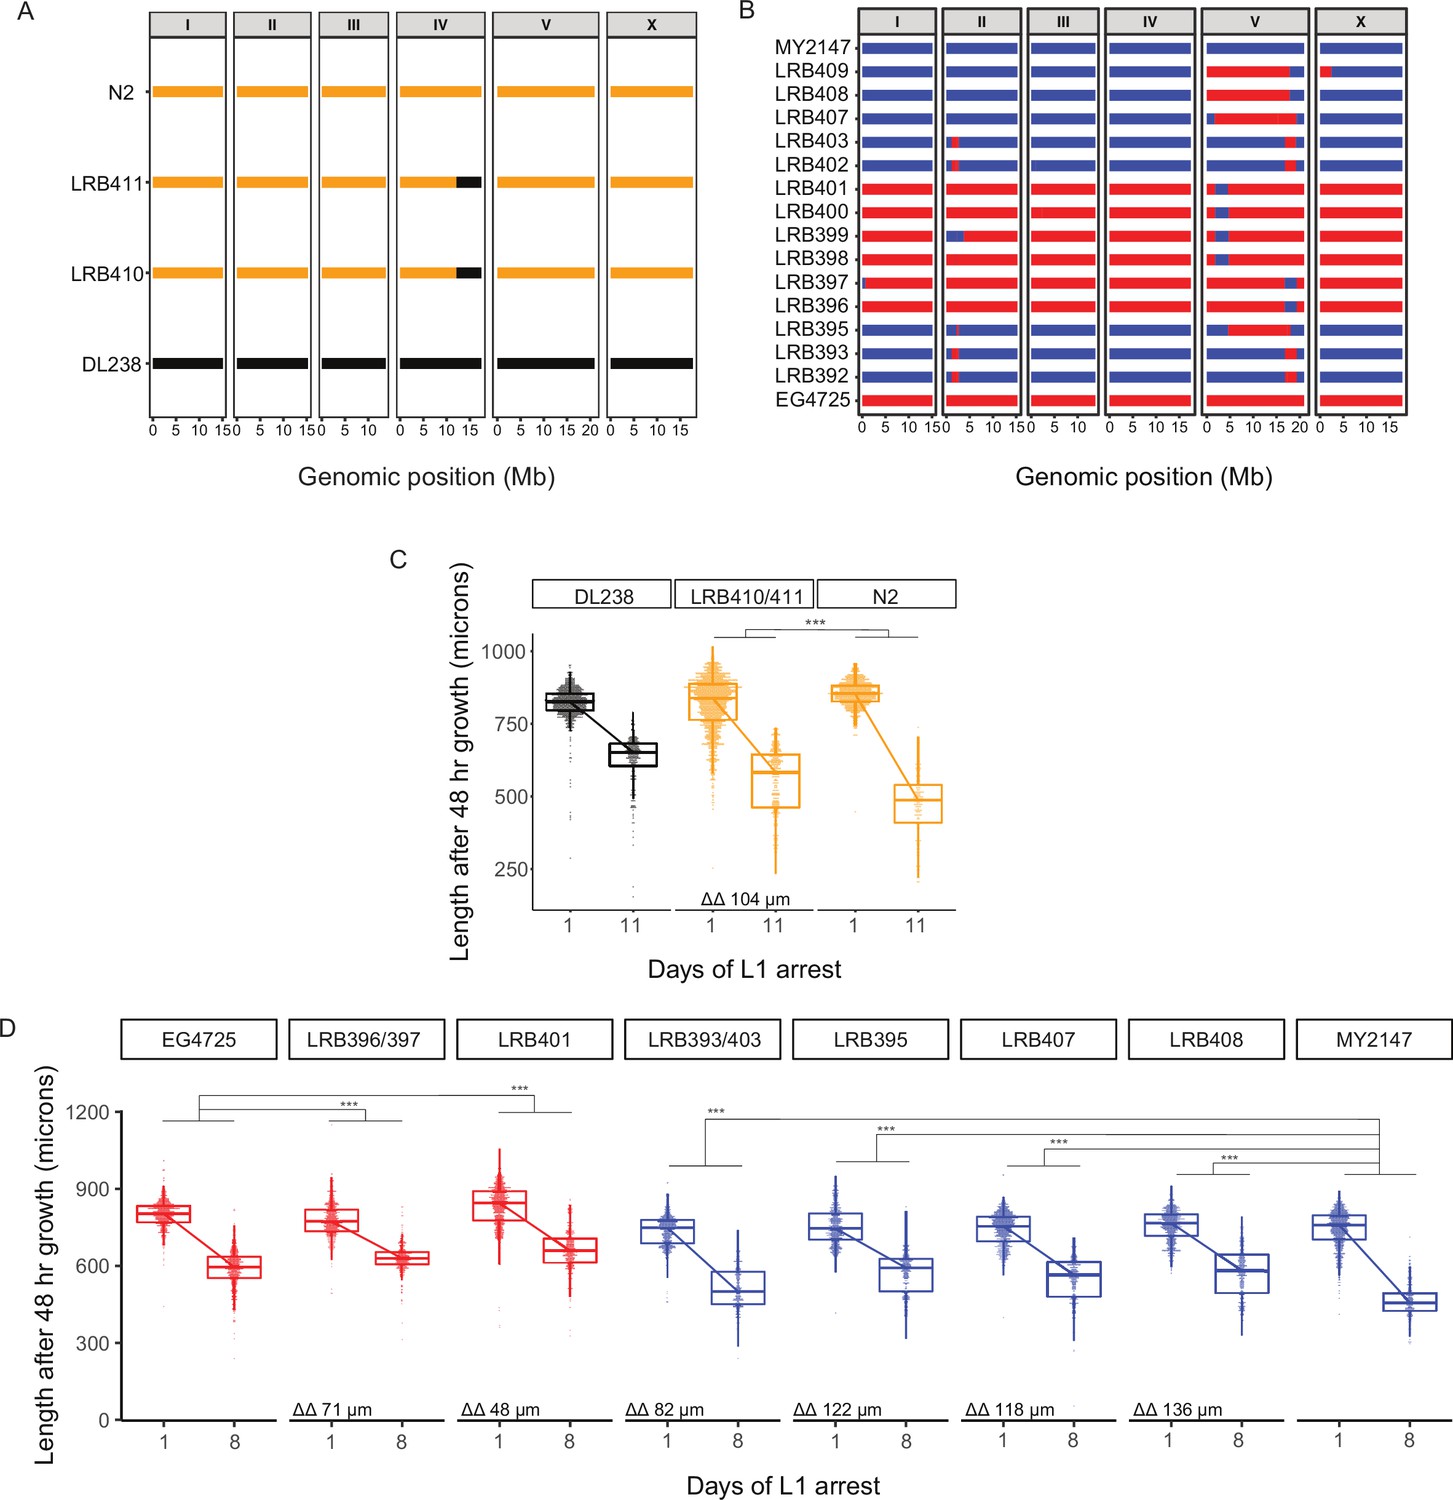
Validation of QTL with sequenced near-isogenic lines (NILs).
(A) Schematic of low-depth (~1 x) genome-sequencing results of NILs used to validate chromosome IV QTL. Parental strains are N2 and DL238. DL238 can be introgressed into N2 but not vice versa due to genetic incompatibility (Ben-David et al., 2017). N2 sequence is in gold, while DL238 sequence is in black. (B) Schematic of low-depth (~1 x) genome-sequencing results of NILs used to validate chromosome V QTL. Parental strains are MY2147 and EG4725, which are compatible and were introgressed reciprocally. MY2147 sequence is in blue, while EG4725 sequence is in red. (C) Worm length following 48 hr recovery with food after 1 or 11 d of L1 starvation for indicated strains. Data were merged for essentially duplicate strains LRB410 and LRB411. Color-coding indicates the primary parental background (e.g. LRB410 is primarily the N2 background so is plotted in yellow). (D) Worm length following 48 hr recovery with food after 1 or 8 d of L1 starvation for indicated strains. Data were merged for essentially duplicate strain pairs LRB396 and LRB397, and LRB393 and LRB403. Color-coding indicates the primary parental background (e.g., LRB401 is red because its sequence is primarily EG4725). (C–D) ***p < 0.001; linear mixed-effects model; p-value of interaction between strain and duration of starvation; eight biological replicates. ΔΔ indicates effect size of interaction between duration of starvation and strain data plotted in that panel compared to the predominant parental strain background (the difference in differences between strains’ mean length at days 1 and 8).
-
Figure 3—figure supplement 1—source data 1
Source data for worm length measurements of generated NILs.
- https://cdn.elifesciences.org/articles/80204/elife-80204-fig3-figsupp1-data1-v2.xlsx
Figure 4 with 2 supplements
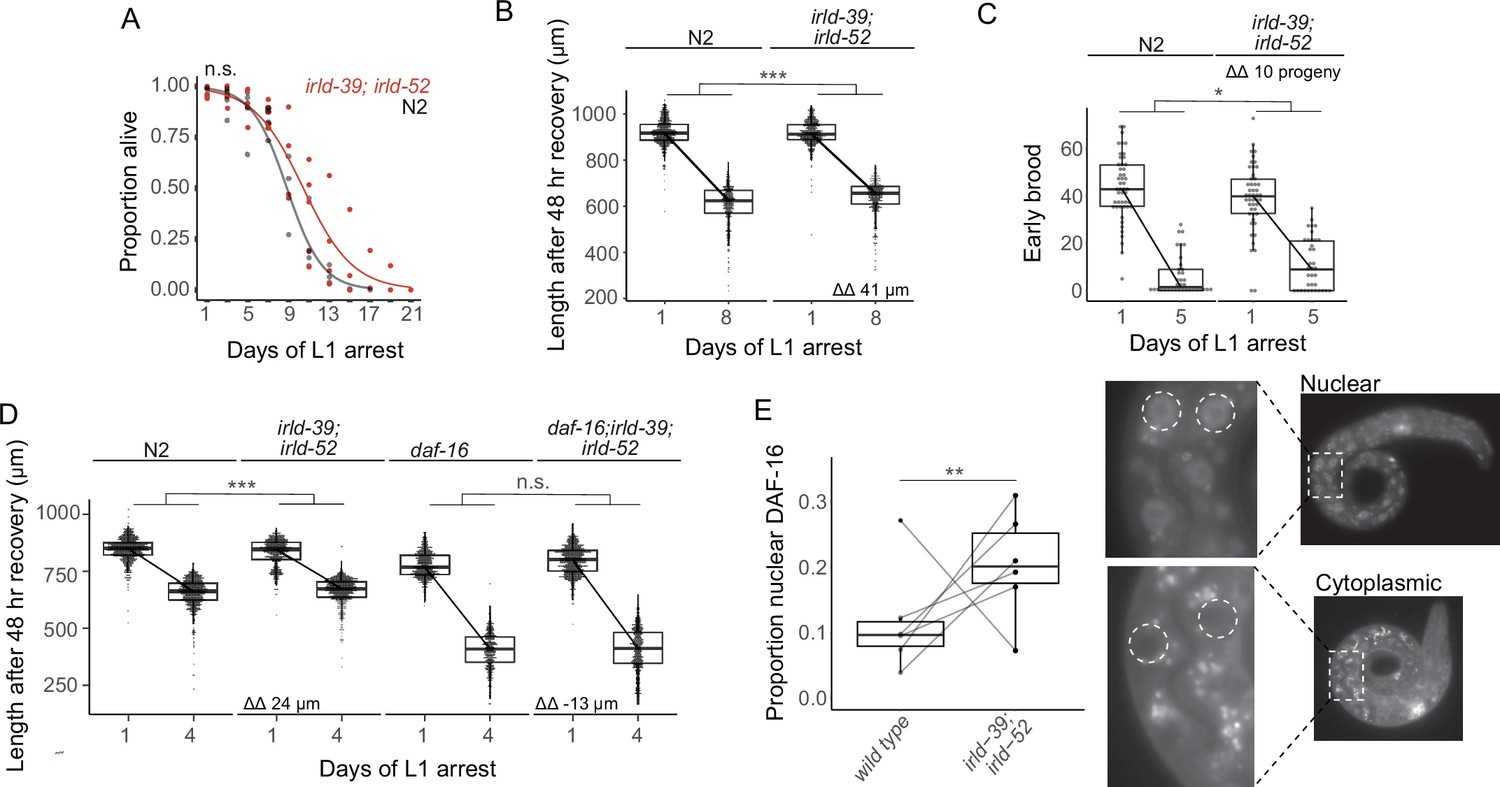
IRLD-39 and IRLD-52 together impact starvation resistance and depend on DAF-16.
(A) Survival curves of irld-39(duk1); irld-52(duk17) and N2 throughout L1 starvation. The apparent increase in starvation survival in the double mutant is not statistically significant (P=0.14). (B) Worm length of irld-39(duk1); irld-52(duk17) and N2 following 48 hr of recovery with food after 1 or 8 days of L1 starvation. (C) Number of progeny produced between 48 and 72 hr of recovery with food after 1 or 5 days of L1 starvation. (D) Worm length of N2, irld-39(duk1); irld-52(duk17), daf-16(mu86), and daf-16(mu86); irld-39(duk1); irld-52(duk17) following 48 hr of recovery with food after 1 or 4 days of L1 starvation. (B–D) Linear mixed-effects model with duration of L1 starvation and genotype as fixed effects and the number of replicates as a random effect; p-value calculated for interaction between fixed effects. ΔΔ indicates effect size of interaction between duration of starvation and strain compared to control. (E) Nuclear localization of DAF-16::GFP in intestinal cells of starved L1s ~36 hr after hatching. Each point represents the result of a single independent biological replicate with 51–64 worms scored for each condition and replicate, with a line connecting the two genotypes in each replicate. The Cochran-Mantel-Haenszel test was used to determine differences in the distribution of the two categories (nuclear and cytoplasmic) between daf-16(ot971) (wild type) and daf-16(ot971); irld-39(duk1); irld-52(duk17) (irld-39; irld-52). Images of intestinal nuclear and cytoplasmic localization are shown. (A–E) Four to six biological replicates were performed per experiment. ***p<0.001, **p<0.01, *p<0.05, n.s. not significant.
-
Figure 4—source data 1
Source data for starvation resistance assays of irld-39(duk1); irld-52(duk17).
Source data for figures resulting from MIP-seq, NIL-seq, RNA-seq, or enrichment analysis is available in Supplementary files 1-3.
- https://cdn.elifesciences.org/articles/80204/elife-80204-fig4-data1-v2.xlsx
Figure 4—figure supplement 1
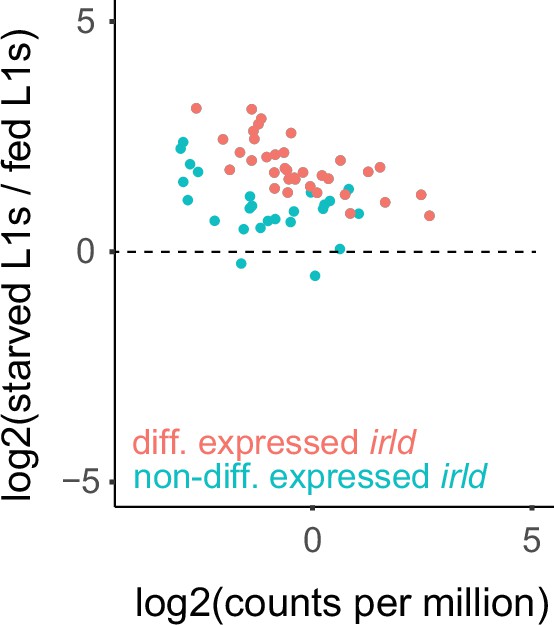
irld genes are up-regulated in starved L1s compared to fed L1s.
Starved and fed L1 mRNA-seq data from whole, wild-type (N2) worms were re-analyzed from Webster et al., 2018 without a minimum expression filter. irld genes are expressed at low levels (typically below one count-per-million reads) but exhibit a consistent pattern of up-regulation in starved compared to fed L1s. Color-coding indicates significance at FDR <0.05. ‘diff.’ differentially; ‘non-diff.’ non-differentially.
Figure 4—figure supplement 2
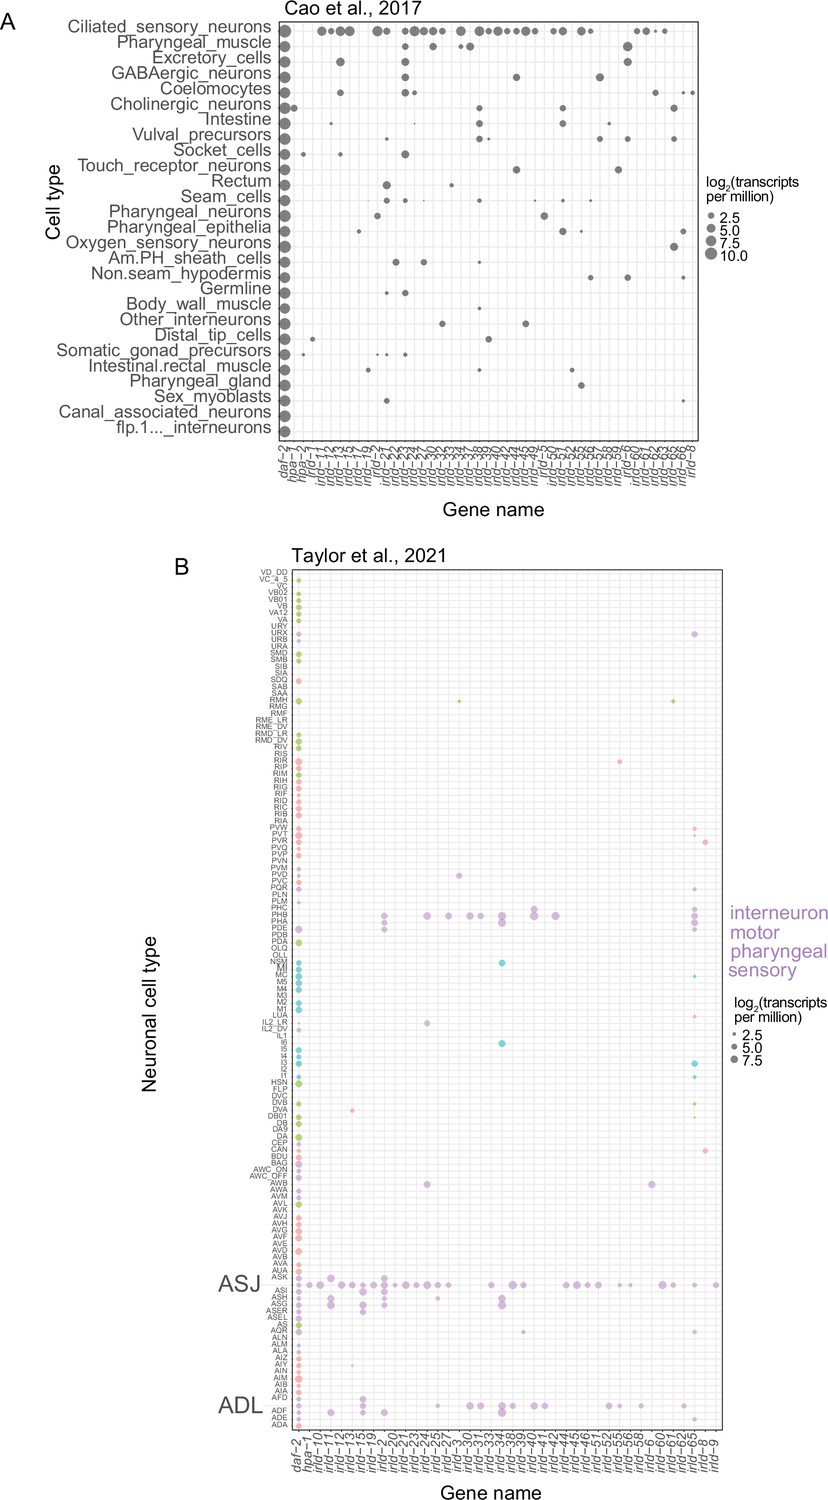
irld genes exhibit a bias toward expression in sensory neurons with some expression in other cell types.
Single-cell RNA-seq expression levels for all detectable irld genes and the insulin/IGF receptor daf-2 included for comparison. (A) Expression levels (transcripts-per-million) from L2-stage larvae for all available cell types are plotted (Cao et al., 2017). (B) Expression levels from L4 larvae for all neurons (Taylor et al., 2021) are plotted. Neurons are sorted into interneuron, motor, pharyngeal, and sensory classifications. Bubble size indicates log2 expression level in transcripts-per-million.
Additional files
-
Supplementary file 1
This file includes all MIP-seq processed data: Slope and PC1 trait values used in GWA, output from MIPgen, MIP sequences, MIPs included in the final experiment, MIP primer sequences, count data for MIP-seq starvation resistance experiment and two pilot experiments.
- https://cdn.elifesciences.org/articles/80204/elife-80204-supp1-v2.xlsx
-
Supplementary file 2
This file includes GWA output and follow-up on irld candidates: GWA output for both Slope and PC1, genes within QTL, output from WormCat and protein domain enrichment analyses, hyper-divergence status for each strain, CRISPR sequences, genotyping primers, and NIL sequencing results.
- https://cdn.elifesciences.org/articles/80204/elife-80204-supp2-v2.xlsx
-
Supplementary file 3
This file includes input and output for RNA-seq analysis, including count tables and differential expression output from Webster et al., 2018 used in Figure 4—figure supplement 1, transcripts-per-million from Cao et al., 2017 plotted in Figure 4—figure supplement 2, and transcripts-per-million for threshold 3 from Taylor et al., 2021 plotted in Figure 4—figure supplement 2.
- https://cdn.elifesciences.org/articles/80204/elife-80204-supp3-v2.xlsx
-
Transparent reporting form
- https://cdn.elifesciences.org/articles/80204/elife-80204-transrepform1-v2.docx
Download links
A two-part list of links to download the article, or parts of the article, in various formats.
Downloads (link to download the article as PDF)
Open citations (links to open the citations from this article in various online reference manager services)
Cite this article (links to download the citations from this article in formats compatible with various reference manager tools)
Using population selection and sequencing to characterize natural variation of starvation resistance in Caenorhabditis elegans
eLife 11:e80204.
https://doi.org/10.7554/eLife.80204


