Using population selection and sequencing to characterize natural variation of starvation resistance in Caenorhabditis elegans

  1. Amy K Webster
  2. Rojin Chitrakar
  3. Maya Powell
  4. Jingxian Chen
  5. Kinsey Fisher
  6. Robyn E Tanny
  7. Lewis Stevens
  8. Kathryn Evans
  9. Angela Wei
  10. Igor Antoshechkin
  11. Erik C Andersen
  12. L Ryan Baugh  Is a corresponding author
  1. Department of Biology, Duke University, United States
  2. Department of Molecular Biosciences, Northwestern University, United States
  3. Division of Biology, California Institute of Technology, United States
  4. Center for Genomic and Computational Biology, Duke University, United States

Abstract

Starvation resistance is important to disease and fitness, but the genetic basis of its natural variation is unknown. Uncovering the genetic basis of complex, quantitative traits such as starvation resistance is technically challenging. We developed a synthetic-population (re)sequencing approach using molecular inversion probes (MIP-seq) to measure relative fitness during and after larval starvation in Caenorhabditis elegans. We applied this competitive assay to 100 genetically diverse, sequenced, wild strains, revealing natural variation in starvation resistance. We confirmed that the most starvation-resistant strains survive and recover from starvation better than the most starvation-sensitive strains using standard assays. We performed genome-wide association (GWA) with the MIP-seq trait data and identified three quantitative trait loci (QTL) for starvation resistance, and we created near isogenic lines (NILs) to validate the effect of these QTL on the trait. These QTL contain numerous candidate genes including several members of the Insulin/EGF Receptor-L Domain (irld) family. We used genome editing to show that four different irld genes have modest effects on starvation resistance. Natural variants of irld-39 and irld-52 affect starvation resistance, and increased resistance of the irld-39; irld-52 double mutant depends on daf-16/FoxO. DAF-16/FoxO is a widely conserved transcriptional effector of insulin/IGF signaling (IIS), and these results suggest that IRLD proteins modify IIS, although they may act through other mechanisms as well. This work demonstrates efficacy of using MIP-seq to dissect a complex trait and it suggests that irld genes are natural modifiers of starvation resistance in C. elegans.

Editor's evaluation

The authors identify natural genetic variants in C. elegans that are associated with variation in starvation resistance. The authors focus on a gene family (irld's) that are thought to regulate insulin signaling. These studies are very interesting in that the approach for identifying natural gene variants is highly innovative and the work provides novel information about this family of genes.

https://doi.org/10.7554/eLife.80204.sa0

Introduction

Given tremendous sequencing capacity, digitization of phenotypes by counting DNA molecules in mixed-genotype populations can provide unprecedented sensitivity and precision. Population-selection-and-sequencing approaches for genetic analysis were developed in bacteria and yeast, enabling large numbers of genetic perturbations to be assayed in parallel (Han et al., 2010; Kwon et al., 2016; Nislow et al., 2016), and CRISPR subsequently enabled related approaches in mammalian cells (Gilbert et al., 2014; Koike-Yusa et al., 2014; Shalem et al., 2014; Wang et al., 2014). With its small size, genetic toolkit, and genomic resources, the nematode C. elegans is an ideal animal model to develop selection-and-sequencing approaches to organismal phenotypes. Such approaches have been described for mapping causal loci from recombinants between a pair of divergent strains in C. elegans (Mok et al., 2017; Burga et al., 2019). We described a population-sequencing approach based on pooling many wild strains (Webster et al., 2019), but it lacked power since only very rare sequencing reads that include single-nucleotide variants (SNVs) unique to a strain in the pool informed inference of relative strain frequency. By capturing targeted sequences, MIP-seq enables extremely deep sequencing of polymorphic loci (Cantsilieris et al., 2017; Mok et al., 2017), but it has not been applied to populations of wild strains.

Enduring periods of starvation is a near-ubiquitous feature of animal life that affects survival, growth, and reproduction, making starvation resistance a fitness-proximal trait. Starvation resistance is also important to human health and disease, with direct relevance to diabetes, obesity, aging, and cancer. Despite its importance to understanding animal evolution and informing therapeutic strategies, however, the genetic basis of natural variation in starvation resistance is unclear. The nematode C. elegans is frequently starved in the wild and has robust starvation responses (Schulenburg and Félix, 2017; Baugh and Hu, 2020). Larvae that hatch in the absence of food arrest development in the first larval stage (L1 arrest) and can survive starvation for weeks (Baugh, 2013). In addition to causing mortality, extended starvation reduces growth and reproductive success upon feeding (Jobson et al., 2015; Jordan et al., 2019), and these effects can be uncoupled by genotype or condition (Roux et al., 2016; Kaplan et al., 2018; Chen et al., 2022 and reviewed in Baugh and Hu, 2020). Starvation resistance therefore integrates survival, growth rate, and reproductive success, and different genes and conditions can affect these phenotypes independently. Insulin/IGF signaling (IIS) is a critical regulator of L1 arrest (Baugh and Sternberg, 2006). There is a single known insulin/IGF-like receptor in C. elegans, DAF-2/InsR, which signals through a conserved phosphatidylinositol 3-kinase (PI3K) signaling pathway to antagonize the transcription factor DAF-16/FoxO (Lin et al., 1997; Ogg et al., 1997). When IIS is reduced, such as during starvation, DAF-16 moves to the nucleus and regulates transcription (Henderson and Johnson, 2001; Lee et al., 2001; Lin et al., 2001), promoting starvation resistance (Muñoz and Riddle, 2003; Baugh and Sternberg, 2006; Hibshman et al., 2017). (Roux et al., 2016; Kaplan et al., 2018; Baugh and Hu, 2020; Chen et al., 2022).

Here, we describe the development of MIP-seq for statistical genetic analysis of complex traits in C. elegans. We used MIP-seq to analyze starvation resistance in a pool of genetically diverse wild strains, identifying relatively starvation-resistant and sensitive strains. We identified and validated three QTL that affect starvation resistance and contain numerous candidate variants. Our results suggest that multiple members of the irld gene family affect aspects of starvation resistance, and they suggest they do so at least in part by modifying IIS.

Results

Sensitive and precise measurement of strain frequency in pooled culture using MIP-seq

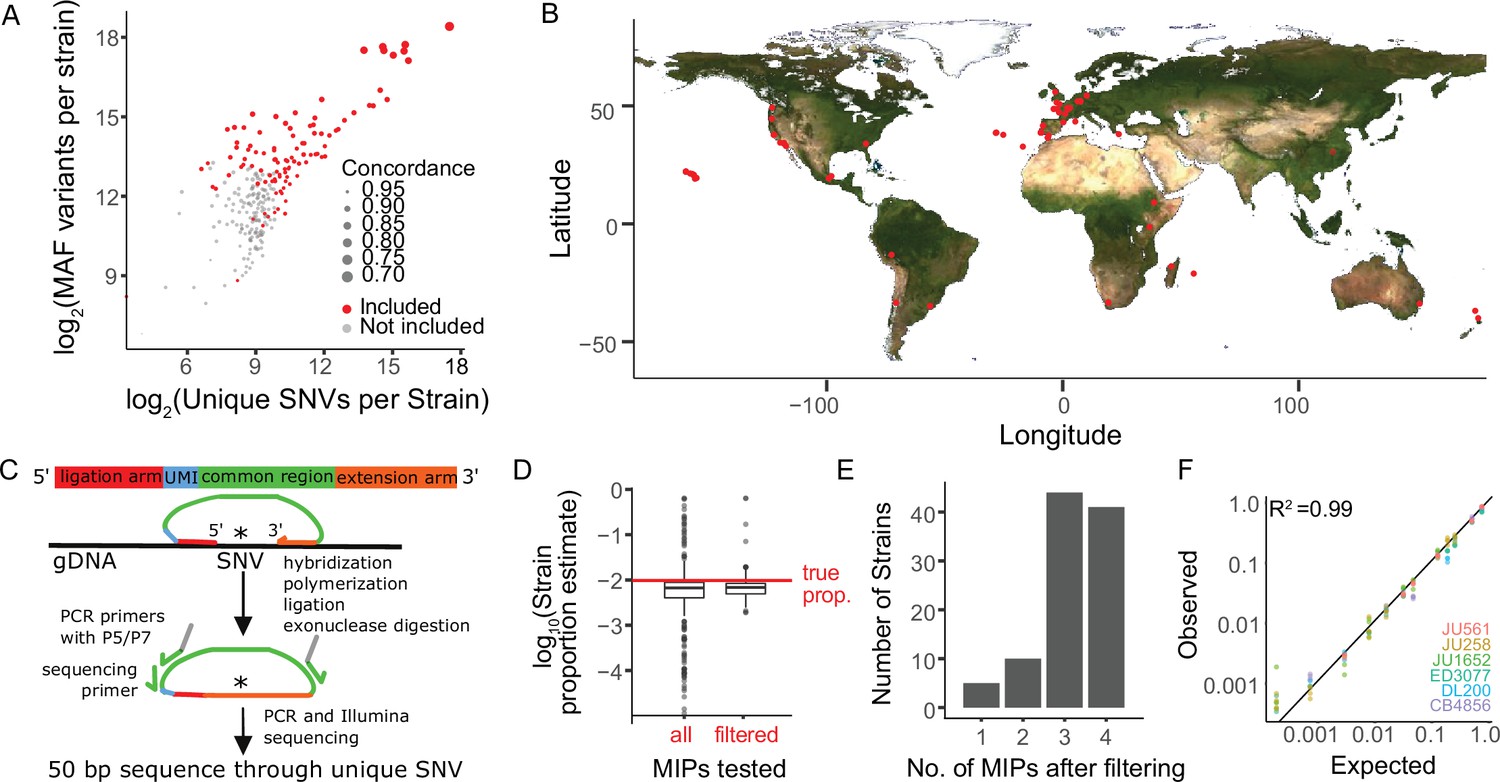
We selected 103 genetically diverse, wild C. elegans strains from around the world including the laboratory reference N2 to test MIP-seq, ultimately phenotyping 100 for starvation resistance (Figure 1A–B). MIPs are designed to capture a specific region of the genome for targeted multiplex sequencing (Figure 1C). We designed MIPs to target a region containing a SNV unique to each of 103 strains. Thus, the relative frequency of each strain in a pool can be determined by the SNV frequency. We designed four such MIPs per strain to provide redundancy and increase precision. To pilot MIP-seq, we prepared sequencing libraries from an equimolar mix of genomic DNA from each of 103 strains. We determined the frequency of strain-specific reads for each MIP, and we censored probes that produced frequencies substantially different than the expected value of approximately 0.01 (Figure 1D; criteria in Materials and methods), leaving three or four reliable probes for 85% of strains and at least one MIP for 100 strains (Figure 1E, Supplementary file 1), which were used in the starvation resistance experiment. Three strains with no MIPs passing filtering were excluded from subsequent analysis. As an additional pilot, we mixed genomic DNA from a subset of strains at different concentrations to prepare a standard curve. MIP-seq accurately measured individual strain frequencies over three orders of magnitude (Figure 1F), and greater sequencing depth could theoretically expand the dynamic range.

Sensitive and precise measurement of strain frequency in pooled culture using MIP-seq.

(A) The three metrics used to identify the most diverse C. elegans strains are plotted. ‘MAF’ stands for minor allele frequency. Concordance refers to the average pairwise concordance for the focal strain compared to all other strains, which is calculated as the number of shared variant sites divided by the total number of variants for each pair. The strains included in the MIP-seq experiments are in red. (B) Geographic locations of the strains assayed for starvation resistance. (C) Schematic of MIP-seq. MIPs are designed for loci with SNVs unique to each strain. Four MIPs were designed per strain. MIPs are 80 nt long and include ligation and extension arms to match DNA sequence surrounding the SNV, a unique molecular identifier (UMI), and P5 and P7 sequences for Illumina sequencing. MIPs are hybridized to genomic DNA, polymerized, ligated, and used as PCR template to generate an Illumina sequencing library. The alternative-to-total read frequency for each MIP/SNV locus indicates strain frequency. (D) Empirical testing of 412 MIPs with an equimolar mix of genomic DNA from 103 strains to identify reliable MIPs. 321 MIPs passed filtering and were analyzed in the starvation experiment. Outliers for filtered MIPs are for N2, which has hardly any unique SNVs because it is derived from the reference genome. N2 MIPs were included despite poor performance. (E) Number of MIPs per strain of the 321 filtered MIPs that passed filtering. (F) Genomic DNA from seven strains was combined at different known concentrations, and MIP-seq was used to generate a standard curve. Included MIPs all passed filtering. (R2=0.99).

Using MIP-seq to characterize natural variation of starvation resistance

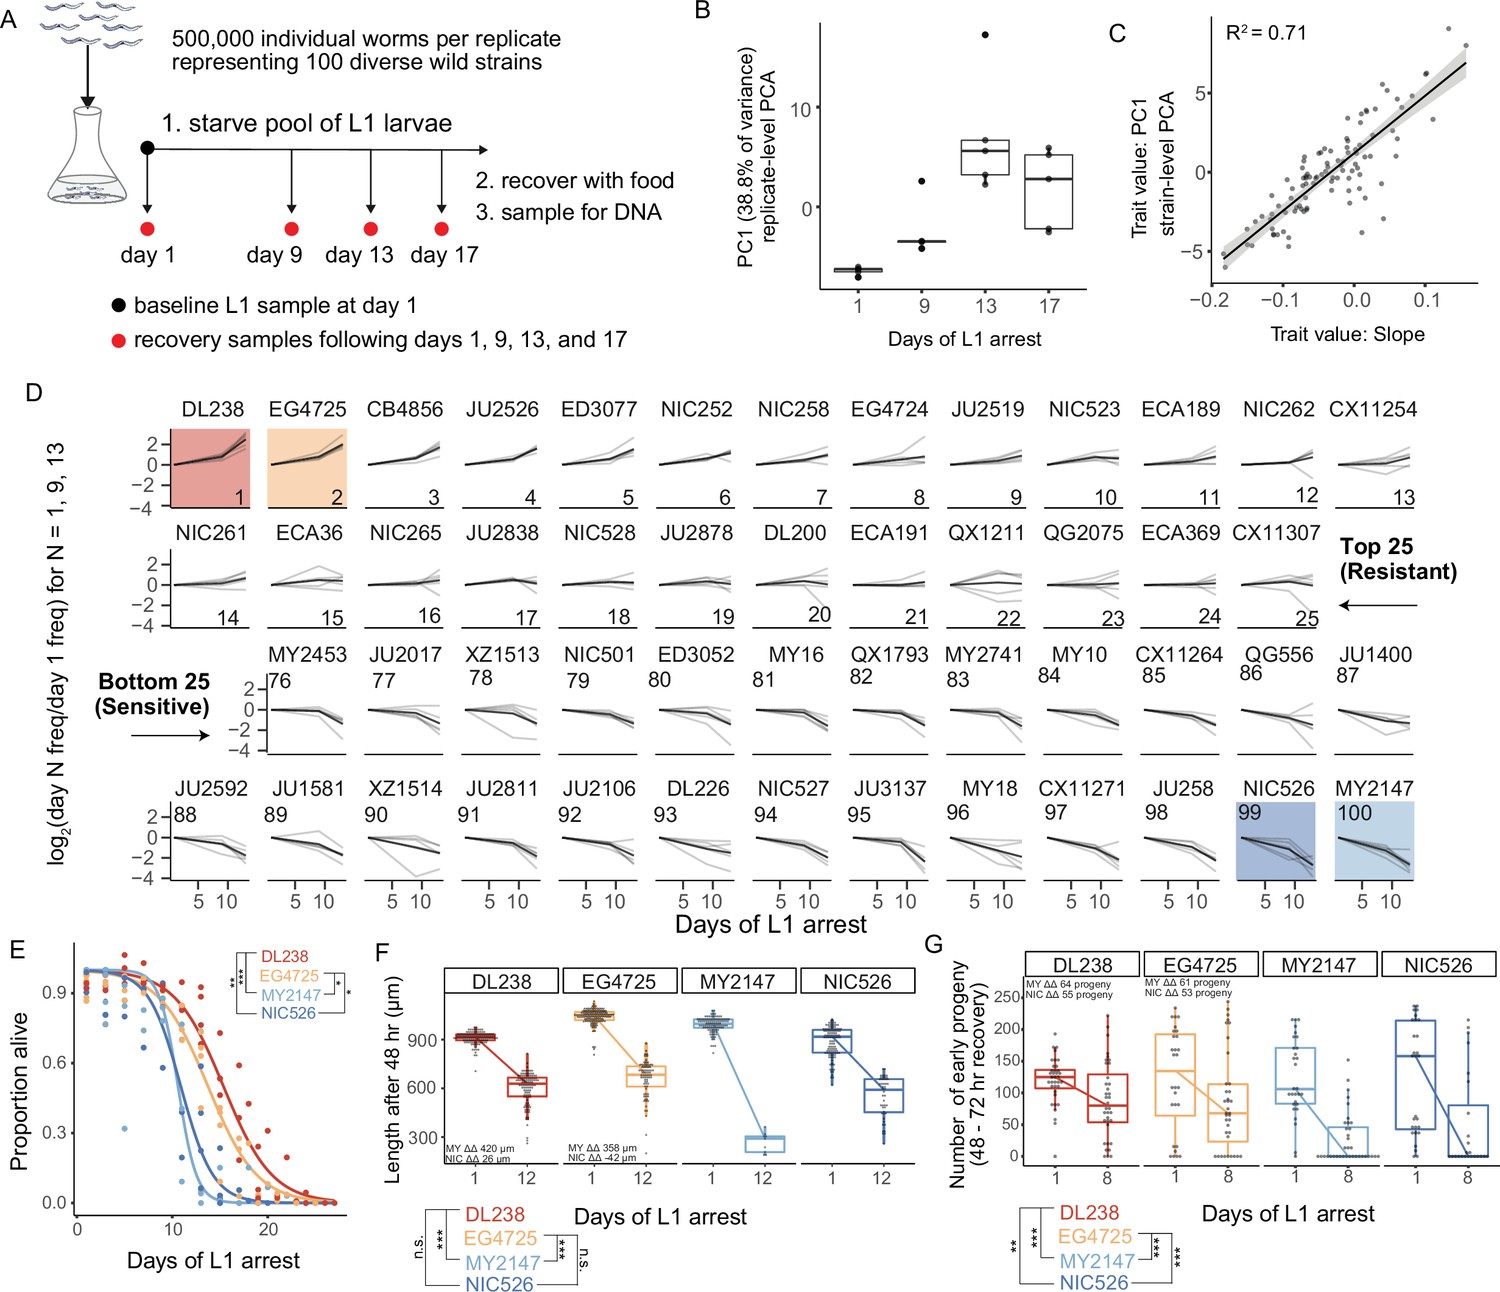
We used MIP-seq to phenotype 100 diverse strains for starvation resistance. We cultured the strains in standard laboratory conditions, pooled them, and subjected them to starvation during L1 arrest. We aimed for approximately 5000 L1 larvae per strain in the pooled starvation culture in order to ensure representative sampling. However, we expected actual representation to vary across strains and replicates, so we collected DNA from an aliquot of L1 larvae on the first day of starvation as a ‘baseline’ sample to capture initial population composition. In addition, aliquots were taken from the pool at days 1, 9, 13, and 17 of starvation, and sampled larvae were allowed to recover with food for 4 or 5 days (depending on the duration of starvation), enabling reproduction for 1 day, and then the entire population was collected for DNA preparation (Figure 2A). DNA from baseline samples, as well as samples allowed to recover and reproduce following starvation, were sequenced with MIP-seq for each of five biological replicates. It is critical to point out that by incorporating recovery and early fecundity, this sampling scheme integrates effects of starvation on mortality as well as growth rate and reproductive success, each of which are important for starvation resistance (i.e. fitness) and can be uncoupled by certain genotypes and conditions (Baugh and Hu, 2020).

Figure 2 with 4 supplements see all
MIP-seq determines relative starvation resistance of 100 strains.

(A) Experimental design. Worms were starved at the L1 stage ('L1 arrest').~5000 L1 larvae per strain were starved (~500,000 total). The population of starved L1 larvae was sampled initially (‘baseline’ on day 1), and then sampled on the days indicated. Samples (except baseline) were recovered with food in liquid culture, reaching adulthood and producing progeny for 1 day, and the entire population was frozen for DNA isolation. Five biological replicates were performed. (B) Principal component 1 of normalized and processed data from all replicates (replicate-level) and strains is plotted, revealing association with duration of starvation. Each point is an individual sample (MIP-seq library). (C) The relationship between two starvation-resistance metrics (Slope and PC1) produced from strain-level data (replicates averaged) is plotted. Each point is a different strain. (D) Log2-normalized strain frequency is plotted over time for the 25 most resistant and 25 most sensitive strains in rank order (based on Slope). Only days 1, 9, and 13 are plotted. See Figure 2—figure supplement 2 for full data. Grey lines are biological replicates and black line is the mean. DL238 and EG4725 are most starvation-resistant, and NIC526 and MY2147 are most sensitive, and they are color-coded accordingly. (E) L1 starvation survival curves are plotted for starvation-resistant and sensitive strains. Individual replicate measurements are included as points to which curves were fit with logistic regression. T-tests on 50% survival time of four biological replicates. (F) Worm length following 48 hours of recovery with food after 1 or 12 days of L1 starvation. (G) Number of progeny produced between 48 and 72 hr of recovery on food following 1 or 8 days of starvation. (F,G) ΔΔ indicates effect size of interaction between duration of starvation and strain data plotted in that panel compared to the strain listed (the difference in differences between strains’ mean length at days 1 and 12 or between mean number of progeny at days 1 and 8). ‘MY’ is an abbreviation for MY2147 and ‘NIC’ is an abbreviation for NIC526. Linear mixed-effects model; one-way p-value of interaction between duration of starvation and strain. (E–G) ***p<0.001, **p<0.01, *p<0.05.

Figure 2—source data 1

Source data for manual starvation resistance assays of wild strains.

https://cdn.elifesciences.org/articles/80204/elife-80204-fig2-data1-v2.xlsx

DNA from baseline samples allowed us to effectively normalize differences in pool composition in each replicate, revealing effects of starvation on strain frequency. Differences in pool composition explained the first component in principal component analysis (PCA) when strain frequencies over time were analyzed without consideration of baseline frequencies (Figure 2—figure supplement 1A). However, once the data were normalized for initial strain composition using the baseline sample for each replicate, the first principal component correlated with duration of starvation, especially across the first three time points (Figure 2B, Figure 2—figure supplement 1B). Substantial mortality occurred by day 17 (Figure 2—figure supplement 1C), and day 17 recovery cultures thus produced relatively few progeny. Consequently, differences in strain frequencies were actually smaller at day 17 than 13, but relative differences were conserved (Figure 2—figure supplement 2). After normalization, duration of starvation is the major factor accounting for differences in strain frequency across all samples, and this is robust to differences in the initial composition of the pool across replicates.

We developed two metrics to quantify relative starvation resistance for each strain. ‘Slope’ is a measure of how much a strain increases or decreases in frequency over time across days 1, 9, and 13, calculated as the slope of a linear model (Supplementary file 1). ‘PC1’ is the value of the first principal component for each strain from strain-level PCA (Figure 2B, Figure 2—figure supplement 1B). These two metrics are correlated but also show some differences (Figure 2C), suggesting they capture related but also distinct features of the data. While Slope is intuitive, it is limited by the use of a linear model. Nonetheless, Slope values are correlated with starvation-resistance values produced from a previously published population-sequencing approach with less power that included some of the same strains (Figure 2—figure supplement 1D; Webster et al., 2019). In addition, Slope is modestly correlated with the latitude from which strains were collected, suggesting possible adaptation to starvation or other correlated traits based on location (Figure 2—figure supplement 3). There is also a modest negative correlation between Slope and growth rate after only one day of starvation (control condition) (Figure 2—figure supplement 4), suggesting a possible trade-off between starvation resistance and population growth rate in the absence of stress. We used the Slope metric to order strains from most resistant to sensitive, revealing differences in starvation resistance between wild strains (Figure 2D, Figure 2—figure supplement 2). In contrast to Slope, PC1 does not assume linearity, it includes the results from day 17 of starvation, and it may be less affected by noise. PCA is also an established way to obtain trait values for GWA studies (Ried et al., 2016; Yano et al., 2019).

Our recovery-based sampling approach integrates starvation survival, recovery, and early fecundity into a single fitness assay. It is therefore unclear whether a given strain is more or less resistant because of differences in mortality, growth rate, progeny production, or some combination. It is also unclear what the absolute effect sizes are between the most resistant and sensitive strains in this competition assay. Nonetheless, our approach is intended to model the impact of larval starvation on fitness broadly, while traditional assays can be used to isolate specific effects of starvation on survival, growth, and reproduction in follow-up experiments.

We performed manual assays for starvation survival, growth rate, and early fecundity for the most resistant and sensitive strains. We found starvation-resistant strains DL238 and EG4725 survived starvation significantly longer during L1 arrest than sensitive strains MY2147 and NIC526 (Figure 2E). Differences in starvation survival among wild strains are relatively small compared to some published mutants in the N2 reference background (Baugh and Hu, 2020). After extended L1 arrest, DL238 and EG4725 recovered from starvation better than MY2147 but not NIC526, as assessed by their size following 48 hr of recovery (Figure 2F). Finally, DL238 and EG4725 exhibited a larger early brood size following extended starvation compared to both MY2147 and NIC526. Overall, this demonstrates that differences in starvation resistance among wild strains are driven by differences in survival, recovery, and early fecundity, but that sensitivity of NIC526 is apparently driven by differences in survival and early fecundity without an appreciable effect on growth. These results validate the MIP-seq approach and reveal the extent of natural variation in starvation resistance.

Natural variation in irld gene family members affects starvation resistance

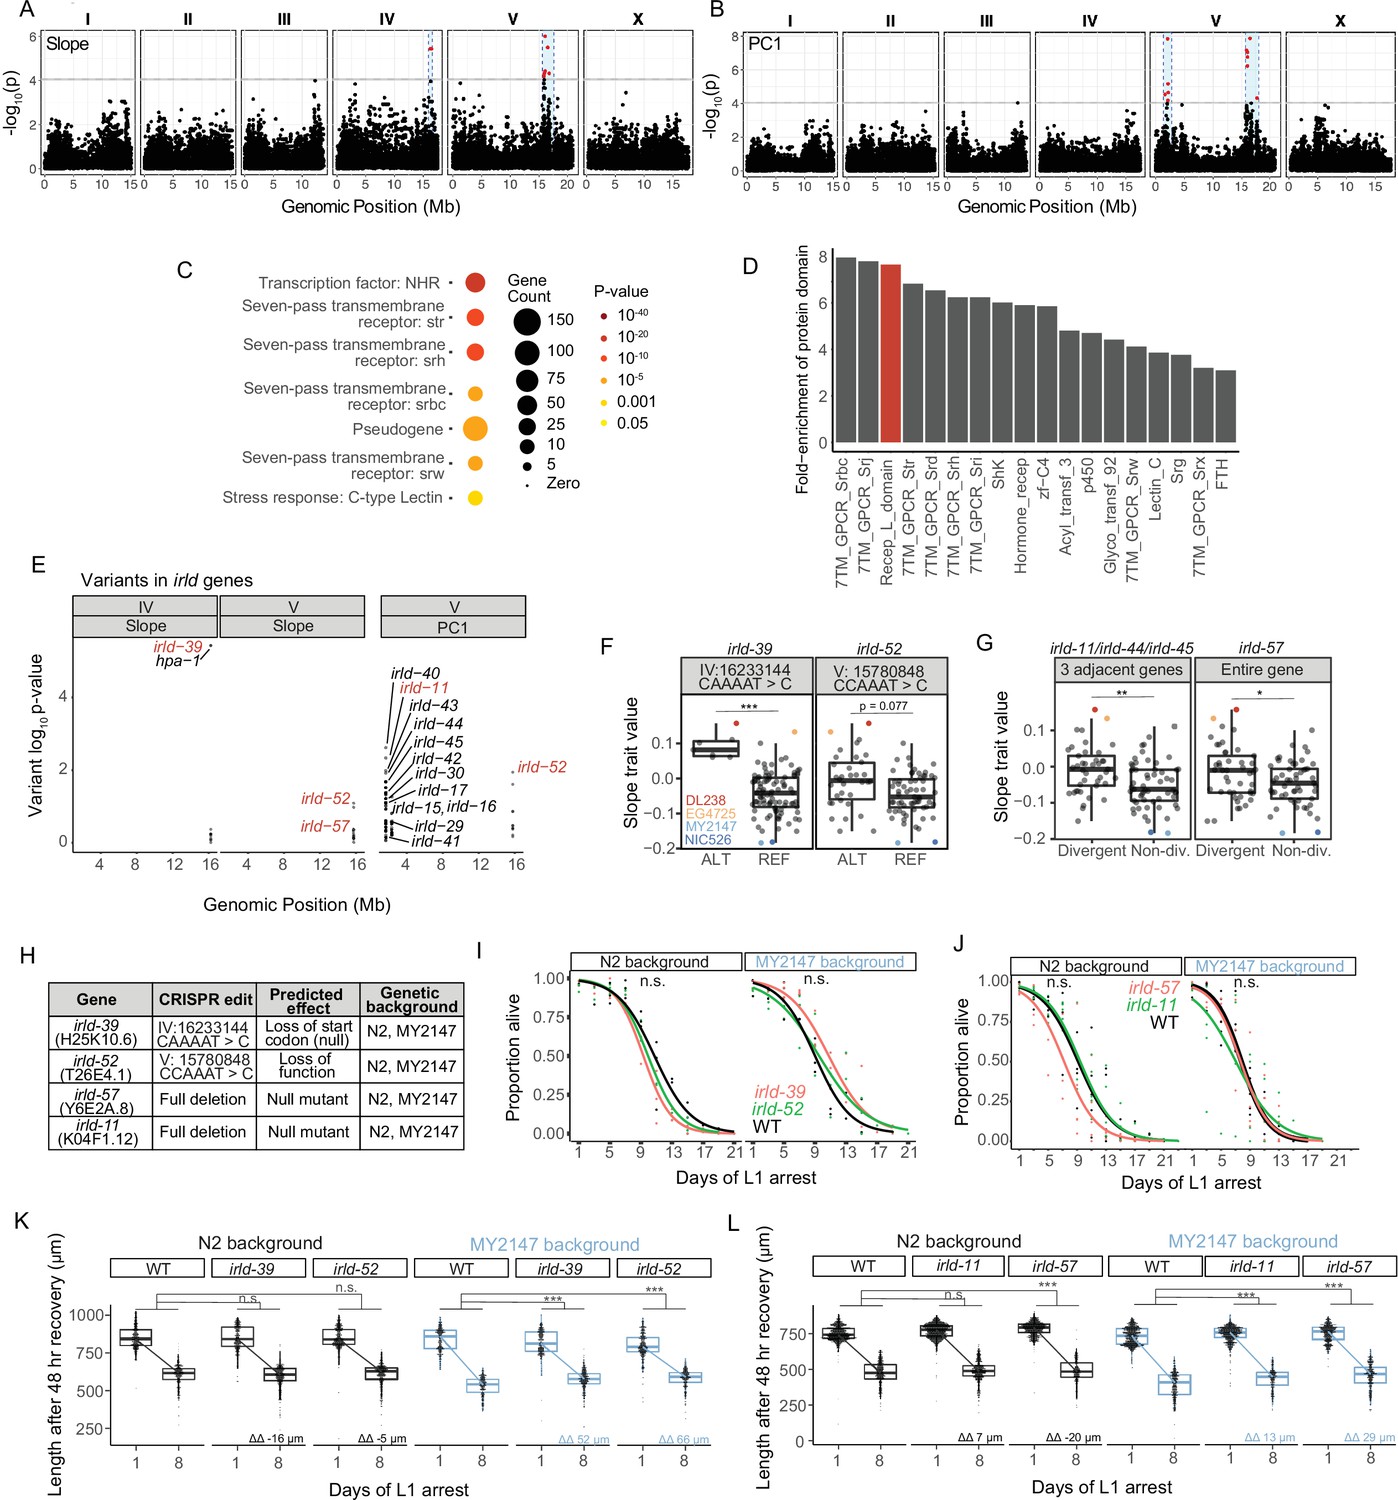
We used Slope and PC1 as trait values to perform GWA using the Caenorhabditis elegans Natural Diversity Resource (CeNDR) (Cook et al., 2017). GWA identified QTL on the right arm of chromosome IV and on the left and right arms of chromosome V (Figure 3A–B, Supplementary file 2). We confirmed that each QTL affected starvation resistance by generating NILs and measuring growth rate upon recovery from starvation (Figure 3—figure supplement 1). We chose this assay, as opposed to starvation survival or fecundity, because it revealed relatively robust differences between DL238/EG4725 (resistant) and MY2147 (sensitive) (Figure 2F).

Figure 3 with 1 supplement see all
Genetic variation in the irld gene family underlies differences in starvation resistance.

(A) GWA output using Slope as a trait value. Significant QTL intervals are IV: 15939340–16613710 and V: 15660911–17615557. (B) GWA output using PC1 as a trait value. Significant QTL intervals are V: 1345848–2764788 and V: 15775895–18065050. (C) WormCat Category 3 enrichments for all genes with variants in the QTL. (D) Fold-enrichment of protein domains significantly enriched among genes with variants in QTL. A hypergeometric p-value was calculated for each of 102 protein domains present, and a Bonferroni-corrected p-value of 0.00049 was used as a threshold to determine significance. Red indicates the receptor L domain, which is found in irld genes. (E) All variants in irld genes that are within significant QTL and their association with the starvation-resistance traits, Slope and PC. Each gene name is shown next to the most significant variant for that gene, but multiple variants are plotted for each gene when present. Red indicates genes selected for functional validation. (F) Slope trait values for strains based on whether they have ALT and REF alleles for specific irld-39 and irld-52 variants predicated to disrupt protein function. The irld-52 variant p-value is p=0.007 for the PC1 trait value (only the Slope trait value is shown here). Significance determined from GWA fine mapping. (G) Slope trait values for strains based on whether they are hyper-divergent or not at irld-11 and irld-57 loci. T-test on trait values between hyper-divergent and non-divergent strains. (F–G) DL238, EG4725, NIC526, and MY2147 are color-coded as indicated. (H) The four irld genes selected for genome editing and the edits generated for each. For irld-39 and irld-52, N2 and MY2147 have the REF allele and were edited to have the ALT allele. irld-11 and irld-57 are hyper-divergent in DL238 and EG2745 backgrounds, so full gene deletions were generated in N2 and MY2147 backgrounds. (I) L1 starvation survival assays on irld-39 and irld-52 ALT alleles in N2 and MY2147 backgrounds. There were no significant differences between strains within a background. (J) L1 starvation survival assays on irld-11 and irld-57 deletions in N2 and MY2147 backgrounds. There were no significant differences between strains within a background. (K–L). Worm length following 48 hr recovery with food after 1 or 8 d of L1 starvation for indicated genotypes. Linear mixed-effects model; one-way p-value for interaction between strain and duration of starvation; 4–5 biological replicates per condition. ΔΔ indicates effect size of interaction between duration of starvation and strain compared to control (the difference in differences between strains’ mean length at days 1 and 8). (F,G,K,L) ***p<0.001, **p<0.01, *p<0.05, n.s. not significant.

Figure 3—source data 1

Source data for starvation resistance assays of irld strains.

https://cdn.elifesciences.org/articles/80204/elife-80204-fig3-data1-v2.xlsx

These QTL are relatively large, ranging from 0.7 to 2.2 Mb, and include many candidate variants (Supplementary file 2) across 867 genes, which are enriched for several large gene families. WormCat analysis identified significant enrichments of serpentine receptors, nuclear hormone receptors, and C-type lectins (Figure 3C; Holdorf et al., 2020). Likewise, protein-domain enrichment analysis (Finn et al., 2011) identified seven-pass transmembrane domains and hormone receptor domains (Figure 3D). In addition, the receptor L domain was significantly enriched, which is found in proteins comprising Insulin/EGF-Receptor L Domain (IRLD) family (Dlakić, 2002). Given weak homology to DAF-2/InsR, and the critical role of IIS in regulation of starvation resistance, we were intrigued at the possibility that natural variation in irld family genes may impact starvation resistance, lthough it should be noted that the QTL contain numerous additional candidates that could affect the trait. Across all three QTL identified, there are genetic variants in 16 irld genes, and 68 genes have been identified as part of this family in C. elegans (Hobert, 2013). Multiple variants are present for most irld genes, and variants differed in the degree to which they were associated with variation in starvation resistance (Figure 3E).

We selected at least one irld gene from each QTL for functional analysis. On the left arm of chromosome IV, a variant in irld-39 was the strongest individual candidate among all genes because of its strong association with starvation resistance and because the variant is predicted to disrupt the start codon of the gene (Figure 3E and F, Supplementary file 2), likely rendering irld-39 a functional null in the starvation-resistant strain DL238. However, this was not functionally validated, and it is possible that this variant affects expression of the neighboring irld gene, hpa-1. On the right arm of chromosome V, irld-52 was identified through both Slope and PC1 phenotype metrics and contains a variant associated with starvation resistance predicted to disrupt its fifth exon with a frameshift (Figure 3E and F), though this was not functionally validated and it is unclear if the variant causes a null mutation. While analyzing variants on the left arm of chromosome V, we noticed that many irld genes are adjacent to each other and that each contain many variants. In particular, irld-11, irld-44, and irld-45 are clustered, and each gene contains over 50 genetic variants. This pattern of some loci containing many variants relative to N2 has been broadly observed, leading to identification of ‘hyper-divergent’ regions of the genome containing exceptional amounts of variation (Lee et al., 2021). irld-11, irld-44, and irld-45 are part of a hyper-divergent region, and because they are so tightly linked, they are hyper-divergent in the same strains. We found that hyper-divergence at these loci was associated with starvation resistance (Figure 3G). irld-57 is also in a hyper-divergent region on the right arm of chromosome V, and hyper-divergence at this locus is also associated with starvation resistance (Figure 3G). Given several variants predicted to disrupt protein function in each, we believe irld-11 and irld-57 are null in the hyper-divergent context, though this has not been functionally demonstrated. Notably, associations between variants or hyper-divergence and Slope (Figure 3F and G) together with their predicted negative impacts on gene function (Figure 3H) suggests that disruption of these four irld genes in backgrounds where they are functional will increase starvation resistance.

We used CRISPR-Cas9 genome editing to determine functional consequences of genetic modification of our candidate irld genes. Because irld-39 and irld-52 contain singular variants associated with starvation resistance and predicted to disrupt protein function, we generated these specific variants in the starvation-sensitive MY2147 and the laboratory-reference N2 backgrounds (Figure 3H). Since irld-11 and irld-57 contain so many candidate variants, we deleted these genes in MY2147 and N2, rendering them null at each locus (Figure 3H). Edits of irld-39 and irld-52 are more likely to approximate the effect of specific variants in the wild, because they are the exact variants present in starvation-resistant wild strains. None of the alleles in either background significantly affected survival (Figure 3I and J). A power analysis suggests there is sufficient statistical power to detect differences of approximately 2 days or greater, suggesting there is not a difference of at least this magnitude. However, alleles for all four irld genes mitigated the effect of starvation on growth rate in the MY2147 background but not N2 (Figure 3K and L). This suggests that MY2147, as a more starvation-sensitive background than N2, facilitates detection of alleles that increase starvation resistance. These results show that multiple types of variants in different irld family members reduce the effect of extended L1 starvation on recovery, suggesting four individual genes from this family affect this aspect of starvation resistance in wild strains. Notably, none of the engineered variants affected the trait to a similar extent as the NILs, suggesting that other variants within each QTL also affect the trait.

IRLD-39 and IRLD-52 act through DAF-16/FoxO

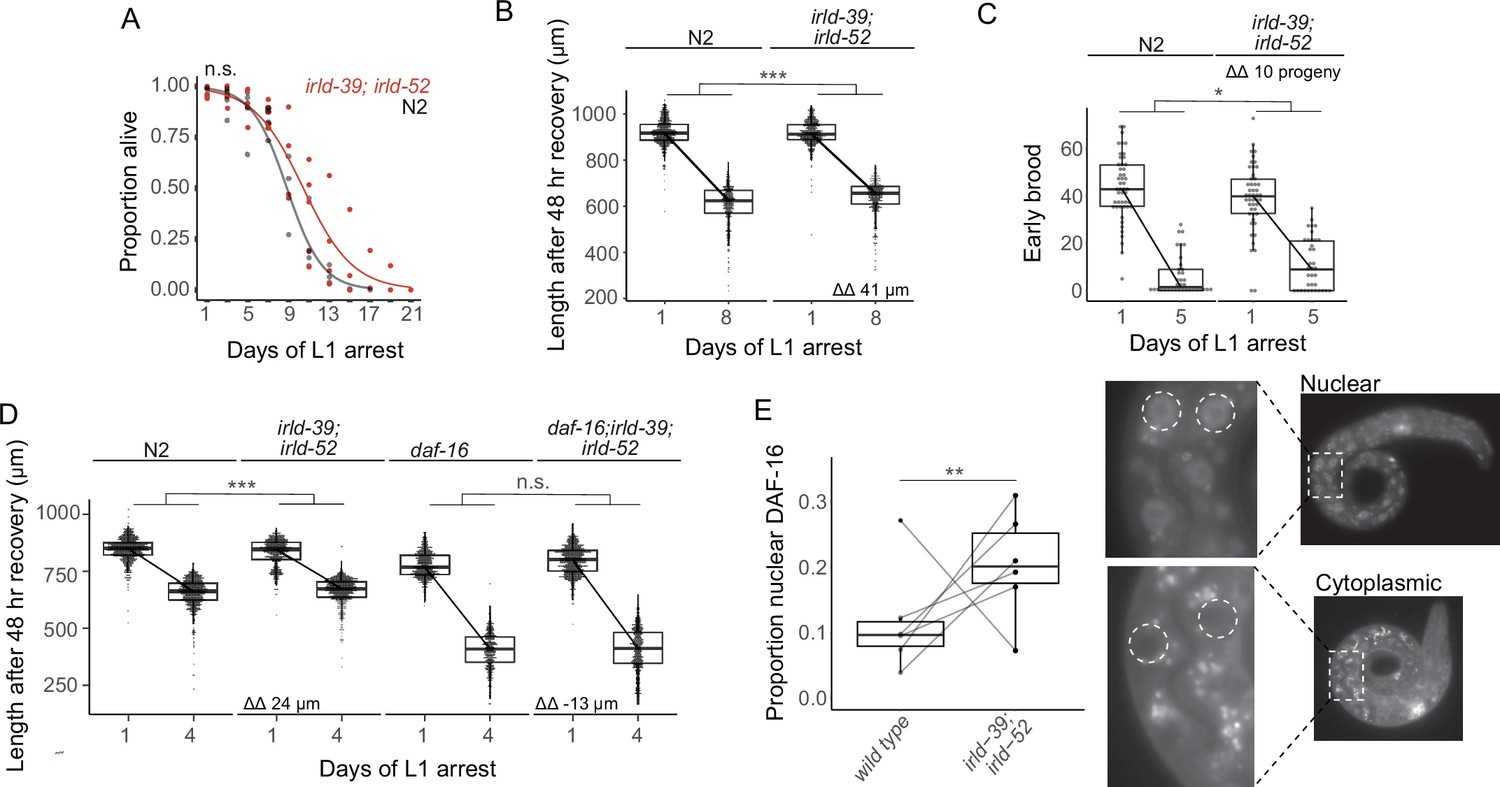
We hypothesized that irld-39 and irld-52 have additive phenotypic effects, and that combining our two engineered alleles would reveal an effect in N2. An irld-39(duk1); irld-52(duk17) double mutant did not significantly increase starvation survival in the N2 background (Figure 4A). In this case, there was sufficient statistical power to detect differences of approximately 1.5 days or greater. However, the double mutant displayed a modest but significant increase in growth following 8 days of starvation, consistent with single mutants in the MY2147 background (Figure 4B). Furthermore, the double mutant significantly increased early fecundity following starvation (Figure 4C). These results further support the conclusion that natural variation in irld-39 and irld-52 affects starvation resistance. Notably, these two variants are both present in the most starvation-resistant strain identified, DL238 (Figure 3F).

Figure 4 with 2 supplements see all
IRLD-39 and IRLD-52 together impact starvation resistance and depend on DAF-16.

(A) Survival curves of irld-39(duk1); irld-52(duk17) and N2 throughout L1 starvation. The apparent increase in starvation survival in the double mutant is not statistically significant (P=0.14). (B) Worm length of irld-39(duk1); irld-52(duk17) and N2 following 48 hr of recovery with food after 1 or 8 days of L1 starvation. (C) Number of progeny produced between 48 and 72 hr of recovery with food after 1 or 5 days of L1 starvation. (D) Worm length of N2, irld-39(duk1); irld-52(duk17), daf-16(mu86), and daf-16(mu86); irld-39(duk1); irld-52(duk17) following 48 hr of recovery with food after 1 or 4 days of L1 starvation. (B–D) Linear mixed-effects model with duration of L1 starvation and genotype as fixed effects and the number of replicates as a random effect; p-value calculated for interaction between fixed effects. ΔΔ indicates effect size of interaction between duration of starvation and strain compared to control. (E) Nuclear localization of DAF-16::GFP in intestinal cells of starved L1s ~36 hr after hatching. Each point represents the result of a single independent biological replicate with 51–64 worms scored for each condition and replicate, with a line connecting the two genotypes in each replicate. The Cochran-Mantel-Haenszel test was used to determine differences in the distribution of the two categories (nuclear and cytoplasmic) between daf-16(ot971) (wild type) and daf-16(ot971); irld-39(duk1); irld-52(duk17) (irld-39; irld-52). Images of intestinal nuclear and cytoplasmic localization are shown. (A–E) Four to six biological replicates were performed per experiment. ***p<0.001, **p<0.01, *p<0.05, n.s. not significant.

Figure 4—source data 1

Source data for starvation resistance assays of irld-39(duk1); irld-52(duk17).

Source data for figures resulting from MIP-seq, NIL-seq, RNA-seq, or enrichment analysis is available in Supplementary files 1-3.

https://cdn.elifesciences.org/articles/80204/elife-80204-fig4-data1-v2.xlsx

Given weak homology between IRLD proteins and the extracellular domain of DAF-2/InsR, we wondered if IRLD-39 and IRLD-52 modify IIS, as originally proposed (Dlakić, 2002). We therefore hypothesized that increased starvation resistance with disruption of irld-39 and irld-52 depends on daf-16/FoxO. Again, the irld-39; irld-52 double mutant displayed significant mitigation of the effect of starvation on growth (Figure 4D). This result corroborates the effect of the double mutant after 8 days of starvation (Figure 4B), except after only 4 days in this case (4 days of starvation was used since the daf-16 mutant is starvation-sensitive). We found no significant difference in the effect of starvation on growth between the null mutant daf-16(mu86) and daf-16(mu86); irld-39(duk1); irld-52(duk17), suggesting that increased starvation resistance of irld-39(duk1); irld-52(duk17) is dependent on daf-16 (Figure 4D). This genetic epistasis is consistent with DAF-16/FoxO activity being increased in the irld-39(duk1); irld-52(duk17) double mutant. In support of this hypothesis, nuclear localization of endogenous DAF-16 (Aghayeva et al., 2020) in intestinal cells, a proxy of its activity, was significantly increased in irld-39(duk1); irld-52(duk17) mutants (Figure 4E). However, this is a relatively modest difference in nuclear localization, and it is unclear where in the animal DAF-16 activity is most relevant in this context. Nonetheless, genetic epistasis and nuclear localization assays suggest that IRLD-39 and IRLD-52 act through DAF-16/FoxO to affect starvation resistance during L1 arrest.

Discussion

Our results illustrate the power of MIP-seq as a population selection-and-sequencing approach for analysis of complex traits in C. elegans. MIP-seq can be used in any organism with known sequence variants and that can be cultured in sufficiently large numbers with the ability to select on the trait of interest. With sufficient population genetic complexity and sequencing depth, meaningful phenotypic differences too small or variable to be detected by manual assays can be discovered, leading to improved understanding of gene-by-environment interactions and the genotype-to-phenotype map. When complex traits are highly polygenic (Boyle et al., 2017), it is critical to leverage the power of sequencing to elucidate their architectures. Here we used MIP-seq with a large panel of wild strains for statistical genetic analysis, but it can also be used with panels of recombinant lines for high-resolution gene mapping (Mok et al., 2017). MIP-seq can also be used for phenotypic analysis of mutants where it is beneficial to boost sensitivity and precision by using sequencing to count exceptionally large numbers of individuals (Shendure et al., 2017; Mok et al., 2020).

We characterized natural variation in starvation resistance in a set of genetically diverse, wild strains of C. elegans using MIP-seq and traditional assays. Our results suggest relatively little phenotypic variation of this presumably fitness-proximal trait. Nonetheless, we validated three QTL and showed four irld genes in these QTL impact starvation recovery. For irld-11 and irld-57, we generated deletion mutants, which do not precisely match the variants present in wild strains. For irld-39 and irld-52, the engineered alleles match starvation-resistant strains, but we have not confirmed their loss of function. Thus, our results suggest, but do not definitively demonstrate, that variation in irld genes affects starvation resistance in this species. The irld gene family is expanded relative to other Caenorhabditis species, suggesting that expansion (or contraction) of gene families influences natural variation and possibly evolutionary adaptation in this context. In addition, two of the irld genes identified are in hyper-divergent regions of the genome, consistent with genes in these regions contributing to environmental responses (Lee et al., 2021). However, irld variants investigated each had relatively weak phenotypic effects compared to the NILs, suggesting they do not fully account for natural variation in the trait associated with the QTLs. This implies other variants (Supplementary file 2), possibly of larger effect, also contribute to phenotypic variation.

Genetic epistasis analysis suggests that the effect of irld-39 and irld-52 on starvation resistance depends on daf-16/FoxO, and the double mutant increases DAF-16 nuclear localization, suggesting that these irld genes modify IIS. However, irld-39 and irld-52 could affect DAF-16 activity independent of IIS and could also affect other signaling pathways. IRLDs also bear weak homology to EGF receptors, and irld family members hpa-1 and hpa-2 affect healthspan by modifying EGF signaling (Iwasa et al., 2010). It is not known whether EGF signaling affects starvation resistance or other aspects of L1 arrest, and future work is needed to address the possible role of irld genes affecting EGF signaling in this context.

Ideas and speculation

Given the proposal that IRLD proteins modify IIS, it is intriguing to speculate that they do so by binding any of the 40 insulin-like peptides (ILPs) that would otherwise agonize or antagonize DAF-2/InsR (Pierce et al., 2001), as suggested previously (Dlakić, 2002). DAF-2B is an alternative isoform of DAF-2/InsR that includes the extracellular domain but lacks the tyrosine kinase domain, like the IRLD proteins, and it is also thought to act this way (Martinez et al., 2020). This hypothetical mechanism is also analogous to the proposed function of insulin-like growth factor (IGF)-binding proteins, which affect circulation and receptor binding of IGF proteins (Allard and Duan, 2018). These parallels suggest the possibility that natural variation in the IGF-binding protein family (Rotwein, 2017) contributes to phenotypic variation in humans. However, we have not shown that IRLD proteins actually bind ILPs, and a variety of uncertainties remain regarding their function.

Expression analysis provides clues to how irld genes possibly influence starvation resistance. Published whole-animal mRNA-seq analysis of fed and starved L1 larvae (Webster et al., 2018) revealed relatively low expression levels of the entire irld family (Figure 4—figure supplement 1). However, about half of the irld genes were differentially expressed, and all of those were upregulated in starved larvae, suggesting a role in starvation. We also interrogated existing single-cell RNA-seq datasets. One includes the major tissue types in fed L2-stage larvae (Cao et al., 2017), and it suggests that irld genes are most prominently expressed in ciliated sensory neurons, though there is expression in other neurons and tissues (Figure 4—figure supplement 2). Another study focused on neurons in fed L4-stage larvae (Taylor et al., 2021), and it suggests that irld gene expression is more prominent in sensory neurons than other neuron types (Figure 4—figure supplement 2). irld-39 is expressed in ASJ sensory neurons, along with distal tip cells and vulval precursors (Figure 4—figure supplement 2). irld-52 is expressed in the ADL sensory neurons and also intestinal rectal muscle cells. C. elegans sensory neurons are polymodal and influence life-history traits regulated by IIS, including dauer formation, aging, and L1 arrest (Bargmann and Horvitz, 1991; Vowels and Thomas, 1992; Apfeld and Kenyon, 1999). ASJ is known to express the relatively potent ILP DAF-28 in nutrient and sensory-dependent fashion (Li et al., 2003; Kaplan et al., 2018), and daf-28 affects L1 starvation survival (Chen and Baugh, 2014). ins-4/ILP is also expressed in ASJ, and it too affects L1 starvation survival (Chen and Baugh, 2014). If IRLD-39 and IRLD-52 proteins are translated and function in the vicinity of these sensory neurons, that would allow them to exert their influence at the interface of the animal and its environment.

Materials and methods

Strains used in this study

Request a detailed protocol

In addition to N2, wild isolates CB4854, CB4856, CX11254, CX11264, CX11271, CX11276, CX11285, CX11307, DL200, DL226, DL238, ED3049, ECA189, ECA191, ECA36, ECA363, ECA369, ECA372, ECA396, ED3017, ED3052, ED3077, EG4724, EG4725, GXW1, JU1212, JU1400, JU1581, JU1652, JU1793, JU1896, JU2001, JU2007, JU2017, JU2106, JU2234, JU2316, JU2464, JU2519, JU2526, JU2576, JU258, JU2592, JU2619, JU2811, JU2829, JU2593, JU2838, JU2841, JU2878, JU2879, JU3137, JU561, JU774, JU775, JU782, KR314, LKC34, MY10, MY16, MY18, MY2147, MY23, MY2453, MY2741, NIC195, NIC199, NIC251, NIC252, NIC256, NIC527, NIC258, NIC261, NIC262, NIC265, NIC266, NIC268, NIC271, NIC3, NIC501, NIC523, NIC526, NIC528, PB306, PS2025, QG2075, QG556, QW947, QX1211, QX1212, QX1791, QX1792, QX1793, QX1794, WN2001, XZ1513, XZ1514, XZ1515, and XZ1516 were phenotyped for starvation resistance using MIP-seq. In addition to these 100 strains, CX11262, ECA348, and NIC260 were included in the MIP-seq pilot but excluded from subsequent analysis based on quality-control metrics described in the ‘MIP-seq analysis’ section. QX1430 was used for validation assays. All wild isolates were obtained from CeNDR (Cook et al., 2017). CB1370 daf-2(e1370) III, CF1038 daf-16(mu86) I, and OH16024 daf-16(ot971[daf-16::GFP]) I were used to assess the interaction of irld genes with insulin signaling.

Strains generated in this study

Request a detailed protocol

Near-isogenic lines include:

  • LRB392 – dukIR7(V, EG4725 >MY2147)

  • LRB393 – dukIR8(V, EG4725 >MY2147)

  • LRB395 – dukIR10(V, EG4725 >MY2147)

  • LRB396 – dukIR11(V, MY2147 >EG4725)

  • LRB397 – dukIR12(V, MY2147 >EG4725)

  • LRB398 – dukIR13(V, MY2147 >EG4725)

  • LRB399 – dukIR14(V, MY2147 >EG4725)

  • LRB400 – dukIR15(V, MY2147 >EG4725)

  • LRB401 – dukIR16(V, MY2147 >EG4725)

  • LRB402 – dukIR17(V, EG4725 >MY2147)

  • LRB403 – dukIR18(V, EG4725 >MY2147)

  • LRB407 – dukIR19(V, EG4725 >MY2147)

  • LRB408 – dukIR20(V, EG4725 >MY2147)

  • LRB409 – dukIR21(V, EG4725 >MY2147)

  • LRB410 – dukIR22(IV, DL238>N2)

  • LRB411 – dukIR23(IV, DL238>N2)

See Figure 3—figure supplement 1 for wild isolate composition.

CRISPR-edited strains and new crosses include:

  • LRB412 irld-39 in N2 background – irld-39(duk1) IV

  • LRB413: irld-39 in MY2147 background – irld-39(duk2[MY2147]) IV

  • LRB414: irld-39 in MY2147 background – irld-39(duk3[MY2147]) IV

  • LRB415: irld-39 in MY2147 background – irld-39(duk4[MY2147]) IV

  • LRB420: irld-11 in MY2147 background – irld-11(duk9[MY2147]) V

  • LRB421: irld-52 in N2 background – irld-52(duk10) V

  • LRB422: irld-52 in MY2147 background - irld-52(duk11[MY2147]) V

  • LRB423: irld-11 in N2 background – irld-11(duk12) V

  • LRB425: irld-57 in N2 background – irld-57(duk13) V

  • LRB426: irld-57 in N2 background – irld-57(duk14) V

  • LRB427: irld-57 in MY2147 background – irld-57(duk15[MY2147]) V

  • LRB428: irld-57 in MY2147 background – irld-57(duk16[MY2147]) V

  • LRB431: irld-52 in N2 background – irld-52(duk17) V

  • LRB444: irld-39; irld-52 (generated from crossing LRB412 and LRB431) - irld-39(duk1) IV; irld-52(duk17) V

  • LRB456: daf-16(mu86) I; irld-39(duk1) IV; irld-52(duk17) V

  • LRB457, LRB458: daf-2(e1370) III; irld-39(duk1 IV); irld-52(duk17) V

  • LRB463: daf-16(ot971) I; irld-39(duk1) IV; irld-52(duk17) V

Multiple strain names for the same genotype indicates independent lines.

MIP-seq experimental set-up

Request a detailed protocol

Wild strains were independently passaged on 10 cm NGM plates with OP50 E. coli every two to three days to ensure they did not starve for at least three generations prior to the experiment. For each biological replicate, a single non-starved plate with gravid adults was selected per strain to ensure initial representation of all strains. Strains were pooled for hypochlorite treatment to obtain pure populations of embryos (Hibshman et al., 2021). Embryo concentration was calculated by repeated sampling, and 500,000 embryos were resuspended at 10/µL in S-basal (50 mL total culture) and placed in a 20°C shaker at 180 rpm to hatch without food and enter L1 arrest. On day 1 (24 hr after hypochlorite treatment), 5 mL of culture (50,000 L1s) was taken as a baseline sample, spun down at 3000 rpm, aspirated down to approximately 100 µL in an Eppendorf tube, flash frozen in liquid nitrogen, and stored at –80°C until DNA isolation. At days 1, 9, 13, and 17, aliquots from the L1 arrest culture were set up in recovery cultures at 5 L1s/µL, 1x HB101 (25 mg/mL), and S-complete. Recovery cultures were 10 mL for days 1 and 9, 20 mL for day 13, and 50 mL for day 17 to account for lethality late in starvation by ensuring adequate population sizes. Four days after recovery culture set-up, samples were collected for DNA isolation. For days 1 and 9, the recovery culture was freshly starved with adults and next-generation L1 larvae. At day 13, the culture was typically near starved, with adults and some L1 larvae. At day 17, the culture was typically not starved. If HB101 was still present at collection, samples were washed 3–4 times with S-basal. Samples were flash frozen in liquid nitrogen and stored at –80°C until DNA isolation.

DNA isolation

Request a detailed protocol

Frozen samples were rapidly freeze-thawed three times, cycling between liquid nitrogen and a 45°C water bath. Genomic DNA was isolated using the Quick-DNA Miniprep Kit (Zymo Research# D3024) following the manufacturer’s protocol. The DNA concentration was determined for each sample using the Qubit dsDNA HS Assay kit (Invitrogen# Q32854).

MIP design

Request a detailed protocol

MIPgen (Boyle et al., 2014) was used to design four MIPs for each of 103 strains. Unique homozygous SNVs were parsed from the VCF file WI.20170531.vcf.gz (available at https://storage.googleapis.com/elegansvariation.org/releases/20170531/WI.20170531.vcf.gz). Target regions in BED format were generated using the makeBedForMipgen.pl script. MIPgen was used against C. elegans genome version WS245 with the following parameters: -min_capture_size 100 -max_capture_size 100 -tag_sizes 0, 10. MIPs are 80 base-pairs (bp) long and include 20 bp ligation and extension arms that are complementary to DNA surrounding the unique SNV of interest for each strain. In addition, P5 and P7 Illumina sequences are included as part of the MIP to facilitate Illumina sequencing. Each MIP molecule includes a 10 bp unique molecular identifier (UMI) adjacent to the ligation arm. Only MIPs that capture the SNV within a 50 bp sequencing read were used, meaning the SNV was no more than 40 bp away from the UMI. SNPs located within 40 bases of the sequencing start site were parsed with the parseMipsPerSNPposition.pl script. These scripts can be found at https://github.com/amykwebster/MIPseq_2021 (Webster, 2021; copy archived at swh:1:rev:27839dcc9ef1587086be195349310fb70fbfcaf1).

MIP-seq library preparation and sequencing

Request a detailed protocol

For pilots and the starvation-resistance experiment, 500 ng genomic DNA from each sample was used for MIP-seq libraries. Libraries were generated as described previously (Hiatt et al., 2013) with the following modifications. We included 1,000 copies of each MIP for every individual copy of the worm genome in the 500 ng input DNA, which corresponded to 0.0083 picomoles of each individual MIP. All 412 MIPs (sequences available in Supplementary file 1) were first pooled in an equimolar ratio at a concentration of 100 μM. The MIP pool was diluted to 5 μM in 1 mM Tris buffer, and 50 μL of this pool was used in the 100 μL phosphorylation reaction. Next, the probe hybridization reaction for each sample was set with 500 ng DNA and 3.42 picomoles (0.0083 picomoles x 412) of the phosphorylated probe mixture. Following hybridization, gap filling, ligation, and exonuclease steps were performed as described previously. PCR amplification of the captured DNA (primer sequences available in Supplementary file 1) was performed in a 50 μL reaction with 18 cycles. The PCR libraries were purified using the SPRIselect beads (Beckman# B23318), and library concentrations were assessed with the Qubit dsDNA HS Assay kit (Invitrogen# Q32854). Sequencing was performed on the Illumina HiSeq 4000 to obtain 50 bp single-end reads.

MIP-seq analysis

Request a detailed protocol

FASTQ files from sequencing reads were processed using the script parseMIPGenotypeUMI.pl, also available at https://github.com/amykwebster/MIPseq_2021. This script accepts as input the list of MIPs produced from MIPgen, the UMI length, and FASTQ files in order to count the number of reads corresponding to each MIP and whether they have the reference allele, alternative allele, or one of two other alleles. While we included UMIs in our MIP design, use of the UMI to filter duplicate reads in pilot standard curves did not improve data quality (likely due to the relatively large mass of DNA used to prepare libraries), and so the UMI was not used in the published analysis. For each MIP, the frequency of the strain for which the MIP captures its unique SNV was calculated as the alternative read count divided by the total of alternative and reference read counts. For the MIP pilot with all strains in an equimolar ratio, there were 246,986,236 total mapped reads to all MIPs. Individual MIPs were filtered out if they did not meet the following criteria: (1) They were within 3.5-fold of expected frequency (that is, alt / (alt +ref) was within 3.5-fold of 1/103), (2) ‘other’ reads (those that are not alternative or reference alleles) were <20,000 total, and (3) alternative and reference allele totals were between 20,000 and 2,000,000 total reads. 321 of 412 MIPs met these criteria, and reads from these 321 MIPs were included in subsequent analysis. N2 has very few unique SNVs making it difficult to design optimal MIPs, and N2 MIPs did not meet these criteria but were included nonetheless (see Supplementary file 1). For the standard curve experiment (Figure 1F), DNA from seven strains (CB4856, DL200, ED3077, JU258, JU561, JU1652, and N2) was pooled in defined concentrations (‘expected’), and MIPs that met the criteria defined above were used to calculate strain frequencies (‘observed’, see Supplementary file 1).

For the starvation-resistance experiment, an average of 51.7 million reads (standard deviation 7.2 million reads) were sequenced per library (one library per time point, replicate, and condition – 25 libraries total). An average of 94% of reads (standard deviation 0.5%) matched the ligation probe, and 71.8% (standard deviation 3.4%) matched the ligation probe and scan sequence. Strain frequencies were determined by averaging the frequencies calculated across MIPs included in the 321 MIPs for each strain. A dataframe of all strains and their frequencies at day 1 baseline, as well as days 1, 9, 13, and 17 after recovery for all replicates was used to obtain trait values for subsequent analysis. PCA was performed on the dataframe following normalization of day 1, 9, 13, and 17 time points by the baseline day 1 sample and log2 transformation. PC1 loadings were extracted for each strain. For ‘Slope’, day 1, 9, and 13 recovery samples were normalized by day 1 frequencies and log2 transformed. For each strain, a line was fit to day 1, 9, and 13 normalized data with intercept at 0, and the slope of the line was taken as the trait value.

Comparison of MIP-seq and RAD-seq

Request a detailed protocol

To determine how well MIP-seq trait values correlated with RAD-seq trait values from previous work (Webster et al., 2019), RAD-seq data were normalized the same way that we normalized the MIP-seq data. Specifically, data from one biological replicate from RAD-seq that had data at time points over the course of starvation, including days 1, 7, 14, 21, and 24, was used. The frequency of each strain at each time point was divided by its frequency on day 1. These values were log2 transformed, so positive values indicate an increase in frequency over time and negative values indicate a decrease in frequency over time. A linear regression was then fit to each with a y-intercept of 0 through the data points over time. The slope of the line was calculated as the trait value for each strain. RAD-seq and MIP-seq data were filtered to include only the 34 strains that were present in both analyses. The values were plotted against each other and a linear regression was fit through these points to determine their correlation (R2=0.24, p=0.002).

GWA analysis

Request a detailed protocol

Slope and PC1 trait values for each strain were used for GWA using the R package cegwas2 (Zdraljevic et al., 2021). Genotype data were acquired from the latest VCF release (release 20200815) from CeNDR. BCFtools (Li, 2011) was used to filter variants below a 5% minor allele frequency and variants with missing genotypes and used PINKv1.9 (Purcell et al., 2007; Chang et al., 2015) to prune genotypes using linkage disequilibrium. The additive kinship matrix was generated from 45,733 markers using the A.mat function in the rrBLUP package. Because these markers have high LD, eigen decomposition of the correlation matrix of the genotype matrix was performed to identify 570 independent tests. GWA was performed using the GWAS function of the rrBLUP package (Endelman, 2011). Significance was determined by an eigenvalue threshold by the number of independent tests in the genotype matrix. Confidence intervals were defined as +/-150 SNVs from the rightmost and leftmost markers passing the significance threshold.

ALT and REF information for irld-39 and irld-52 high-impact variants was obtained from fine mapping and is available as part of Supplementary file 2. To determine whether irld-57 and irld-11 overlapped with hyper-divergent regions in each strain, coordinates of hyper-divergent regions for each strain were obtained from Lee et al., 2021, and coordinates of irld-11 and irld-57 were obtained from WormBase. If the hyper-divergent region and gene overlapped for a strain, then the strain was considered hyper-divergent at the locus. Hyper-divergent status of each strain is available in Supplementary file 2.

Enrichment analyses

Request a detailed protocol

To identify enriched gene groups, fine mapping data from Slope and PC1 results were merged with WS273 gene names. Unique sequence names were extracted (see Supplementary file 2), and the 867 sequence names with variants in Slope or PC1 QTL were used in WormCat (Holdorf et al., 2020) to identify functional category enrichments (Figure 3C). The most specific enrichments (those in Category 3) are shown.

For protein domain enrichment analysis, a protein fasta file was downloaded from Wormbase (c_elegans.PRJNA13758.WS281.protein.fa). To determine enriched protein domains, the 867 sequence names present among genes with variants in significant QTL were first used to subset this fasta file. In cases in which a gene had multiple versions within the fasta file, the ‘a’ isoform of the gene was used. 644 of the 867 sequence names had protein sequences in the fasta file; most others are annotated as pseudogenes and presumably do not have protein sequences. The protein sequences were used as input using the hmmscan program (https://www.ebi.ac.uk/Tools/hmmer/search/hmmscan) and searching the Pfam database (Finn et al., 2011). To obtain a background set of protein domains, the genome fasta file was also used to search the Pfam database. Fasta files were split into groups of 500 sequences that are between 10 and 5,000 peptides to comply with the hmmscan search algorithm. To calculate enrichment of protein domains, hypergeometric p-values were calculated for each protein domain present among genes with variants in significant QTL. 102 protein domains were present, so a Bonferroni-corrected p-value of 0.00049 was used as a significance threshold. Protein domains were excluded if the domain was not present at least five times among genes with variants in significant QTL.

NIL generation

Request a detailed protocol

To validate chromosome IV and V QTL, pairs of strains that differ for starvation resistance and the alternative vs reference allele for the associated SNV marker were chosen. Compatibility at the peel-1/zeel-1 and pha-1/sup-35 loci was considered (Seidel et al., 2008; Ben-David et al., 2017). For chromosome V QTL, EG4725 and MY2147 were compatible at both loci, and we generated reciprocal NILs for the left and right arms of chromosome V. EG4725 did not have the alternative allele associated with starvation resistance for chromosome IV, so we used DL238 and N2 as the parental strains. DL238 and N2 are incompatible for reciprocal crosses, but we introgressed the DL238 chromosome IV QTL into the N2 background. To generate NILs, the two parental strains were first crossed, then F2 progeny were genotyped on each end of the desired QTL for introgression to identify homozygotes from one parental background (e.g. MY2147). Then these homozygotes were repeatedly backcrossed to the opposite background (e.g., EG4725) and repeatedly genotyped to maintain homozygotes at the introgressed region. Genotyping was performed using PCR to amplify a genomic region whose sensitivity to a particular restriction enzyme depends on parental genetic background. Primers were designed using VCF-kit (Cook and Andersen, 2017). Primers and enzymes used can be found in Supplementary file 2. NILs were backcrossed a minimum of six times. Final NILs were sequenced at ~1 x coverage to determine the parental contributions over the entire genome (Figure 3—figure supplement 1 and Supplementary file 2).

CRISPR design and implementation to edit irld genes

Request a detailed protocol

For genes of interest, CRISPR guide design was done in Benchling using genome version WBcel235 and importing sequence for genes of interest. To generate irld-39 and irld-52 variants (5 bp deletions), a single guide RNA (sgRNA) and repair template was generated. For irld-11 and irld-57, two sgRNAs were generated per gene to delete the entire gene and a single repair template was used. sgRNAs (2 nmol) and 100 bp repair templates (highest purity at 4 nmol) were ordered from IDT. The dpy-10 co-CRISPR method was used to generate and screen for edits (Paix et al., 2015). The injection mix used was: sgRNA for dpy-10 (0.2 µL of 100 µM stock), sgRNA of gene of interest (0.5 µL of 100 µM stock), dpy-10 repair template (0.5 µL of 10 µM stock), repair template for gene of interest (0.6 µL of 100 µM stock), Cas9 (0.8 µL of 61 µM stock), and water up to 10 µL total. Injection mix components were stored at –20°C, and injection mix was incubated at room temperature for one hour before injections. N2 and MY2147 L4s were picked the day before injecting, and young adults were injected in the gonad and singled to new plates. After 3–4 days, next-generation adults were screened for rollers, which are heterozygous for the dpy-10 edit and have increased likelihood of also having the desired edit. Non-roller F2 progeny of F1 roller worms were then genotyped to identify worms homozygous for the desired edit, and edits were confirmed by Sanger sequencing. Sequences of sgRNAs, repair templates, and PCR primers for genotyping are available in Supplementary file 2.

Starvation recovery (worm length measurements)

Request a detailed protocol

Strains were maintained well-fed for at least three generations prior to beginning experiments. Gravid adults were hypochlorite treated to obtain embryos, which were resuspended at 1 embryo/µL in 5 mL of S-basal in a glass test tube and placed on a roller drum at 20°C so they hatch and enter L1 arrest. After the number of days of L1 arrest indicated on each graph, an aliquot of 500–1000 µL (a consistent volume was used between conditions within the same experiment) per strain was plated on a 10 cm plate with OP50 and allowed to recover for 48 hr. After 48 hr, worms were washed onto an unseeded NGM plate. Images were then taken of worms using a ZeissDiscovery V20 stereomicroscope. To determine lengths of worms, the WormSizer plugin for Fiji was used and worms were manually passed or failed (Moore et al., 2013). To determine differences in starvation recovery between strains, a linear mixed-effect model was fit to the length data for all individual worms with duration of starvation and strain as fixed effects and biological replicate as a random effect using the package nlme in R. The summary function was used to calculate a p-value from the t-value.

Starvation survival

Request a detailed protocol

L1 arrest cultures were set up as described for starvation recovery. Starting on the first day of arrest and proceeding every other day, a 100 µL aliquot of culture was pipetted onto a 5 cm NGM plate with a spot of OP50 at the center. The aliquot was placed around the periphery of the lawn, and the number of worms plated was counted. Two days later, the number of worms that had made it to the bacterial lawn and were alive was counted. Live worms that have developed and were outside the lawn were also counted. The total number of live worms after two days was divided by the total plated to determine the proportion alive. For each replicate, a logistic curve was fit to the data, and the half-life (time at 50% survival) was calculated, and a t-test was performed on half-lives between strains of interest. Power analysis was performed in R using the pwr.t.test function in the ‘pwr’ package, with parameters n=5, sig.level=0.05, power = 0.5, and type = two.sample. The value of d was calculated, and this was multiplied by the standard deviation of control median survival for that experiment to determine the detectable effect size.

Early fecundity following starvation

Request a detailed protocol

For the assay in Figure 2G and L1 arrest cultures were set up as described for starvation recovery. For the assay in Figure 4C, the experiment was done in a different lab and worms were arrested in a 15 mL conical tube instead of a glass test tube. Conical tubes were rotated continuously at 20°C. For both figure panels, ~500 L1 larvae were plated on 10 cm OP50 plates at the indicated time point, then allowed to recover for 48 hr. Worms were singled to new 5 cm OP50 plates at approximately 48 hr, then allowed lay progeny until 72 hr, at which time the singled worm was removed. Progeny were counted on these plates 2–3 days later to determine the early fecundity of the individual worms.

Nuclear localization

Request a detailed protocol

L1 arrest cultures were set up as described for starvation recovery. At 36 hr of L1 arrest, an aliquot of 700 µL was spun down in a 1.7 mL Eppendorf tube at 3000 rpm for 30 s to pellet L1 larvae. Of worm pellet, 1.5 µL was pipetted into the center of a slide with a 4% Noble agar pad, and a glass cover slip was immediately placed on top. A timer was set for 3 min, and the slide was systematically scanned with each individual worm scored for nuclear localization at 40 x or 100 x with a Zeiss compound microscope. Nuclear localization of DAF-16::GFP was scored in intestinal cells and assigned as one of four categories: nuclear, more nuclear, more cytoplasmic, and cytoplasmic. ‘More nuclear’ and ‘more cytoplasmic’ are intermediate categories between nuclear and cytoplasmic, with localization closer to being nuclear or cytoplasmic, respectively. Scoring for each slide stopped after 3 min. For statistical analysis, nuclear and more nuclear categories were pooled as ‘nuclear’, while cytoplasmic and more cytoplasmic were pooled as ‘cytoplasmic’. The Cochran-Mantel-Haenszel test was used to determine differences in the distribution of the two categories while controlling for biological replicate. See Figure 4E for representative images. DAF-16 is initially very nuclear during L1 starvation, and it moves back to the cytoplasm over time during starvation (Mata-Cabana et al., 2020). The 36 hr time point was chosen since it is intermediate in this dynamic process.

Analysis of published RNA-seq data

Request a detailed protocol

We analyzed data from three existing publications (Figure 4—figure supplements 1 and 2; Supplementary file 3; Cao et al., 2017; Webster et al., 2018; Taylor et al., 2021). First, we re-analyzed whole worm bulk mRNA-seq data from fed and starved N2 L1 larvae (four replicates of each condition from a single batch) (Webster et al., 2018). Count data was analyzed using edgeR. 60 irld genes were part of the protein-coding gene dataset for genome version WS273, and no minimum expression filter was used to restrict the gene set. The calcNormFactors, estimateCommonDisp, and estimateTagwiseDisp functions were used prior to running the exactTest. An FDR cutoff of 0.05 was used to determine significance. For single-cell data across all major worm tissues (Cao et al., 2017),Table S4 from the paper was subset to include only irld genes, 63 of which were present in the table. Gene expression is represented in Figure 4—figure supplement 2 when expression levels of transcripts-per-million are at least 1 for that tissue type. For single-cell neuronal data, expression values for irld genes were obtained from Supplementary Table 11 of Taylor et al., 2021, which includes genes considered expressed at a variety of thresholds and neuronal cell types. Data plotted in Figure 4—figure supplement 2 uses threshold 3 and data from sensory neurons.

Materials and correspondence

Request a detailed protocol

Correspondence and material requests should be addressed to ryan.baugh@duke.edu.

Data availability

Raw MIP-seq data for the starvation-resistance experiment and the pilot experiments to test individual MIPs is available as part of NCBI BioProject PRJNA730178. Code for processing MIP-seq data is available at GitHub (copy archived at swh:1:rev:27839dcc9ef1587086be195349310fb70fbfcaf1). A Source Data file for all figures is also included.

The following data sets were generated
    1. Webster AK
    2. Baugh LR
    (2021) NCBI BioProject
    ID PRJNA730178. Population sequencing of C. elegans wild isolates throughout starvation.

References

    1. Baugh LR
    2. Hu PJ
    (2020)
    Starvation Responses Throughout the Caenorhabditis elegans Life Cycle
    Genetics 216:837–878.
    1. Ried JS
    2. Jeff M J
    3. Chu AY
    4. Bragg-Gresham JL
    5. van Dongen J
    6. Huffman JE
    7. Ahluwalia TS
    8. Cadby G
    9. Eklund N
    10. Eriksson J
    11. Esko T
    12. Feitosa MF
    13. Goel A
    14. Gorski M
    15. Hayward C
    16. Heard-Costa NL
    17. Jackson AU
    18. Jokinen E
    19. Kanoni S
    20. Kristiansson K
    21. Kutalik Z
    22. Lahti J
    23. Luan J
    24. Mägi R
    25. Mahajan A
    26. Mangino M
    27. Medina-Gomez C
    28. Monda KL
    29. Nolte IM
    30. Pérusse L
    31. Prokopenko I
    32. Qi L
    33. Rose LM
    34. Salvi E
    35. Smith MT
    36. Snieder H
    37. Stančáková A
    38. Ju Sung Y
    39. Tachmazidou I
    40. Teumer A
    41. Thorleifsson G
    42. van der Harst P
    43. Walker RW
    44. Wang SR
    45. Wild SH
    46. Willems SM
    47. Wong A
    48. Zhang W
    49. Albrecht E
    50. Couto Alves A
    51. Bakker SJL
    52. Barlassina C
    53. Bartz TM
    54. Beilby J
    55. Bellis C
    56. Bergman RN
    57. Bergmann S
    58. Blangero J
    59. Blüher M
    60. Boerwinkle E
    61. Bonnycastle LL
    62. Bornstein SR
    63. Bruinenberg M
    64. Campbell H
    65. Chen Y-DI
    66. Chiang CWK
    67. Chines PS
    68. Collins FS
    69. Cucca F
    70. Cupples LA
    71. D’Avila F
    72. de Geus EJC
    73. Dedoussis G
    74. Dimitriou M
    75. Döring A
    76. Eriksson JG
    77. Farmaki A-E
    78. Farrall M
    79. Ferreira T
    80. Fischer K
    81. Forouhi NG
    82. Friedrich N
    83. Gjesing AP
    84. Glorioso N
    85. Graff M
    86. Grallert H
    87. Grarup N
    88. Gräßler J
    89. Grewal J
    90. Hamsten A
    91. Harder MN
    92. Hartman CA
    93. Hassinen M
    94. Hastie N
    95. Hattersley AT
    96. Havulinna AS
    97. Heliövaara M
    98. Hillege H
    99. Hofman A
    100. Holmen O
    101. Homuth G
    102. Hottenga J-J
    103. Hui J
    104. Husemoen LL
    105. Hysi PG
    106. Isaacs A
    107. Ittermann T
    108. Jalilzadeh S
    109. James AL
    110. Jørgensen T
    111. Jousilahti P
    112. Jula A
    113. Marie Justesen J
    114. Justice AE
    115. Kähönen M
    116. Karaleftheri M
    117. Tee Khaw K
    118. Keinanen-Kiukaanniemi SM
    119. Kinnunen L
    120. Knekt PB
    121. Koistinen HA
    122. Kolcic I
    123. Kooner IK
    124. Koskinen S
    125. Kovacs P
    126. Kyriakou T
    127. Laitinen T
    128. Langenberg C
    129. Lewin AM
    130. Lichtner P
    131. Lindgren CM
    132. Lindström J
    133. Linneberg A
    134. Lorbeer R
    135. Lorentzon M
    136. Luben R
    137. Lyssenko V
    138. Männistö S
    139. Manunta P
    140. Leach IM
    141. McArdle WL
    142. Mcknight B
    143. Mohlke KL
    144. Mihailov E
    145. Milani L
    146. Mills R
    147. Montasser ME
    148. Morris AP
    149. Müller G
    150. Musk AW
    151. Narisu N
    152. Ong KK
    153. Oostra BA
    154. Osmond C
    155. Palotie A
    156. Pankow JS
    157. Paternoster L
    158. Penninx BW
    159. Pichler I
    160. Pilia MG
    161. Polašek O
    162. Pramstaller PP
    163. Raitakari OT
    164. Rankinen T
    165. Rao DC
    166. Rayner NW
    167. Ribel-Madsen R
    168. Rice TK
    169. Richards M
    170. Ridker PM
    171. Rivadeneira F
    172. Ryan KA
    173. Sanna S
    174. Sarzynski MA
    175. Scholtens S
    176. Scott RA
    177. Sebert S
    178. Southam L
    179. Sparsø TH
    180. Steinthorsdottir V
    181. Stirrups K
    182. Stolk RP
    183. Strauch K
    184. Stringham HM
    185. Swertz MA
    186. Swift AJ
    187. Tönjes A
    188. Tsafantakis E
    189. van der Most PJ
    190. Van Vliet-Ostaptchouk JV
    191. Vandenput L
    192. Vartiainen E
    193. Venturini C
    194. Verweij N
    195. Viikari JS
    196. Vitart V
    197. Vohl M-C
    198. Vonk JM
    199. Waeber G
    200. Widén E
    201. Willemsen G
    202. Wilsgaard T
    203. Winkler TW
    204. Wright AF
    205. Yerges-Armstrong LM
    206. Hua Zhao J
    207. Zillikens MC
    208. Boomsma DI
    209. Bouchard C
    210. Chambers JC
    211. Chasman DI
    212. Cusi D
    213. Gansevoort RT
    214. Gieger C
    215. Hansen T
    216. Hicks AA
    217. Hu F
    218. Hveem K
    219. Jarvelin M-R
    220. Kajantie E
    221. Kooner JS
    222. Kuh D
    223. Kuusisto J
    224. Laakso M
    225. Lakka TA
    226. Lehtimäki T
    227. Metspalu A
    228. Njølstad I
    229. Ohlsson C
    230. Oldehinkel AJ
    231. Palmer LJ
    232. Pedersen O
    233. Perola M
    234. Peters A
    235. Psaty BM
    236. Puolijoki H
    237. Rauramaa R
    238. Rudan I
    239. Salomaa V
    240. Schwarz PEH
    241. Shudiner AR
    242. Smit JH
    243. Sørensen TIA
    244. Spector TD
    245. Stefansson K
    246. Stumvoll M
    247. Tremblay A
    248. Tuomilehto J
    249. Uitterlinden AG
    250. Uusitupa M
    251. Völker U
    252. Vollenweider P
    253. Wareham NJ
    254. Watkins H
    255. Wilson JF
    256. Zeggini E
    257. Abecasis GR
    258. Boehnke M
    259. Borecki IB
    260. Deloukas P
    261. van Duijn CM
    262. Fox C
    263. Groop LC
    264. Heid IM
    265. Hunter DJ
    266. Kaplan RC
    267. McCarthy MI
    268. North KE
    269. O’Connell JR
    270. Schlessinger D
    271. Thorsteinsdottir U
    272. Strachan DP
    273. Frayling T
    274. Hirschhorn JN
    275. Müller-Nurasyid M
    276. Loos RJF
    (2016) A principal component meta-analysis on multiple anthropometric traits identifies novel loci for body shape
    Nature Communications 7:13357.
    https://doi.org/10.1038/ncomms13357

Decision letter

  1. Oliver Hobert
    Reviewing Editor; Columbia University, Howard Hughes Medical Institute, United States
  2. David E James
    Senior Editor; The University of Sydney, Australia
  3. Patrick McGrath
    Reviewer; Georgia Institute of Technology, Atlanta, United States

In the interests of transparency, eLife publishes the most substantive revision requests and the accompanying author responses.

Decision letter after peer review:

[Editors’ note: the authors submitted for reconsideration following the decision after peer review. What follows is the decision letter after the first round of review.]

Thank you for submitting the paper "Natural variation in the irld gene family affects insulin/IGF signaling and starvation resistance" for consideration by eLife. Your article has been reviewed by 3 peer reviewers, and the evaluation has been overseen by a Reviewing Editor and a Senior Editor. The following individuals involved in review of your submission have agreed to reveal their identity: Patrick T McGrath (Reviewer #3).

We are sorry to say that, after consultation with the reviewers, we have decided that this work is not currently suitable for publication in eLife. All three reviewers expressed an overall interest in the potential scope and importance of the work. However, as you can see detailed in the reviews detailed below, the reviewers questioned the strength of the evidence that implicated the fascinating ilrd genes in insulin receptor signaling. This concern was further amplified in an extensive and robust discussion that the 3 reviewers had after seeing each other's reviews. For example, one reviewer pointed out that manipulations in TGF-β signaling have similar DAF-16-related read-outs that you describe here for ildd gene manipulation; hence, these read-outs are not sufficient proof for direct involvement of these genes in insulin receptor signaling.

While we all agree that the paper is presently not a candidate for publication in eLife, we would be interested in seeing a very substantially revised version of this manuscript in which the function of the ilrd genes is more precisely delineated.

Reviewer #1:

In this manuscript, the authors interrogate a large panel of wild C. elegans strains to identify natural genetic variants that influence starvation resistance. They use molecular inversion probe sequencing (MIP-Seq) to rapidly identify specific strains in a pool of wild strains that are resistant or sensitive to starvation. By taking advantage of the C. elegans Natural Diversity Resource, they perform genome-wide association studies to identify quantitative trait loci (QTL) that influence starvation resistance. They validate these QTLs by constructing near-isogenic lines. Detailed analysis of these QTLs reveals variants in irld genes that are shown to influence organismal growth after starvation recovery. irld genes are hypothesized to encode extracellular proteins that may bind to insulin-like growth factors. Based on functional analysis of variants in irld-39 and irld-52, the authors propose a model in which IRLD-39 and IRLD-52 influence starvation resistance by modulating signaling through the insulin receptor homolog DAF-2.

The major strength of this study is the identification of natural genetic variants that influence starvation resistance. The authors use a creative and powerful approach that in principle can be used in any organism to elucidate the genetic architecture of any phenotypic trait. This aspect of the manuscript will be of general interest.

In my opinion there are four major weaknesses of the manuscript. First, the authors use organismal length after recovery from starvation as a surrogate phenotype for starvation resistance. I am not convinced that this is justified, as the post-recovery organismal length of one of the starvation-sensitive strains identified in the study is not significantly different from that of the two most starvation-resistant strains identified (Figure 2F). Additionally, insufficient information and characterization of the irld-39/52 variants is provided. If these are non-coding variants, it would be premature to conclude that they affect irld-39/52 function without supporting data. The functional analysis of the irld-39 and irld-52 variants does not convincingly support the authors' model of IRLD-39/52 acting through the DAF-2 insulin-like pathway. Related to this point, no experiments are presented to test the possibility that these variants influence LET-23/EGFR signaling, although IRLD proteins are reported to have homology to EGF receptors as well as insulin receptors.

1. Lines 100-102: What is the nature of the irld-39 and irld-52 variants? Are they intronic or exonic? If they are non-coding, then data is needed to show that they influence irld-39/52. Are they loss- or gain-of-function, and why? Why are they "high-impact"?

2. Lines 108-109: Post-starvation length is a direct measure of growth in response to refeeding. Here it is being used as a surrogate measure of starvation recovery. How is "recovery" defined? One could use post-recovery survival as a measure of "recovery," but I can imagine that post-recovery fecundity might be a better measure of recovery from an evolutionary standpoint. If the authors are going to use organismal length as a surrogate phenotype, they need to show that this phenotype tracks with a more biologically relevant "recovery" phenotype. The data for NIC526 (Figures 2E-F) suggest that post-recovery length may not be a good indicator of starvation resistance.

3. Figures 3J-K and 4A-B: Starvation resistance assays should be performed on these strains (e.g. Figure 2E).

4. Figure 4C: The DAF-16 localization data are not convincing. The results show a modest difference, the biological significance of which is unclear. Was the experimenter blinded to the identity of the strain being observed? How was the 36-hour time point chosen, and why is this more biologically relevant than other time points?

5. Line 139: Based on the Methods section, it appears that the authors are using daf-2(e1370), which is a strong lof allele. I don't think this is the right allele to use in these studies; DAF-16 is so strongly activated in daf-2(e1370) compared to the modest effect of irld-39;irld-52 on DAF-16 localization (Figure 4C) that it could easily obscure subtler effects of irld-39/52 on gene expression, regardless of whether DAF-2 acts downstream of or parallel to IRLD-39/52.

6. Line 146: The fact that DAF-16 target gene expression "reverses later in starvation" contradicts the authors' model. This observation warrants further experimentation.

7. The key transcriptome experiments to test the authors' model are missing. They need to show that changes in gene expression caused by manipulation of irld-39 and irld-52 activity are DAF-16-dependent.

Reviewer #2:

In this study, Webster et al. have aimed to identify the genetic factors that contribute to the differences between different wild C. elegans strains in terms of their resistance to starvation. The genomic sequences of hundreds of wild C. elegans strains have become recently available and this has given the opportunity to investigate the genetic determinants of the physiological differences between these wild populations that were isolated from different ecological niches. Here, the authors have subjected a mixture of wild C. elegans strains to long periods of starvation during early larval development and have utilized genomic sequencing to quantify the relative enrichment of each individual wild strain after exposure to starvation for different time intervals. Using the genomic sequencing strategy called MIP-Seq, they have identified two wild C. elegans strains that are overrepresented in the mixed population after extended starvation (implying higher starvation resistance compared to other wild strains) and they have also found two wild strains that are underrepresented after extended starvation (implying lower starvation resistance compared to other wild strains).

Using genome-wide association (GWA) analyses for parameters of starvation resistance, they have identified quantitative trait loci (QTL) associated with this phenotype. The genes enriched in these QTLs include multiple members of the insulin/EGF-receptor L domain (IRLD) gene family. The irld genes encode proteins that have extracellular ligand binding domains, but no receptor tyrosine kinase domains, and their function remains largely unknown. By introducing allelic variants for irld genes from the stress-resistant wild strains in the genetic background of the stress-sensitive strains using Crispr, the authors were able to improve the stress resistance of these sensitive strains, thus showing a direct role of irld genes in starvation resistance. Using epistasis experiments, they further demonstrate that irld genes might improve survival via interacting with insulin/IGF signaling in worms. Based on recently published neuronal single-cell RNA-seq data, the authors propose that irld genes function in specific sensory neurons to control starvation resistance in animals. How IRLD proteins modulate insulin signaling in a small subset of neurons to affect an organism-level phenotype and the underlying mechanism that likely involves interorgan signaling remain elusive.

There are several strengths of this study such as:

(1) The irld gene family has undergone large expansion in nematodes but their biological function remains mostly unknown. This study provides the first evidence for the role of this gene family in starvation resistance and thus indicating that the expansion of irld genes in nematodes might be a major contributing factor to the success of nematode species in colonizing a wide range of ecological niches.

(2) Through the innovative use of MIP-Seq, the authors have laid the foundation for a quantitative approach to measure differences in complex physiological traits in a mixed population of individuals that are genetically heterogenous. The same strategy can be useful for many other experimental paradigms such as studying the differences in resistance to physiological stressors, non-uniform effects of pharmacological compounds or variability in normal aging in genetically heterogenous wild populations.

(3) The irld mutants and the associated RNA-seq datasets generated in this study will be invaluable for C. elegans researchers to further investigate the potential roles of this understudied family of genes in regulating physiology, behavior and metabolism of animals.

However, the claims made in this study have limitations and shortcomings that are primarily attributable to the use of some suboptimal experimental strategies, which are listed below:

(1) To identify genes in the QTL for starvation resistance, the authors have looked for enrichment of gene symbol prefixes. Though they have identified the irld genes, which they demonstrate to be functionally related to starvation resistance, this approach is suboptimal because gene symbol prefixes in C. elegans are not always representative of gene function, but instead they have historically represented the phenotype of the mutant (e.g. 'let' for lethal, 'eat' for abnormal eating, 'unc' for uncoordinated etc.). Hence not all genes with the same gene symbol prefix have related biological functions, neither do all genes of the same gene family have the same gene symbol prefix. Hence, it is likely that the authors have missed out on identifying all the gene families that are enriched in the QTL for starvation resistance.

(2) The central message of the paper is that the irld genes regulate starvation resistance. There are two key components of this phenotype: (a) survival during starvation, and (b) recovery from starvation. In their initial experimental strategy to validate the starvation resistance of wild strains identified from MIP-Seq, the authors have performed assays for both starvation survival (proportion of surviving worms at different time points of starvation) and starvation recovery (body length measurement post 48 hr of recovery from starvation). However, all their subsequent analyses involving irld gene manipulations and interactions with insulin signaling only utilized the body length measurement assay. Since body length measurement is only a measure of starvation recovery but not of starvation survival, it is not possible to conclude whether irld gene manipulations improve overall survival of animals during starvation. Hence, a key measure of starvation resistance is missing from the methodology that has been used here to study the effect of irld genes.

(3) The claim that irld genes are predominantly expressed in sensory neurons is made using a dataset that did not have the expression profiles for non-neuronal tissues. Since tissues such as intestine, muscles and hypodermis have important roles in dictating organism-level phenotypes, it is essential to know whether the irld genes are expressed in these tissues. The tissue-restricted role of irld genes in starvation resistance that is proposed in the study can be addressed if the cell type-specific expression pattern of irld genes during normal and starvation conditions is known.

– Figure 3D: For this gene enrichment analysis, genes with the same symbol prefix were considered as part of the same gene family (line 362 in Methods). However, gene symbol prefixes in C. elegans are not always representative of gene function (e.g. let, eat, unc etc.). Hence, searching for enrichment of gene symbol prefixes might lead to misleading and incomplete results. For example, not all of the 283 genes with the 'nhr' gene symbol prefix (that the authors report in Figure 3D) belong to the NHR gene family. Many of these 'nhr' genes are pseudogenes (nhr-75, nhr-83, nhr-220 etc.) and many other genes with the 'nhr' symbol do not have the C4-zinc finger DNA binding domain that is a characteristic of members of the NHR gene family. Furthermore, not all members of the NHR gene family have 'nhr' gene symbol prefixes (e.g. daf-12, dpr-1, odr-7, unc-55 etc.). Instead of looking for enrichment of gene symbol prefixes, the authors should search for enrichment of specific protein domains (InterPro, Pfam etc.). This might reveal enrichment of genes belonging to other functional categories, in addition to the irld gene family identified here.

– Figures 3J, 3K, 4A, 4B: Measuring the body length of worms after 48 hr of recovery from starvation should not be the only parameter to quantify the starvation resistance of a particular genotype. The authors should also perform the standard starvation survival assays (similar to data shown in Figure 2E) for irld gene manipulations in N2 and MY2147 genetic backgrounds and also for the strains in which the interaction of irld genes with insulin signaling was investigated.

– Line 152: That authors should clarify that irld gene expression is restricted to sensory neurons among neuron types. The single-cell RNA-seq dataset they have utilized here reports expression only among neuron classes, but not in non-neuronal tissues. Firstly, the authors should repeat this analysis with the unthresholded dataset from Taylor et al. and remake figures 4H and figure S6 using expression data from both neuronal and non-neuronal tissues. Since non-neuronal tissues such as the intestine, muscles and hypodermis likely have important roles in determining starvation resistance of the animals, it is crucial to look at the expression of irld genes in these non-neuronal tissues as well. Secondly, the single-cell RNA-seq strategy in Taylor et al. was primarily designed to identify gene expression in neurons. Hence, the gene expression data from non-neuronal tissues might have not detected medium or weak expression of genes in non-neuronal tissues. Since the authors make the claim that irld-39 and irld-52 function primarily in sensory neurons to affect starvation resistance (line 159), it would be prudent to make Crispr-based transcriptional GFP reporters for these two genes and validate whether their expression is indeed restricted to ASJ and ADL neurons, respectively. These reporters should also be used to demonstrate whether the expression of irld genes changes in these neurons during exposure to starvation. If no expression is detected in non-neuronal tissues, this would strengthen the argument that irld genes are expressed in an anatomically restricted manner only in specific sensory neurons, but they regulate starvation resistance at the organism level potentially via systemic signaling. This would signify presence of cell non-autonomous effects of irld genes, which can be investigated in future studies.

Reviewer #3:

The authors make two major findings. First, they adapt MIP-seq to C. elegans, identifying primers that can identify individual strains and quantitate their relative proportion in group competition experiments. Second, they use this technique to map loci responsible for natural variation in starvation response, identifying irld family member genes that influence survival to starvation.

The development of MIP-seq is a major achievement. Other labs can use the primers that they develop to perform similar experiments, competing wild strains against each other in their assay of interest. Because the wild strains are already sequenced, GWAS can be performed without the cost of any sequencing, using available software that is provided by the authors. One potential issue with the adaptability of this approach is the potential for outcrossing during the competition phase. While this is not an issue for the starvation mapping they perform here, it will need to be addressed to make this technique generalizable. However, enthusiasm for this approach remains high; competition in large group settings provides a much better handle on fitness than more common assays.

Besides mapping and validating the loci that are responsible for variation in starvation response, they also identify causal mutations in irld genes. Using CRISPR-Cas9, they demonstrate a role for two natural mutations in starvation response and also implicate two additional irld genes as well. Use of CRISPR-Cas9 to specifically edit the genome are the gold standard for demonstrating a causal role for specific mutations. irld genes are homologous to insulin/EGF receptor proteins and this work implicates insulin signaling in starvation response. Additionally, they use classical genetics to implicate insulin signaling using epistasis experiments with the FOXO DAX-16 transcription factor. In general, starvation is poorly understood in humans and other species. This provides important evidence that insulin might be involved.

1. It is interesting that these genes are primarily expressed in sensory neurons. It is probably useful to use rescue experiments to show that this is the case.

2. Since the strains exists, some experiments on the CRISPR/Cas9 allelic-replacement strains in normal well-fed conditions would be useful. Do these strains have the same lifespan, store the same amount of fat, and eat the same amount of food during non-starvation conditions that could help explain why they survive longer?

3. There is little discussion about the generalizability of this work to other species. What is known or thought about variation in insulin pathways and starvation? Are there specific example in other species? How does this affect how we think about starvation and natural variation in starvation in humans and other species?

[Editors’ note: further revisions were suggested prior to acceptance, as described below.]

Thank you for resubmitting your work entitled "Natural variation in the irld gene family affects starvation resistance in C. elegans" for further consideration by eLife. Your revised article has been evaluated by David James (Senior Editor) and a Reviewing Editor.

The manuscript has been improved but there are some remaining issues that need to be addressed, as outlined below:

The reviewers have discussed their reviews with one another quite extensively. As you can see from their initial set of comments below, there still remains a substantial concern among all reviewers about whether and to what extent irld genes are involved in the starvation response. However, all reviewers have appreciated your creative new use of the MIP-Seq technology which we all expect to be quite impactful for further studies in C. elegans. We recommend that you (a) shorten the paper to a Report format, and (b) focus the paper on the technology aspect and provide the irld genes as an application. The present abstract of your paper organizationally already hints toward such a format, but this strategy should be implemented for the rest of the paper as well (including the Introduction). Also, as indicated by all of the reviewer's comments, please revise the manuscript editorially to consider alternative explanations of your data since, as you can see, the reviewers remain unconvinced that irld genes have been strongly implicated in this phenomenon.

Reviewer #1:

In the revised format, the manuscript is coherent and concise. This study has used MIP-seq to identify that genetic variation in the irld gene family determines some aspects of starvation resistance in wild worm isolates. However, the manuscript lacks any evidence regarding the mechanism and site of action of irld genes except the finding that one of the three phenotypes is DAF-16-dependent. Given the limited depth and breadth of this study, it is more suitable for the Short Reports format rather than the Research Article format.

Regarding the response to major comment #2 (Reviewer 2), the authors have not measured the starvation resistance of the irld-39; irld-52 double mutant in the MY2147 background. They quantified these phenotypes only in the N2 background, where the effects are either modest or not significant. Since single mutant manipulations produce much stronger phenotypes in the MY2147 background compared to N2 (Figure 3K), it is likely that the double mutant might display a robust increase in starvation resistance in the stress-sensitive MY2147 background. This experiment, though not essential, will greatly increase the impact of the study and will indicate that simultaneous manipulation of only a handful of irld genes can completely ameliorate the high stress-sensitivity in a wild strain.

Reviewer #2:

I appreciate the efforts that the authors have undertaken to address my critique of the initial submission, and I also commend them for their transparency about their results. However, I remain unconvinced about two of the authors' claims: that the irld variants they focus on account for the differences in starvation resistance observed in wild strains, and that irld-39/52 act through DAF-16 to modulate starvation resistance.

1. Figures 3I/J: this data shows that the irld edited strains do not confer improved starvation survival on the sensitive MY2147 background. While the authors offer the interpretation that "…the variants primarily affect starvation recovery," another more parsimonious explanation would be that these variants are not the key functional variants within the QTLs identified using MIP-seq.

2. The authors mention that "…the irld double mutant did not cause statistically significant changes in the expression of individual genes." Their explanation for this observation is that "We believe there must be differences in gene expression, but that they are relatively small and in specific tissues, thus obscured by analyzing whole worms. We also believe this is a testament to the sensitivity of our phenotypic assays." To me, the most parsimonious explanation for the observation that DAF-16 target gene expression is not influenced by irld-39/52 mutation is that the small increase in DAF-16 nuclear localization observed is not functionally significant. Moreover, while their phenotypic assays may be sensitive, the other more straightforward (IMO) explanation is that their phenotypic assays are capturing effects of other variants within the identified QTLs that are distinct from the irld variants that the authors have chosen to focus on.

3. The QTLs identified by the authors range from >600kb to >2.2Mb by my estimate. How many polymorphisms lie within these intervals? I understand the interest in the irld gene family, but the data do not convince me that the irld variants in question are the key functional variants within these intervals.

Reviewer #3:

The authors utilize a standard starvation assay to study natural variation in starvation response among wild strains of C. elegans. Taking advantage of the CeNDR database, the authors compete ~100 wild strains against each other and quantify the changes in population using MIP-seq. The authors quite convincingly show that differences in survival occur among the wild strains and use GWAS to non-biasedly identify regions of the genome that are associated with differences in survival in this paradigm (QTLs). Technically this is quite challenging, and the identification of the QTLs was verified nicely using near isogenic lines.

Throughout the paper, the authors describe the differences in survival in these conditions as starvation resistance. However, additional factors could be at play, such as differential susceptibility to toxins or pheromones that could build up during the multiday experiment.

By analyzing the QTLs, the authors identified a family of genes, irlds, which were enriched within these regions. These genes are upregulated by starvation and have homology to insulin-type receptors. The authors propose that natural variation in these genes is important for natural variation in starvation response. Two demonstrate this, the authors identify two irld genes that carry likely loss of function deletions and use CRISPR/Cas9 to engineer these mutations into other genetic backgrounds. Additionally, the authors' engineer deletion alleles (that do not mimic segregating alleles) in two additional irld genes.

Using these alleles, the authors convincingly show that irld genes play a role in this starvation assay, demonstrating differences in growth during and after exit from starvation. This result is likely to be exciting to researchers interested in starvation, as insulin signaling is an important genetic pathway in a large number of organisms.

While the authors also interpret their data to conclude that natural genetic variation in irld genes is important for natural variation in starvation resistance, I am less convinced by this data. (1) For the artificial deletion alleles of irld-57 and irld-11, functional differences in their protein activity or expression is not presented. How do the authors know that genetic variation among wild strains leads to functional differences in these proteins? Additionally, quantitative complementation (or a similar approach) was not performed to demonstrate that differences in their function exist between different wild strains. (2) For the putative lof allele in irld-39, no data is shown to demonstrate that this affects IRLD-39 activity. This 5bp deletion is also close to the 5' end of a nearby gene – could the deletion be affecting the expression of this other gene? (3) The deletion of irld-52 is probably the most convincing, however, again, no evidence supporting its role as a loss of function allele is presented beyond sequence analysis such as isolation of cDNAs. Was this entire region sequenced to verify its existence and its predicted effect in wild strains (i.e. are there other genetic variants that might suppress the frameshift nature of this deletion?).

The authors also often switch back and forth between assays, which also makes it difficult to interpret the importance of the natural genetic variants in the overall differences in wild strains. Sometimes linear models are used to analyze strains (slope and intercept), sometimes size during starvation is used, and sometimes recovery is used. Because the NILs were not used as controls for many of these experiments, it is impossible to compare the effect of the individual mutations to the effect of the locus that has been mapped. Do these lof alleles represent the majority of the effect of this locus, or is this a minor effect and other much more important alleles remain to be found.

1. Either additional analysis to make the claim that the differences in survival is a starvation response or changes to the text to discuss alternative possibilities.

2. Further analysis to demonstrate that the natural 5bp deletions cause functional differences in IRLD protein

3. Additional experiments or inclusion of existing data that allow the comparison of the effect size of the CRISP'ed strains to the appropriate NIL for comparison.

https://doi.org/10.7554/eLife.80204.sa1

Author response

[Editors’ note: the authors resubmitted a revised version of the paper for consideration. What follows is the authors’ response to the first round of review.]

Reviewer #1:

In this manuscript, the authors interrogate a large panel of wild C. elegans strains to identify natural genetic variants that influence starvation resistance. They use molecular inversion probe sequencing (MIP-Seq) to rapidly identify specific strains in a pool of wild strains that are resistant or sensitive to starvation. By taking advantage of the C. elegans Natural Diversity Resource, they perform genome-wide association studies to identify quantitative trait loci (QTL) that influence starvation resistance. They validate these QTLs by constructing near-isogenic lines. Detailed analysis of these QTLs reveals variants in irld genes that are shown to influence organismal growth after starvation recovery. irld genes are hypothesized to encode extracellular proteins that may bind to insulin-like growth factors. Based on functional analysis of variants in irld-39 and irld-52, the authors propose a model in which IRLD-39 and IRLD-52 influence starvation resistance by modulating signaling through the insulin receptor homolog DAF-2.

The major strength of this study is the identification of natural genetic variants that influence starvation resistance. The authors use a creative and powerful approach that in principle can be used in any organism to elucidate the genetic architecture of any phenotypic trait. This aspect of the manuscript will be of general interest.

Thank you for identifying the major strengths of our manuscript. We believe the revised manuscript makes those strengths more accessible by more clearly presenting the work.

In my opinion there are four major weaknesses of the manuscript. First, the authors use organismal length after recovery from starvation as a surrogate phenotype for starvation resistance. I am not convinced that this is justified, as the post-recovery organismal length of one of the starvation-sensitive strains identified in the study is not significantly different from that of the two most starvation-resistant strains identified (Figure 2F). Additionally, insufficient information and characterization of the irld-39/52 variants is provided. If these are non-coding variants, it would be premature to conclude that they affect irld-39/52 function without supporting data. The functional analysis of the irld-39 and irld-52 variants does not convincingly support the authors' model of IRLD-39/52 acting through the DAF-2 insulin-like pathway. Related to this point, no experiments are presented to test the possibility that these variants influence LET-23/EGFR signaling, although IRLD proteins are reported to have homology to EGF receptors as well as insulin receptors.

We agree that the four weaknesses highlighted warranted further explanation and/or experimentation. First, we have expanded our explanation of starvation resistance in the introduction. In brief, starvation resistance includes survival during starvation, recovery following starvation, and fecundity following starvation. We have used this more inclusive perspective on starvation resistance in multiple publications (Jobson et al. 2015; Hibshman et al. 2016; Webster et al. 2018; Jordan et al. 2019; Webster et al. 2019; Chen et al. 2022), and it has been described with extensive citations in a WormBook chapter on starvation (Baugh and Hu 2020). Our MIP-seq experimental design includes all three of these facets of starvation resistance, because a strain could be considered relatively starvation resistant even if it survives the same as another strain, as long as it recovers faster. This is now explained in the Results section. Our experiments to follow up on MIP-seq were thus designed to determine which aspect(s) of starvation resistance rendered a given strain more or less resistant in the MIP-seq experiment. We have added starvation survival results throughout, and in some cases we have also added data for early fecundity following starvation. In cases where we rely on only one of the three starvation-resistance assays we explain our rationale.

As pointed out by the reviewer, one of the sensitive strains recovered well (despite displaying reduced survival and early fecundity) suggesting this aspect of starvation resistance was not the driving force behind its sensitivity. There are documented cases of these phenotypes being coupled or de-coupled, some of which are now cited in the Introduction, but all are of importance.

Second, we have now further documented the exact irld variants investigated in the text and Figure 3. This information for all variants within the QTL is also still available as part of the supplementary data. We specifically chose variants that would affect the coding sequence of the gene. This is now made clear in Figure 3 and the Results section. We spell out the predicted effects of each variant on gene function, why we chose those variants for further investigation, and the rationale for our genome-editing strategy in each case.

Third, we have pulled back on our interpretation involving DAF-2/InsR. Our data show that irld function is dependent on DAF-16/FoxO in the context of starvation recovery, and DAF-16 localization is affected during starvation. However, we do not explicitly show involvement of DAF-2. We have softened our conclusions on this throughout, including the title, Abstract, sub-headers, figure titles, and Discussion. However, we speculate about IRLD function in the Discussion, putting forward the suggestion that IRLD proteins function in part through modification of insulin/IGF signaling, as originally proposed based on homology (Dlakic 2002). We believe the reader deserves to hear our thoughts on this, and this is the best model to account for our results. We recognize that we have not, for example, demonstrated that the IRLD proteins directly bind insulin-like peptides (ILPs). However, it is worth noting that none of the 40 C. elegans ILPs have been shown to actually bind the insulin/IGF receptor protein DAF-2. Furthermore, a similar model has been proposed and recently published in eLife regarding the truncated daf-2 isoform daf-2B, also without biochemical support (Martinez et al. 2020). We also do not think our hypothetical model is outlandish given a similar model for the function of IGF-binding proteins.

We also agree that LET-23/EGFR signaling could be involved, as hpa-1 and hpa-2 have been shown to interact with EGFR signaling. While we did not claim EGFR signaling was not involved, we agree that focusing on insulin/IGF signaling could leave the reader with the impression that it is the primary regulator. We now explicitly point out that EGF signaling could be modified by IRLD function, and we explicitly reference the hpa-1/hpa-2 paper in the Introduction and Discussion. However, it should be noted that EGF has not been investigated in the context of starvation or L1 arrest, unlike insulin/IGF signaling, and so it would be a significant undertaking to address this possibility, which we believe is beyond the scope of this manuscript.

1. Lines 100-102: What is the nature of the irld-39 and irld-52 variants? Are they intronic or exonic? If they are non-coding, then data is needed to show that they influence irld-39/52. Are they loss- or gain-of-function, and why? Why are they "high-impact"?

Thank you for this very important point. We have added an explanation of why both variants were chosen. Both are loss-of-function variants predicted to disrupt protein function. irld-39 disrupts the start codon, likely rendering the gene a null in starvation resistant strains. irld-52 contains a variant predicted to disrupt the fifth exon, which is likely loss-of-function, but it is unclear if it is a null. Figure 3 and the Results now spell out the nature of each variant.

2. Lines 108-109: Post-starvation length is a direct measure of growth in response to refeeding. Here it is being used as a surrogate measure of starvation recovery. How is "recovery" defined? One could use post-recovery survival as a measure of "recovery," but I can imagine that post-recovery fecundity might be a better measure of recovery from an evolutionary standpoint. If the authors are going to use organismal length as a surrogate phenotype, they need to show that this phenotype tracks with a more biologically relevant "recovery" phenotype. The data for NIC526 (Figures 2E-F) suggest that post-recovery length may not be a good indicator of starvation resistance.

Thank you for raising this very important point as well. We have now expanded our explanation of starvation resistance and rationale for the various assays used in the text. In particular, we note that the MIP-seq starvation resistance experiment incorporates aspects of survival, recovery, and fecundity in the design, so a given strain may be starvation resistant or sensitive due to any of these individual phenotypes. We believe this is the best proxy for fitness, which presumably has multiple parameters. As pointed out, NIC526 recovers relatively well following starvation, but does not survive well, suggesting that survival may drive its sensitivity in the MIP-seq assay. We have cited literature showing that these aspects of starvation resistance can be decoupled (though it is not uncommon that they are well correlated). Rather than delegitimize the use of starvation recovery as an assay, NIC526 further highlights the relevance of assaying multiple phenotypes. We agree that looking at early fecundity is also important, given relevance to fitness. We have now performed this experiment for key strains. We specifically performed early fecundity assays for DL238, EG4725, MY2147, and NIC526, which showed that DL238 and EG4725 are starvation resistant relative to MY2147 and NIC526. Because MY2147 is sensitive in all three assays, it was a strong candidate for use in NIL generation and genome editing. We also now show that irld-39(duk1); irld-52(duk17) exhibits increased fecundity following starvation compared to the N2 control. These results are critical in that they demonstrate that early fecundity is affected in the most resistant and sensitive strains identified as well as the double mutant we analyze in the N2 background.

3. Figures 3J-K and 4A-B: Starvation resistance assays should be performed on these strains (e.g. Figure 2E).

While we note that starvation recovery is a starvation-resistance assay, we have added starvation survival results for all of these strains as well. Survival results were not statistically significant, suggesting that the variants primarily affect starvation recovery. We have also added results from a power analysis so that we can state how large of an effect size would have been needed to have obtained statistical significance.

4. Figure 4C: The DAF-16 localization data are not convincing. The results show a modest difference, the biological significance of which is unclear. Was the experimenter blinded to the identity of the strain being observed? How was the 36-hour time point chosen, and why is this more biologically relevant than other time points?

We are sorry that this presentation was not more convincing. As another reviewer pointed out, the pictures made it difficult to tell the difference between different categories and were small. We have therefore generated new, enlarged images. We have also binarized the data to better represent the difference between the categories. While this assay alone does not show the biological significance of DAF-16 localization, the starvation resistance assay, showing that increased starvation resistance of worms with irld variants depends on DAF-16, suggests biological importance. DAF-16 is initially very nuclear during L1 starvation, and it moves back to the cytoplasm over time during starvation (Mata-Cabana et al. 2020). The 36-hour time point was chosen since it is intermediate in this dynamic process. This is now explained in the methods section.

5. Line 139: Based on the Methods section, it appears that the authors are using daf-2(e1370), which is a strong lof allele. I don't think this is the right allele to use in these studies; DAF-16 is so strongly activated in daf-2(e1370) compared to the modest effect of irld-39;irld-52 on DAF-16 localization (Figure 4C) that it could easily obscure subtler effects of irld-39/52 on gene expression, regardless of whether DAF-2 acts downstream of or parallel to IRLD-39/52.

Although we used daf-2(e1370) at 20ºC, rendering it not as strong of an allele, we have opted to remove this experiment since it is subject to various interpretations.

6. Line 146: The fact that DAF-16 target gene expression "reverses later in starvation" contradicts the authors' model. This observation warrants further experimentation.

Yes, this result does give one pause. But we actually don't believe that it contradicts our model, but instead that it is indicative of the complexity of insulin signaling dynamics in this multicellular system with agonists, antagonists, feedback, etc. However, we recognize that this ad hoc explanation is not satisfying, and we have opted to remove the gene expression analysis.

7. The key transcriptome experiments to test the authors' model are missing. They need to show that changes in gene expression caused by manipulation of irld-39 and irld-52 activity are DAF-16-dependent.

We agree that this is a very intriguing experiment, especially since we show that the increase in starvation resistance caused by disruption of irld-39 and irld-52 depends on daf-16. However, the irld double mutant did not cause statistically significant changes in the expression of individual genes, thus our previous analyses of daf-16 targets as a group and transcriptome-wide epistasis with daf-2, both of which we have removed. Without differentially expressed genes, we do not see a robust way to analyze such an RNA-seq epistasis analysis of daf-16 and irld-39; irld-52, and we therefore decided not to include it. By the way, it may be considered troubling that we report phenotypic effects of this double mutant with no differentially expressed genes detected. This is not the first time we have encountered this phenomenon (Webster et al. 2018). We believe there must be differences in gene expression, but that they are relatively small and in specific tissues, thus obscured by analyzing whole worms. We also believe this is a testament to the sensitivity of our phenotypic assays.

Reviewer #2 (Recommendations for the authors):

In this study, Webster et al. have aimed to identify the genetic factors that contribute to the differences between different wild C. elegans strains in terms of their resistance to starvation. The genomic sequences of hundreds of wild C. elegans strains have become recently available and this has given the opportunity to investigate the genetic determinants of the physiological differences between these wild populations that were isolated from different ecological niches. Here, the authors have subjected a mixture of wild C. elegans strains to long periods of starvation during early larval development and have utilized genomic sequencing to quantify the relative enrichment of each individual wild strain after exposure to starvation for different time intervals. Using the genomic sequencing strategy called MIP-Seq, they have identified two wild C. elegans strains that are overrepresented in the mixed population after extended starvation (implying higher starvation resistance compared to other wild strains) and they have also found two wild strains that are underrepresented after extended starvation (implying lower starvation resistance compared to other wild strains).

Using genome-wide association (GWA) analyses for parameters of starvation resistance, they have identified quantitative trait loci (QTL) associated with this phenotype. The genes enriched in these QTLs include multiple members of the insulin/EGF-receptor L domain (IRLD) gene family. The irld genes encode proteins that have extracellular ligand binding domains, but no receptor tyrosine kinase domains, and their function remains largely unknown. By introducing allelic variants for irld genes from the stress-resistant wild strains in the genetic background of the stress-sensitive strains using Crispr, the authors were able to improve the stress resistance of these sensitive strains, thus showing a direct role of irld genes in starvation resistance. Using epistasis experiments, they further demonstrate that irld genes might improve survival via interacting with insulin/IGF signaling in worms. Based on recently published neuronal single-cell RNA-seq data, the authors propose that irld genes function in specific sensory neurons to control starvation resistance in animals. How IRLD proteins modulate insulin signaling in a small subset of neurons to affect an organism-level phenotype and the underlying mechanism that likely involves interorgan signaling remain elusive.

There are several strengths of this study such as:

(1) The irld gene family has undergone large expansion in nematodes but their biological function remains mostly unknown. This study provides the first evidence for the role of this gene family in starvation resistance and thus indicating that the expansion of irld genes in nematodes might be a major contributing factor to the success of nematode species in colonizing a wide range of ecological niches.

(2) Through the innovative use of MIP-Seq, the authors have laid the foundation for a quantitative approach to measure differences in complex physiological traits in a mixed population of individuals that are genetically heterogenous. The same strategy can be useful for many other experimental paradigms such as studying the differences in resistance to physiological stressors, non-uniform effects of pharmacological compounds or variability in normal aging in genetically heterogenous wild populations.

(3) The irld mutants and the associated RNA-seq datasets generated in this study will be invaluable for C. elegans researchers to further investigate the potential roles of this understudied family of genes in regulating physiology, behavior and metabolism of animals.

Thank you for pointing out strengths of our study.

However, the claims made in this study have limitations and shortcomings that are primarily attributable to the use of some suboptimal experimental strategies, which are listed below:

(1) To identify genes in the QTL for starvation resistance, the authors have looked for enrichment of gene symbol prefixes. Though they have identified the irld genes, which they demonstrate to be functionally related to starvation resistance, this approach is suboptimal because gene symbol prefixes in C. elegans are not always representative of gene function, but instead they have historically represented the phenotype of the mutant (e.g. 'let' for lethal, 'eat' for abnormal eating, 'unc' for uncoordinated etc.). Hence not all genes with the same gene symbol prefix have related biological functions, neither do all genes of the same gene family have the same gene symbol prefix. Hence, it is likely that the authors have missed out on identifying all the gene families that are enriched in the QTL for starvation resistance.

Thank you for pointing this out. We agree that using gene prefixes is not the ideal approach. We thus performed a new analysis to replace this panel, the details of which are in the second paragraph of the ‘Enrichment analyses’ section. In brief, we used a fasta file of protein sequences of the whole genome as the background set, and a fasta file of protein sequences for the set of genes with variants in QTL to determine protein domain enrichments. We used the hmmscan program to search the Pfam database for protein domains from each set and then calculated a hypergeometric p-value of overlap to determine significance. The receptor L domain is significantly enriched, and this is the domain that defines irld genes.

(2) The central message of the paper is that the irld genes regulate starvation resistance. There are two key components of this phenotype: (a) survival during starvation, and (b) recovery from starvation. In their initial experimental strategy to validate the starvation resistance of wild strains identified from MIP-Seq, the authors have performed assays for both starvation survival (proportion of surviving worms at different time points of starvation) and starvation recovery (body length measurement post 48 hr of recovery from starvation). However, all their subsequent analyses involving irld gene manipulations and interactions with insulin signaling only utilized the body length measurement assay. Since body length measurement is only a measure of starvation recovery but not of starvation survival, it is not possible to conclude whether irld gene manipulations improve overall survival of animals during starvation. Hence, a key measure of starvation resistance is missing from the methodology that has been used here to study the effect of irld genes.

It is clear that this is a very important point, since it has been raised by multiple reviewers. Please see the above comments on this point. In brief, starvation survival as well as growth and fecundity following starvation are all important aspects of starvation resistance. A strain may be more or less resistant due to differences in any of these phenotypes, and though they are often correlated, there are also documented examples of them being decoupled. This is now explained in the Introduction. We have also made a point of explaining in the Results that our MIP-seq sample collection integrates effects on all three of these phenotypes, which we believe is the best proxy for fitness. And we explain that traditional assays in follow-up are used to assess the effect on each of these individual phenotypes. We have also added starvation survival and early fecundity data for key strains, rather than relying on growth alone.

(3) The claim that irld genes are predominantly expressed in sensory neurons is made using a dataset that did not have the expression profiles for non-neuronal tissues. Since tissues such as intestine, muscles and hypodermis have important roles in dictating organism-level phenotypes, it is essential to know whether the irld genes are expressed in these tissues. The tissue-restricted role of irld genes in starvation resistance that is proposed in the study can be addressed if the cell type-specific expression pattern of irld genes during normal and starvation conditions is known.

The reviewer is absolutely correct that the expression analysis included before was incomplete. We have extended this analysis to also include the Cao et al. (2017) single-cell RNA-seq data, which reports on all major tissues. These results show that the irld genes are predominantly expressed in sensory neurons, but that they are also expressed at lower levels in other tissues that could affect starvation resistance. We have been careful to explicitly point out that they are expressed in additional tissues.

This and other reviewer comments motivated us to use CRISPR to knock a reporter gene into the irld-39 and irld-52 loci to generate endogenous reporter genes for expression analysis. However, we were not able to visualize expression. We went one step further and generated high-copy transgenic arrays with a promoter::reporter fusions for irld-39 and irld-52, but again we were not able to detect expression. These results are disappointing, and the effort delayed submission, but we feel better knowing that at least we tried.

The reviewer also mentions irld expression in fed and starved conditions. We were able to look at this with our published whole-worm RNA-seq data, and we now show in Figure S6 that the irld genes are expressed at very low levels (barely or not detectable) and that about half of them are up-regulated during starvation. None of them are significantly down-regulated. We believe this observation is consistent with the effect of the irld genes examined on starvation resistance.

– Figure 3D: For this gene enrichment analysis, genes with the same symbol prefix were considered as part of the same gene family (line 362 in Methods). However, gene symbol prefixes in C. elegans are not always representative of gene function (e.g. let, eat, unc etc.). Hence, searching for enrichment of gene symbol prefixes might lead to misleading and incomplete results. For example, not all of the 283 genes with the 'nhr' gene symbol prefix (that the authors report in Figure 3D) belong to the NHR gene family. Many of these 'nhr' genes are pseudogenes (nhr-75, nhr-83, nhr-220 etc.) and many other genes with the 'nhr' symbol do not have the C4-zinc finger DNA binding domain that is a characteristic of members of the NHR gene family. Furthermore, not all members of the NHR gene family have 'nhr' gene symbol prefixes (e.g. daf-12, dpr-1, odr-7, unc-55 etc.). Instead of looking for enrichment of gene symbol prefixes, the authors should search for enrichment of specific protein domains (InterPro, Pfam etc.). This might reveal enrichment of genes belonging to other functional categories, in addition to the irld gene family identified here.

Thank you for this comment and thorough explanation. We have performed a new analysis using the Pfam database and removed the previous analysis as suggested. The receptor L domain (defining irld genes) was found to be enriched along with several other domains highlighted in Figure 3.

– Figures 3J, 3K, 4A, 4B: Measuring the body length of worms after 48 hr of recovery from starvation should not be the only parameter to quantify the starvation resistance of a particular genotype. The authors should also perform the standard starvation survival assays (similar to data shown in Figure 2E) for irld gene manipulations in N2 and MY2147 genetic backgrounds and also for the strains in which the interaction of irld genes with insulin signaling was investigated.

We now include starvation survival results for each of these strains to complement the starvation recovery analysis. We have also added early fecundity data for key strains.

– Line 152: That authors should clarify that irld gene expression is restricted to sensory neurons among neuron types. The single-cell RNA-seq dataset they have utilized here reports expression only among neuron classes, but not in non-neuronal tissues. Firstly, the authors should repeat this analysis with the unthresholded dataset from Taylor et al. and remake figures 4H and figure S6 using expression data from both neuronal and non-neuronal tissues. Since non-neuronal tissues such as the intestine, muscles and hypodermis likely have important roles in determining starvation resistance of the animals, it is crucial to look at the expression of irld genes in these non-neuronal tissues as well. Secondly, the single-cell RNA-seq strategy in Taylor et al. was primarily designed to identify gene expression in neurons. Hence, the gene expression data from non-neuronal tissues might have not detected medium or weak expression of genes in non-neuronal tissues. Since the authors make the claim that irld-39 and irld-52 function primarily in sensory neurons to affect starvation resistance (line 159), it would be prudent to make Crispr-based transcriptional GFP reporters for these two genes and validate whether their expression is indeed restricted to ASJ and ADL neurons, respectively. These reporters should also be used to demonstrate whether the expression of irld genes changes in these neurons during exposure to starvation. If no expression is detected in non-neuronal tissues, this would strengthen the argument that irld genes are expressed in an anatomically restricted manner only in specific sensory neurons, but they regulate starvation resistance at the organism level potentially via systemic signaling. This would signify presence of cell non-autonomous effects of irld genes, which can be investigated in future studies.

We agree that the analysis of single-cell RNA-seq data was not at all well-presented, and that we were remiss in not considering non-neuronal expression. We have incorporated analysis from Cao et al., 2017 to show that irld genes are typically expressed in sensory neurons, but they do indeed have expression in other cell types (Figure S7). We have also shown that irld genes are typically expressed at low levels in whole worms by re-analyzing our previously published data on fed and starved L1 larvae. irld genes are also up-regulated in starved L1s, which is now included (Figure S6). In addition to adding analysis from these two datasets, we spent several months generating new reporter strains but were unable to visualize expression, presumably because of low expression levels. Because the manuscript already includes a novel application of an innovative sequencing approach, identification of multiple specific variants, and determining causality of those variants, we view it as outside the scope of the manuscript to decisively determine site of action, though it is a very interesting question.

Reviewer #3 (Recommendations for the authors):

The authors make two major findings. First, they adapt MIP-seq to C. elegans, identifying primers that can identify individual strains and quantitate their relative proportion in group competition experiments. Second, they use this technique to map loci responsible for natural variation in starvation response, identifying irld family member genes that influence survival to starvation.

The development of MIP-seq is a major achievement. Other labs can use the primers that they develop to perform similar experiments, competing wild strains against each other in their assay of interest. Because the wild strains are already sequenced, GWAS can be performed without the cost of any sequencing, using available software that is provided by the authors. One potential issue with the adaptability of this approach is the potential for outcrossing during the competition phase. While this is not an issue for the starvation mapping they perform here, it will need to be addressed to make this technique generalizable. However, enthusiasm for this approach remains high; competition in large group settings provides a much better handle on fitness than more common assays.

Besides mapping and validating the loci that are responsible for variation in starvation response, they also identify causal mutations in irld genes. Using CRISPR-Cas9, they demonstrate a role for two natural mutations in starvation response and also implicate two additional irld genes as well. Use of CRISPR-Cas9 to specifically edit the genome are the gold standard for demonstrating a causal role for specific mutations. irld genes are homologous to insulin/EGF receptor proteins and this work implicates insulin signaling in starvation response. Additionally, they use classical genetics to implicate insulin signaling using epistasis experiments with the FOXO DAX-16 transcription factor. In general, starvation is poorly understood in humans and other species. This provides important evidence that insulin might be involved.

Thank you for highlighting the strengths of our study.

1. It is interesting that these genes are primarily expressed in sensory neurons. It is probably useful to use rescue experiments to show that this is the case.

We agree that it is very interesting that the irld genes, including irld-39 and irld-52, are primarily expressed in sensory neurons. In addition to Taylor et al. (2021), we have added analysis of two more previously published datasets (Webster et al., 2018 and Cao et al., 2017). In particular, these datasets show that irld genes are expressed at low levels in whole worms, are up-regulated in starvation, are primarily expressed in sensory neurons, and are expressed in a few other cell types as well. The Cao data provide single-cell resolution across all major tissue types, while the Taylor data provide very high resolution of different neuronal cell types in particular. We did make reporter strains (CRISPR knock-ins as well as high-copy transgenic promoter fusions), but we were unable to visualize expression of the irld genes, unfortunately. We also note that expression data alone does not confirm that the irld genes act in these tissues, and we agree that genetic analysis of the site of action is desirable. However, we have been working on this project for several years, having started with the development of the MIP-seq assay and associated liquid-culture protocols and gone all the way through GWA, generation and analysis of NILs, generation and analysis of CRISPR edits, and genetic analysis in N2. At this point the first author has been out of the lab for a year, other personnel have moved on, and we believe the best thing for the field would be get this work published.

2. Since the strains exists, some experiments on the CRISPR/Cas9 allelic-replacement strains in normal well-fed conditions would be useful. Do these strains have the same lifespan, store the same amount of fat, and eat the same amount of food during non-starvation conditions that could help explain why they survive longer?

These are interesting questions. Some experiments that we did as controls for starvation resistance do lend insight into how the alleles behave under well-fed conditions. irld-39(duk1); irld-52(duk17) worms exhibit a significant interaction between strain and starvation duration for recovery growth and early fecundity. While irld-39(duk1); irld-52(duk17) worms recover quicker and produce more progeny than N2 following a longer starvation period, they recover slightly more slowly and produce fewer progeny than N2 following only brief starvation (a duration typically used to synchronize worms). This suggests a trade-off between starvation resistance and growth rate under fed conditions. Further supporting this, we see a modest trade-off across all strains in the MIP-seq experiment between their starvation resistance trait value and their ability to recover after just a single day of starvation (Figure S4). However, we have not looked at lifespan, feeding behavior, fat storage, dauer formation, etc, and we believe it would fall outside the scope of this work. For variation in feeding or fat accumulation to affect starvation resistance would require intergenerational effects, since worms starved during L1 arrest have never been fed. Intergenerational effects on starvation resistance are possible, as we have shown (Hibshman et al. 2016; Jordan et al. 2019), but in this case we propose a more proximate mechanism involving modification of daf-16/FoxO activity, which we know directly regulates starvation resistance.

3. There is little discussion about the generalizability of this work to other species. What is known or thought about variation in insulin pathways and starvation? Are there specific example in other species? How does this affect how we think about starvation and natural variation in starvation in humans and other species?

Thank you for this suggestion. We have significantly expanded the Introduction and Discussion sections. We cite papers on the importance of insulin/IGF signaling to starvation resistance in C. elegans and the importance of insulin signaling in starvation resistance and metabolic syndrome in mammals. Though the irld gene family is not conserved outside of the genus, we suggest that it provides an example of how expansion or contraction of a gene family can influence adaptation by modifying the activity of an essential, conserved signaling pathway. We also draw a parallel between irld gene function and IGF-binding proteins, and we specifically suggest that variation in that family may influence phenotypic variation in humans and other vertebrates.

References:

Baugh, L. R., and P. J. Hu, 2020 Starvation Responses Throughout the Caenorhabditis elegans Life Cycle. Genetics 216: 837-878.

Chen, J., L. Y. Tang, M. E. Powell, J. M. Jordan and L. R. Baugh, 2022 Genetic analysis of daf-18/PTEN missense mutants for starvation resistance and developmental regulation during Caenorhabditis elegans L1 arrest. G3 (Bethesda).

Dlakic, M., 2002 A new family of putative insulin receptor-like proteins in C. elegans. Curr Biol 12: R155-157.

Hibshman, J. D., A. Hung and L. R. Baugh, 2016 Maternal Diet and Insulin-Like Signaling Control Intergenerational Plasticity of Progeny Size and Starvation Resistance. PLoS Genet 12: e1006396.

Jobson, M. A., J. M. Jordan, M. A. Sandrof, J. D. Hibshman, A. L. Lennox et al., 2015 Transgenerational Effects of Early Life Starvation on Growth, Reproduction, and Stress Resistance in Caenorhabditis elegans. Genetics 201: 201-212.

Jordan, J. M., J. D. Hibshman, A. K. Webster, R. E. W. Kaplan, A. Leinroth et al., 2019 Insulin/IGF Signaling and Vitellogenin Provisioning Mediate Intergenerational Adaptation to Nutrient Stress. Curr Biol 29: 2380-2388 e2385.

Martinez, B. A., P. Reis Rodrigues, R. M. Nunez Medina, P. Mondal, N. J. Harrison et al., 2020 An alternatively spliced, non-signaling insulin receptor modulates insulin sensitivity via insulin peptide sequestration in C. elegans. ELife 9.

Mata-Cabana, A., L. Gomez-Delgado, F. J. Romero-Exposito, M. J. Rodriguez-Palero, M. Artal-Sanz et al., 2020 Social Chemical Communication Determines Recovery From L1 Arrest via DAF-16 Activation. Front Cell Dev Biol 8: 588686.

Webster, A. K., A. Hung, B. T. Moore, R. Guzman, J. M. Jordan et al., 2019 Population Selection and Sequencing of Caenorhabditis elegans Wild Isolates Identifies a Region on Chromosome III Affecting Starvation Resistance. G3 (Bethesda) 9: 3477-3488.

Webster, A. K., J. M. Jordan, J. D. Hibshman, R. Chitrakar and L. R. Baugh, 2018 Transgenerational Effects of Extended Dauer Diapause on Starvation Survival and Gene Expression Plasticity in Caenorhabditis elegans. Genetics 210: 263-274.

[Editors’ note: what follows is the authors’ response to the second round of review.]

The manuscript has been improved but there are some remaining issues that need to be addressed, as outlined below:

The reviewers have discussed their reviews with one another quite extensively. As you can see from their initial set of comments below, there still remains a substantial concern among all reviewers about whether and to what extent irld genes are involved in the starvation response. However, all reviewers have appreciated your creative new use of the MIP-Seq technology which we all expect to be quite impactful for further studies in C. elegans. We recommend that you (a) shorten the paper to a Report format, and (b) focus the paper on the technology aspect and provide the irld genes as an application. The present abstract of your paper organizationally already hints toward such a format, but this strategy should be implemented for the rest of the paper as well (including the Introduction). Also, as indicated by all of the reviewer's comments, please revise the manuscript editorially to consider alternative explanations of your data since, as you can see, the reviewers remain unconvinced that irld genes have been strongly implicated in this phenomenon.

Thank you for reviewing our revised manuscript and for providing guidance in how best to further revise it. We have substantially shortened the main text of our manuscript to better fit the Short Report format. We now emphasize the MIP-seq methodology, which was recognized as broadly useful to the community. In addition, we have added caveats and alternative interpretations throughout. In particular, we agree with the reviewers that while irld genes play a role in starvation recovery in the N2 and MY2147 backgrounds, they do not explain the phenotypic variation captured by the NILs, and it is likely that other genes within the QTL are involved. Below, we highlight the specific changes we made to the manuscript in response to reviewer comments. Our responses are in blue.

Reviewer #1:

In the revised format, the manuscript is coherent and concise. This study has used MIP-seq to identify that genetic variation in the irld gene family determines some aspects of starvation resistance in wild worm isolates. However, the manuscript lacks any evidence regarding the mechanism and site of action of irld genes except the finding that one of the three phenotypes is DAF-16-dependent. Given the limited depth and breadth of this study, it is more suitable for the Short Reports format rather than the Research Article format.

Thank you for recognizing the strengths of our revised manuscript, especially with regard to MIP-seq and identification of the irld gene family as impacting aspects of starvation resistance. We recognize that we have not provided experimental evidence in support of mechanism or site of action, and we appreciate the suggestion to instead publish the manuscript as a Short Report.

Regarding the response to major comment #2 (Reviewer 2), the authors have not measured the starvation resistance of the irld-39; irld-52 double mutant in the MY2147 background. They quantified these phenotypes only in the N2 background, where the effects are either modest or not significant. Since single mutant manipulations produce much stronger phenotypes in the MY2147 background compared to N2 (Figure 3K), it is likely that the double mutant might display a robust increase in starvation resistance in the stress-sensitive MY2147 background. This experiment, though not essential, will greatly increase the impact of the study and will indicate that simultaneous manipulation of only a handful of irld genes can completely ameliorate the high stress-sensitivity in a wild strain.

Thank you for making this suggestion. It is an interesting experiment, but we suspect that the trait is sufficiently polygenic such that even this double mutant would not account for the phenotypic variation seen among the NILs. Since this experiment is not essential, we chose to focus on the guidance provided in the decision letter for how to revise the manuscript.

Reviewer #2:

I appreciate the efforts that the authors have undertaken to address my critique of the initial submission, and I also commend them for their transparency about their results. However, I remain unconvinced about two of the authors' claims: that the irld variants they focus on account for the differences in starvation resistance observed in wild strains, and that irld-39/52 act through DAF-16 to modulate starvation resistance.

Thank you for recognizing the effort we put into revising the manuscript and for commending us for transparency. It was never our intention to imply that the irld variants investigated account for the full extent of the differences seen in wild strains or NILs, and we regret it if we inadvertently implied this. We now make it clear that we do not believe they do so, but we do think that they likely contribute to phenotypic variation (with caveats, discussed below). As for acting through DAF-16, we present the results of a standard epistasis analysis which suggests that the effect of the irld-39; irld-52 double mutant depends on daf-16. We recognize that additional lines of evidence to further support this conclusion would be desirable, and that is why we included DAF-16 nuclear localization. While this result is subject to interpretation, it is nonetheless consistent with altered DAF-16 activity, and we clearly indicate its limitations (see below).

1. Figures 3I/J: this data shows that the irld edited strains do not confer improved starvation survival on the sensitive MY2147 background. While the authors offer the interpretation that "…the variants primarily affect starvation recovery," another more parsimonious explanation would be that these variants are not the key functional variants within the QTLs identified using MIP-seq.

We completely agree that these variants do not fully account for the phenotypic variation associated with the QTLs. The effect sizes are indicated in microns on each figure panel, allowing the reader to directly compare results (eg, NILs and irld variants). We also believe it should be made clear that only certain aspects of starvation resistance are affected. We have revised our conclusion accordingly (lines 211-214): "These results show that multiple types of variants in different irld family members reduce the effect of extended L1 starvation on recovery, suggesting four individual genes from this family affect this aspect of starvation resistance in wild strains. Notably, none of the engineered variants affected the trait to a similar extent as the NILs, suggesting that other variants within each QTL also affect the trait."

We also make this point in the Discussion (lines 267-269): "However, irld variants investigated each had relatively weak phenotypic effects compared to the NILs, suggesting they do not fully account for natural variation in the trait associated with the QTLs. This implies other variants (Supplementary File 2), possibly of larger effect, also contribute to phenotypic variation." And we cite Supplementary File 2 where additional candidates are catalogued.

2. The authors mention that "…the irld double mutant did not cause statistically significant changes in the expression of individual genes." Their explanation for this observation is that "We believe there must be differences in gene expression, but that they are relatively small and in specific tissues, thus obscured by analyzing whole worms. We also believe this is a testament to the sensitivity of our phenotypic assays." To me, the most parsimonious explanation for the observation that DAF-16 target gene expression is not influenced by irld-39/52 mutation is that the small increase in DAF-16 nuclear localization observed is not functionally significant. Moreover, while their phenotypic assays may be sensitive, the other more straightforward (IMO) explanation is that their phenotypic assays are capturing effects of other variants within the identified QTLs that are distinct from the irld variants that the authors have chosen to focus on.

We certainly agree that there are likely other important variants affecting the trait, as we now make clear, but we chose to focus on the irld genes because of their novelty, potential influence on insulin/IGF signaling, and impact on starvation recovery. As for DAF-16 localization, we accept that we show a relatively small effect. But the phenotypic effects of the irld genes are also of small effect, so we don't think this is surprising. Though difficult to study, we believe that small effects are important, especially in trying to understanding the genetic basis of polygenic traits. From a probabilistic perspective, any additional time DAF-16 spends in the nucleus provides additional opportunities for it to interact with DNA and affect transcription, with cumulative impact, and there is no reason to think that small differences in gene expression don't have phenotypic consequences, even if our assays don't have the power to detect those differences in expression. It is also important to note that we assayed DAF-16 localization in the intestine, which is typical given the relatively large size of these cells. The intestine is an important site of daf-16 action for starvation resistance, but it is not the only site of action (eg, the nervous system is also important), and it is unclear if it is the most salient site in this context. We now state these limitations of the DAF-16 localization results (lines 238-239): "However, this is a relatively modest difference in nuclear localization, and it is unclear where in the animal DAF-16 activity is most relevant in this context." Despite the limitations of this assay, we believe it is valuable in that it complements the results of genetic epistasis.

3. The QTLs identified by the authors range from >600kb to >2.2Mb by my estimate. How many polymorphisms lie within these intervals? I understand the interest in the irld gene family, but the data do not convince me that the irld variants in question are the key functional variants within these intervals.

Yes, these are excellent points that we now make clearly in the manuscript. It was not our intention to claim that the irld genes are the key functional variants in the QTL, but rather that they are examples of functional variants within these intervals that affect this polygenic trait, and they are of broad interest because they are almost completely uncharacterized and potentially modify insulin/IGF signaling. To ensure that we do not leave readers with the wrong impression, we have revised the text in multiple places to explicitly indicate that other variants are likely involved. All variants are listed in Supplemental Data 2, and enrichment analyses in Figure 3 clearly indicate large numbers of genes in other gene families that contain variants. We now state on lines 164-165 that "These QTL are relatively large, ranging from 0.7 to 2.2 Mb, and include many candidate variants (Supplementary File 2) across 867 genes."

Reviewer #3:

The authors utilize a standard starvation assay to study natural variation in starvation response among wild strains of C. elegans. Taking advantage of the CeNDR database, the authors compete ~100 wild strains against each other and quantify the changes in population using MIP-seq. The authors quite convincingly show that differences in survival occur among the wild strains and use GWAS to non-biasedly identify regions of the genome that are associated with differences in survival in this paradigm (QTLs). Technically this is quite challenging, and the identification of the QTLs was verified nicely using near isogenic lines.

Thank you for recognizing the strengths of our manuscript.

Throughout the paper, the authors describe the differences in survival in these conditions as starvation resistance. However, additional factors could be at play, such as differential susceptibility to toxins or pheromones that could build up during the multiday experiment.

We appreciate the concern, recognizing that factors in addition to starvation may affect survival in our assays. However, it is standard in the field to interpret differences in survival in these starvation conditions as differences in starvation resistance, and we assert that this is the simplest interpretation. Population density influences survival as well, and we carefully control density so that it is not a confounder. Temperature, maternal age, and maternal diet can also influence survival, and we carefully control each of these factors as well, as described in Materials and methods.

By analyzing the QTLs, the authors identified a family of genes, irlds, which were enriched within these regions. These genes are upregulated by starvation and have homology to insulin-type receptors. The authors propose that natural variation in these genes is important for natural variation in starvation response. Two demonstrate this, the authors identify two irld genes that carry likely loss of function deletions and use CRISPR/Cas9 to engineer these mutations into other genetic backgrounds. Additionally, the authors' engineer deletion alleles (that do not mimic segregating alleles) in two additional irld genes.

Using these alleles, the authors convincingly show that irld genes play a role in this starvation assay, demonstrating differences in growth during and after exit from starvation. This result is likely to be exciting to researchers interested in starvation, as insulin signaling is an important genetic pathway in a large number of organisms.

Thank you for summarizing our findings. We appreciate your recognition that differences in growth and reproductive success after starvation reflect a role in the starvation response. We also agree that the starvation and aging fields should be excited to learn about the irld genes in this context.

While the authors also interpret their data to conclude that natural genetic variation in irld genes is important for natural variation in starvation resistance, I am less convinced by this data.

Thank you for raising these concerns. We appreciate this critique and now address each of these points in revision.

1) For the artificial deletion alleles of irld-57 and irld-11, functional differences in their protein activity or expression is not presented. How do the authors know that genetic variation among wild strains leads to functional differences in these proteins? Additionally, quantitative complementation (or a similar approach) was not performed to demonstrate that differences in their function exist between different wild strains.

The reviewer is correct that we have not shown functional differences in protein expression or activity for these genes in the relevant wild strains. Instead, this is presumed given a large number of variants in each gene predicted to disrupt protein function. We sidestepped this uncertainty by engineering deletion alleles, making their functional effect certain, but how well they serve as surrogates for the wild variants is unclear. We now make these points clear on lines 193-195: "Given several variants predicted to disrupt protein function in each, we believe irld-11 and irld-57 are null in the hyper-divergent context, though this has not been functionally demonstrated." And also on lines 202-205: "Since irld-11 and irld-57 contain so many candidate variants, we deleted these genes in MY2147 and N2, rendering them null at each locus (Figure 3H). Edits of irld-39 and irld-52 are more likely to approximate the effect of specific variants in the wild, because they are the exact variants present in starvation-resistant wild strains."

2) For the putative lof allele in irld-39, no data is shown to demonstrate that this affects IRLD-39 activity. This 5bp deletion is also close to the 5' end of a nearby gene – could the deletion be affecting the expression of this other gene?

The reviewer is correct again about these alternative possibilities. We agree that it is best to be clear about the limitations of the data presented. We now state on lines 179-182, "the variant is predicted to disrupt the start codon of the gene (Figure 3E, F, Supplementary File 2), likely rendering irld-39 a functional null in the starvation-resistant strain DL238. However, this was not functionally validated, and it is possible that this variant affects expression of the neighboring irld gene, hpa-1."

3) The deletion of irld-52 is probably the most convincing, however, again, no evidence supporting its role as a loss of function allele is presented beyond sequence analysis such as isolation of cDNAs. Was this entire region sequenced to verify its existence and its predicted effect in wild strains (i.e. are there other genetic variants that might suppress the frameshift nature of this deletion?).

This point is also well taken, and we now state on lines 183-185 that irld-52 "contains a variant associated with starvation resistance predicted to disrupt its fifth exon with a frameshift (Figure 3E, F), though this was not functionally validated and it is unclear if the variant causes a null mutation." We used the stringent version of the VCF file to identify variants, and we are not aware of any other variants that may suppress the frameshift.

We do not think it is sufficient to simply provide these caveats in the Results section, so we also incorporated them into the Discussion on lines 258-262: "we validated three QTL and showed four irld genes in these QTL impact starvation recovery. For irld-11 and irld-57, we generated deletion mutants, which do not precisely match the variants present in wild strains. For irld-39 and irld-52, the engineered alleles match starvation-resistant strains, but we have not confirmed their loss of function. Thus, our results suggest, but do not definitively demonstrate, that variation in irld genes affects starvation resistance in this species."

The authors also often switch back and forth between assays, which also makes it difficult to interpret the importance of the natural genetic variants in the overall differences in wild strains. Sometimes linear models are used to analyze strains (slope and intercept), sometimes size during starvation is used, and sometimes recovery is used.

We regret that it is complicated, but we believe that it is appropriate to break starvation resistance down into component phenotypes. We explain our rationale in the Introduction (more concisely in this version, but with references, including to a discussion of this issue in WormBook chapter), and we also touch on it in the Results section, so that the reader understands why multiple assays are reported. However, please note that we report starvation recovery (measured as length after 48 hours of recovery from brief or extended starvation), consistently throughout the manuscript, including in Figures 2F, 3K-L, 4B-D, and Figure 3—figure supplement 1C-D. In each case, the analysis is done using a linear mixed-effects model, which includes strain and days of starvation as fixed effects and biological replicate as a random effect. This was our primary assay, and upon revision we added in starvation survival data (we did not measure size during starvation) and fecundity data following starvation when relevant. It is of course difficult to compare these results to the MIP-seq assay (in which one trait value is the slope of a linear model), which is fundamentally different as a competition assay.

Because the NILs were not used as controls for many of these experiments, it is impossible to compare the effect of the individual mutations to the effect of the locus that has been mapped. Do these lof alleles represent the majority of the effect of this locus, or is this a minor effect and other much more important alleles remain to be found.

Thank you for bringing up this important point. You'll see in our response to Reviewer #2 above that we certainly do not believe that the irld variants identified represent the majority of the effect of these QTL, and this point is made explicit in the Results and Discussion.

We also originally wanted to directly compare variants and NILs to enable quantitative accounting of effect sizes. However, this is challenging, since not all of the associated variants are found in a given pair of strains, and a NIL of the appropriate background is not available for each comparison given known genetic incompatibilities we had to work around to generate NILs. Given these complications, our primary intent of genome editing was to identify variants that affect the trait, rather than accounting for the phenotypic variation associated with the QTL. We view the NILs and CRISPR-generated strains as complementary approaches; that is, the NILs show that the QTL underlie differences in starvation resistance between an appropriate pair of strains that differ for starvation resistance and for key variants within the QTL, while the CRISPR-generated strains show that specific genes within QTL with variants associated with starvation resistance impact the trait.

1. Either additional analysis to make the claim that the differences in survival is a starvation response or changes to the text to discuss alternative possibilities.

We believe this is in reference to the above comment about survival during starvation possibly reflecting the effect of environmental factors other than starvation itself, which we responded to above. In the interest of space, we do not agree that it is appropriate to discuss such alternative possibilities.

2. Further analysis to demonstrate that the natural 5bp deletions cause functional differences in IRLD protein

This is an important caveat that we now state explicitly on lines 179-182, "the variant is predicted to disrupt the start codon of the gene (Figure 3E, F, Supplementary File 2), likely rendering irld-39 a functional null in the starvation-resistant strain DL238. However, this was not functionally validated, and it is possible that this variant affects expression of the neighboring irld gene, hpa-1." We chose to follow the guidance in the Editors' decision letter for revision rather than perform additional experiments to resolve this point.

3. Additional experiments or inclusion of existing data that allow the comparison of the effect size of the CRISP'ed strains to the appropriate NIL for comparison.

We agree that there are some instances in which a comparison to a NIL would have been possible, but there are a number of cases in which there is not an appropriate NIL for comparison, as stated above. The NILs and CRISPR edits serve complementary purposes and were not generated with the intent of being directly compared. However, we provide effect sizes on each figure panel, allowing the reader to clearly see that the effects of the irld variants are smaller than those of the NILs or wild strains. We also explicitly state in the Results and Discussion that the irld variants do not fully account for the phenotypic variation associated with the QTL or observed with the NILs.

https://doi.org/10.7554/eLife.80204.sa2

Article and author information

Author details

  1. Amy K Webster

    Department of Biology, Duke University, Durham, United States
    Present address
    Institute of Ecology and Evolution, University of Oregon, Eugene, United States
    Contribution
    Data curation, Formal analysis, Investigation, Methodology, Supervision, Validation, Visualization, Writing – original draft, Writing – review and editing
    Competing interests
    No competing interests declared
    ORCID icon "This ORCID iD identifies the author of this article:" 0000-0003-4302-8102
  2. Rojin Chitrakar

    Department of Biology, Duke University, Durham, United States
    Contribution
    Data curation, Investigation, Methodology
    Competing interests
    No competing interests declared
  3. Maya Powell

    Department of Biology, Duke University, Durham, United States
    Present address
    Environment, Ecology, and Energy Program, University of North Carolina, Chapel Hill, United States
    Contribution
    Investigation, Validation
    Competing interests
    No competing interests declared
  4. Jingxian Chen

    Department of Biology, Duke University, Durham, United States
    Contribution
    Data curation, Formal analysis
    Competing interests
    No competing interests declared
  5. Kinsey Fisher

    Department of Biology, Duke University, Durham, United States
    Contribution
    Validation
    Competing interests
    No competing interests declared
  6. Robyn E Tanny

    Department of Molecular Biosciences, Northwestern University, Evanston, United States
    Contribution
    Resources
    Competing interests
    No competing interests declared
  7. Lewis Stevens

    Department of Molecular Biosciences, Northwestern University, Evanston, United States
    Present address
    Tree of Life, Wellcome Sanger Institute, Cambridge, United States
    Contribution
    Formal analysis
    Competing interests
    No competing interests declared
  8. Kathryn Evans

    Department of Molecular Biosciences, Northwestern University, Evanston, United States
    Contribution
    Formal analysis
    Competing interests
    No competing interests declared
  9. Angela Wei

    Department of Biology, Duke University, Durham, United States
    Contribution
    Validation
    Competing interests
    No competing interests declared
  10. Igor Antoshechkin

    Division of Biology, California Institute of Technology, Pasadena, United States
    Contribution
    Data curation, Formal analysis, Investigation, Methodology, Software
    Competing interests
    No competing interests declared
  11. Erik C Andersen

    Department of Molecular Biosciences, Northwestern University, Evanston, United States
    Contribution
    Funding acquisition, Resources, Software, Writing – review and editing
    Competing interests
    No competing interests declared
    ORCID icon "This ORCID iD identifies the author of this article:" 0000-0003-0229-9651
  12. L Ryan Baugh

    1. Department of Biology, Duke University, Durham, United States
    2. Center for Genomic and Computational Biology, Duke University, Durham, United States
    Contribution
    Conceptualization, Funding acquisition, Project administration, Resources, Supervision, Writing – original draft, Writing – review and editing
    For correspondence
    ryan.baugh@duke.edu
    Competing interests
    No competing interests declared
    ORCID icon "This ORCID iD identifies the author of this article:" 0000-0003-2148-5492

Funding

National Institute of General Medical Sciences (R01GM117408)

  • L Ryan Baugh

National Institute of General Medical Sciences (R01GM143159)

  • L Ryan Baugh

National Institute of Environmental Health Sciences (R01ES029930)

  • Erik C Andersen
  • L Ryan Baugh

The funders had no role in study design, data collection and interpretation, or the decision to submit the work for publication.

Acknowledgements

We thank Oliver Hobert for providing OH16024 daf-16(ot971[daf-16::GFP]), Jon Hibshman for sharing a starvation survival curve-fitting script, Chelsea Shoben for help passaging wild isolates, Clay Dilks for CRISPR advice, Sophia Gomez for genotyping assistance, Seth Taylor for strain organization and maintenance, and Jim Jordan for helpful discussions. Funding was provided by the NIH (R01GM117408 and R01GM143159 to LRB and R01ES029930 to ECA and LRB). AKW was supported by an NSF Graduate Research Fellowship. Some strains were provided by the CGC, which is funded by NIH Office of Research Infrastructure Programs (P40 OD010440). We would also like to thank WormBase.

Senior Editor

  1. David E James, The University of Sydney, Australia

Reviewing Editor

  1. Oliver Hobert, Columbia University, Howard Hughes Medical Institute, United States

Reviewer

  1. Patrick McGrath, Georgia Institute of Technology, Atlanta, United States

Version history

  1. Received: May 11, 2022
  2. Accepted: June 20, 2022
  3. Accepted Manuscript published: June 21, 2022 (version 1)
  4. Version of Record published: July 7, 2022 (version 2)

Copyright

© 2022, Webster et al.

This article is distributed under the terms of the Creative Commons Attribution License, which permits unrestricted use and redistribution provided that the original author and source are credited.

Metrics

  • 1,218
    Page views
  • 315
    Downloads
  • 3
    Citations

Article citation count generated by polling the highest count across the following sources: PubMed Central, Crossref, Scopus.

Download links

A two-part list of links to download the article, or parts of the article, in various formats.

Downloads (link to download the article as PDF)

Open citations (links to open the citations from this article in various online reference manager services)

Cite this article (links to download the citations from this article in formats compatible with various reference manager tools)

  1. Amy K Webster
  2. Rojin Chitrakar
  3. Maya Powell
  4. Jingxian Chen
  5. Kinsey Fisher
  6. Robyn E Tanny
  7. Lewis Stevens
  8. Kathryn Evans
  9. Angela Wei
  10. Igor Antoshechkin
  11. Erik C Andersen
  12. L Ryan Baugh
(2022)
Using population selection and sequencing to characterize natural variation of starvation resistance in Caenorhabditis elegans
eLife 11:e80204.
https://doi.org/10.7554/eLife.80204

Further reading

    1. Chromosomes and Gene Expression
    2. Developmental Biology
    Virginia L Pimmett, Mounia Lagha
    Insight

    Imaging experiments reveal the complex and dynamic nature of the transcriptional hubs associated with Notch signaling.

    1. Cell Biology
    2. Developmental Biology
    Simon Schneider, Andjela Kovacevic ... Hubert Schorle
    Research Article

    Cylicins are testis-specific proteins, which are exclusively expressed during spermiogenesis. In mice and humans, two Cylicins, the gonosomal X-linked Cylicin 1 (Cylc1/CYLC1) and the autosomal Cylicin 2 (Cylc2/CYLC2) genes, have been identified. Cylicins are cytoskeletal proteins with an overall positive charge due to lysine-rich repeats. While Cylicins have been localized in the acrosomal region of round spermatids, they resemble a major component of the calyx within the perinuclear theca at the posterior part of mature sperm nuclei. However, the role of Cylicins during spermiogenesis has not yet been investigated. Here, we applied CRISPR/Cas9-mediated gene editing in zygotes to establish Cylc1- and Cylc2-deficient mouse lines as a model to study the function of these proteins. Cylc1 deficiency resulted in male subfertility, whereas Cylc2-/-, Cylc1-/yCylc2+/-, and Cylc1-/yCylc2-/- males were infertile. Phenotypical characterization revealed that loss of Cylicins prevents proper calyx assembly during spermiogenesis. This results in decreased epididymal sperm counts, impaired shedding of excess cytoplasm, and severe structural malformations, ultimately resulting in impaired sperm motility. Furthermore, exome sequencing identified an infertile man with a hemizygous variant in CYLC1 and a heterozygous variant in CYLC2, displaying morphological abnormalities of the sperm including the absence of the acrosome. Thus, our study highlights the relevance and importance of Cylicins for spermiogenic remodeling and male fertility in human and mouse, and provides the basis for further studies on unraveling the complex molecular interactions between perinuclear theca proteins required during spermiogenesis.