Discovery of a new class of reversible TEA domain transcription factor inhibitors with a novel binding mode
- Cutaneous Biology Research Center, Massachusetts General Hospital, Harvard Medical School, United States
- Departments of Pharmacology & Biophysics, University of Texas Southwestern Medical Center, United States
- Department of Molecular, Cell and Cancer Biology, University of Massachusetts Medical School, United States
Figures
Figure 1 with 2 supplements
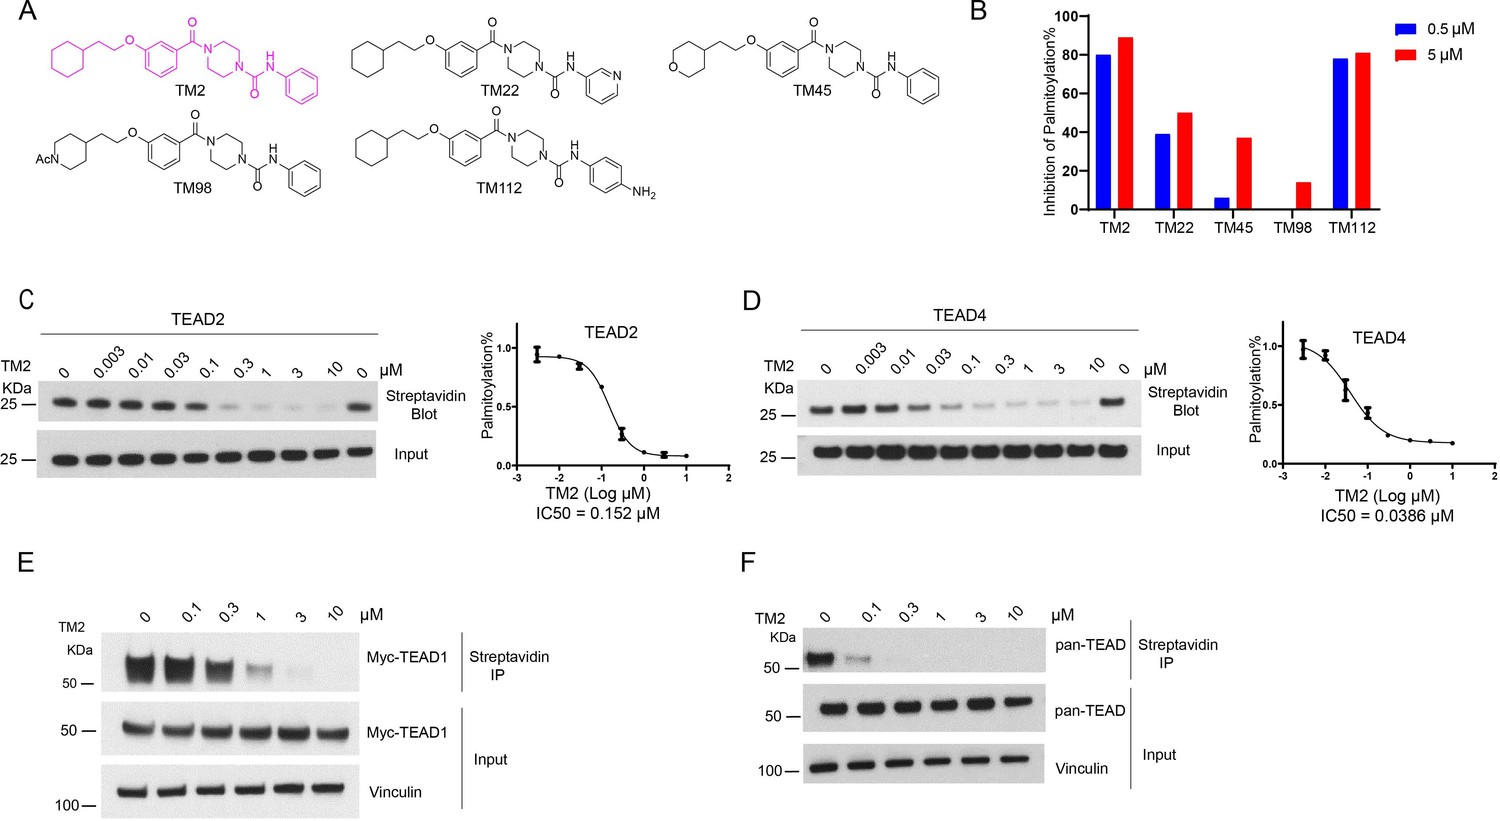
Identification of TM2 and analogs as novel TEA domain (TEAD) auto-palmitoylation inhibitors.
(A) Representative chemical structures of a novel class of TEAD inhibitors with 4-(3-(2-cyclohexylethoxy)benzoyl)-piperazine-1-carboxamide moiety. TM2 structure is highlighted in magenta. (B) Inhibition of TEAD2 auto-palmitoylation with treatment of TM2 under 0.05 and 0.5 μM for 30 min, respectively. IC50 values for TM2 inhibition of TEAD2 (C) and TEAD4 (D) auto-palmitoylation were characterized by Western blot analysis (left) and quantified by ImageJ (right). The data was determined by independent replicates (n = 3) and shown as mean ± SEM. Palmitoylation of Myc-TEAD1 (E) and endogenous pan-TEAD (F) was analyzed by chemical reporter and streptavidin pulldown assay with treatment of TM2 at indicated concentrations for 24 h.
-
Figure 1—source data 1
Source data for Figure 1C–F.
- https://cdn.elifesciences.org/articles/80210/elife-80210-fig1-data1-v2.zip
Figure 1—figure supplement 1
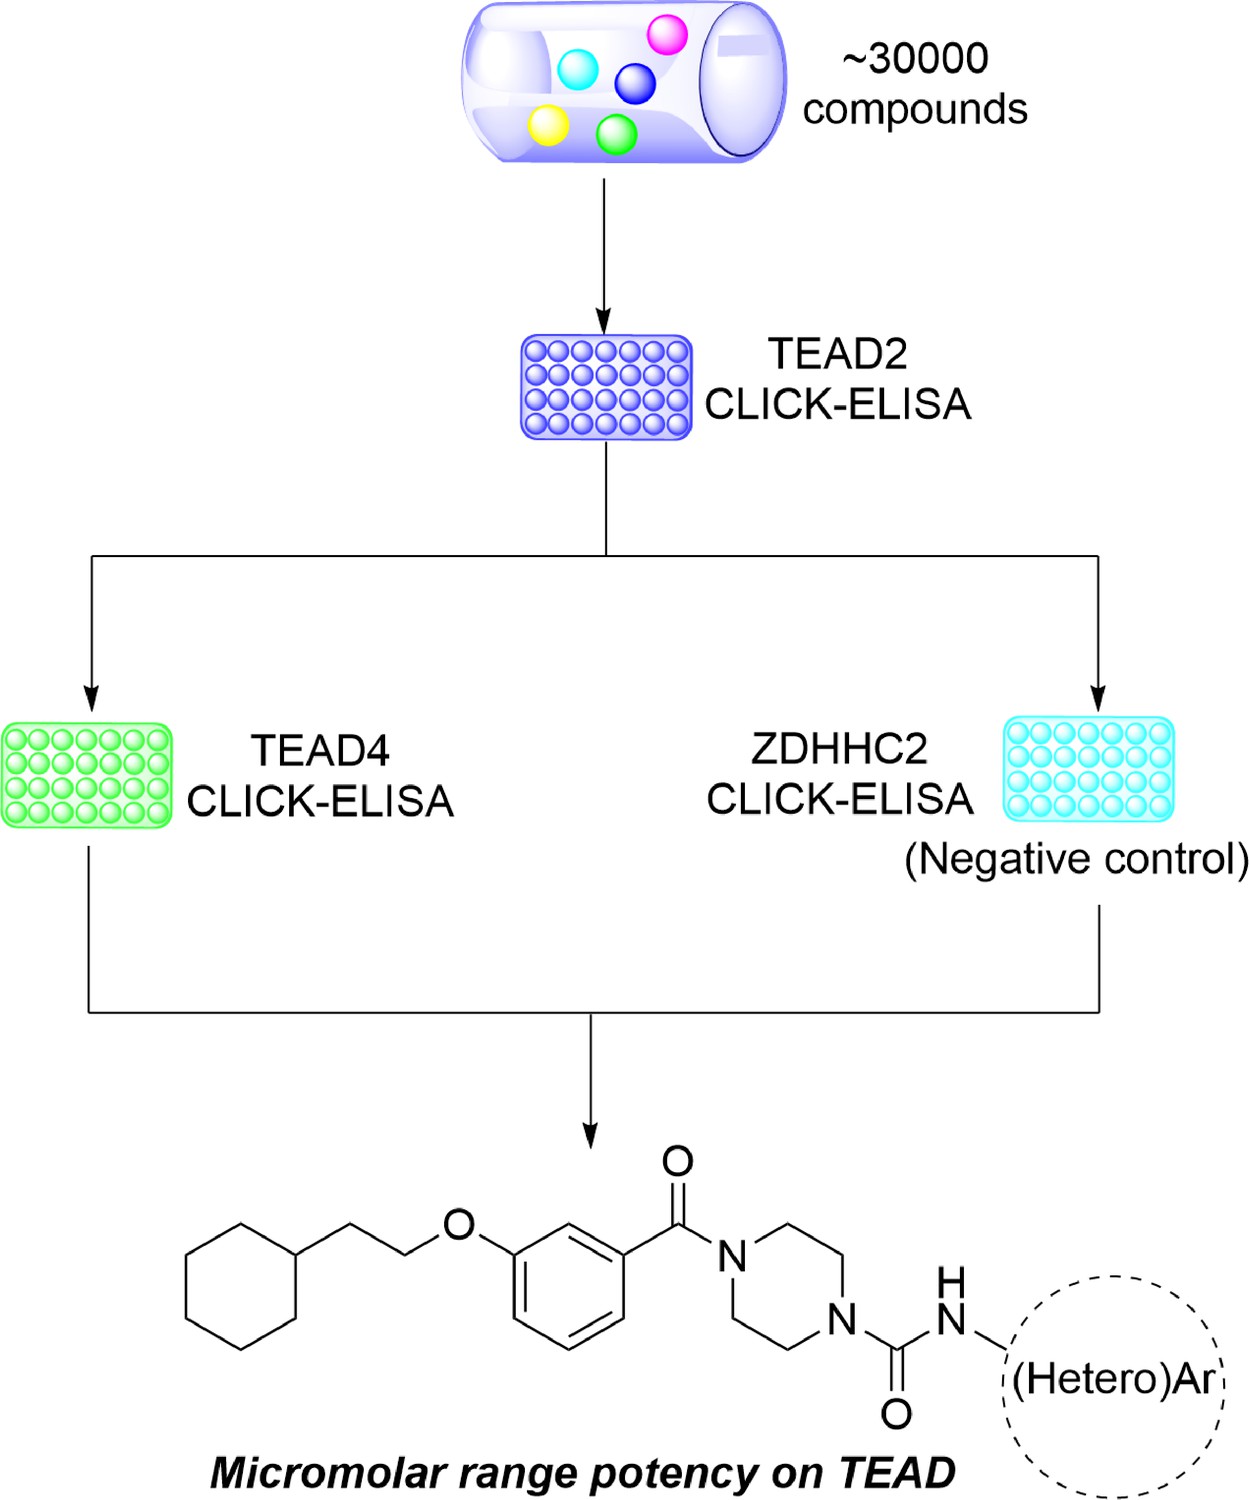
Scheme for high-throughput screening of TEA domain (TEAD inhibitors).
Figure 1—figure supplement 2
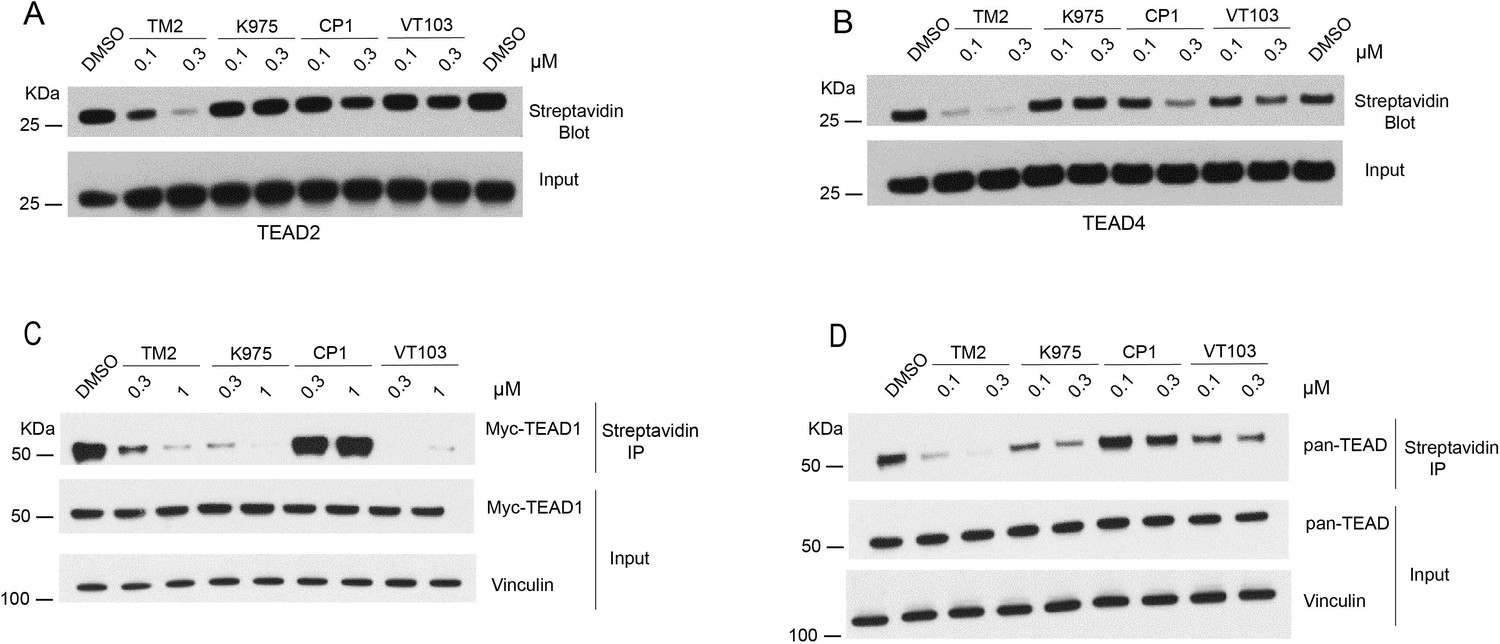
Comparison of TM2 and known inhibitors on inhibition of TEA domain (TEAD) palmitoylation.
(A) Inhibition of TEAD2 auto-palmitoylation with treatment of TM2, K975, MGH-CP1, and VT103 under 0.1 and 0.3 μM for 30 min, respectively. (B) Inhibition of TEAD4 auto-palmitoylation with treatment of TM2, K975, MGH-CP1, and VT103 under 0.1 and 0.3 μM for 30 min, respectively. (C) Inhibition of full-length myc-TEAD1 palmitoylation in HEK293A cells was analyzed by chemical reporter and streptavidin pulldown assay with treatment of TM2, K975, MGH-CP1, and VT103 under 0.3 and 1 μM for 24 hr. (D) Inhibition of endogenous pan-TEAD palmitoylation in HEK293A cells was analyzed by chemical reporter and streptavidin pulldown assay with treatment of TM2, K975, MGH-CP1, and VT103 under 0.1 and 0.3 μM for 24 h.
-
Figure 1—figure supplement 2—source data 1
Source data for Figure 1—figure supplement 2.
- https://cdn.elifesciences.org/articles/80210/elife-80210-fig1-figsupp2-data1-v2.zip
Figure 2 with 2 supplements
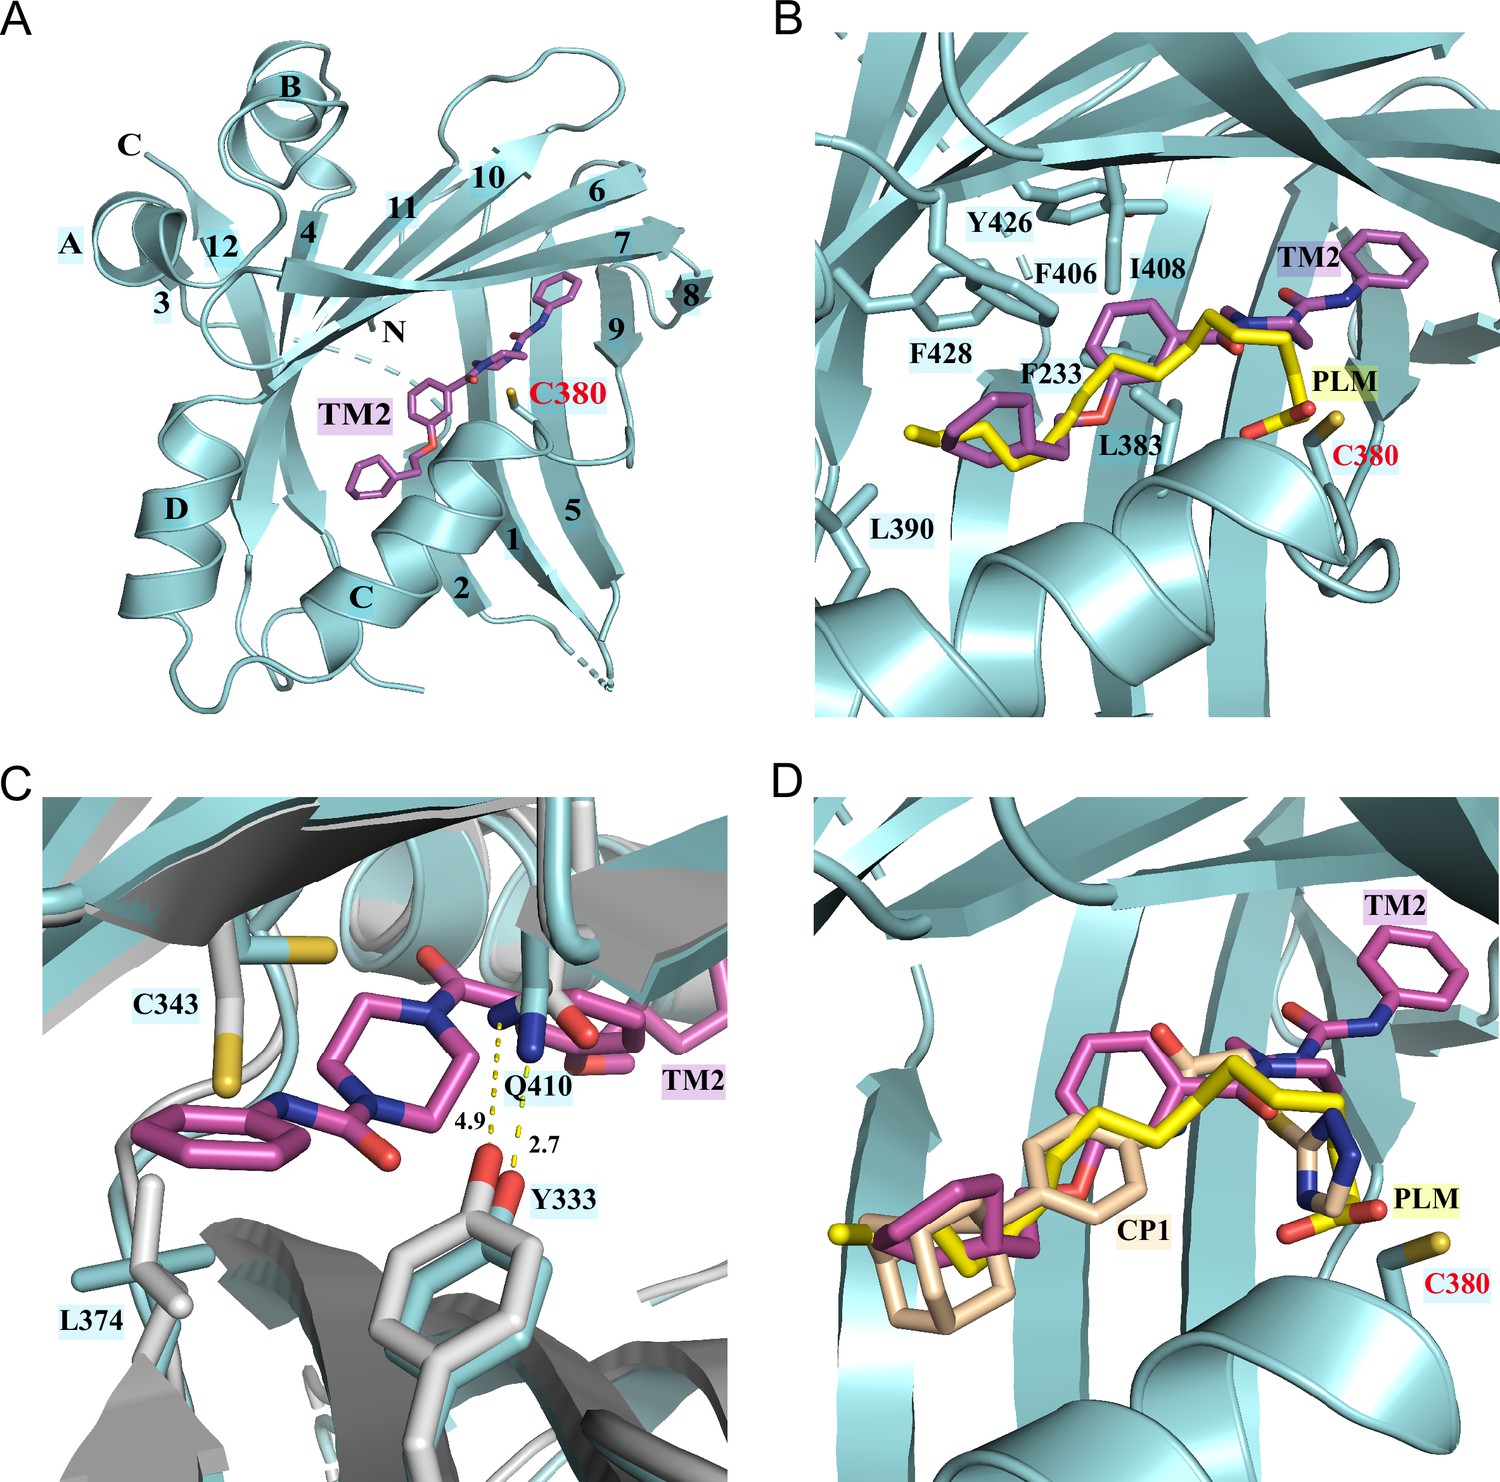
Co-crystal structure of TEAD2 complexed with TM2.
(A) Ribbon diagram of the crystal structure of TEAD2-TM2 (PDB 8CUH). TM2 is shown as magenta sticks. (B) Close-up view of the TM2 binding site of TEAD2 (PDB 8CUH) with the superposition of the TEAD2-PLM structure (PDB 5HGU). Surrounding residues are shown as cyan sticks. Palmitic acid (PLM) is shown as yellow sticks. (C) Conformational changes in side chains of residues in the new pocket in the presence of TM2 binding. Indicated residues from TEAD2-TM2 and TEAD2-PLM are shown as cyan and gray sticks, respectively. Distances between atoms are shown with yellow dash lines and the unit is angstrom. (D) Structural superposition of TEAD2-TM2 (PDB 8CUH), TEAD2-PLM (PDB 5HGU), and TEAD2-CP1(PDB 6CDY). TEAD2 is shown as cyan ribbon. TM2, PLM, and CP1 (MGH-CP1) are shown as sticks and colored in magenta, yellow, and wheat, respectively.
-
Figure 2—source data 1
Data collection and structure refinement statistics.
- https://cdn.elifesciences.org/articles/80210/elife-80210-fig2-data1-v2.zip
Figure 2—figure supplement 1
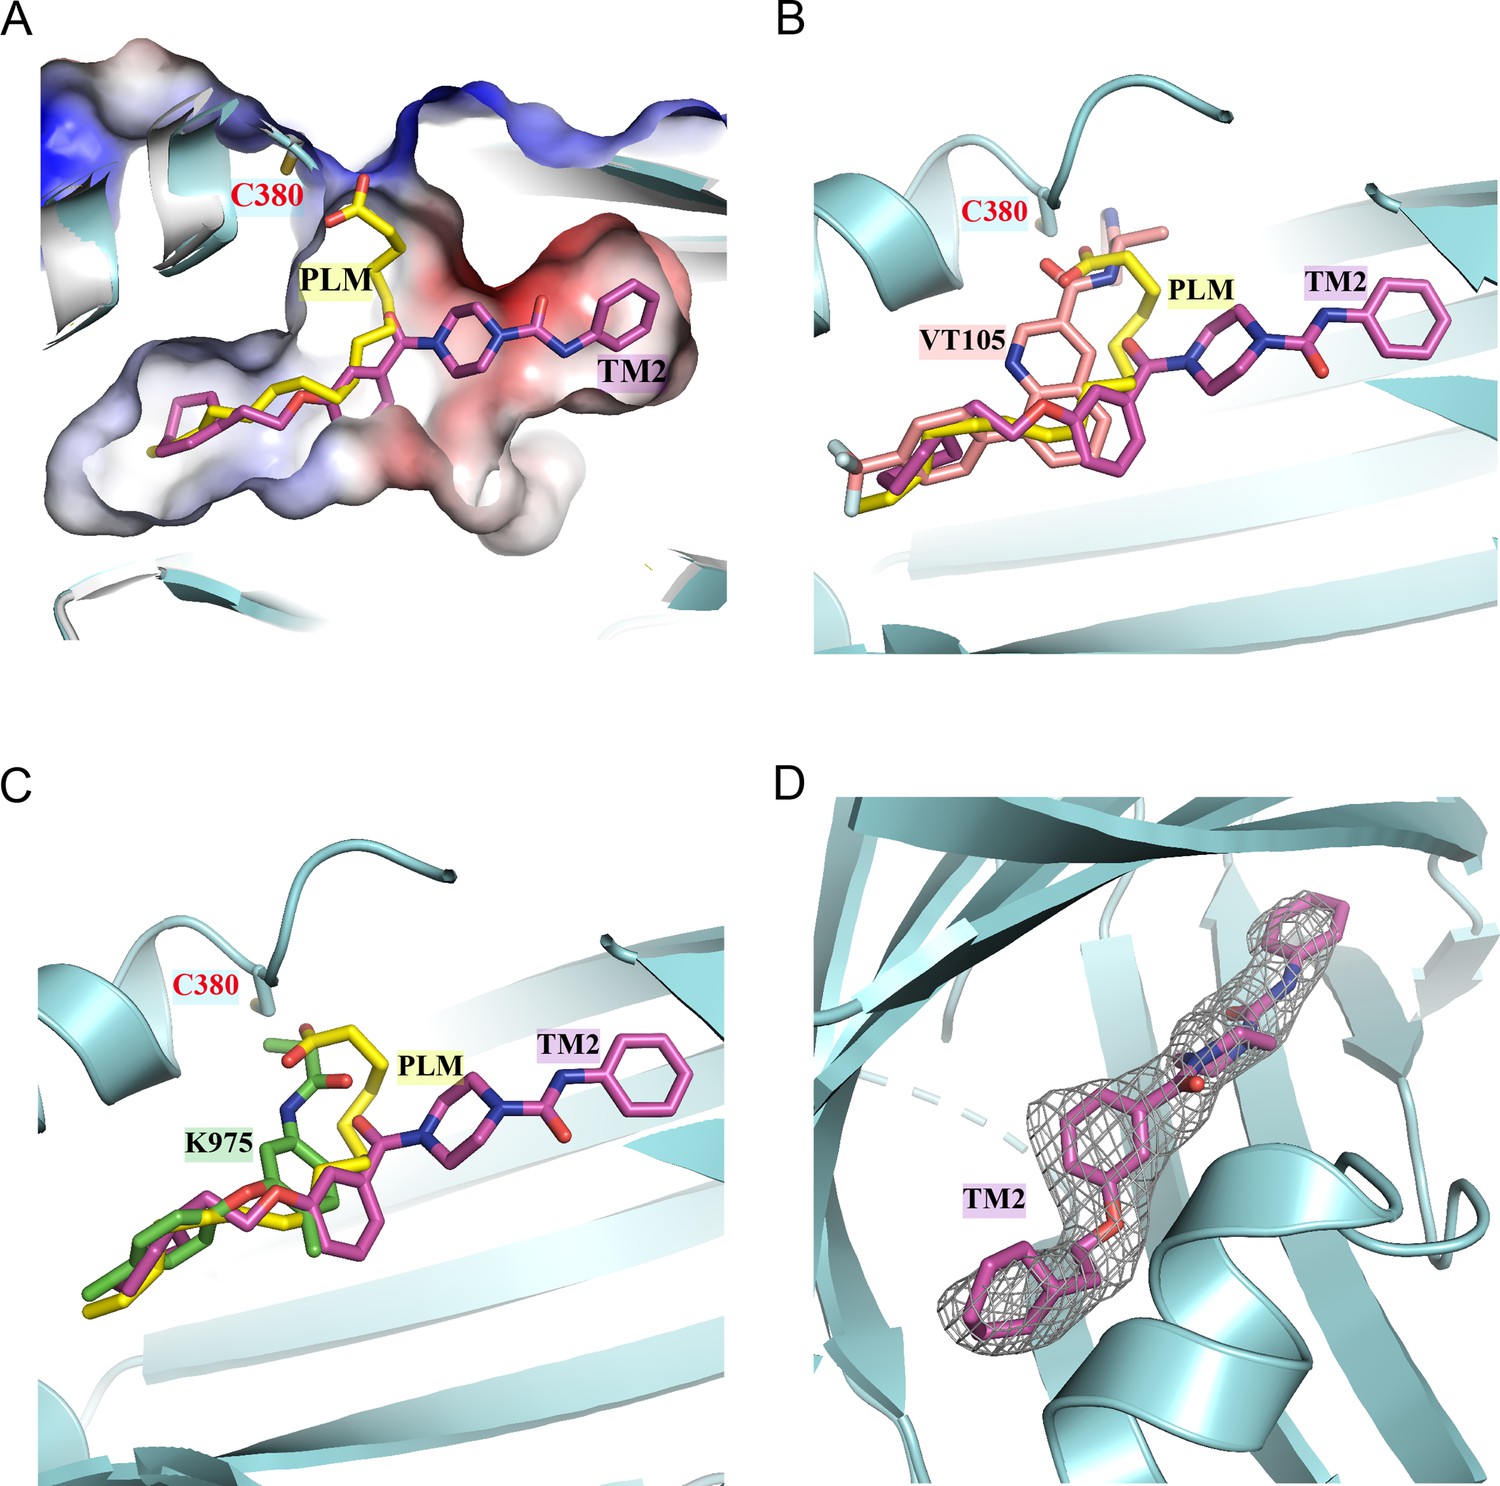
Structural superposition suggests that TM2 adopts a novel binding model.
(A) Comparison of orientations of TM2 and palmitic acid (PLM) in the binding pocket. The TEAD2 protein is shown as cyan ribbon. The pocket is shown by surface. PLM and TM2 are shown as sticks and colored in yellow and magenta, respectively. (B) Structural superposition of TEAD2-TM2 (PDB 8CUH), TEAD2-PLM (PDB 5HGU), and TEAD3-VT105 (PDB 7CNL). TM2, PLM, and VT105 are shown as sticks and colored in magenta, yellow, and salmon, respectively. (C) Structural superposition of TEAD2-TM2 (PDB 8CUH), TEAD2-PLM (PDB 5HGU), and TEAD1-K975 (PDB 7CMM). TM2, PLM, and K975 are shown as sticks and colored in magenta, yellow, and green, respectively. (D) The Fo – Fc omit electron density map for TM2 at the contour level of 2.5 σ is shown in gray. The TEAD2 protein is shown as cyan ribbon and TM2 is shown as magenta sticks.
Figure 2—figure supplement 2
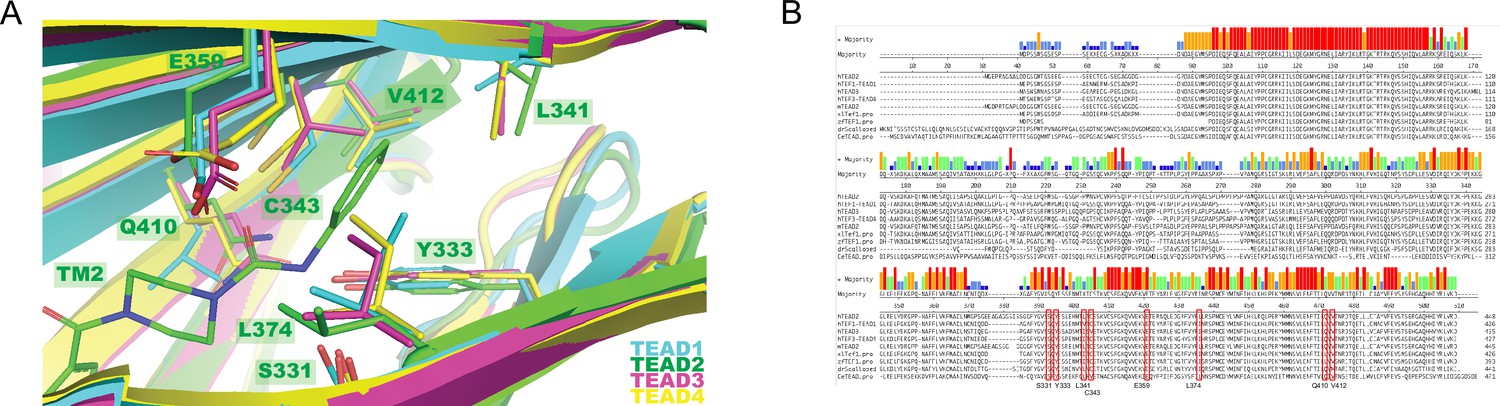
The side pocket is conserved among TEA domain (TEAD) family protein.
(A) Close-up view of the new side pocket of TEAD2 (PDB 8CUH) with the superposition of TEAD1 (PDB 7CMM), TEAD3 (PDB 7CNL), and TEAD4 (6SEO). TEAD1–4 is shown as cyan, green, magenta, and yellow ribbons, respectively. TM2 is shown as green sticks, and other compounds complexed with TEAD were omitted for clarity. The interacting residues in the new side pocket are shown as sticks and labeled with the TEAD2 numbers. (B) Protein sequence alignment of human TEAD1-4, Xenopus laevis TEAD, Danio rerio TEAD, Drosophila Scalloped, and C. elegans TEAD. All eight interacting residues in the new side pocket are boxed in red and named with TEAD2 numbers.
Figure 3 with 3 supplements
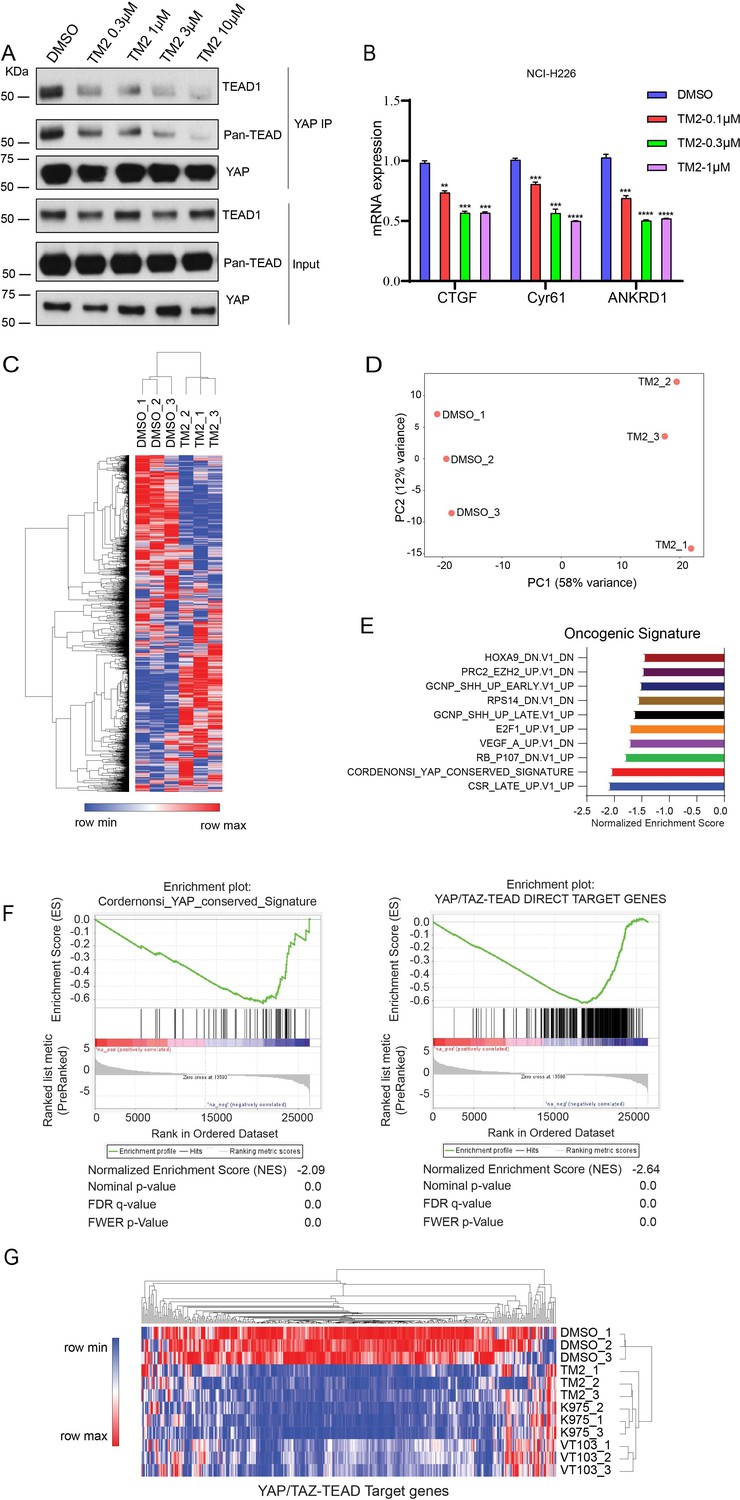
TM2 suppressed transcriptional outputs of Hippo pathway in cancer cells.
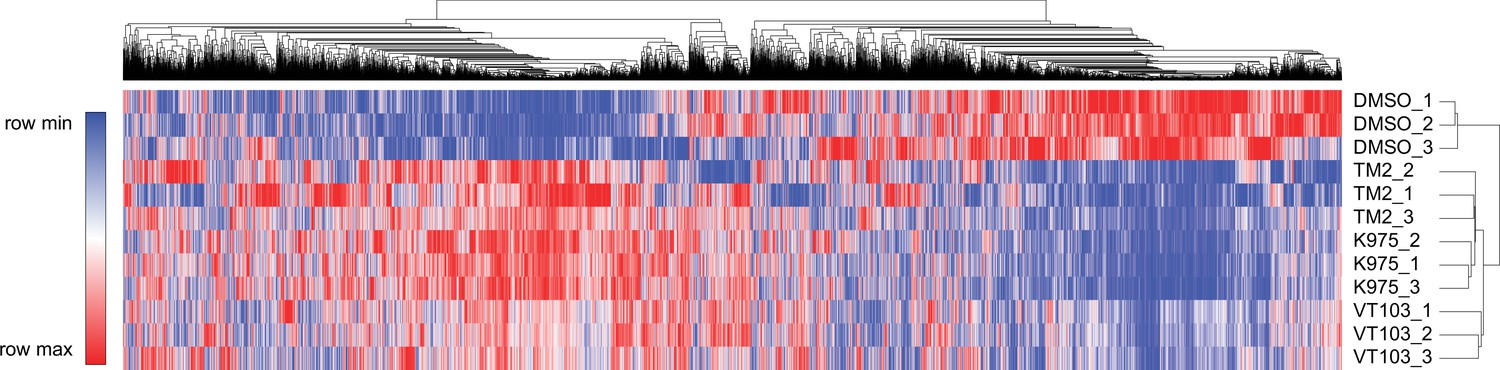
(A) NCI-H226 cells were treated with TM2 at indicated concentrations for 24 hr. The interactions of YAP and Pan-TEAD as well as TEAD1 were observed with YAP co-IP. (B) Representative target genes of Hippo pathway in NCI-H226 cells were measured with treatment of TM2 at indicated concentrations for 48 hr. The data was determined by independent replicates (n = 3) and shown as mean ± SEM. Significance was determined by two-tailed t-test. **p<0.01, ***p<0.001, ****p<0.0001. (C) Heatmap analysis of biological replicates (n = 3) of global genes transcriptional alteration in NCI-H226 treated with vehicle control or TM2. Each column in the heatmap is an individual sample. (D) Principal component analysis (PCA) biplot with genes plotted in two dimensions using their projections onto the first two principal components, and six samples (Control: three samples; TM2: three samples) plotted using their weights for the components. (E) Gene set enrichment analysis of NCI-H226 cells treated with TM2 using oncogenic signature gene sets from Molecular Signatures Database. (F) Gene set enrichment plot of Cordernonsi_YAP_conserved_Signature (left panel) and YAP_TAZ-TEAD Direct Target Genes (right panel) with NCI-H226 cells treated with TM2. (G) Heatmap analysis of YAP/TAZ-TEAD direct target genes transcriptional alteration in NCI-H226 cells treated with TM2 (1 µM), K975 (1 µM), and VT103 (1 µM) for 24 h. Each column in the heatmap is an individual sample.
-
Figure 3—source data 1
Source data for Figure 3A.
- https://cdn.elifesciences.org/articles/80210/elife-80210-fig3-data1-v2.zip
Figure 3—figure supplement 1
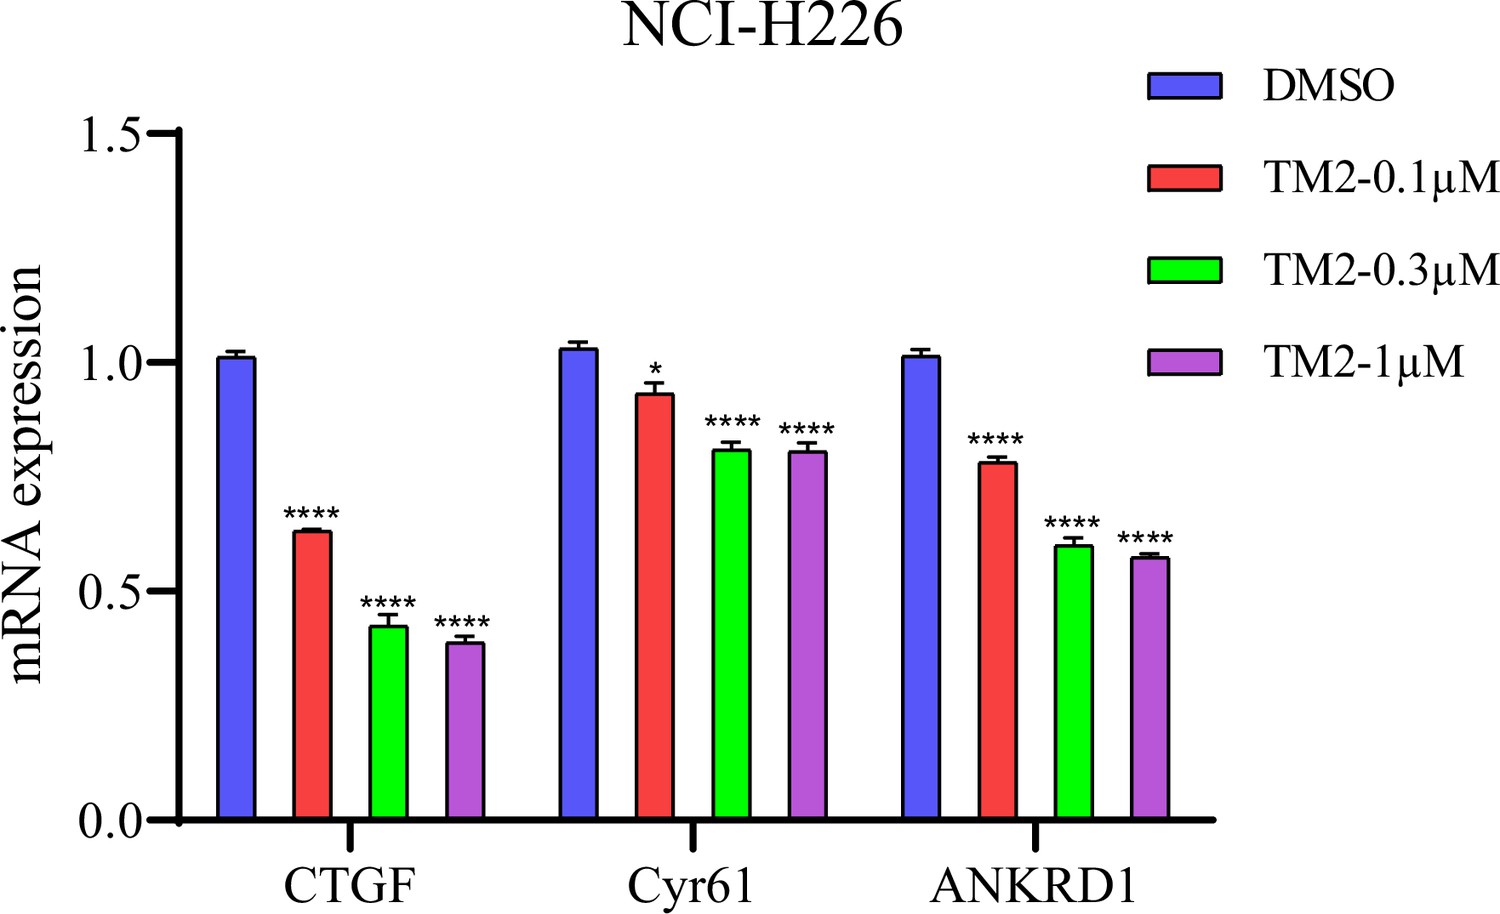
Target gene expression in NCI-H226 with TM2 treatment for 24 hr.
The data was determined by independent replicates (n = 3) and shown as mean ± SEM. Significance was determined by two-tailed t-test. *p<0.05, ****p< 0.0001.
Figure 3—figure supplement 2
Heatmap analysis of global genes transcriptional alteration in NCI-H226 cells treated with TM2, K975, and VT103 for 24 hr.
Each column in the heatmap is an individual sample.
Figure 3—figure supplement 3
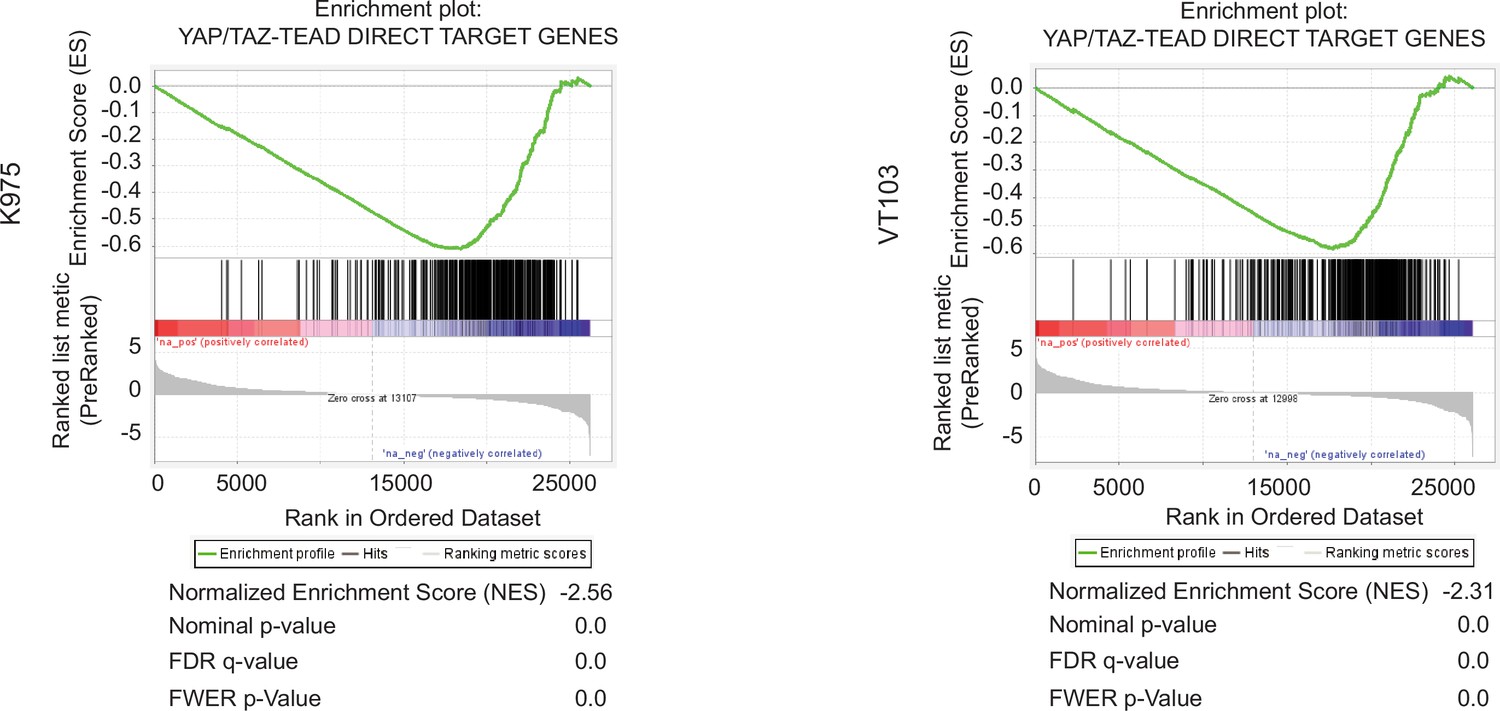
Gene set enrichment plot of YAP_TAZ-TEAD Direct Target Genes in NCI-H226 cells treated with K975 (left) and VT103 (right).
Figure 4 with 4 supplements
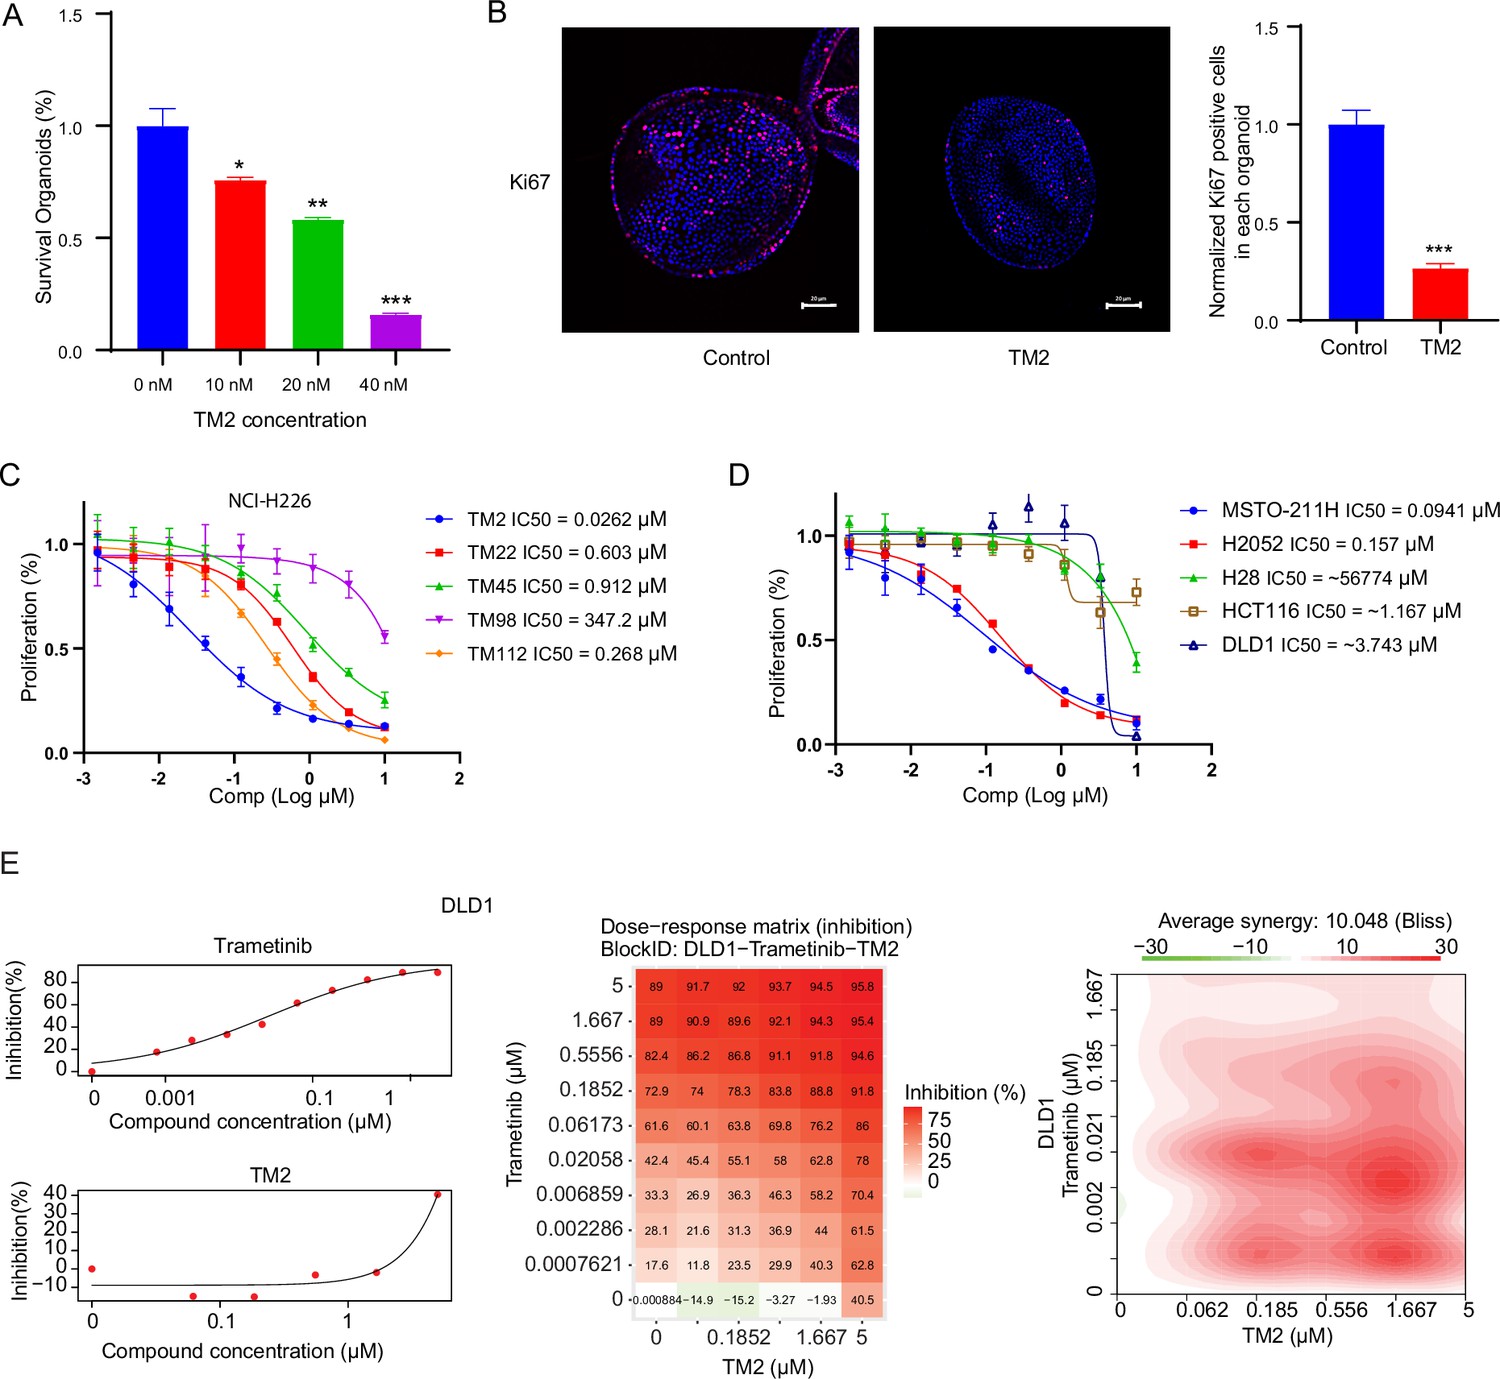
TM2 showed inhibition on YAP-dependent proliferation.
(A) Percentages of survival organoids with treatment of control or TM2 at indicated concentrations. The data was determined by independent replicates (n = 3) and shown as mean ± SEM. Significance was determined by two-tailed t-test. *p<0.05, **p<0.01, ***p<0.001 (B) Representative Immunofluorescent staining of Ki67 in organoids treated with control or TM2 (40 nM). Pink, Ki-67; blue, nuclear DNA (DAPI). Bar, 20 μm. Bar graphs showing the normalized percentage of positive cells in each organoid. Data are determined by independent replicates (n = 3) and represented as mean ± SEM. Significance was determined by two-tailed t-test. Significance was determined by two-tailed t-test. ***p<0.001. (C) Cell inhibition in NCI-H226 cells with treatment of compounds at indicated concentrations for 6 days. The data was determined by independent replicates (n = 3) and shown as mean ± SEM. (D) Cell inhibition in MSTO-211H, H2052, H28, HCT116, and DLD1 cells with treatment of TM2 at indicated concentrations for 5, 7, 6, 5, or 5 days, respectively. The data was determined by independent replicates (n = 3) and shown as mean ± SEM. (E) Drug combination experiments using TM2 and MEK inhibitor trametinib in DLD1. Left panels show the dose curves of the single agents. Middle panel shows the heatmap with color-coding as percentage of cell viability normalized to untreated controls under combination. Right panel shows the heatmap of Bliss score for TM2 and trametinib combination. Bliss score of >10 indicates synergistic effects.
Figure 4—figure supplement 1
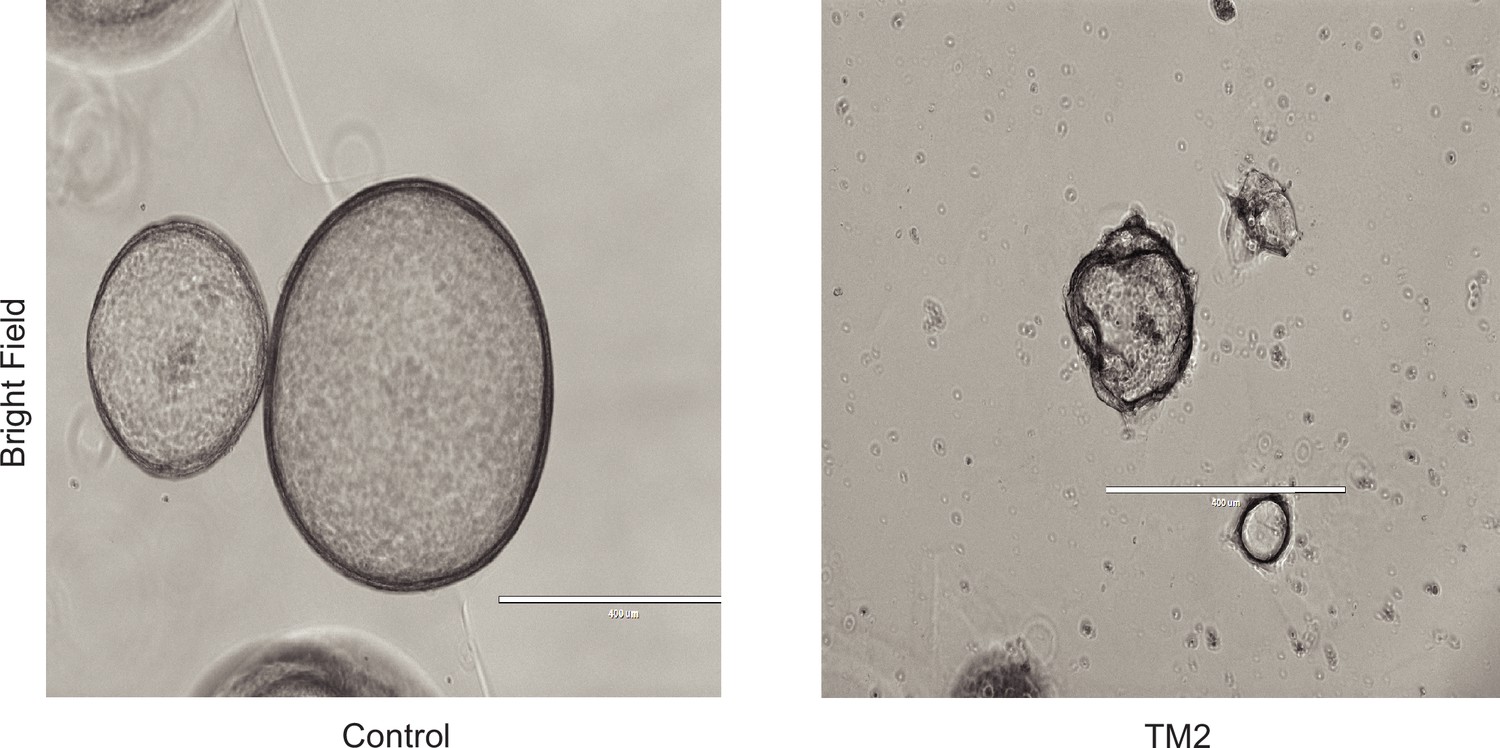
Representative bright-field images of organoids treated with control or TM2 (40 nM).
Scale bar, 400 μm.
Figure 4—figure supplement 2
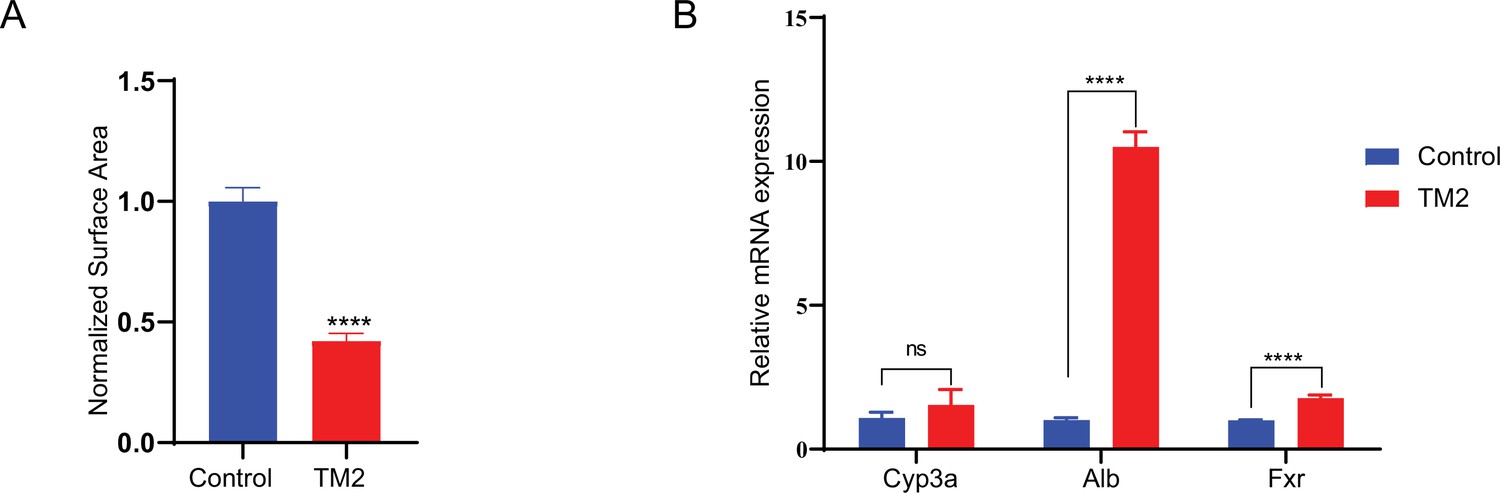
The effects of TM2 on organoid proliferation and differentiation.
(A) Surface area of organoids was quantified with 50 organoids from independent replicates (n = 3) treated with control or TM2 (40 nM). Data are normalized to area of organoids treated with control and shown as mean ± SEM. Significance was determined by two-tailed t-test. ****p<0.0001. (B) Expression of mature hepatocyte markers in organoids treated with control or TM2 (40 nM) for 48 hr. The data was determined by independent replicates (n = 3) and shown as mean ± SEM. Significance was determined by two-tailed t-test. ****p< 0.0001.
Figure 4—figure supplement 3
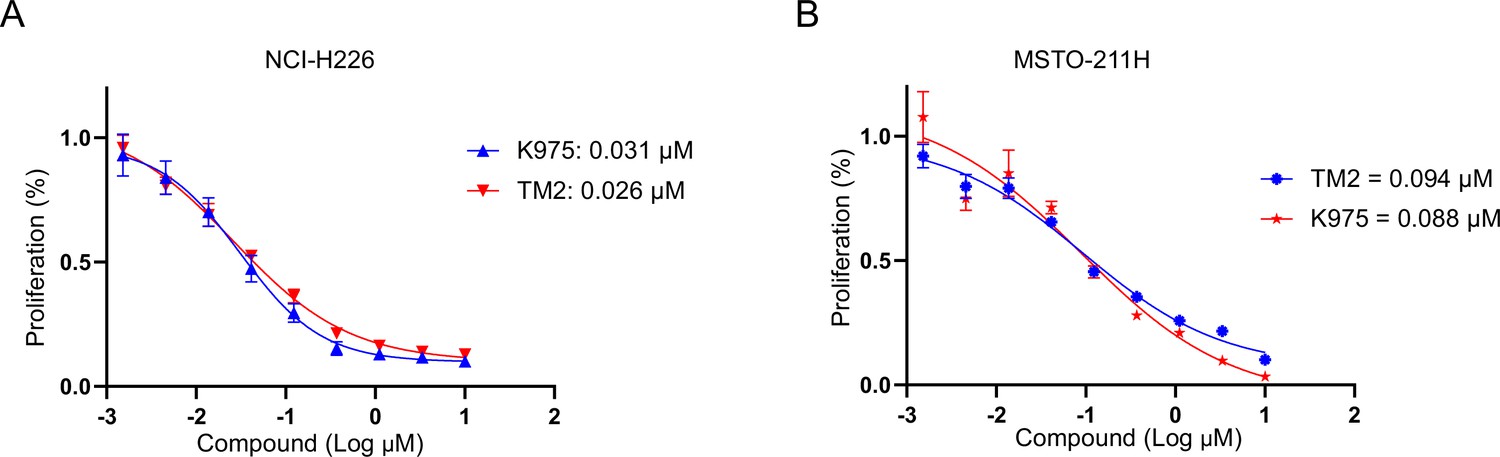
Comparison of the antiproliferative effects of TM2 and K975 in mesothelioma with YAP dependency.
(A) Cell inhibition in NCI-H226 cells with treatment of TM2, K975 at indicated concentrations for 6 days. The data was determined by independent replicates (n = 3) and shown as mean ± SEM. (B) Cell inhibition in MSTO-211H cells with treatment of TM2, K975 at indicated concentrations for 5 days. The data was determined by independent replicates (n = 3) and shown as mean ± SEM.
Figure 4—figure supplement 4
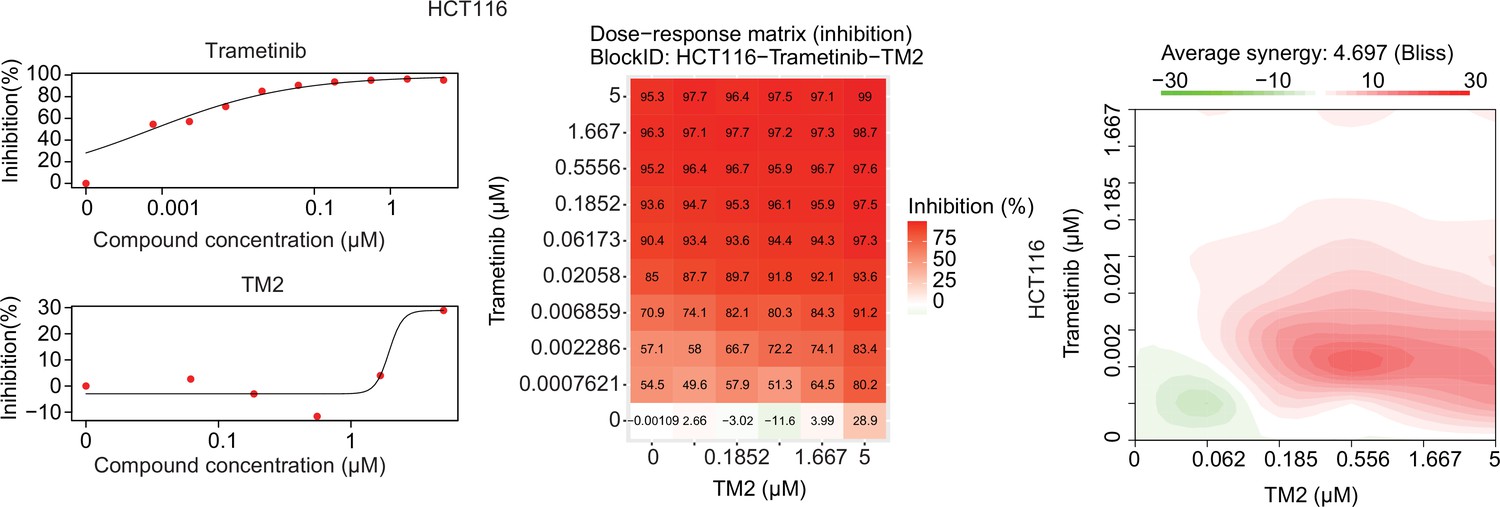
Drug combination experiments using TM2 and MEK inhibitor trametinib in HCT116 cells.
Left panels show the dose curve of single agents. Middle panel with the heatmaps shows color-coding of percentage inhibition of cell viability normalized to untreated controls with combination. Right panel shows the heatmap of Bliss score for TM2 and trametinib combination at various doses.
Scheme 1

Synthetic route for TM2.
Scheme 2

Synthetic route for TM22.
Scheme 3

Synthetic route for TM45.
Scheme 4

Synthetic route for TM98.
Scheme 5

Synthetic route for TM112.
Additional files
Download links
A two-part list of links to download the article, or parts of the article, in various formats.
Downloads (link to download the article as PDF)
Open citations (links to open the citations from this article in various online reference manager services)
Cite this article (links to download the citations from this article in formats compatible with various reference manager tools)
Discovery of a new class of reversible TEA domain transcription factor inhibitors with a novel binding mode
eLife 11:e80210.
https://doi.org/10.7554/eLife.80210


