The NAD+ precursor NMN activates dSarm to trigger axon degeneration in Drosophila
- Department of Fundamental Neurosciences, University of Lausanne, Switzerland
- John van Geest Centre for Brain Repair, Department of Clinical Neurosciences, University of Cambridge, United Kingdom
- Department of Genetic Medicine and Development, University of Geneva, Switzerland
- Department of Agricultural, Food and Environmental Sciences, Polytechnic University of Marche, Italy
- Department of Clinical Sciences, Section of Biochemistry, Polytechnic University of Marche, Italy
Figures
Figure 1 with 3 supplements
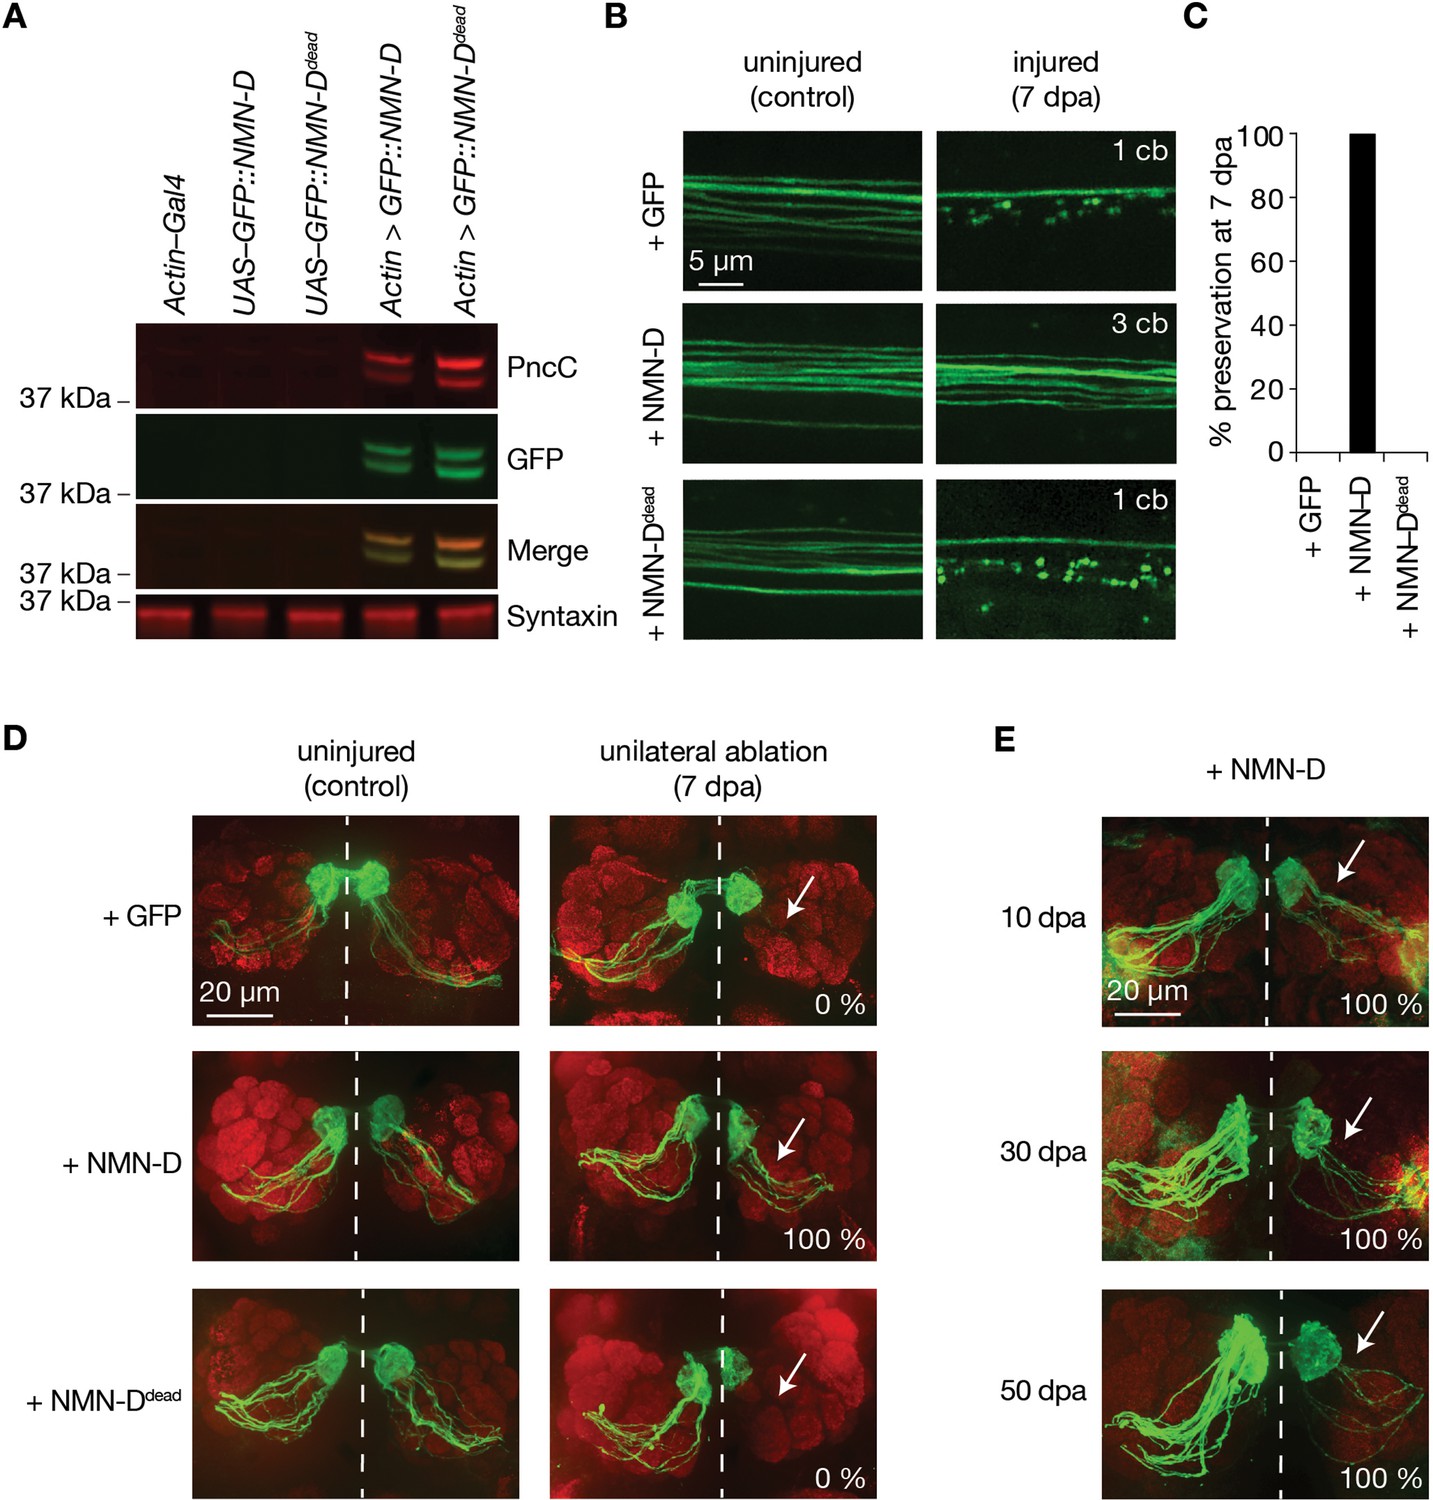
Neuronal expression of prokaryotic NMN-D preserves the morphology of severed axons for the lifespan in Drosophila.
(A) Equal expression of wild-type and enzymatically dead NMN-D enzymes, respectively. Western blots with anti-PncC and anti-GFP immunoreactivities (red and green, respectively). (B) Low NMN results in severed wing sensory neuron axons that remain morphologically preserved at 7 dpa. Examples of control and 7 dpa. (C) Axon death quantification. % preservation of injured axons at 7 dpa, average ± standard error of the mean (n=15 wings). (D) Low NMN results in severed axons of olfactory receptor neurons that remain morphologically preserved at 7 dpa. Examples of control and 7 dpa (arrows, site of unilateral ablation). Lower right, % of brains with severed preserved axon fibers. (E) Low NMN results in severed axons that remain morphologically preserved for 50 days. Representative pictures of 10, 30, and 50 dpa, from a total of 10 brains imaged for each condition (arrows, site of unilateral ablation). Lower right, % of brains with severed preserved axon fibers.
-
Figure 1—source data 1
Raw data of Western blot and quantification.
(A) Raw unedited western blots and uncropped blots with relevant bands clearly labeled. (C) Raw data of quantified preserved severed axons.
- https://cdn.elifesciences.org/articles/80245/elife-80245-fig1-data1-v2.zip
Figure 1—figure supplement 1
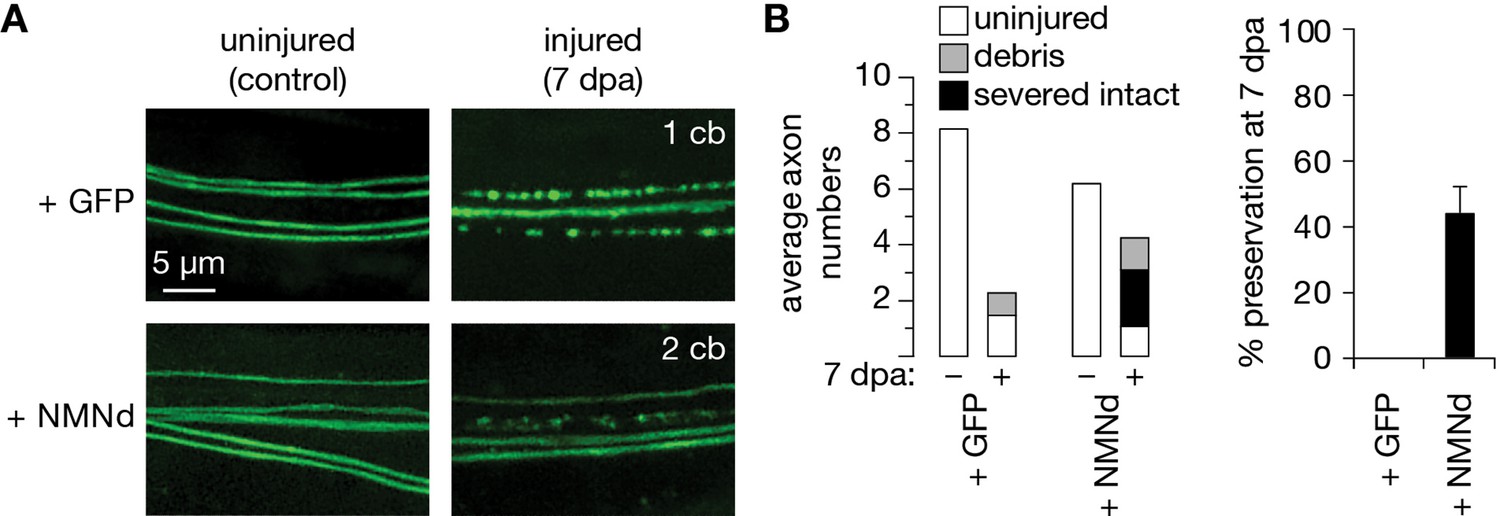
Partial preservation of severed axons at 7 dpa by previously published NMN-Deamidase (NMNd).
(A) Control and 7 days post axotomy (7 dpa) examples of GFP- and NMNd-expressing axons in the wing injury assay. Cell bodies in the cut-off distal wing are immediately counted to determine severed axons. After injury, the number of neuronal cell bodies (cb) that remain attached in the proximal wing–displayed in the upper right corner of each example–indicates how many uninjured, thus expected axons remain in the nerve bundle. (B) Axon death quantification. Left: average numbers of uninjured control, debris, and severed intact axons (white, gray, and black, respectively; n=15 wings). Right: % preservation of injured axons at 7 dpa, average ± standard error of the mean (n=15 wings).
-
Figure 1—figure supplement 1—source data 1
Raw data of quantification.
(B) Raw data of quantified preserved severed axons.
- https://cdn.elifesciences.org/articles/80245/elife-80245-fig1-figsupp1-data1-v2.zip
Figure 1—figure supplement 2
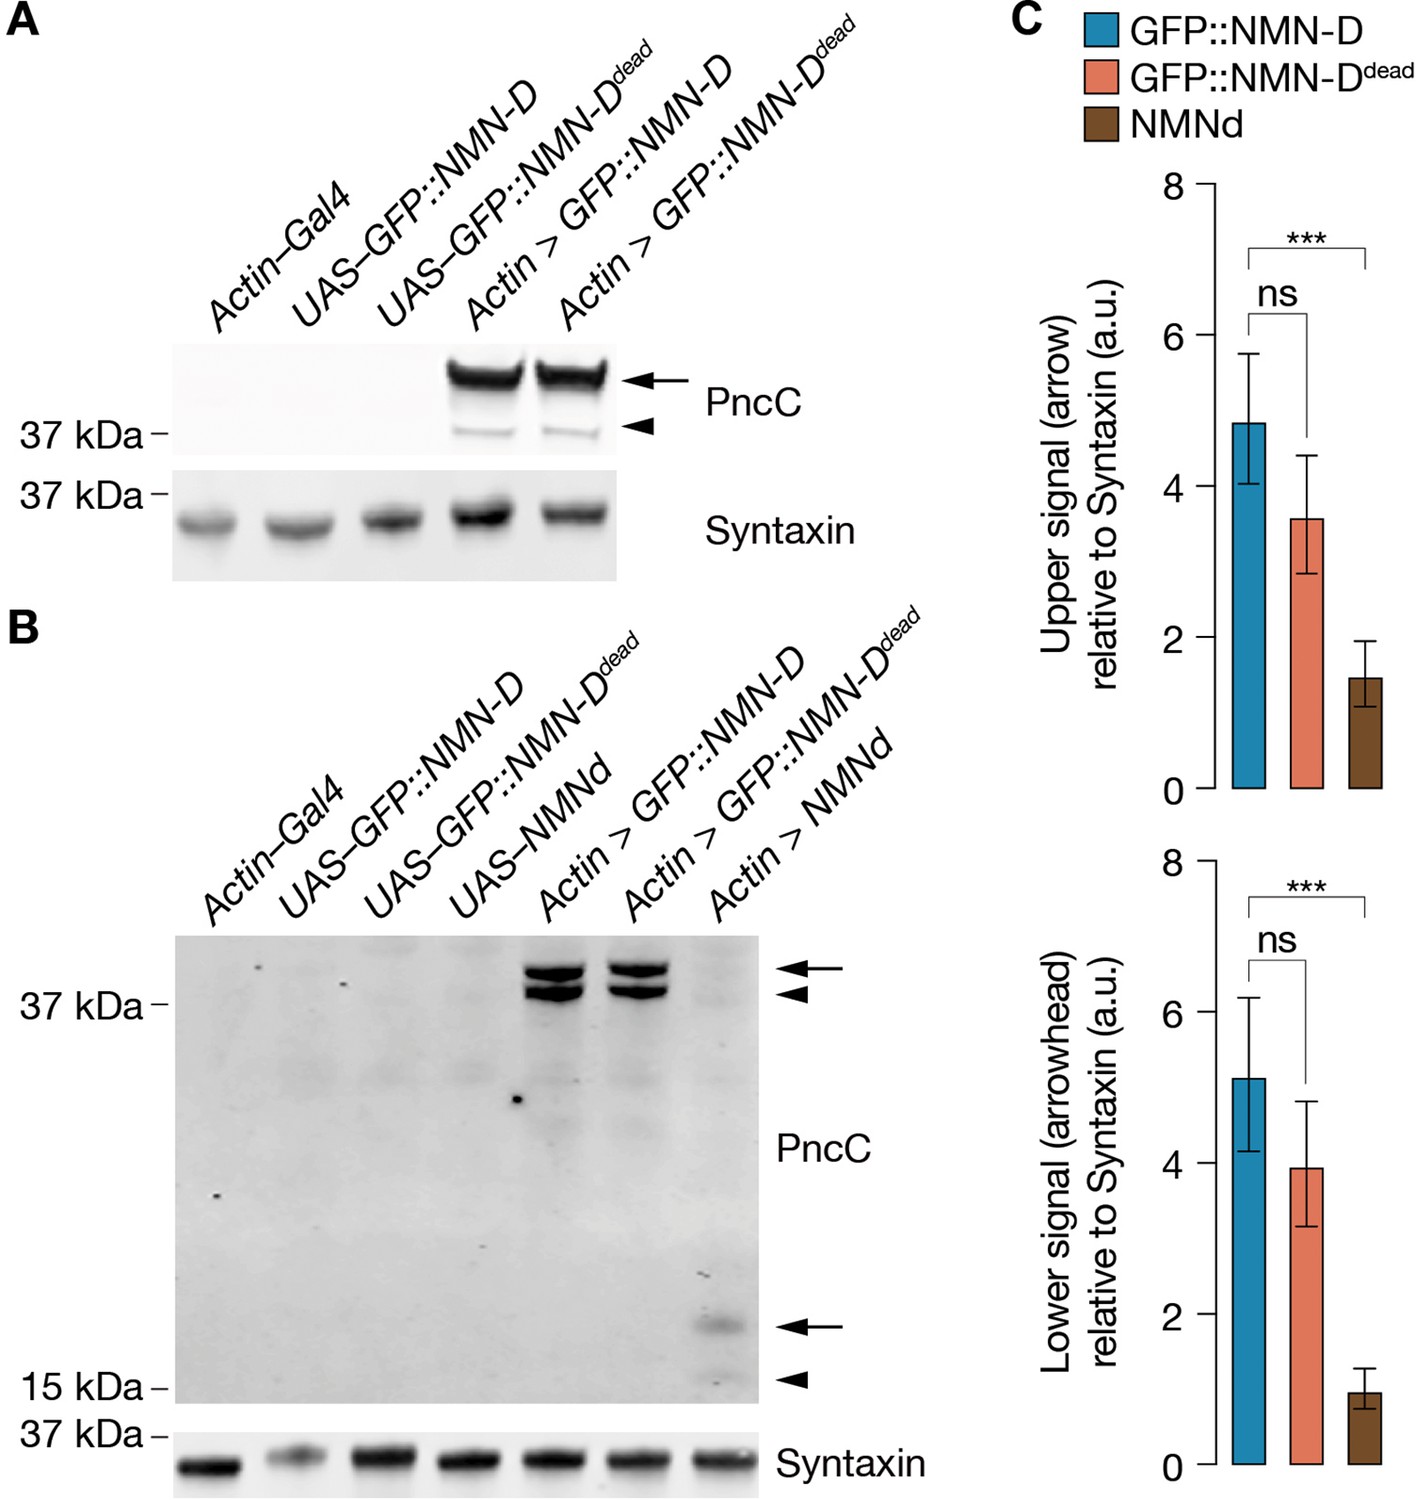
Increased NMN-D detected by anti-PncC antibodies.
(A) NMN-D expression and detection by anti-PncC antibodies in S2 cells. (B) Increased levels of NMN-D compared to NMNd in heads of Drosophila. Arrow, predicted NMN-Deamidase; arrowhead, potential degradation product. (C) Quantification of Western blot PncC-immunoreactivity by densitometry. 2 heads / lane; mean ± standard deviation (n=4); a.u., arbitrary units. One-way ANOVA with Tukey’s multiple comparisons test. ***=p < 0.001; ns, not significant, = p > 0.05.
-
Figure 1—figure supplement 2—source data 1
Raw data of Western blot and quantification.
(A) Raw unedited western blots and uncropped blots with relevant bands clearly labeled. (B) Raw unedited western blots and uncropped blots with relevant bands clearly labeled. (C) Raw data of Western blot quantification.
- https://cdn.elifesciences.org/articles/80245/elife-80245-fig1-figsupp2-data1-v2.zip
Figure 1—figure supplement 3

Quantification of axonal phenotypes.
Average numbers of uninjured control, debris, and severed intact axons (white, gray, and black, respectively; n=15 wings, 7 dpa – and +, respectively).
-
Figure 1—figure supplement 3—source data 1
Raw data of quantification.
(C) Raw data of quantified preserved severed axons.
- https://cdn.elifesciences.org/articles/80245/elife-80245-fig1-figsupp3-data1-v2.zip
Figure 2 with 2 supplements
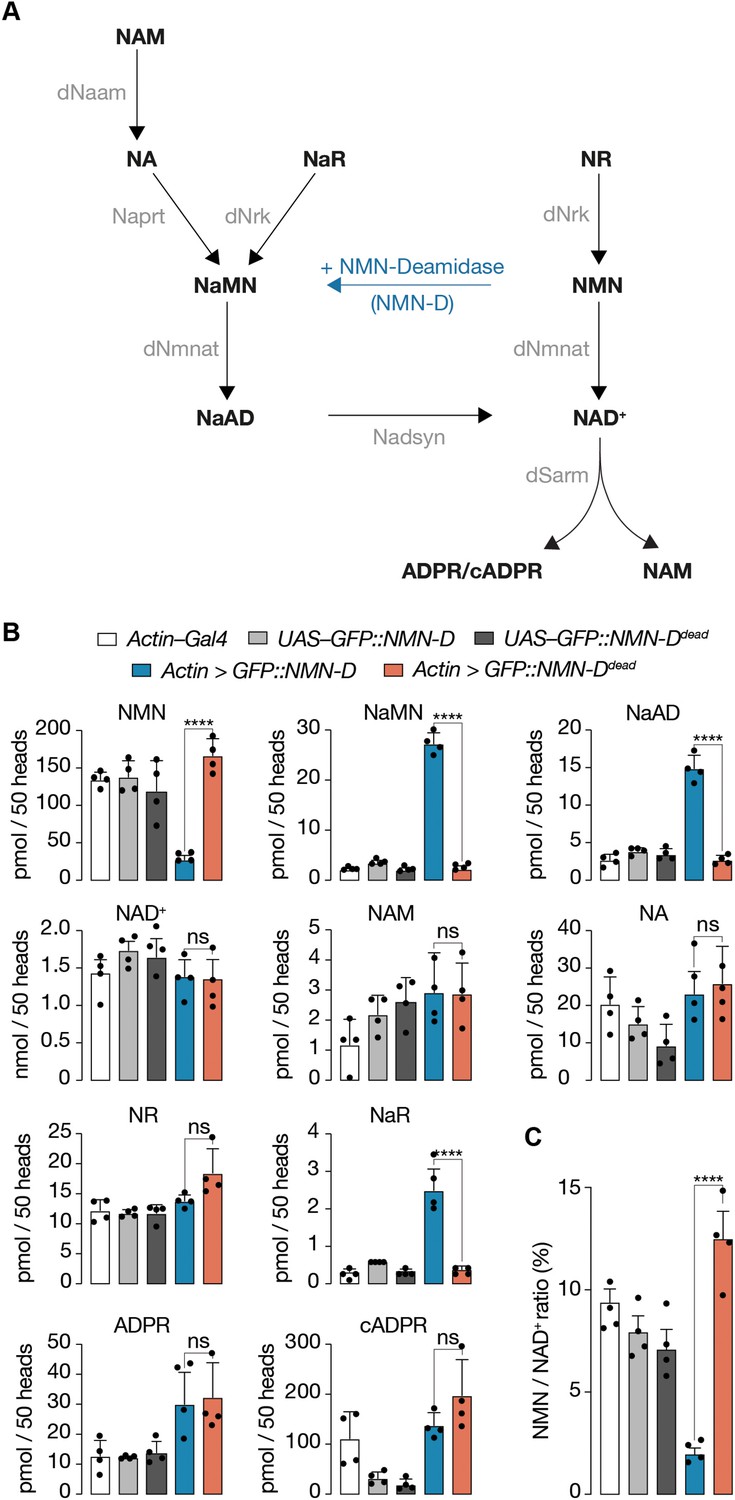
Pan-cellular NMN-D expression alters the flux of NAD+ metabolites to lower NMN in heads of Drosophila.
(A) Drosophila NAD+ metabolic pathway. Black, metabolites; grey, enzymes; blue, prokaryotic NMN-D, respectively. (B) The expression of NMN-D results in lower NMN and higher NaMN, NaAD, and NaR levels, respectively. (C) % NMN / NAD+ ratio. Extracted metabolites from 50 heads, mean ± standard deviation (n=4). Dots, individual measurements. One-way ANOVA with Tukey’s multiple comparisons test, ****=p < 0.0001, ns = p > 0.05.
-
Figure 2—source data 1
Raw data of measured metabolites and quantification.
(B) Raw data of metabolomic measurement.
- https://cdn.elifesciences.org/articles/80245/elife-80245-fig2-data1-v2.zip
Figure 2—figure supplement 1
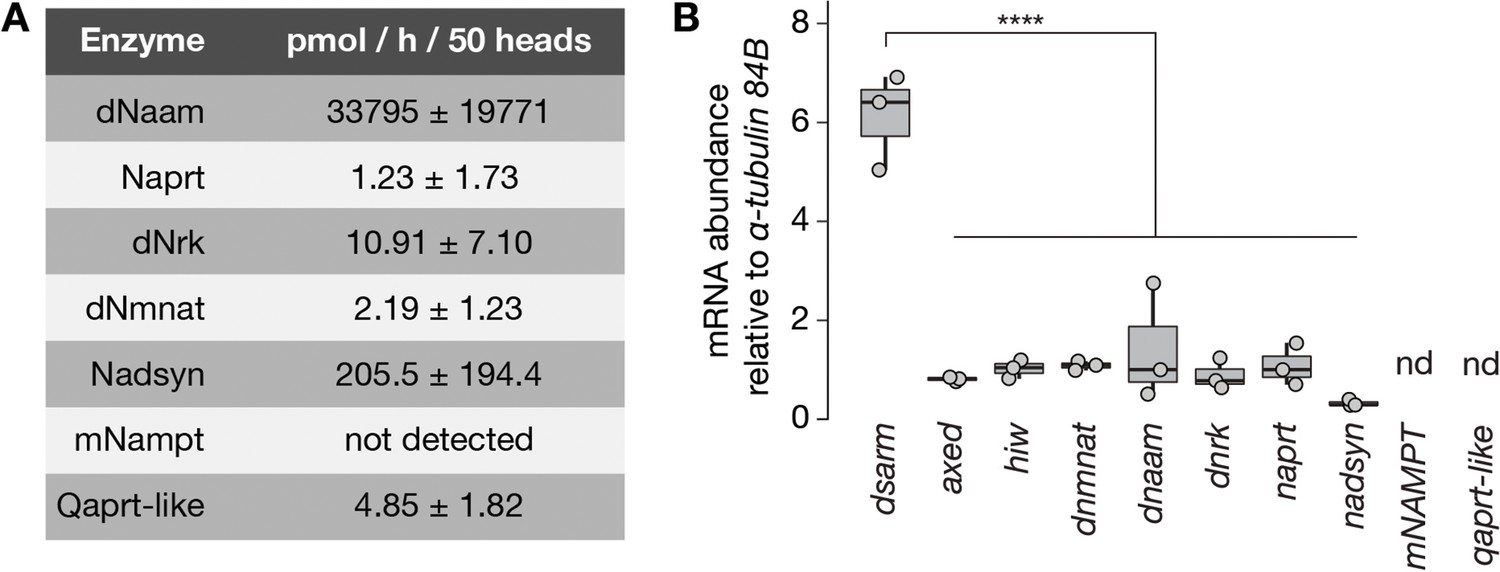
Enzymatic activity and expression levels of NAD+ synthesis and axon death genes.
(A) Enzymatic activities of NAD+ metabolic pathway proteins in extracts of Drosophila heads. Qaprt-like: quinolinate phosphoribosyltransferase-like activity, catalyzes quinolinate to NaMN from the de novo NAD+ synthesis pathway. The identity of Drosophila Qaprt remains currently unknown (Katsyuba et al., 2018, Nature). Values are listed as mean ± standard deviation (n=2). (B) mRNAabundance of axon death and NAD+ synthesis genes normalized to α-tubulin 84B in Drosophila heads. Amplicon primers covered all isoforms of each gene tested (n=3). One-way ANOVA with Tukey’s multiple comparisons test, ****=p < 0.0001. nd, not determined.
-
Figure 2—figure supplement 1—source data 1
Raw data of enzymatic activity and qRT-PCR.
(A) Raw data of enzymatic activity. (B) Raw data of qRT-PCR.
- https://cdn.elifesciences.org/articles/80245/elife-80245-fig2-figsupp1-data1-v2.zip
Figure 2—figure supplement 2
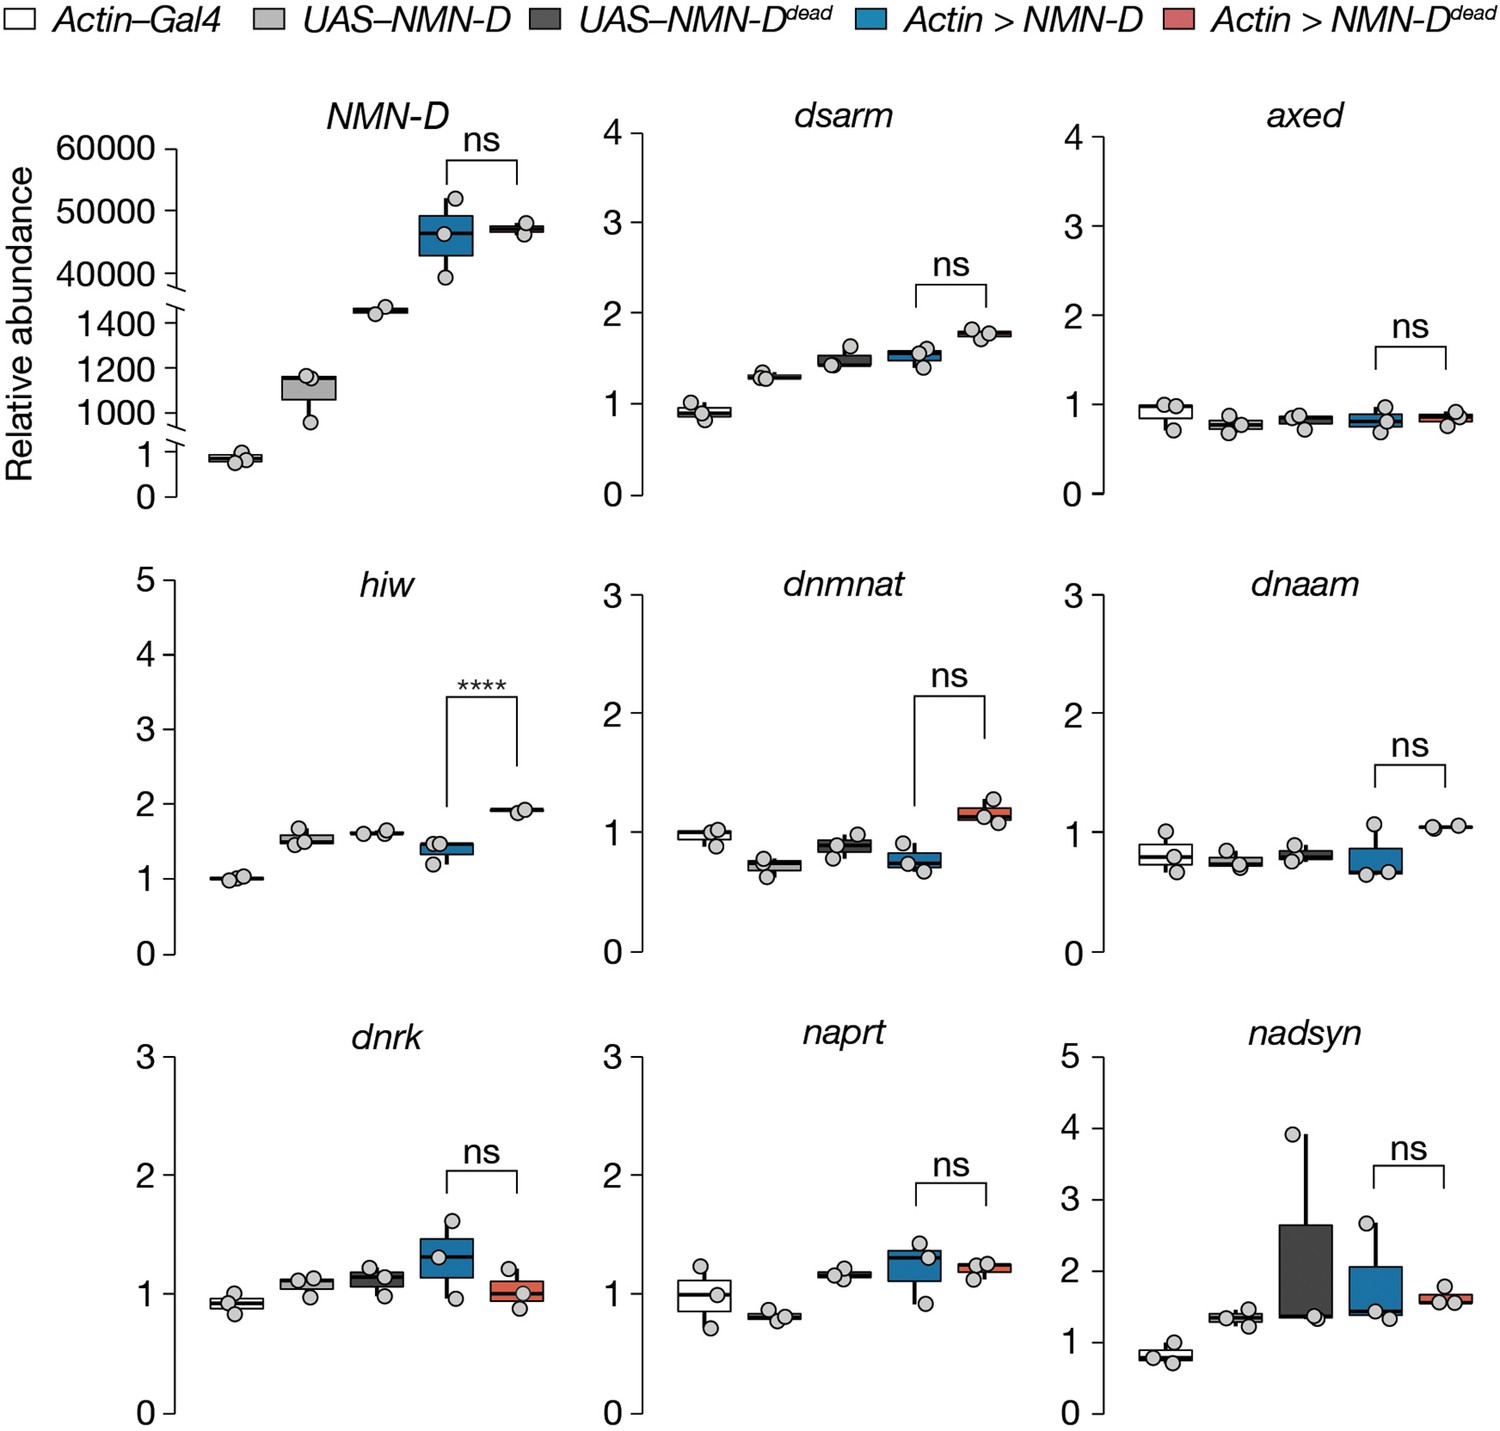
Lower NMN does not alter mRNA abundance of axon death or NAD+ synthesis genes in Drosophila heads.
Data is shown as box and dot plots (n=3). Amplicon primers covered all isoforms of each gene tested. One-way ANOVA with Tukey’s multiple comparisons test, ****=p < 0.0001, ns = p > 0.05.
-
Figure 2—figure supplement 2—source data 1
Raw data of qRT-PCR.
- https://cdn.elifesciences.org/articles/80245/elife-80245-fig2-figsupp2-data1-v2.zip
Figure 3 with 1 supplement
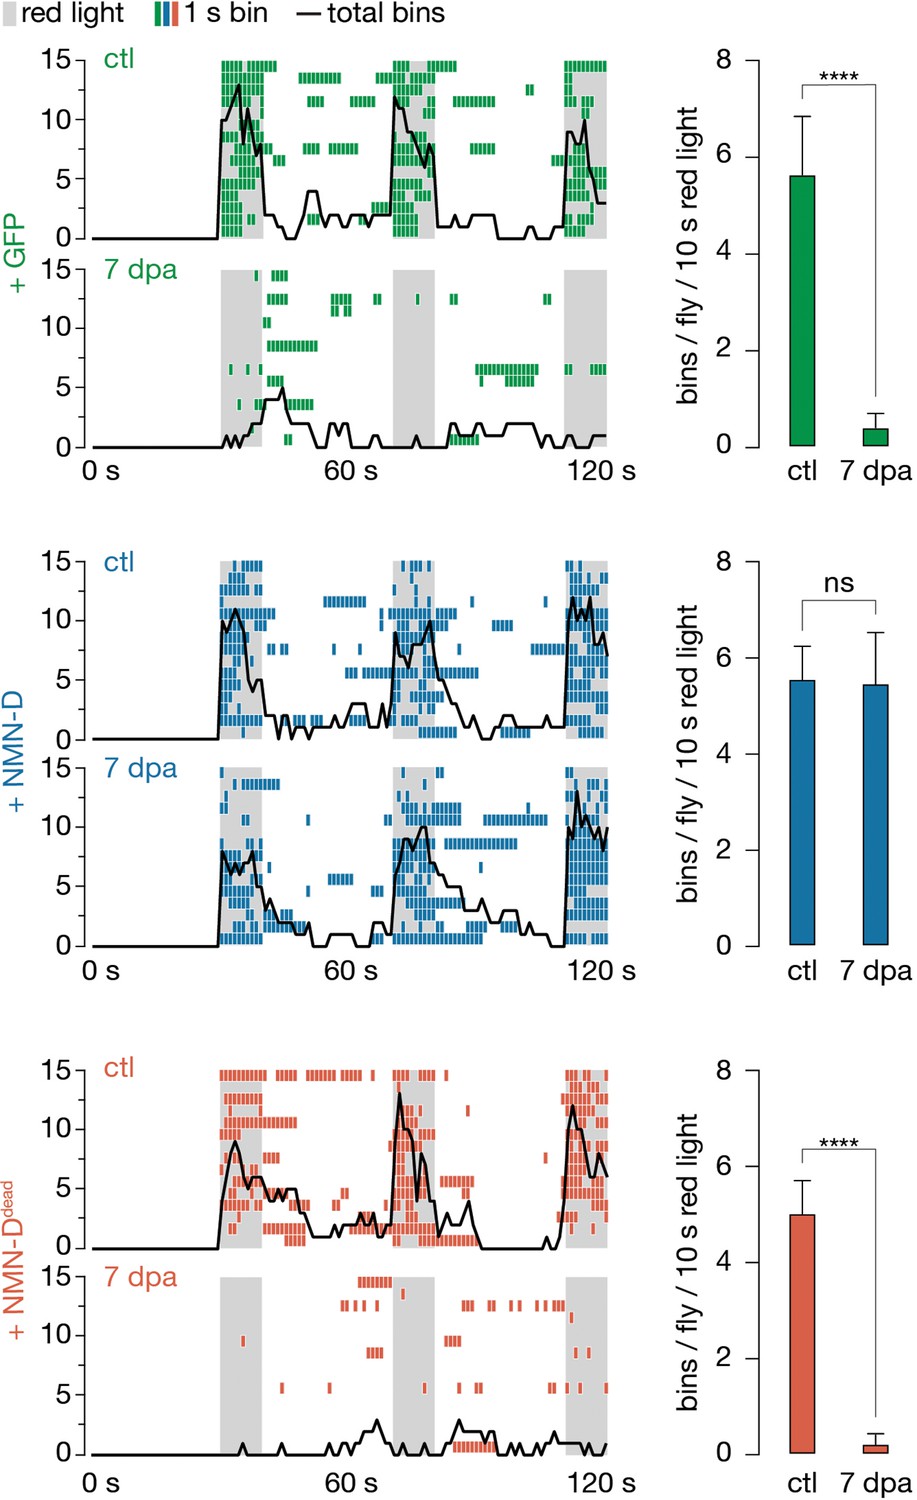
Low neuronal NMN preserves synaptic connectivity at 7 dpa.
Antennal grooming induced by red light. Left: ethograms of uninjured control (ctl) and 7 dpa flies. Gray bars, 10 s red light; colored boxes, bins; black line, sum of bins (n=15 flies). Right: average bins per fly during 10 s red-light exposure (n=15 flies). Two-tailed t-student test, ****=p < 0.0001, ns = p > 0.05.
-
Figure 3—source data 1
Raw data of grooming.
- https://cdn.elifesciences.org/articles/80245/elife-80245-fig3-data1-v2.zip
Figure 3—figure supplement 1
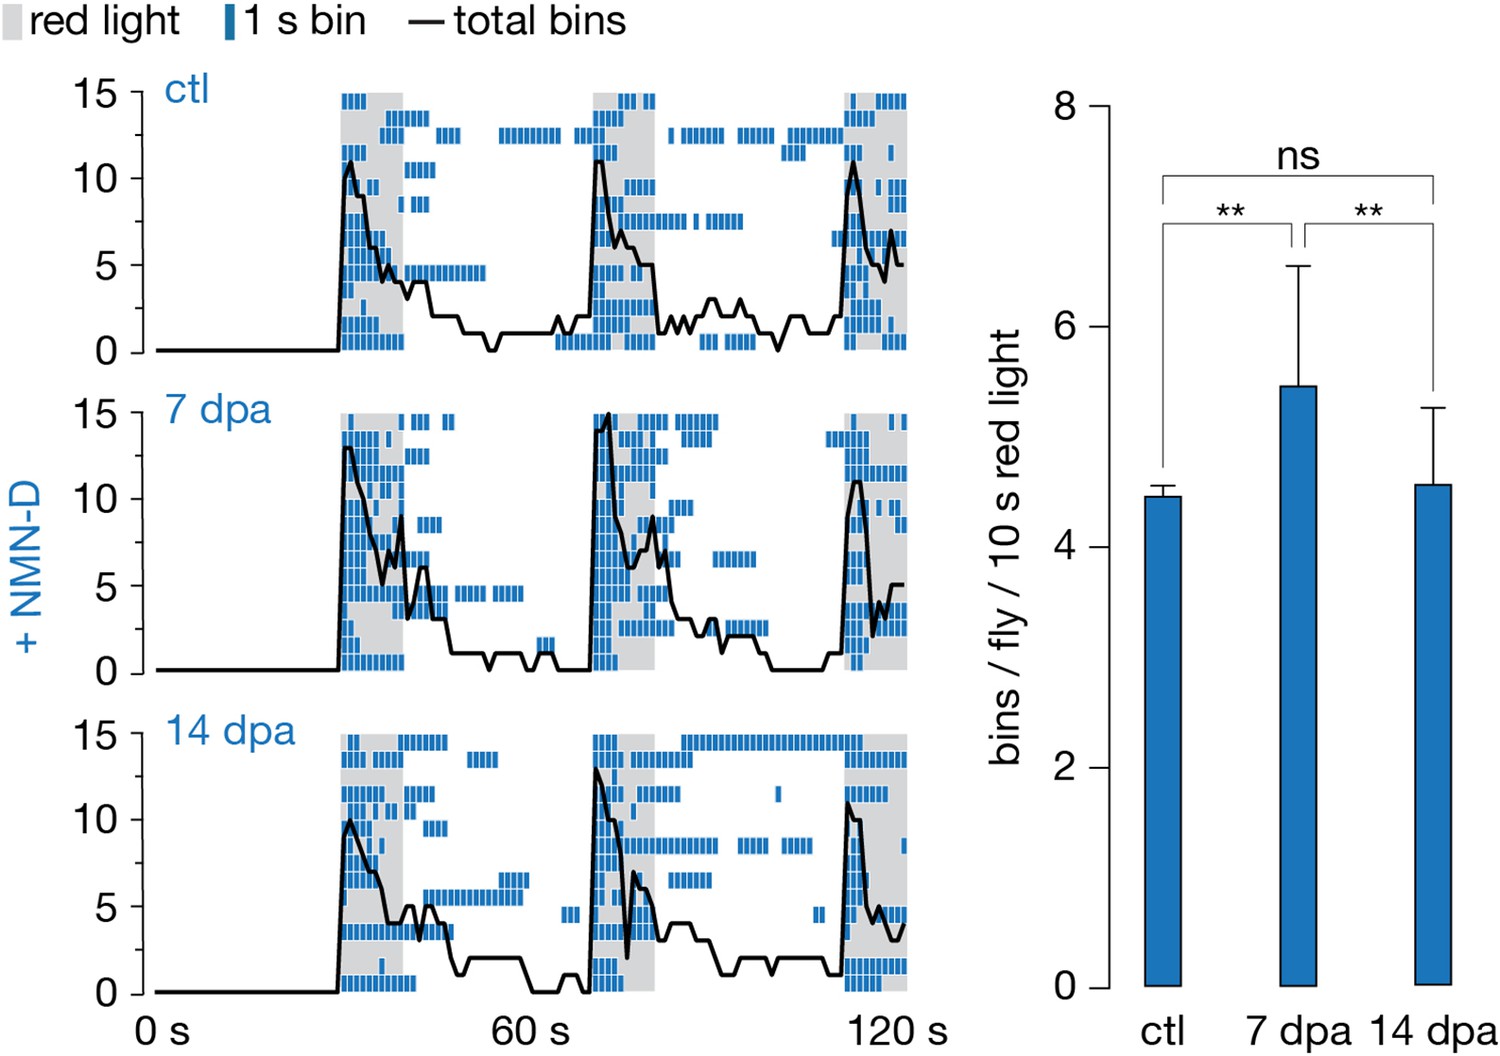
Low neuronal NMN preserves synaptic connectivity for weeks after injury.
Antennal grooming induced by red light. Left: ethograms of uninjured control (ctl), 7 and 14 dpa flies. Gray, 10 s red light; blue boxes; bins; black line, sum of bins (n=15 flies). Right: average bins per fly during 10 s red-light exposure (n=15 flies). Two-tailed t-student test, **=p < 0.01, ns = p > 0.05.
-
Figure 3—figure supplement 1—source data 1
Raw data of grooming.
- https://cdn.elifesciences.org/articles/80245/elife-80245-fig3-figsupp1-data1-v2.zip
Figure 4 with 2 supplements

Faster injury-induced axon degeneration through mammalian NAMPT expression.
(A) Drosophila NAD+ metabolic pathway. Black, metabolites; grey, enzymes; blue, mouse NAMPT (mNAMPT). (B) Detection of mNAMPT expression in heads by Western blot. (C) Subtle changes in NAD+ metabolic flux by mNAMPT expression in fly heads. Genotypes indicated in B. Extracted metabolites from 50 heads, mean ± standard deviation (n=4). Dots, individual measurements. One-way ANOVA with Tukey’s multiple comparisons test. (D) The expression of mNAMPT results in faster axon degeneration after injury. Examples of injured axons at 4 hr post axotomy (hpa). (E) % preservation of injured axons within 12 hr post axotomy (hpa), average ± standard error of the mean (n=20 wings). Multiple unpaired t-tests. (F) Faster axon degeneration by mNAMPT expression requires axon death genes. % preservation of injured axons within 12 hpa, average ± standard error of the mean (n=10 wings) (G) % preservation of injured axons at 7 dpa, average ± standard error of the mean (n=15 wings) ****=p < 0.0001, ***=p < 0.001, *=p < 0.01, ns = p > 0.05.
-
Figure 4—source data 1
Raw data of Western blot, metabolic measurements, and quantification of preserved severed axons.
(B) Raw unedited Western blots and uncropped blots with relevant bands clearly labeled. (C) Raw data of metabolomic measurement. (E) Raw data of quantified preserved severed axons. (F) Raw data of quantified preserved severed axons. (G) Raw data of quantified preserved severed axons.
- https://cdn.elifesciences.org/articles/80245/elife-80245-fig4-data1-v2.zip
Figure 4—figure supplement 1
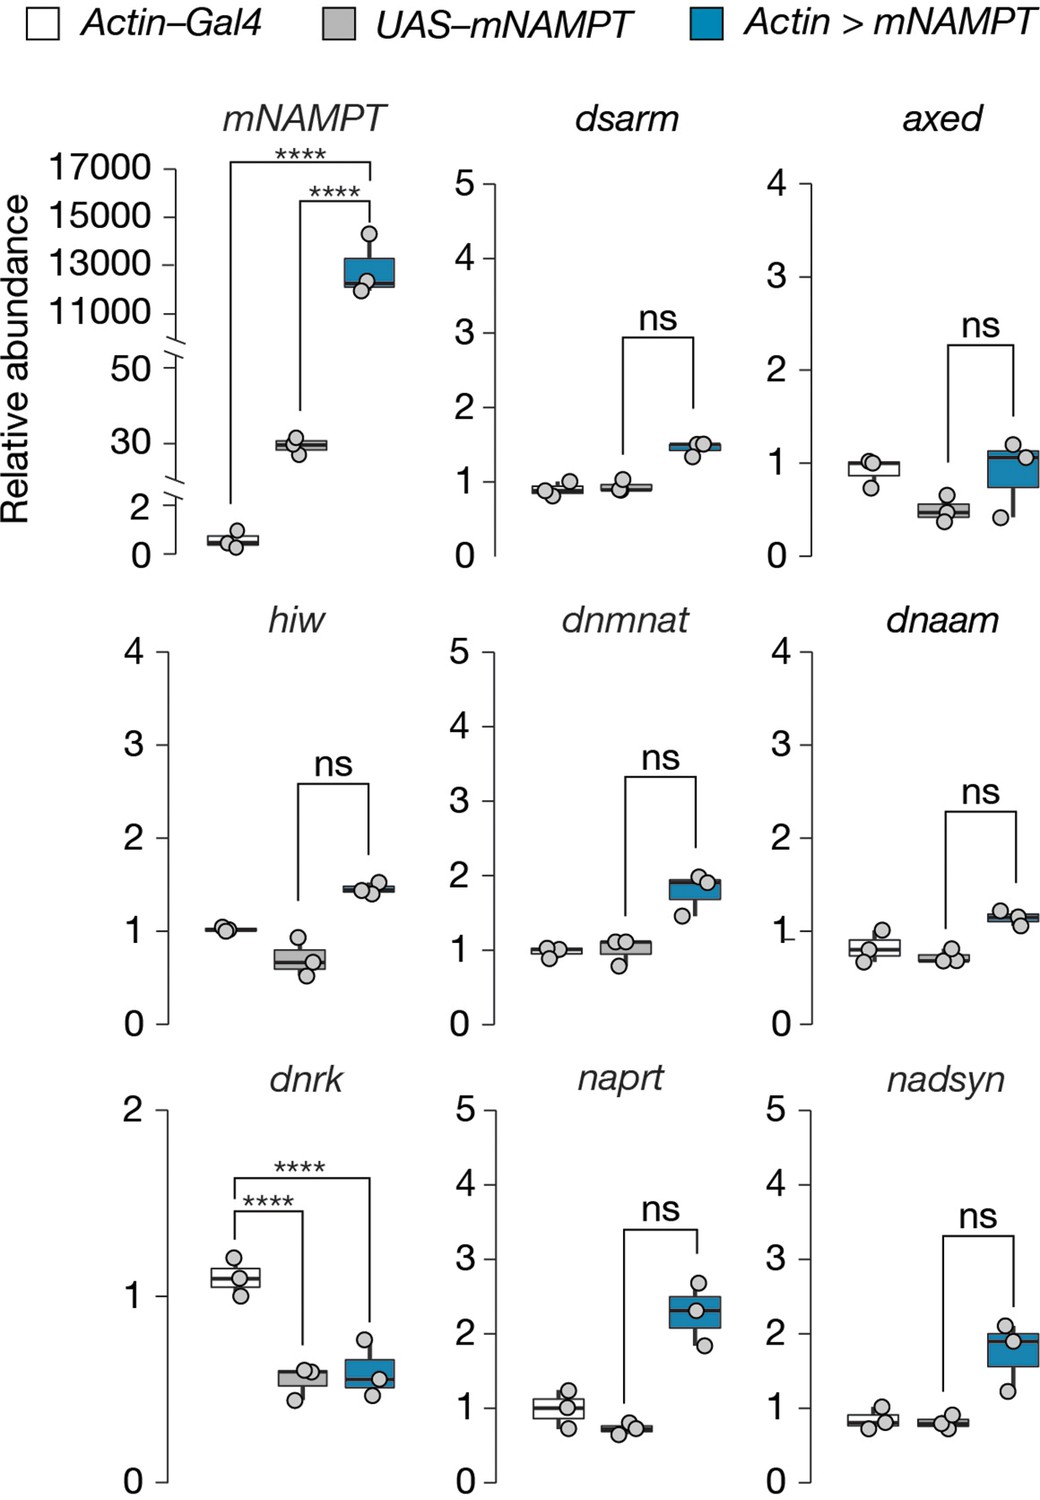
mNAMPT expression does not alter mRNA abundance of axon death or NAD+ synthesis genes in Drosophila heads.
Data is shown as box and dot plots (n=3). Amplicon primers covered all isoforms of each gene tested. One-way ANOVA with Tukey’s multiple comparisons test, ****=p < 0.0001, ns = p > 0.05.
-
Figure 4—figure supplement 1—source data 1
Raw data of qRT-PCR.
- https://cdn.elifesciences.org/articles/80245/elife-80245-fig4-figsupp1-data1-v2.zip
Figure 4—figure supplement 2

Preservation provided by axed is not altered by the expression of mNAMPT.
% preservation of injured axons within 12 hpa and at 7 dpa (left and right, respectively). Average ± standard error of the mean (n=20 wings). One-way ANOVA with Tukey’s multiple comparisons test, ns = p > 0.05.
-
Figure 4—figure supplement 2—source data 1
Raw data of quantified preserved severed axons.
- https://cdn.elifesciences.org/articles/80245/elife-80245-fig4-figsupp2-data1-v2.zip
Figure 5 with 2 supplements
NMN inducibility of dSarm NADase is required for axon degeneration in vivo.
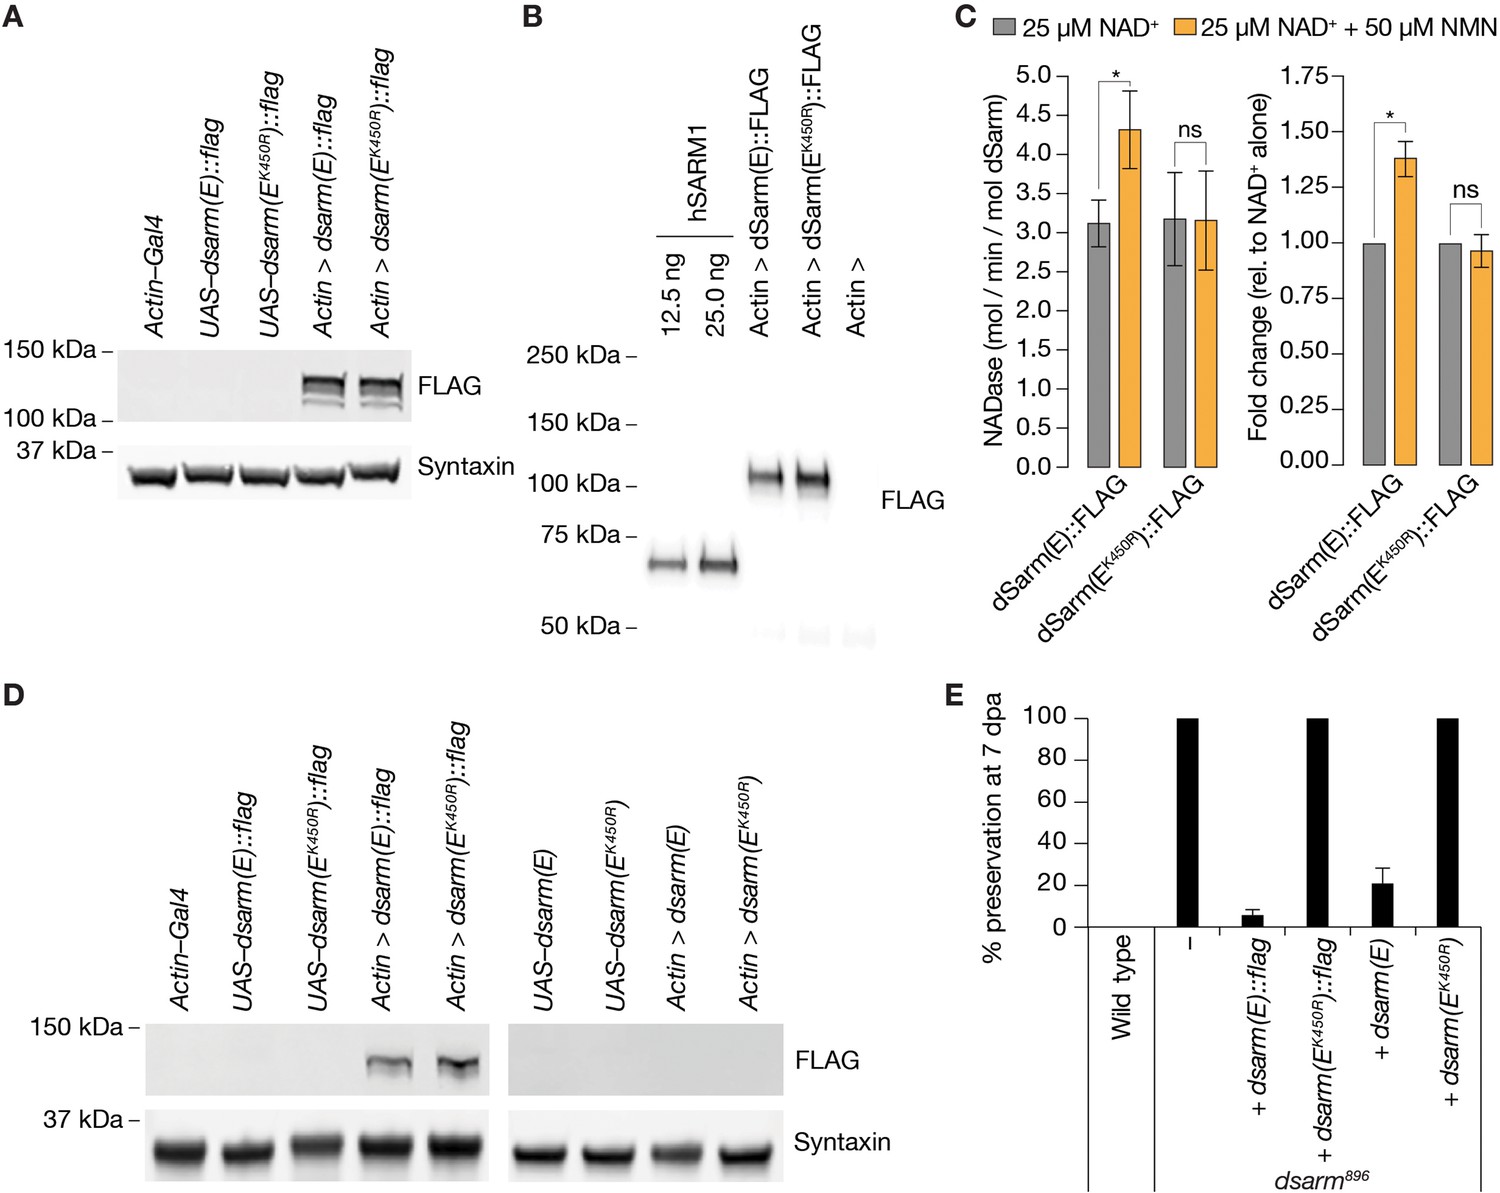
(A) Expression and detection of wild-type and K450R dSarm(E) variants in S2 cells. (B) Immunoblot of immunopurified dSarm(E)::FLAG and dSarm(EK450R)::FLAG. Known amounts of immunopurified human SARM1 (hSARM1) were used to quantify the levels of immunopurified dSarm(E); 12.5 ng=154.5 fmol hSARM1; 25 ng=309 fmol hSARM1 (C) NADase activity of dSarm. Left: NADase activity (mol NAD consumed / min / mol dSarm) of immunopurified dSarm(E)::FLAG and dSarm(EK450R)::FLAG in the presence of 25 µM NAD+, or 25 µM NAD++50 µM NMN. Right: degree of MNM induction (fold-change relative to NAD+ alone). Mean ± standard error of mean (n=7). Control immunoprecipitations (using extracts from Actin–Gal4 transfected S2 cells) revealed no non-specific NAD+-consuming activity on equivalent amounts of bead / antibody complexes compared to that used in the dSarm(E) activity assays (n=7). Multiple paired t-test with false discovery rate (FDR) correction. (D) Equal expression levels of dSarm(E) variants in Drosophila heads. (E) Rescue experiments of dSarm(E) variants in dsarm896 mutant clones. dSarm(E) rescues, while dSarm(EK450R) fails to rescue the dsarm896 axon death defective phenotype. % preservation of severed axons at 7 dpa, average ± standard error of mean (n=15 wings). ns = p > 0.05, *=p < 0.05.
-
Figure 5—source data 1
Raw data of Western blots, NADase activity, and quantification of preserved severed axons.
(A) Raw unedited Western blots and uncropped blots with relevant bands clearly labeled. (B) Raw unedited Western blots and uncropped blots with relevant bands clearly labeled. (C) Raw data of NADglo assay. (D) Raw unedited Western blots and uncropped blots with relevant bands clearly labeled. (E) Raw data of quantified preserved severed axons.
- https://cdn.elifesciences.org/articles/80245/elife-80245-fig5-data1-v2.zip
Figure 5—figure supplement 1
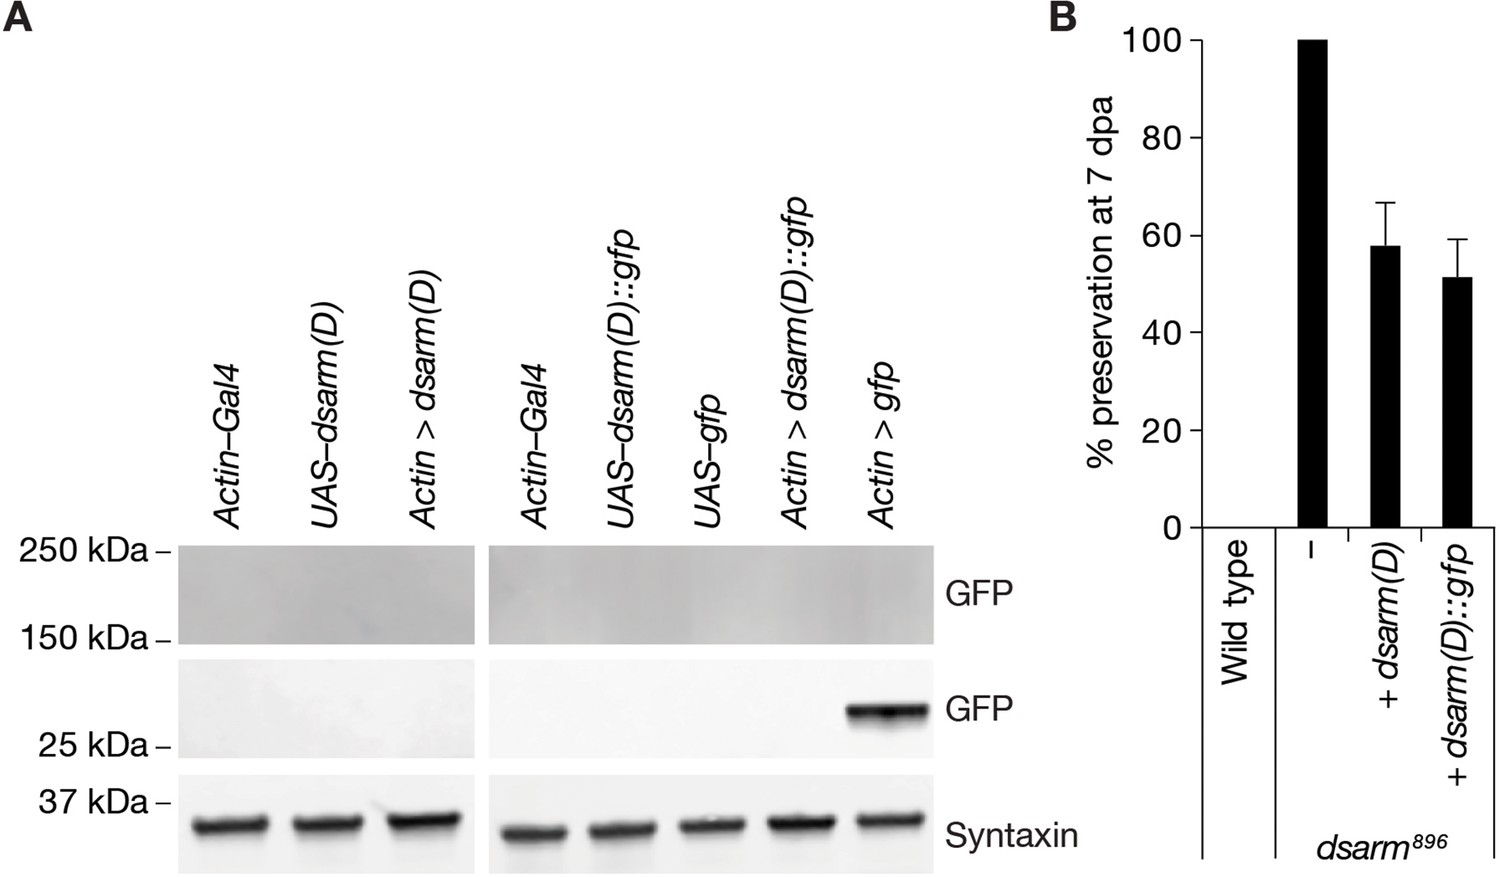
Partial rescue of dsarm896 axon death defective phenotype by dSarm(D) isoform.
(A) dSarm(D)::GFP is not detected by GFP immunoreactivity in Western blots of fly heads. (B) Expression of dSarm(D) and dSarm(D)::GFP partially rescues the dsarm896 axon death defective phenotype. % preservation of injured axons at 7 dpa, average ± standard error of the mean (n=15 wings).
-
Figure 5—figure supplement 1—source data 1
Raw data of Western blots and quantification of preserved severed axons.
(A) Raw unedited western blots and uncropped blots with relevant bands clearly labeled. (B) Raw data of quantified preserved severed axons.
- https://cdn.elifesciences.org/articles/80245/elife-80245-fig5-figsupp1-data1-v2.zip
Figure 5—figure supplement 2
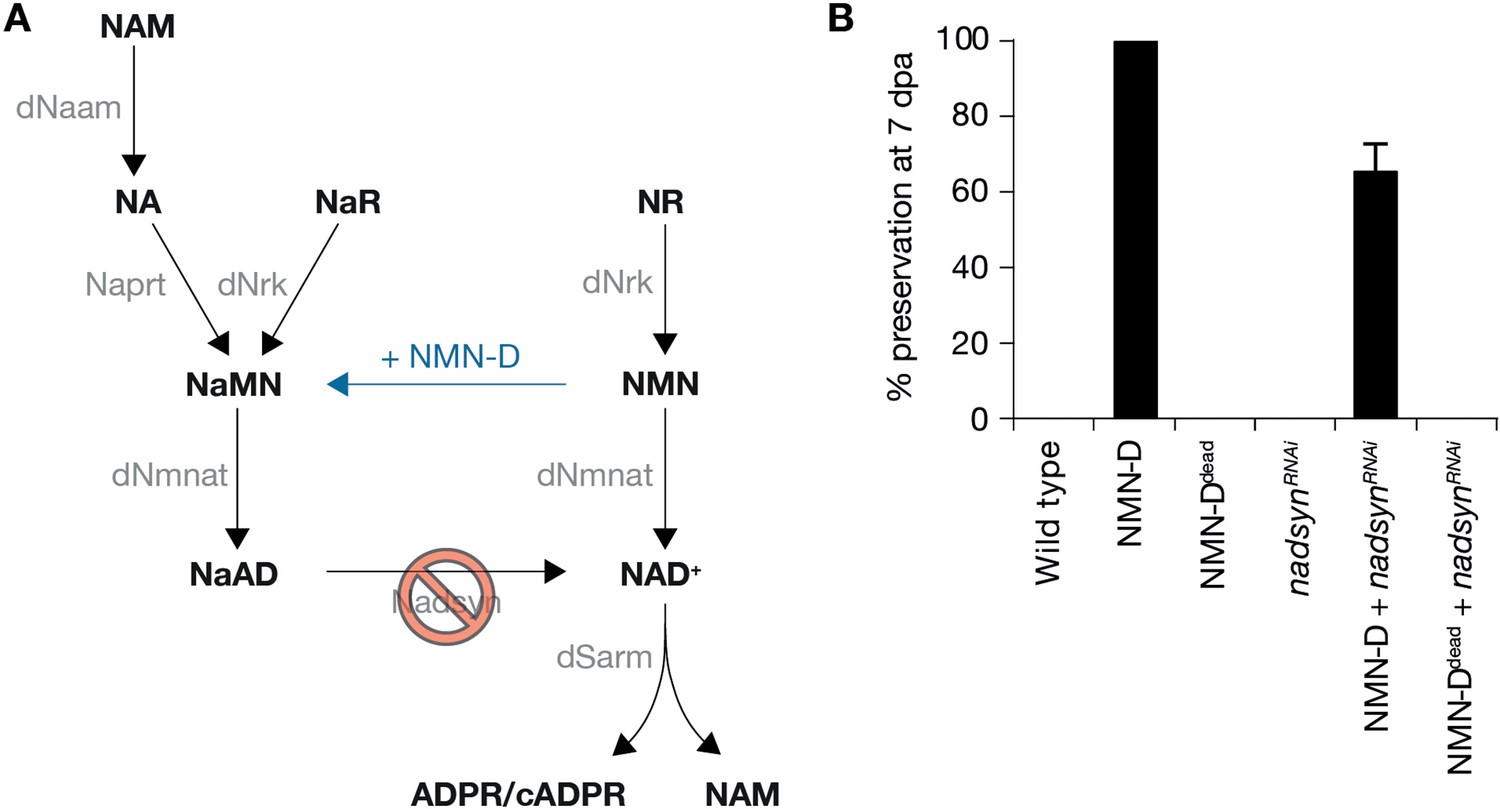
Preservation of severed axons provided by NMN-D requires Nadsyn.
(A) Drosophila NAD+ metabolic pathway. Black, metabolites; grey, enzymes; blue, NMN-D; red prohibition, nadsynRNAi. (B) The preservation provided by NMN-D is partially reverted by nadsynRNAi. % preservation of injured axons at 7 dpa, average ± standard error of the mean (n=15 wings).
-
Figure 5—figure supplement 2—source data 1
Raw data of quantification of preserved severed axons.
(B) Raw data of quantified preserved severed axons.
- https://cdn.elifesciences.org/articles/80245/elife-80245-fig5-figsupp2-data1-v2.zip
Figure 6 with 1 supplement
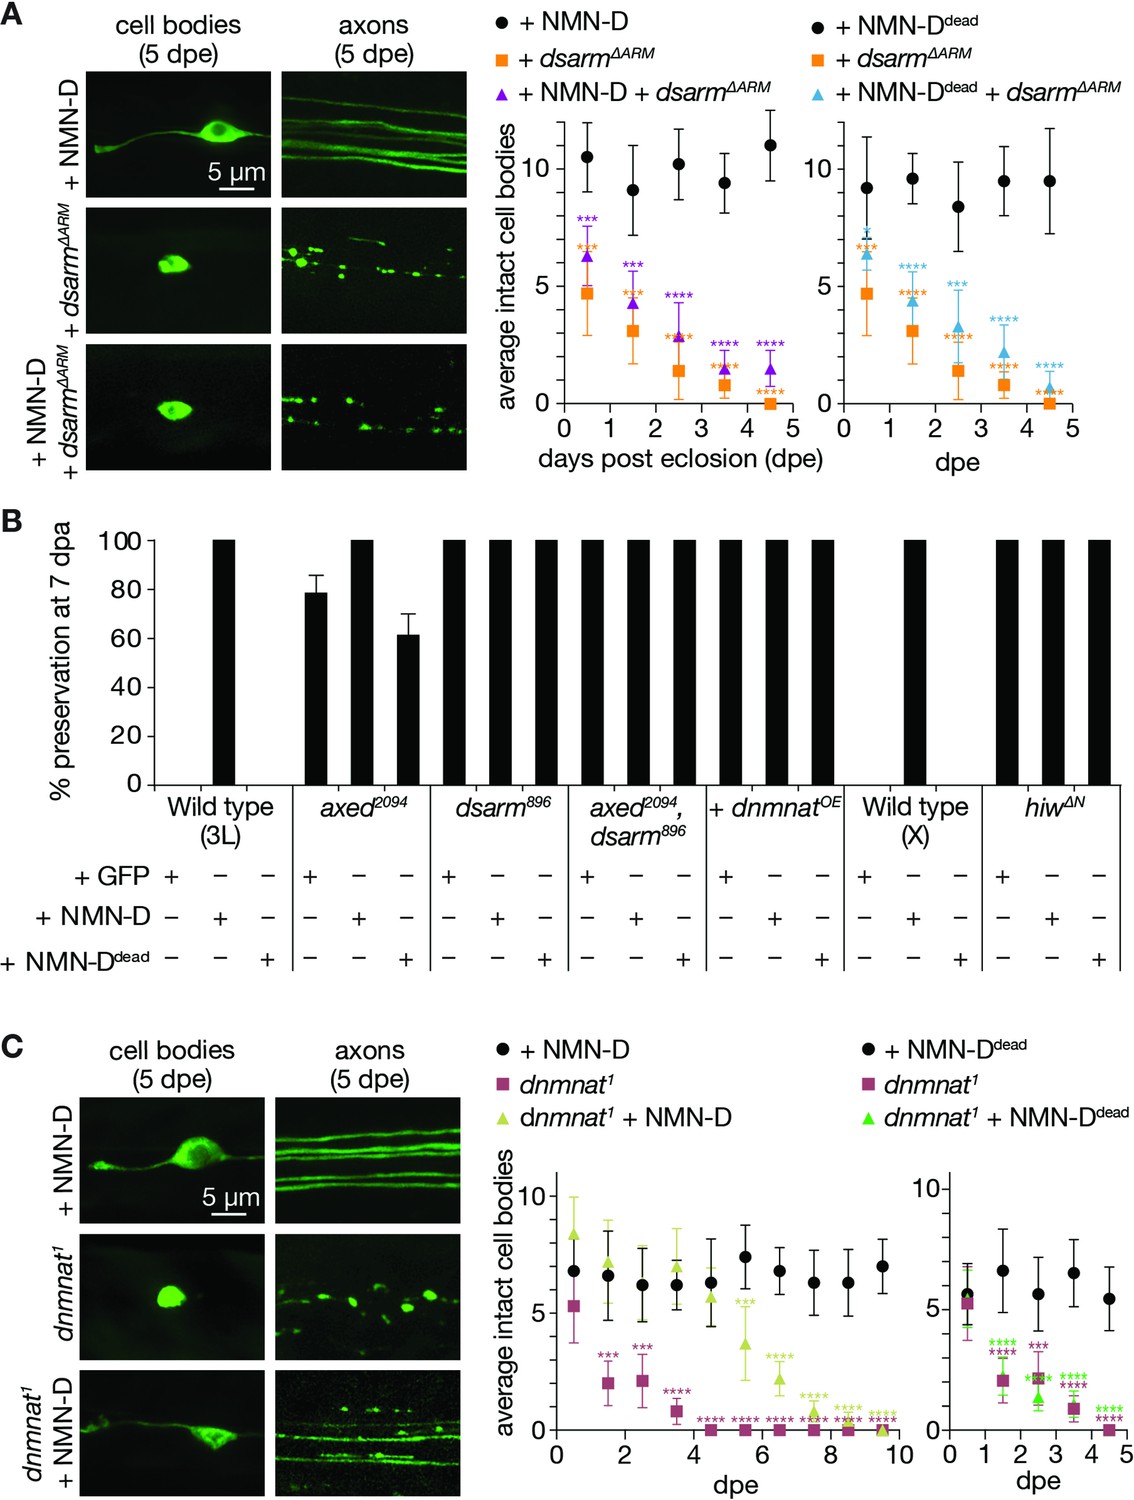
Low neuronal NMN delays neurodegeneration triggered by the loss of dnmnat.
(A) Low NMN fails to prevent neurodegeneration triggered by dSarm∆ARM-mediated NAD+ depletion. Top: examples of cell bodies and axons at 5 days post eclosion (dpe). Bottom: quantification of intact cell bodies, average ±95% confidence interval (CI), (n=10 wings). (B) Epistasis analysis of low NMN with axon death signaling genes. Low NMN does not alter axed, dsarm, hiw, or dnmnat overexpression (+dnmnatOE) phenotypes in the wing injury assay. % preservation of injured axons at 7 dpa, average ± standard error of the mean (n=15 wings). (C) Low NMN delays neurodegeneration triggered by the loss of dnmnat. Top: examples of cell bodies and axons at 5 dpe. Bottom: quantification of intact cell bodies, average ±95% CI, (n=10 wings). Multiple unpaired t-tests. All tests are compared to the control group (e.g., black dots). ****=p < 0.0001, ***=p < 0.001, *=p < 0.05.
-
Figure 6—source data 1
Raw data of time course and quantification of preserved severed axons.
(A) Raw data of quantified intact neuronal cell bodies. (B) Raw data of quantified preserved severed axons. (C) Raw data of quantified intact neuronal cell bodies.
- https://cdn.elifesciences.org/articles/80245/elife-80245-fig6-data1-v2.zip
Figure 6—figure supplement 1
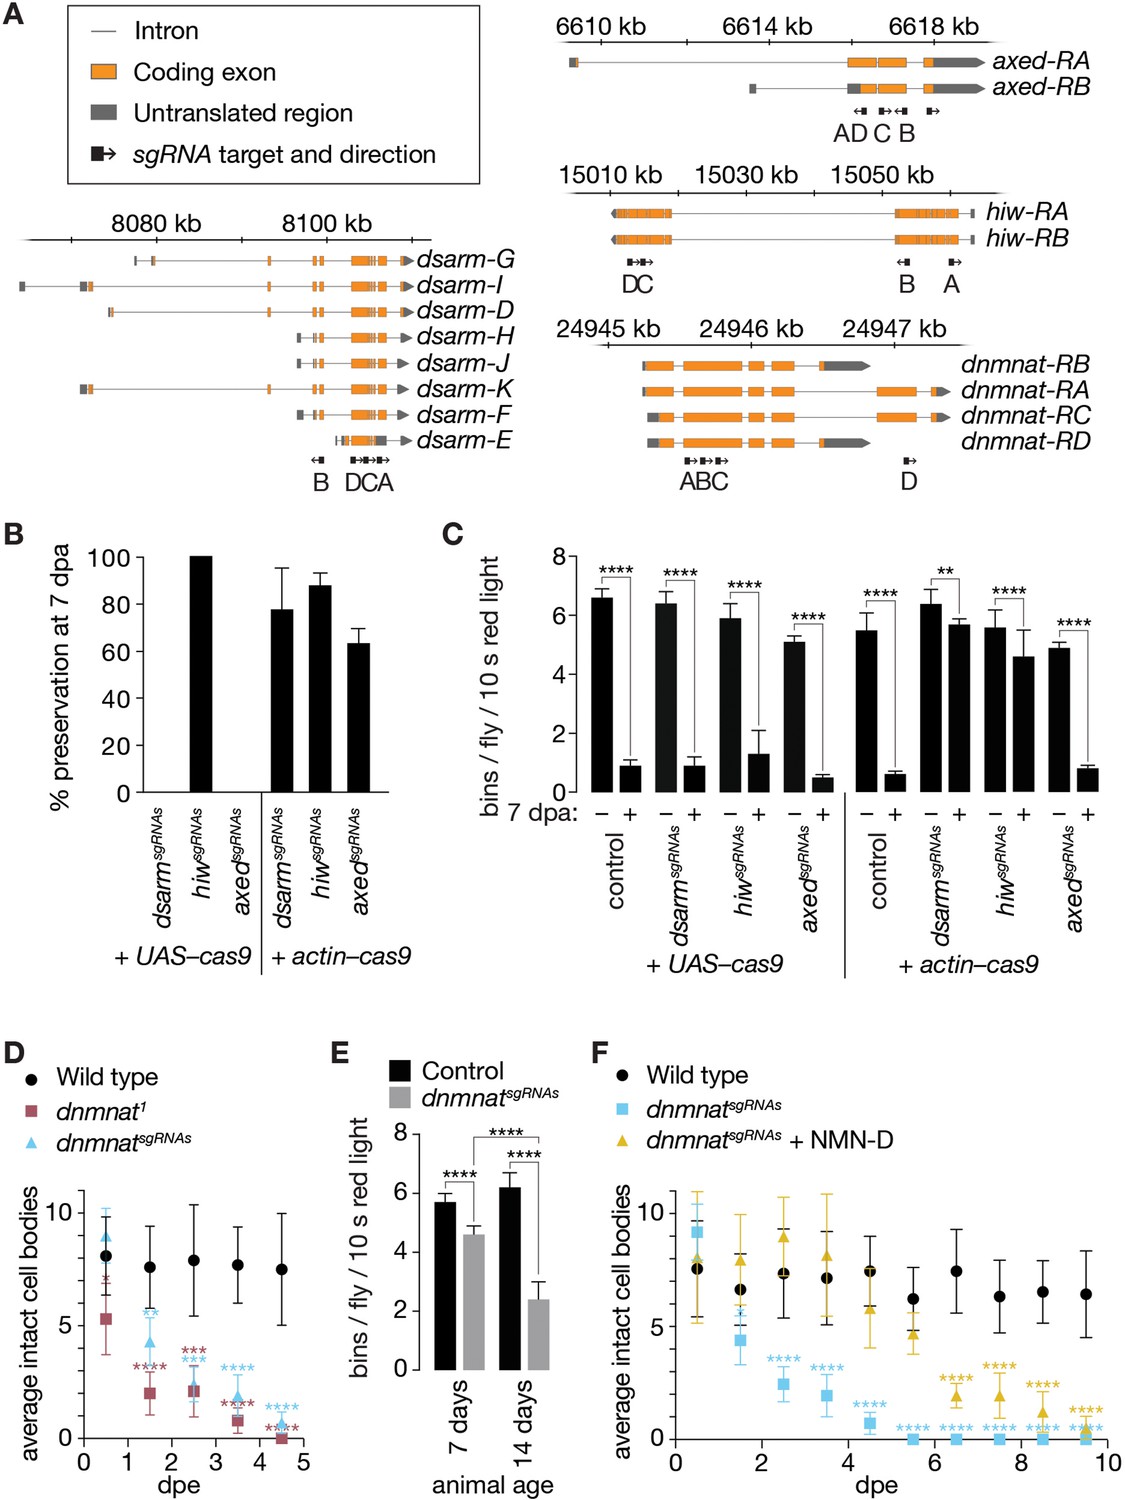
Newly generated sgRNAs targeting axon death genes.
(A) Targets and orientation of axon death gene sgRNAs. Schematic genomic loci and indicated isoforms. Black arrows, sgRNA target and orientation. (B) Preservation of severed axons by attenuated axon death CRISPR/Cas9 tools depends on Cas9 source. % preservation of severed axons (average ± 95% CI) at 7 dpa (n=15 wings). (C) Preservation of synaptic connectivity after injury by attenuated axon death CRISPR/Cas9 tools depends on Cas9 source. Quantification of bins, average ± standard deviation (n=15 flies). Two-way ANOVA with Tukey’s multiple comparisons test. (D) Activation of axon death by targeting dnmnat with CRISPR/Cas9 phenocopies dnmnat1 mutants (dnmnatsgRNAs + UAS-cas9). Quantification of intact cell bodies, average ± 95% CI (n=10 wings). Multiple unpaired t-tests. All tests are compared to the control group (e.g. black dots). (E) Activation of axon death by targeting dnmnat with CRISPR/Cas9 reduces evoked grooming behavior over time (dnmnatsgRNAs + UAS–cas9). Quantification of bins, average ± standard deviation (n=15 flies). Two-way ANOVA with Tukey’s multiple comparisons test. (F) Low NMN delays degeneration in CRISPR/Cas9-targeted dnmnat neurons (dnmnatsgRNAs + UAS–cas9). Quantification of intact cell bodies, average ± 95% CI (n=10 wings). Multiple unpaired t-tests. All tests are compared to the control group (e.g. black dots). ****=p > 0.0001, ***=p < 0.001, **=p > 0.01, *=p < 0.05.
-
Figure 6—figure supplement 1—source data 1
Raw data of quantification of preserved severed axons, antennal grooming, and time course.
(B) Raw data of quantified preserved severed axons. (C) Raw data of grooming. (D) Raw data of quantified intact neuronal cell bodies. (E) Raw data of grooming. (F) Raw data of quantified intact neuronal cell bodies.
- https://cdn.elifesciences.org/articles/80245/elife-80245-fig6-figsupp1-data1-v2.zip
Author response image 1
Videos
Video 1
Examples of red light-stimulated wild-type flies expressing CsChrimson and GFP in JO neurons, uninjured and at 7 dpa. Chamber diameter, 2 cm.
Video 2
Examples of red light-stimulated wild-type flies expressing CsChrimson and GFP::NMN-D in JO neurons, uninjured and at 7 dpa. Chamber diameter, 2 cm.
Video 3
Examples of red light-stimulated wild-type flies expressing CsChrimson and GFP::NMN-Ddead in JO neurons, uninjured and at 7 dpa. Chamber diameter, 2 cm.
Additional files
-
MDAR checklist
- https://cdn.elifesciences.org/articles/80245/elife-80245-mdarchecklist1-v2.docx
-
Source data 1
Genotypes in each display item.
Abbreviations: mCD8::GFP = UAS–mCD8::GFP, dpr1=dpr1–Gal4
- https://cdn.elifesciences.org/articles/80245/elife-80245-data1-v2.xlsx
Download links
A two-part list of links to download the article, or parts of the article, in various formats.
Downloads (link to download the article as PDF)
Open citations (links to open the citations from this article in various online reference manager services)
Cite this article (links to download the citations from this article in formats compatible with various reference manager tools)
The NAD+ precursor NMN activates dSarm to trigger axon degeneration in Drosophila
eLife 11:e80245.
https://doi.org/10.7554/eLife.80245


