Transient regulation of focal adhesion via Tensin3 is required for nascent oligodendrocyte differentiation
- Paris Brain Institute, Sorbonne Université, Inserm U1127, CNRS UMR 7225, Hôpital Pitié‐Salpêtrière, France
- Department of Biochemistry and Molecular Medicine, University of California, Davis, United States
- School of Pharmacy and Biomedical Sciences, University of Portsmouth, United Kingdom
Figures
Figure 1 with 3 supplements
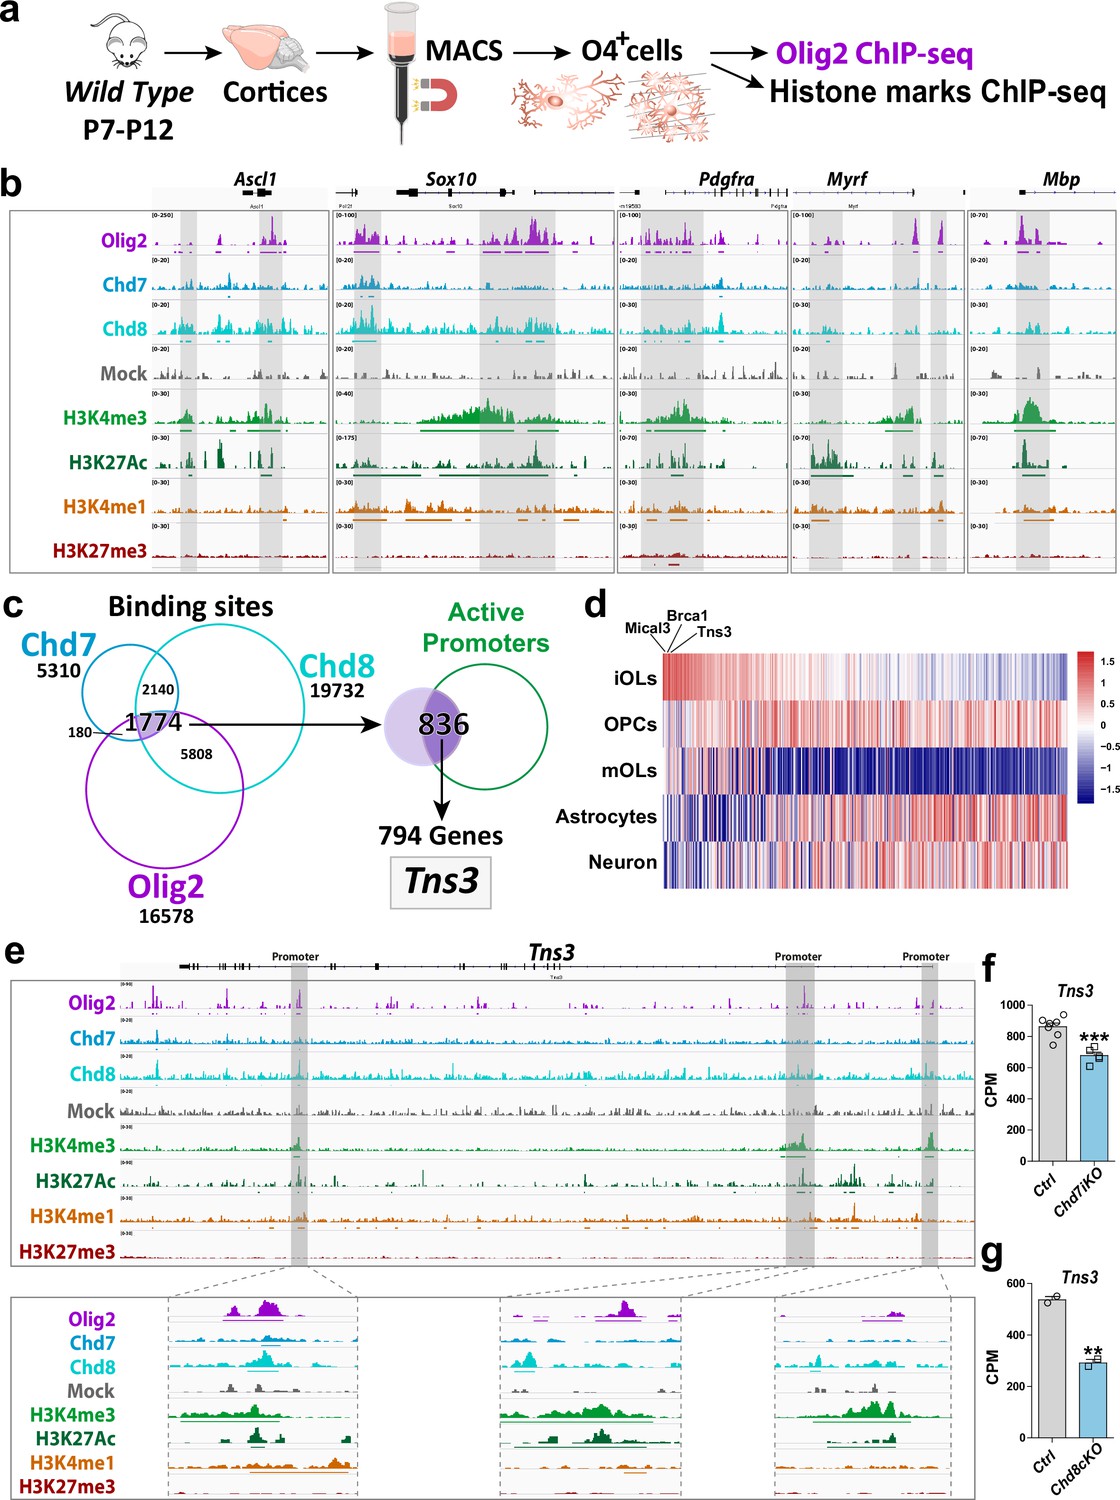
Tns3 is a target gene of Olig2 and Chd7/8 regulators of oligodendrocyte differentiation.
(a) Scheme representing MACSorting of O4+ cells from wild-type cortices followed by ChIP-seq for Olig2 and histone marks (H3K4me3, H3K27Ac, H3K4me1, and H3K27me3). (b) Tracks from IGV browser of Ascl1, Sox10, Pdgfra, Myrf, and Mbp gene regions depicting ChIP-seq data in O4+ cells (OPCs/OLs) for transcription factor Olig2, chromatin remodelers Chd7 and Chd8, and epigenetic marks (H3K4me3, H3K27ac, H3K4me1, and H3K27me3). Mock (control IgG) shows no peaks in the regions of interest. Lines present below peaks indicate statistical significance (by peak calling). (c) Strategy used to identify Tns3 as a gene target of Olig2, Chd7, and Chd8, potentially involved in oligodendrogenesis. Left: Venn diagrams depicting the overlap of binding peaks between Chd7 (blue), Chd8 (cyan), and Olig2 (purple) in O4+ cells. Right: Venn diagram showing that 836 (47%) of the 1774 common regions have marks of active promoters, corresponding to 794 genes, including Tns3. (d) Heatmap representing the expression of the 794 genes in immature oligodendrocytes (iOLs) compared to oligodendrocyte precursor cells (OPCs), myelinating oligodendrocytes (mOLs), astrocytes, and neurons. Tns3 is the third most specific (data from Zhang et al., 2014). (e) Tracks from IGV browser of Tns3 gene region depicturing ChIP-seq data in O4+ cells (OPCs/OLs) for transcription factor Olig2 and epigenetic marks (H3K4me3, H3K27ac, H3K4me1, and H3K27me3), zooming in Tns3 alternative promoters. Mock (control IgG) shows no peaks in the regions of interest. Horizontal lines present below peaks indicate statistical significance (peak calling). (f, g) Barplots showing Tns3 transcript count per million (CPM) in O4+ cells upon tamoxifen-induced Chd7 deletion (Chd7iKO), (f) or Chd8 deletion (Chd8cKO), (g) compared to control (Ctrl). Statistics done using edgeR suite.
Figure 1—figure supplement 1
Tns3 is a target gene of Olig2 and Chd7/8 regulators of oligodendrocyte differentiation.
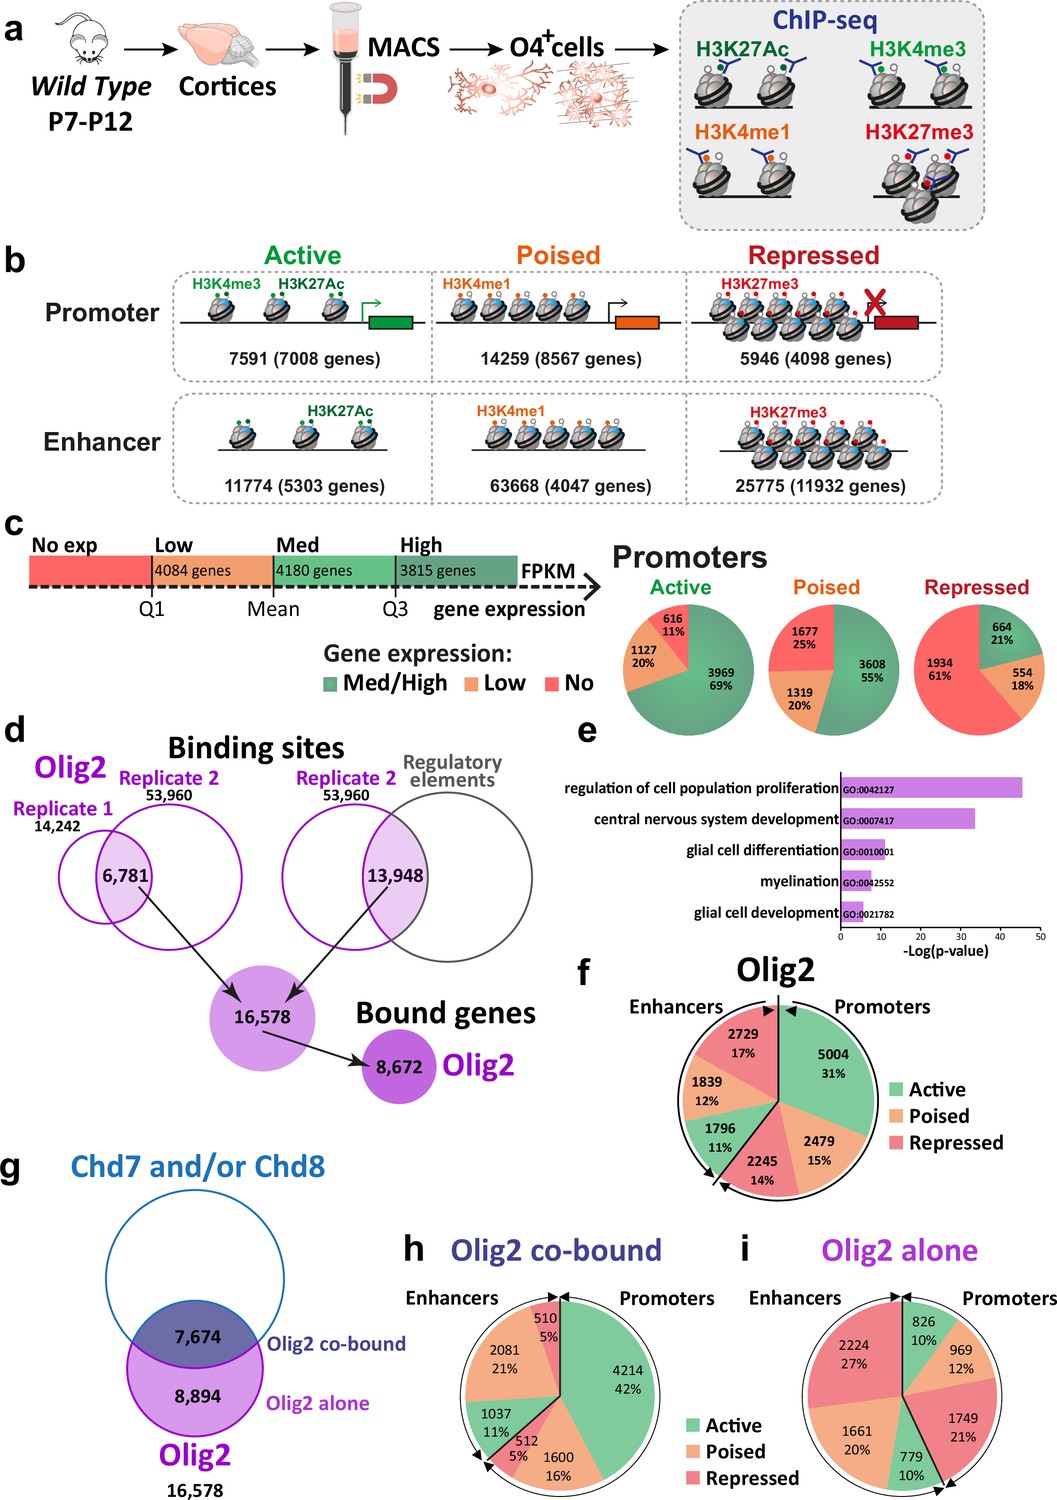
(a) Scheme representing MACSorting of O4+ cells from wild-type cortices followed by ChIP-seq for histone marks H3K4me3, H3K27Ac, H3K4me1, and H3K27me3. (b) Schematic representing gene regulatory elements in O4+ cells as active, poised, and repressed, according to their histone marks. (c) Left: diagram representing the classification of gene expression (data from Marie et al., 2018). Right: pie chart representing percentage of medium-to-high, low or not expressed genes having an active, poised, and repressed promoter in O4+ cells. Note the high percentage of medium-to-high expressed genes having active marks in their promoter and the high percentage of not expressed genes having repression marks in their promoter. (d) Venn diagram representing the method used to determine Olig2 binding peaks. As the quality of the peaks in replicate 2 was better than in replicate 1, we considered peaks common in both replicate and the peaks of replicate 2 that were present in regulatory elements (regions with histone marks). 16,578 peaks were found corresponding to 8672 genes bound by Olig2. (e) Gene Ontology category found enriched in Olig2-bound genes. (f) Pie chart representing the number and repartition of Olig2-binding sites in regulatory regions with different activity histone marks. Note that Olig2 binds in both promoters (60%) and enhancers (40%), and that it is found in either active, poised, or repressed regions. (g) Venn diagram representing the amount of Olig2-binding sites that are also bound by Chd7 and/or Chd8 (7674; Olig2 co-bound) or not (8894; Olig2 alone). (h, i) Pie chart representing the number and repartition of Olig2 co-bound (h) or alone (i) sites in regulatory regions with different activity histone marks. Note that 42% Olig2 co-bound sites are in active promoters, whereas 48% of Olig2 alone sites are in repressed promoter or enhancers.
Figure 1—figure supplement 2
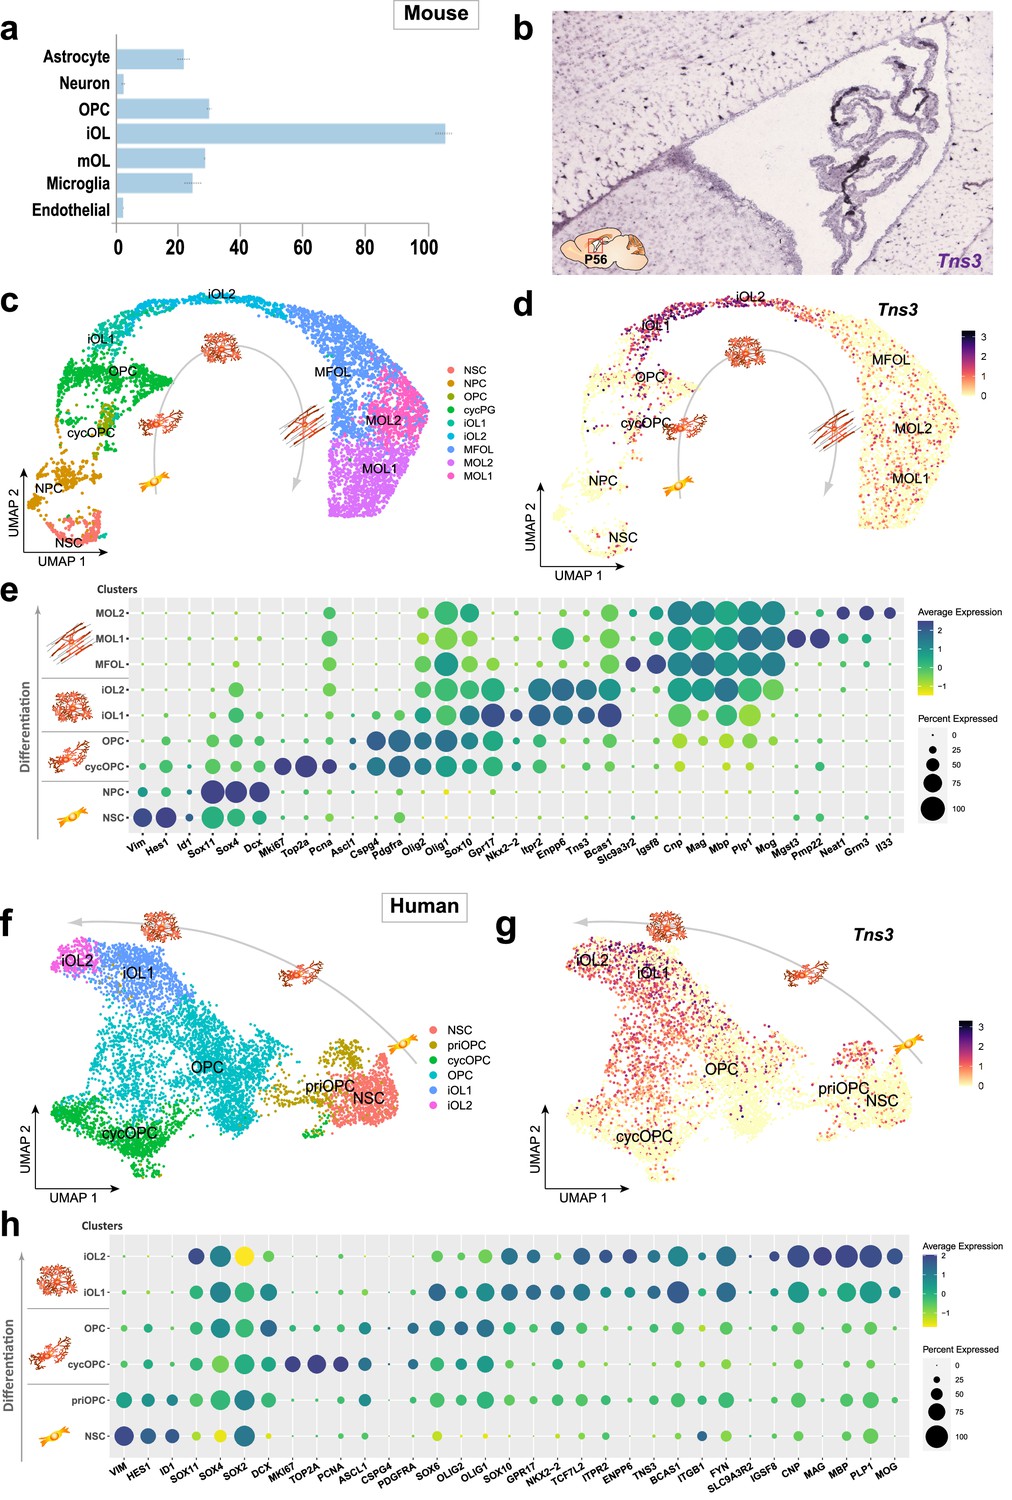
Strong expression of Tns3 transcripts in mouse and human immature oligodendrocytes.
(a) Barplot of Tns3 mRNA transcript levels (FKPM) in postnatal brain cell types (Zhang et al., 2014; brainrnaseq.org). (b) In situ hybridization in sagittal section of the adult (P56) mouse brain at the level of the lateral ventricles showing Tns3 transcript expression in sparse white matter cells (Allen Brain Atlas, portal.brain-map.org). (c) Uniform manifold approximation and projection (UMAP) representation of neural progenitors and oligodendroglial cells extracted and integrated using Seurat from scRNA-seq datasets (Marques et al., 2016), representing different clusters corresponding to different oligodendroglial stages of neural stem cells (NSCs) to myelinating oligodendrocytes (mOLs). (d) Feature plot representing relative expression levels of Tns3 transcript. (e) Dot plot representing the transcript expression of key markers for each cell stage/subtype and key oligodendroglial factors in the different clusters showing the predominant expression of Tns3 in iOL1s and iOL2s clusters, similar to Enpp6 and Itpr2. NPC, neural progenitor cells; cycOPC, cycling OPC; MFOL, myelin-forming OL; MOL1/2, myelinating OL 1/2. (f–h) TNS3 expression in human oligodendroglial cells differentiated from iPSCs by scRNA-seq (Chamling et al., 2021), showing TNS3 high levels of expression in immature oligodendrocytes. (f) Uniform manifold approximation and projection (UMAP) representation showing six clusters (NSC, cycOPC, OPCs, and two iOL stages, iOL1 and iOL2, similar to mouse oligodendroglia). (g) Feature plot showing TNS3 expression levels. (h) Dot plots showing TNS3 expression pattern together with key markers of each cluster and regulators of oligodendrogenesis.
Figure 1—figure supplement 3

Strong expression of Tns3 transcripts in immature oligodendrocytes (iOLs) of human fetal cerebellum.
(a) Uniform manifold approximation and projection (UMAP) representation of different cell-type cluster found in human fetal cerebellum (GW 9–22), including oligodendrocyte precursor cells (OPCs) and iOLs clusters (blue circle). (b) Feature plot representing relative expression levels of Tns3 transcript, presenting high levels in iOL cluster cells (c) Dot plot representing the transcript expression of key markers for each cell stage/subtype and key oligodendroglial factors in the different clusters showing the predominant expression of TNS3 in iOLs clusters (OPC and iOL clusters highlighted by blue rectangle). (d) UMAP representation of new clustering of oligodendroglial cells (11-OPC and 12-iOL clusters) showing OPCs, cycling (cyc) OPCs, and iOLs. (e) Feature plot representing relative expression levels of TNS3 transcript showing highest levels in iOL cells. (f) Dot plot showing TNS3 expression pattern together with key markers of each cluster and regulators of oligodendrogenesis, showing similar expression pattern of TNS3 and other suggested iOL markers (including ITPR2, ENPP6, and BCAS1).
Figure 2 with 4 supplements

Tns3 protein is detected at high levels in the cytoplasm and main cell processes of immature oligodendrocytes (iOLs) in the postnatal brain.
Immunofluorescence in sagittal sections of postnatal brain at the level of the corpus callosum at P14 (a–c) and P21 (d-e) using V5 and Tns3 antibodies. (a) Tns3-V5 is detected at high levels in CC1+ OLs (arrows) but not in PDGFRα+ oligodendrocyte precursor cells (OPCs). (b) Tns3-V5 expression overlaps well with Itpr2 (arrows), with some of them being Olig1high-cytoplamic cells. (c) Tns3-V5 overlaps with high levels of Nkx2.2 expression (arrows) and also with Nkx2.2-/Olig1high-cytoplamic cells (arrowheads). (d) Tns3-V5 expression overlaps with Opalin in iOLs (arrows, CC1+ cells with large cytoplasm) but is downregulated in Opalin+ myelinating oligodendrocytes (mOLs) (arrowheads, CC1+ cells with small cytoplasm and myelin segments). (e) Tns3 (Sigma-Ct antibody) is detected at high levels in Nkx2.2+/Olig1- early iOL1s (white arrows), in late Nkx2.2-/Olig1- iOL1s (white arrowheads), and in Nkx2.2-/Olig1high-cytoplamic iOL2s (gray arrows). (f) Tns3-V5 expression neural stem cell (NSC) cultures after 5 days in differentiation. Note the Tns3 expression in Nkx2.2+/CNP+ OLs (arrows). (g) Subcellular localization of Tns3 expression in CNP+ OLs present in the cytoplasm and in dots distributed along the cell processes, overlapping with CNP signal (arrows). (h) Schematic representation of Tns3 expression together with key markers of different oligodendroglial stages summarizing data shown in (a–e). (i) Histograms representing the percentage of Nkx2.2-/Olig1high-nuclear, Nkx2.2high/Olig1-, Nkx2.2low/Olig1low-cytoplamic and Nkx2.2-/Olig1high-cytoplamic cells expressing Tns3-V5 and Tns3 at P14. (j) Histograms representing the percentage of Tns3-V5+ and Tns3+ cells at P14 that are Nkx2.2-/Olig1high-nuclear, Nkx2.2high/Olig1-, Nkx2.2low/Olig1low-cytoplamic and Nkx2.2-/Olig1high-cytoplamic. (k) Schematic representation of Tns3 expression and subcellular localization in oligodendroglia. Scale bars: (a–f) 20 μm; (g) 10 μm.
Figure 2—figure supplement 1
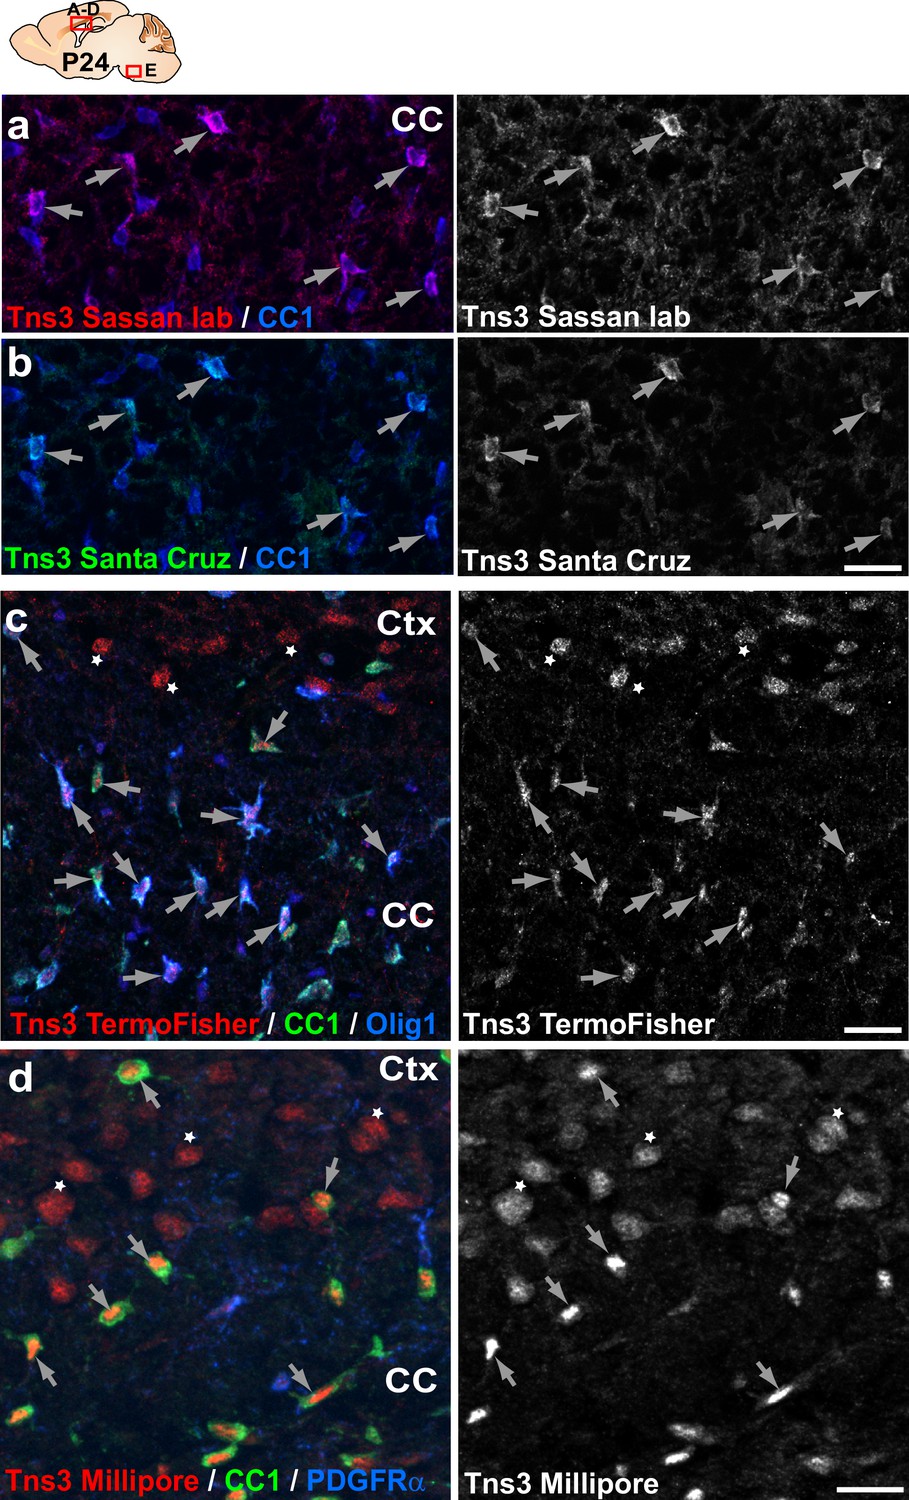
Immunodetection of Tns3 protein in immature oligodendrocytes (OLs) of the postnatal brain.
(a–d) Tns3 expression in CC1+ OLs (arrows) at the level of the corpus callosum (CC) of P24 mice, using a homemade antibody from Sassan Hafizi lab (University of Portsmouth) (a), and commercial antibodies from Santa Cruz (b), Thermo Fisher (c), and Millipore (d). Note that Millipore antibody is the only one to show clear nuclear localization in OLs. Thermo Fisher and Millipore antibodies also recognize a nuclear signal in cortical neurons (c, d, stars), not found with other Tns3 antibodies. Scale bar, 20 μm.
Figure 2—figure supplement 2
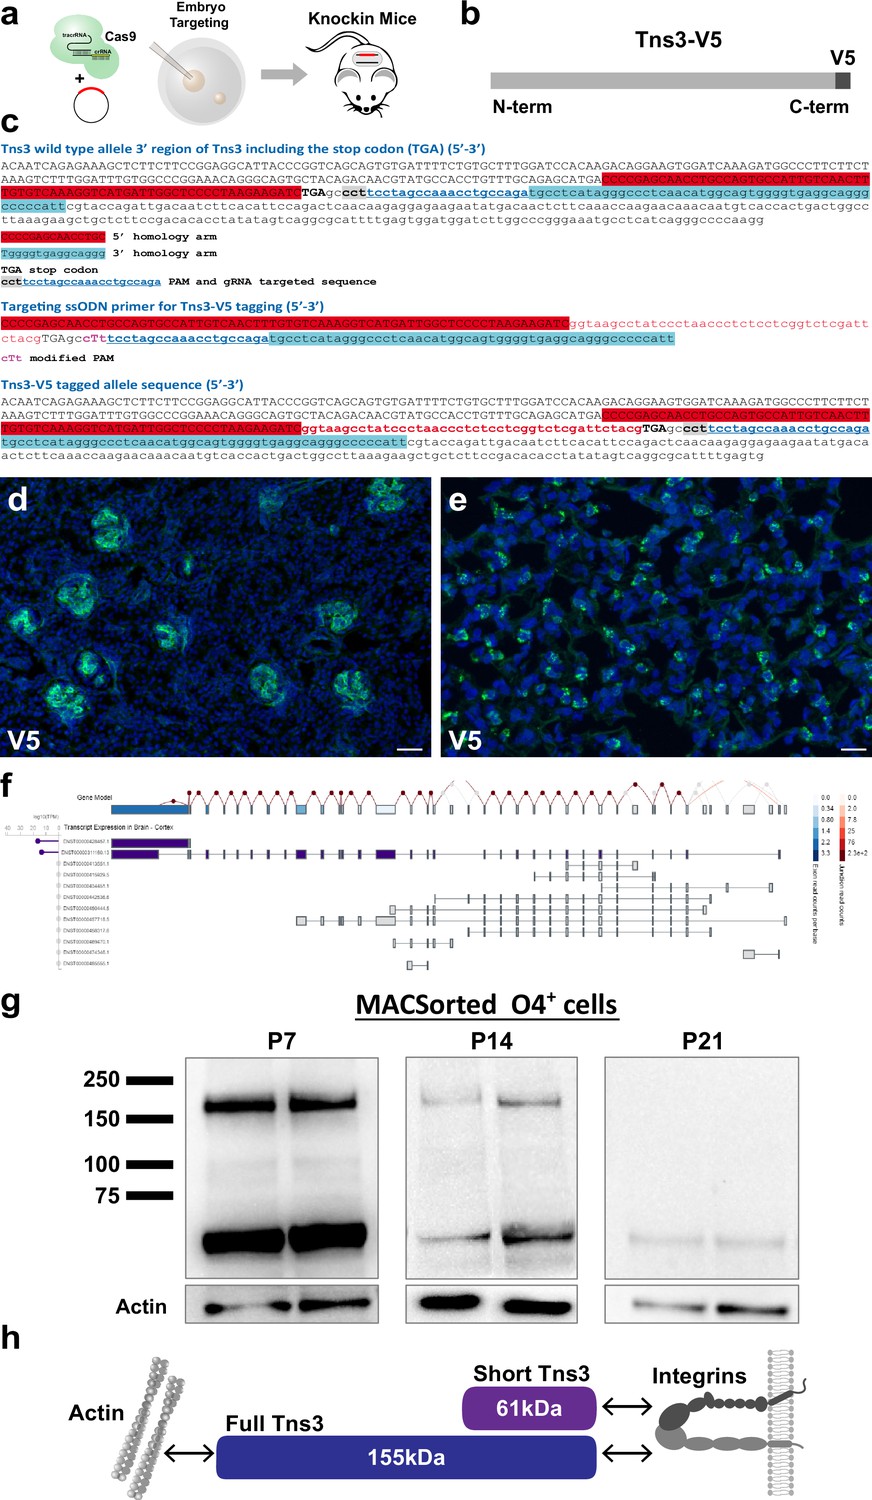
Generation of Tns3Tns3-V5 knock-in mice.
(a) Scheme of V5 tag knock-in strategy in mice. (b) Schematic of Tns3 protein with a V5 tag at the C-terminal. (c) Nucleotide sequence of a wild-type mice Tns3 3′ region (upper), of the targeting single-strand oligodeoxynucleotide (ssODN) vector (middle), and of the 3′ region of the first Tns3Tns3-V5 knock-in mice generated (lower). (d, e) Immunostaining using V5 antibody in kidney (d) and lung (e) of P14 Tns3Tns3-V5 mice. Note the expression of Tns3 in kidney glomeruli and lung alveolar cells (f) Schematic of the exons present in the two main TNS3 transcript isoforms expressed in the human brain (gtexportal.org/home/gene/TNS3). A dark color is associated with higher expression. (g) Western blots of V5 antibody in O4+ MACSorted cells from P7 oligodendrocyte precursor cells (OPCs)/immature oligodendrocytes (iOLs) (left), P14 iOLs (middle), and P21 OLs (right) of Tns3Tns3-V5 mouse brains. Bottom: actin loading control. Note the presence of the full-length isoform only in OPC/iOLs. (h) Schematic of Tns3 protein brain isoforms and their interactions with actin and integrins. Scale bar, 20 μm.
-
Figure 2—figure supplement 2—source data 1
Anti-V5 Western blot followed by anti-actinWestern blot at P7, P14 and P21.
- https://cdn.elifesciences.org/articles/80273/elife-80273-fig2-figsupp2-data1-v2.zip
Figure 2—figure supplement 3
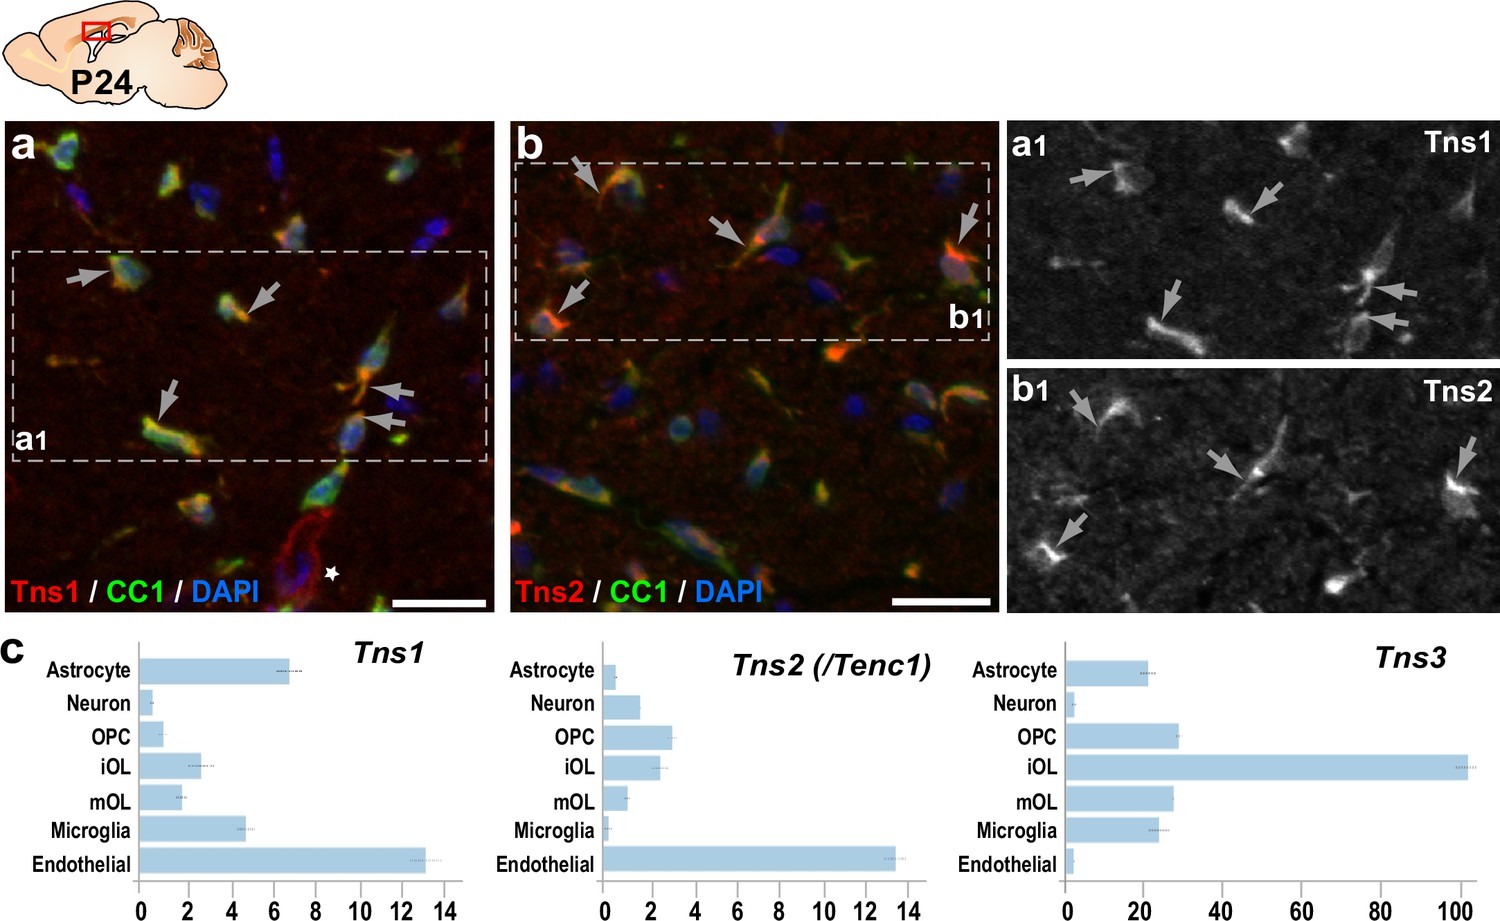
Tns1 and Tns2 proteins are detected at low levels in immature oligodendrocytes (OLs).
Immunofluorescence in sagittal section of P24 mouse brain. Tns1 (a) and Tns2 (b) immunodetection in CC1+ OLs of the corpus callosum. Tns1 is detected in the cytoplasm and excluded from OL nucleus (a1), as is Tns2 (b1). (c) Tns1, Tns2, and Tns3 mRNA expression in postnatal brain (brainrnaseq.org). Note that Tns3 is the main Tensin expressed in oligodendroglia. Scale bar, 20 μm.
Figure 2—figure supplement 4
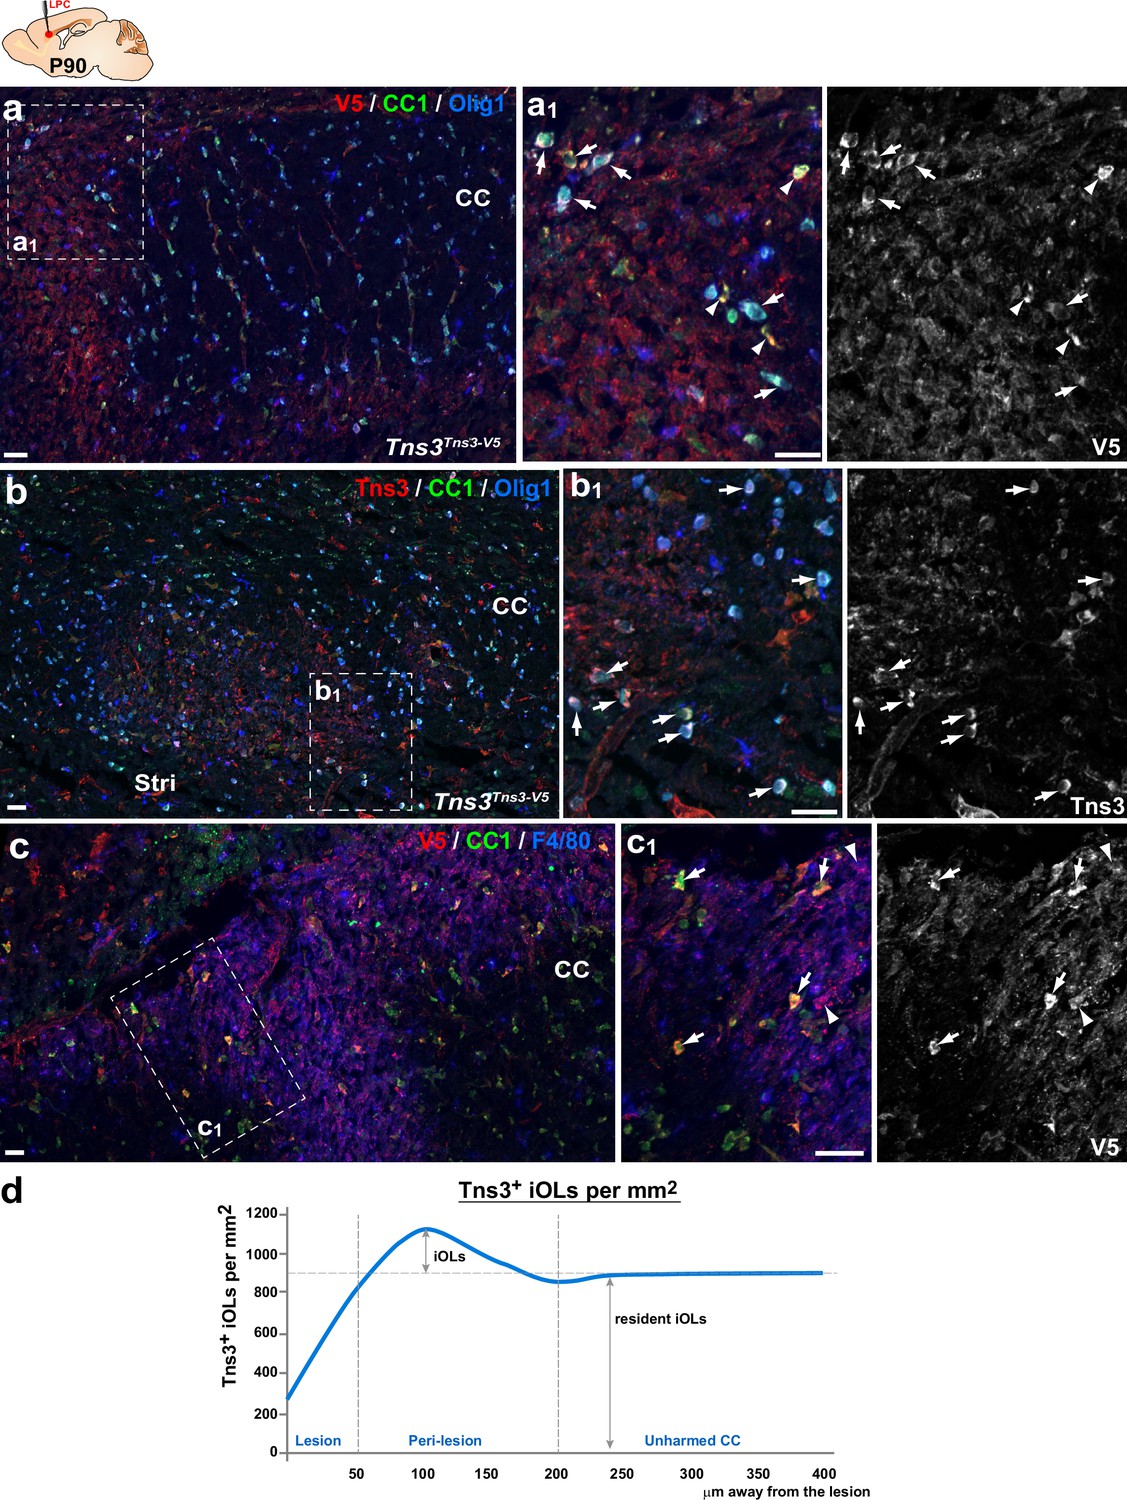
Tns3 is expressed in newly formed oligodendrocytes (OLs) during adult brain remyelination.
(a, b) Tns3-expressing cells in the corpus callosum (CC) of adult (P90) mice, 7 days after chemically induced demyelination, showing strong Tns3 expression in CC1+/Olig1- iOL1s (arrowheads) and CC1+/Olig1cytoplasmic iOL2s (arrows) around the lesion using either anti-V5 antibody in Tns3Tns3-V5 mice (a–a1) or anti-Tns3 antibody in wild-type mice (b–b1). Note the absence of CC1+/Olig1+ OLs in the lesion. (c–c1) Tns3 expression in CC1high iOLs (arrows) around the lesion and in some F4/80+ microglia (arrowheads) in the lesion area. (a1), (b1), and (c1) are higher magnification of corresponding insets (squares). (d) Quantification of the Tns3+ OLs density each 50 μm distance away from the lesion. Scale bar, 20 μm.
Figure 3 with 3 supplements
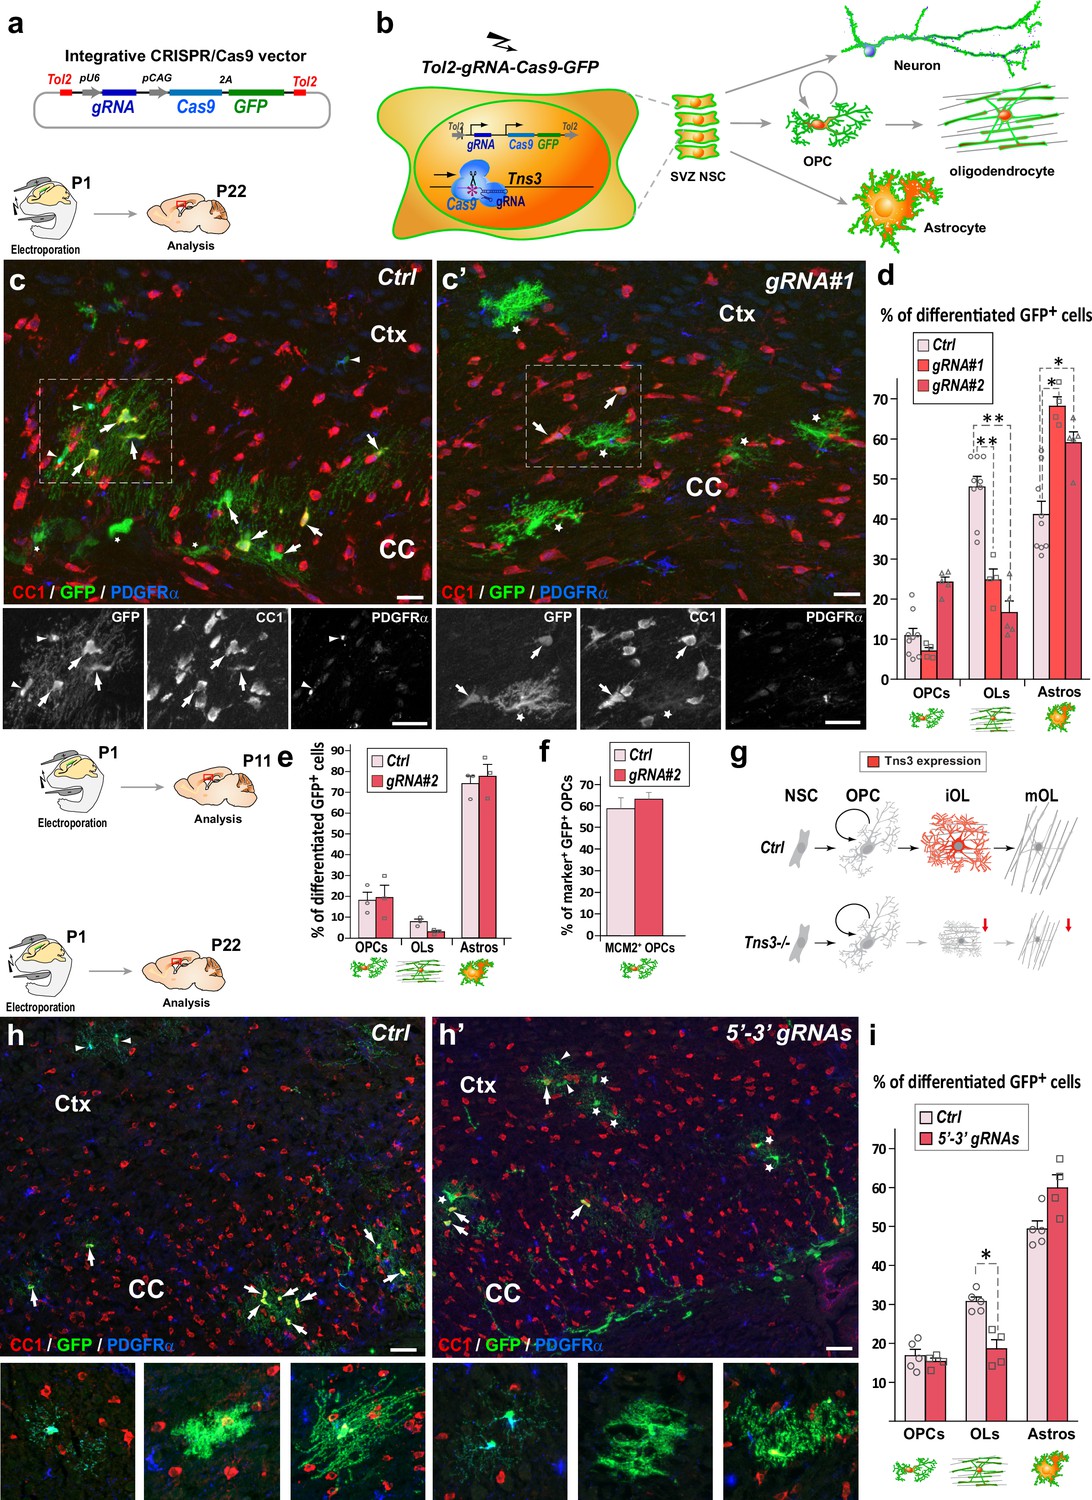
CRISPR-mediated Tns3 mutation in neural stem cells (NSCs) reduces oligodendrocyte (OL) differentiation in the postnatal brain.
(a) Schematic of the CRISPR/Cas9 expression vector allowing Tol2-DNA integration driving Cas9 and GFP expression (from polycistronic 2A-mediated cleaved) from CAG promoter and sgRNA expression from U6 promoter. (b) Schematic of the dorsal subventricular zone (SVZ) NSC electroporation of CRISPR-plasmid at postnatal day 1 (P1) and traced neural cell-subtype progeny. (c, c’) Immunofluorescence of representative P22 sagittal sections of the dorsal telencephalon showing GFP+ cells being either PDGFRα+ oligodendrocyte precursor cells (OPCs) (arrowheads), CC1high OLs (arrows), or CC1low astrocytes (asterisks) progeny of P1 NSCs electroporated either with Ctrl plasmid (c) or Tns3-gRNA#1 plasmid (c’). (d) Histograms showing the percentage of GFP+ glial cell types found in Ctrl, gRNA#1 or gRNA#2 electroporated brains being PDGFRα+-OPCs, CC1high-OLs and CC1low-astrocytes. Note the twofold reduction of CC1+ OLs in Tns3-gRNA-transfected brains, as illustrated in (c’) compared to (c). (e) Histograms representing the percentage of GFP+ differentiated cells at P11. Note the lack of changes in OPCs, and the incipient reduction in OLs. (f) Histograms quantifying the proportion of proliferative (MCM2+ cells) GFP+ OPCs in electroporated P11 mice brain. (g) Schematic of Tns3 expression in mice (upper) and of the effects of Tns3 CRISPR-mediated deletion (lower). (h, h’) Representative P22 sagittal sections of the dorsal telencephalon showing GFP+ cells being either PDGFRα+ OPCs (arrowheads), CC1high OLs (arrows), or CC1low astrocytes (asterisks) progeny of P1 NSCs electroporated either with Ctrl plasmid (h) or Tns3-5′–3′ targeting plasmid (labeled as 5′–3′ gRNAs) (h’). (i) Histograms showing the percentage of GFP+ glial cell types found in Ctrl or 3′–5′ gRNA electroporated brains being PDGFRα+-OPCs, CC1high OLs, and CC1low astrocytes in the corpus callosum (CC) and cortex (Ctx). Note the twofold reduction of CC1+ OLs in Tns3-5′–3′ gRNA-transfected brains. Scale bar, 20 μm.
-
Figure 3—source data 1
Subcloning strategy of to generate the Tol2-pCAG-Cas9-2A-GFP plasmid.
- https://cdn.elifesciences.org/articles/80273/elife-80273-fig3-data1-v2.pdf
Figure 3—figure supplement 1

Oligodendrogenesis is normal in Tns3 constitutive mutant mice, which still express Tns3 full-length transcripts in the brain.
(a) Schematic of Tns3βgeo allele, showing localization of primers used for PCR amplification. (b, c) β-Galactosidase immunofluorescence in P21 sagittal brain sections, corresponding to CC1+ oligodendrocytes (OLs) (arrows, b) or Olig2high/PDGFRα− OLs (arrows, c) immature OLs. (d, d’) Immunofluorescence for PDGFRα+ oligodendrocyte precursor cells (OPCs) and CC1+ OLs showing similar cell numbers in the corpus callosum (CC) of Tns3βgeo/+ (d) and Tns3βgeo/βgeo (d’) brains. (e) Histograms representing density of PDGFRα+ OPCs and CC1+ OLs in the CC and the fimbria. (f, f’) Immunofluorescence for Olig2, CC1, and Olig1 allowing to identify three OL stages: CC1high/Olig1- cells (iOL1), CC1high/Olig1high-cytoplasmic cells (iOL2), and CC1low/Olig1cytoplasmic (mOL), showing similar numbers of each OL stage in the CC of Tns3βgeo/+ (f) and Tns3βgeo/βgeo (f’) brains. (g) Histograms representing the quantification of the density of iOL1s, iOL2s, and mOLs, in the CC and the fimbria. (h) PCR from genomic DNA showing the presence of the native intron 4 only in wild-type (+/+) mice, of the intron 4-βgeo only in Tns3βgeo/βgeo mice, and of intron 5/intron 6 in both mice. (i) Caliper visualization of PCR from cDNA showing the presence of exon 17 and exon 31 both in Tns3βgeo/βgeo and wild-type mice despite the amplification with primers for exons 2–14 only in wild-type mice, and with primers for Exon2-βgeo only in Tns3βgeo/βgeo mice. (j) Genotyping by TIDE analysis of Tns34del and Tns314del heterozygous mice showing wild-type Tns3 allele and the 4 nucleotides deletion in Tns34del allele and the 14 nucleotides deletion in Tns314del allele. (k) Pie charts representing the genotypes of E14.5 embryos obtained from Tns34del heterozygous inter-crosses. Note the sublethal phenotype indicated by the reduced number of Tns34de/4del embryos compared to Mendelian ratios. (l) Tns34del mice presenting growth defects in homozygous pups (arrow) at P14 compared to their heterozygous littermates. (m, n) Immunofluorescence showing that Tns3 is still detected in CC1+ OLs of Tns34de/4del P21 mice, with four different Tns3 recognizing antibodies: (m) Sassan Hafizi lab and Santa Cruz, (n) Millipore, and Sigma. (o) Histogram representing qPCR on cDNA from P21 brains showing no differences in the amplification of Tns3 exons 13–15, exon 17, and exon 31 between Tns34del/4del, Tns34del/+ or WT mice, indicating the presence of a long Tns3 transcript containing these exons in Tns34del/4del brains. Scale bar, 20 μm.
Figure 3—figure supplement 2
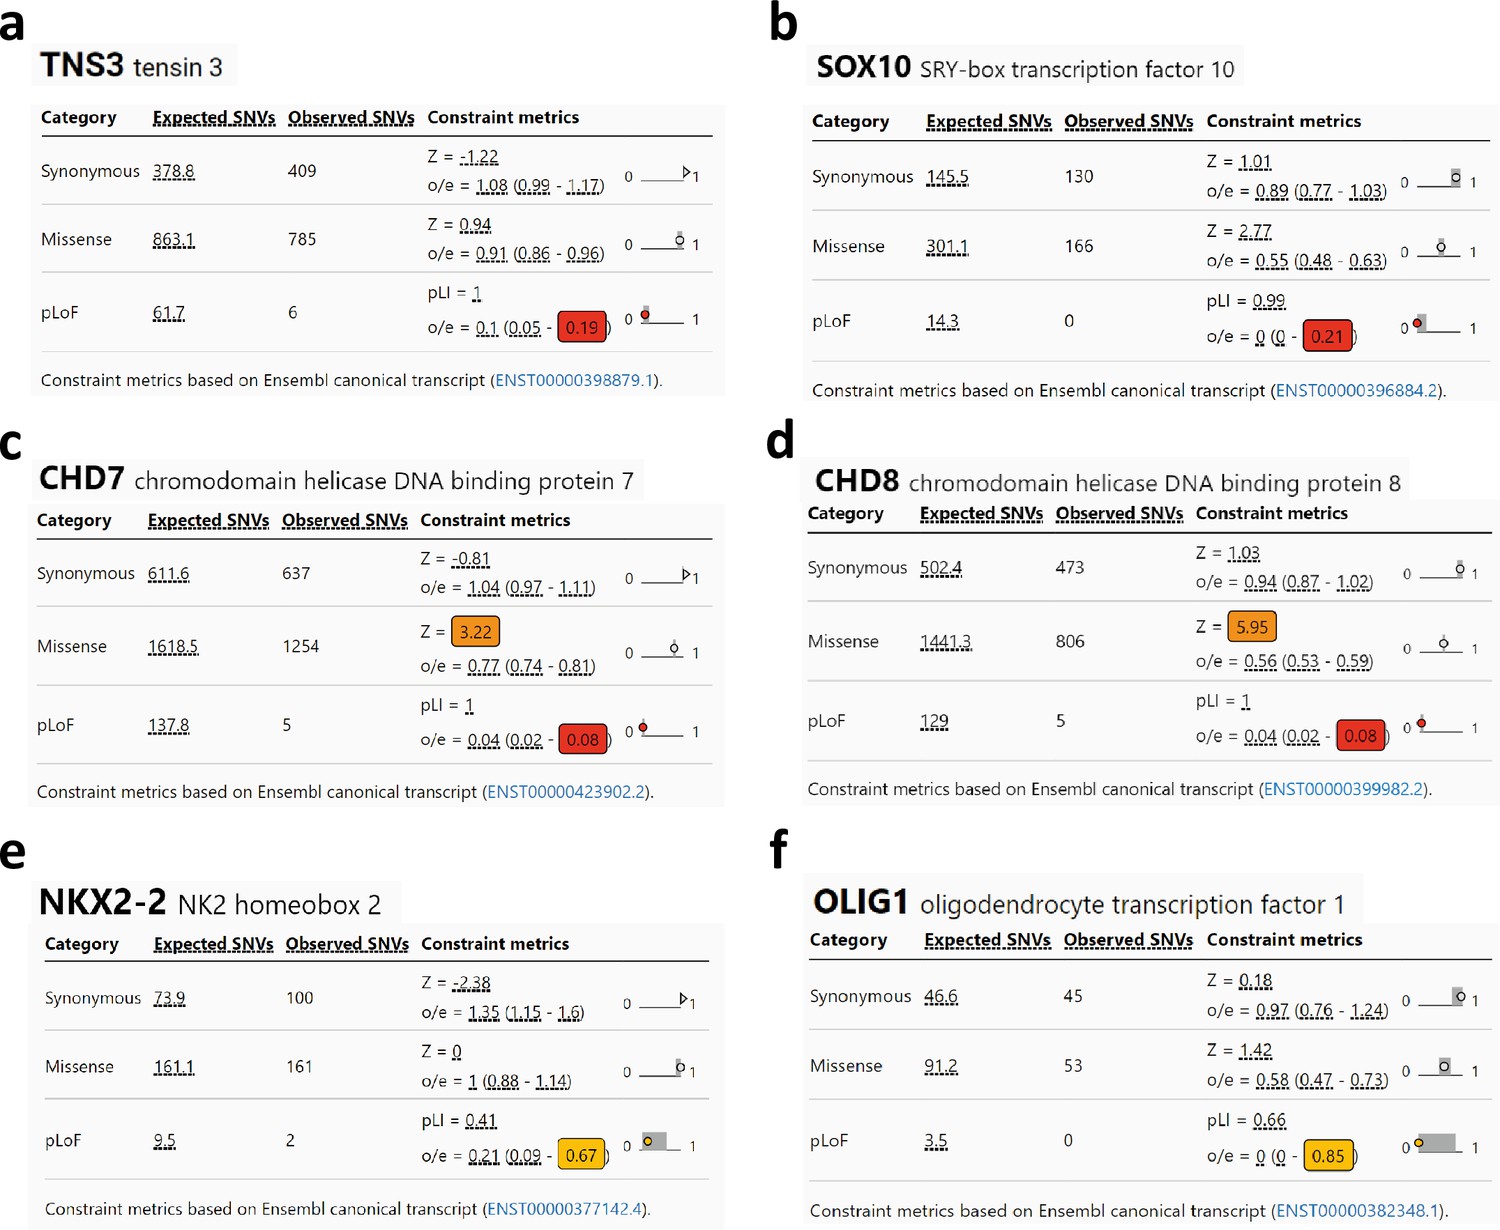
Intolerance for TNS3 loss-of-function variants in the human population.
(a–f) GnomAD data for TNS3 and key regulators of oligodendrogenesis (SOX10, CHD7, CHD8, NKX2-1, and OLIG1) showing frequency and scores of different genetic variants in the human population: synonymous, missense, and predicted loss-of-function (pLOF) (nonsense, splice acceptor, and splice donor variants). The numbers highlighted colored squares correspond to the LOEF (loss-of-function observed/expected upper bound fraction), that it is a conservative estimate of the observed/expected ratio. Low LOEUF scores indicate strong selection against pLoF variation in a given gene, while high LOEUF scores suggest a relatively higher tolerance to inactivation. Note that TNS3, like SOX10, CHD7, and CHD8, has very low LOEUF scores indicating high intolerance for its inactivation, contrary to NKX2-1 and OLIG1, which show more tolerance to their inactivation.
Figure 3—figure supplement 3
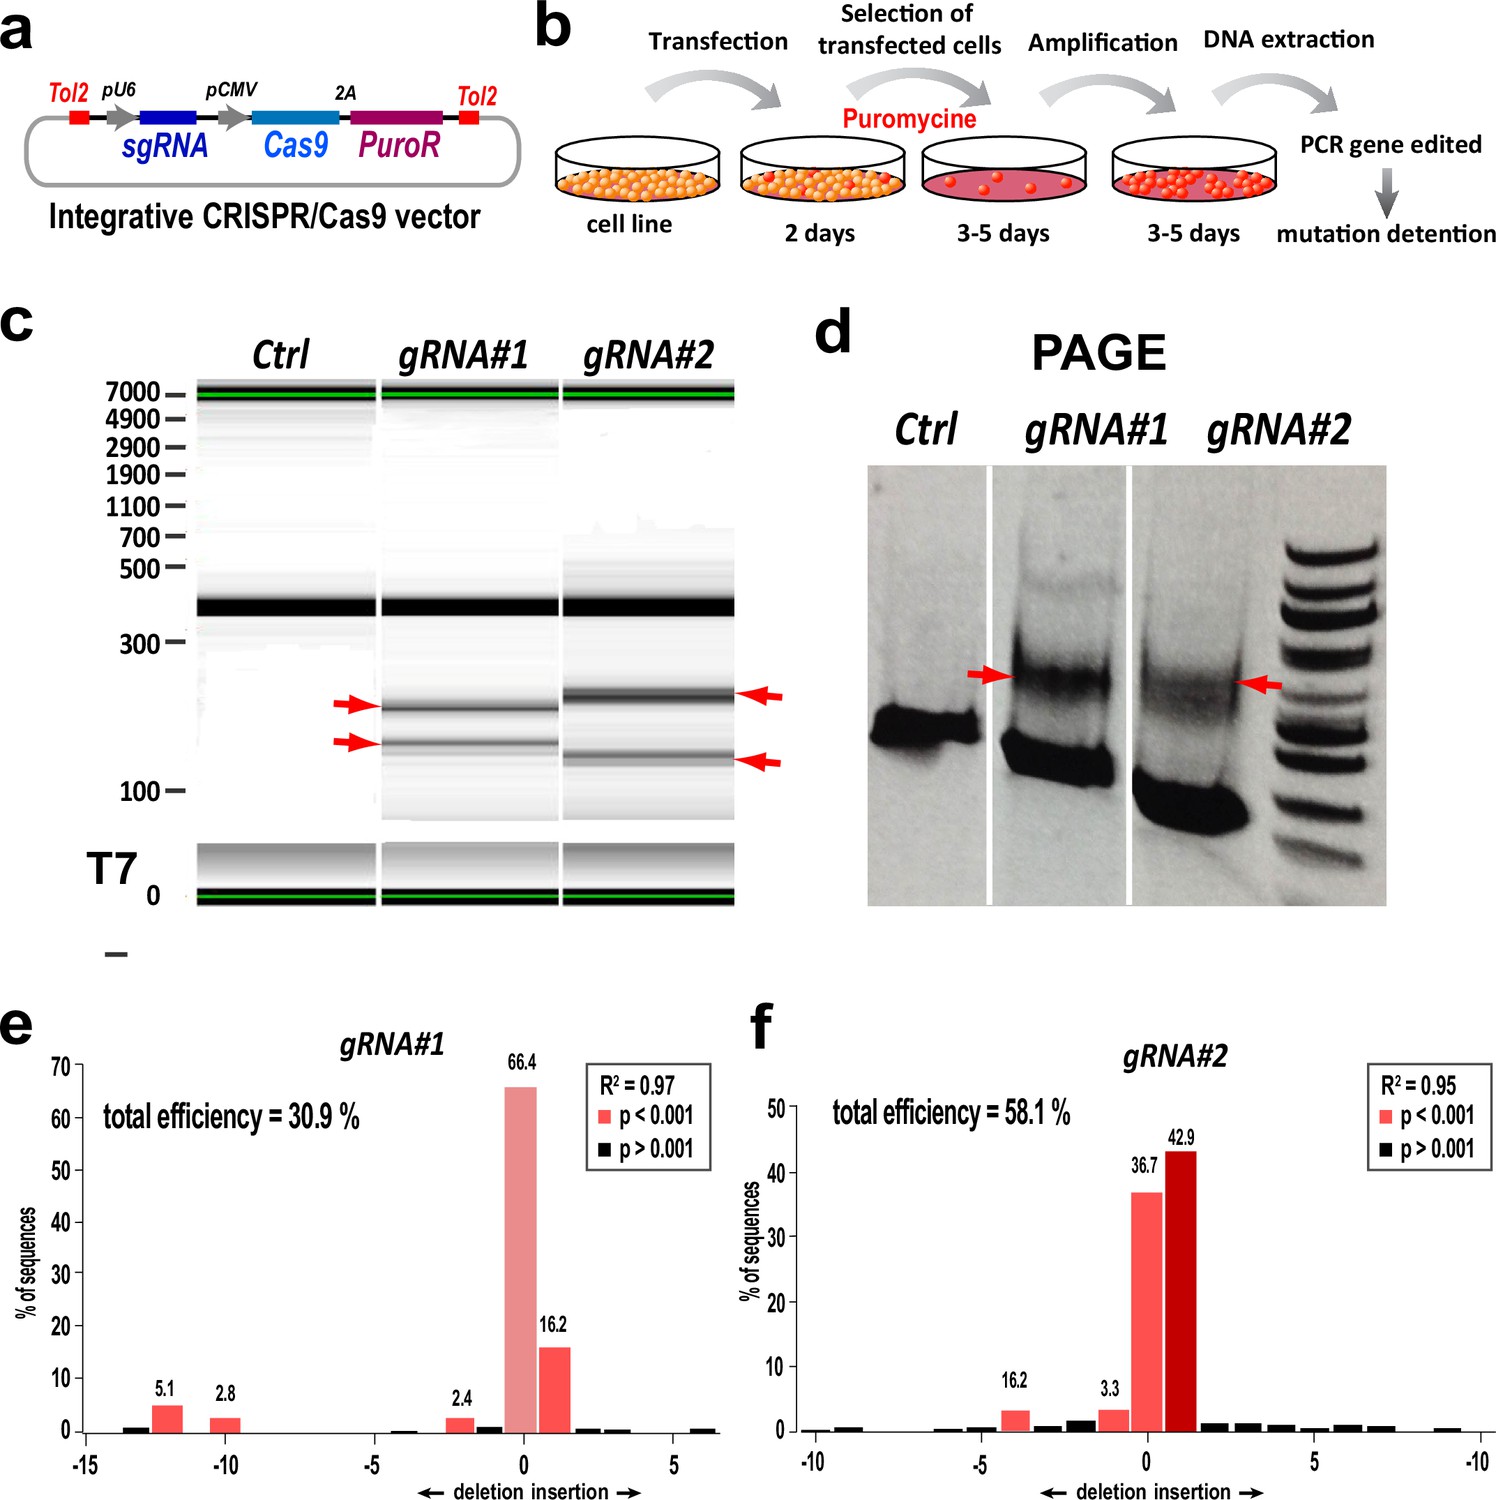
Generation and validation of Tns3-targeting CRISPR/Cas9 tools.
(a) Schematic of the Tol2-PX459 CRISPR/Cas9 expression vector allowing Tol2-DNA integration driving Cas9 and puromycin resistance expression (from polycistronic 2A-mediated cleaved) by CMV promoter and sgRNA expression from U6 promoter. (b) Scheme of C17.1 neuroblastoma cell line lipofection followed by puromycin selection of transfected cells used to amplify by PCR the Tns3-targeted region and assess for indel mutations. (c) Caliper visualization of PCR products obtained after T7-mediated cleavage of DNA heteroduplex due to the indel mutations, showing smaller products (arrows) generated by Cas9 cutting with gRNA#1 or gRNA#2. (d). Visualization of Tns3-targeted region amplified by PCR run in a PAGE gel. Note the extra bands in gRNA#1 or gRNA#2-transfected cells corresponding to Cas9 cut products, contrary to Tol2-PX459 empty plasmid (control). (e, f) TIDE analysis representing the percentage of sequences presenting a given indel mutation in cells transfected with gRNA#1 (e) or gRNA#2 (f).
-
Figure 3—figure supplement 3—source data 1
Polyacrylamine gel (PAGE) showing efficient cutting of Tns3 gRNAs #1 and #2 as extrabands formed by hybrid DNA pairing of indels and wild-type PCR products of Tns3 targeted region.
- https://cdn.elifesciences.org/articles/80273/elife-80273-fig3-figsupp3-data1-v2.zip
-
Figure 3—figure supplement 3—source data 2
gRNA selection strategy, targeting either the ATG region of Tns3 locus (5') gRNA#1 and gRNA#2, and the stop codon (3') region of Tns3, gRNA#3.
- https://cdn.elifesciences.org/articles/80273/elife-80273-fig3-figsupp3-data2-v2.pdf
Figure 4 with 3 supplements
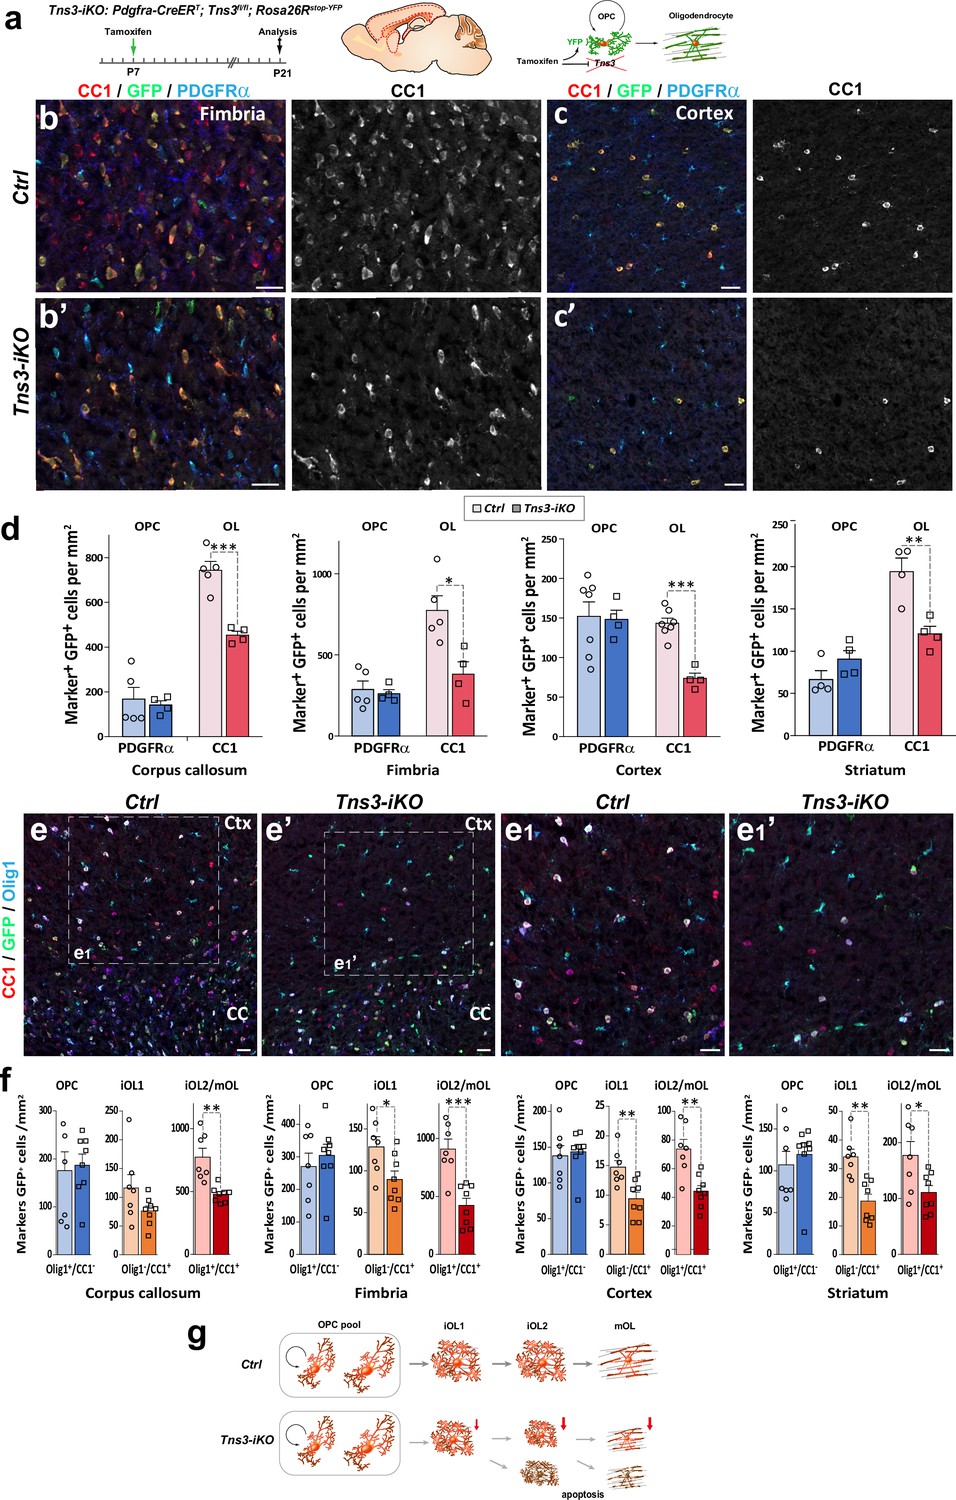
Oligodendrocyte precursor cell (OPC)-specific Tns3 deletion reduces the number of differentiating oligodendrocytes (OLs) in the postnatal brain.
(a) Scheme of tamoxifen administration to Tns3-iKO and control (Cre+; Tns3+/+) mice, Cre-mediated genetic changes, and timing of experimental analysis. (b, b’, c, c’) Immunofluorescence in P21 sagittal brain sections for CC1, GFP, and PDGFRα illustrating similar density of OPCs (PDGFRα+) and twofold reduction in OL (CC1+) density in Tns3-iKO (b’, c’) compared to control (b, c) in the fimbria (b) and the cortex (Ctx) (c). (d) Histograms showing OPC and OL density in P21 Tns3-iKO and control (Ctrl) mice, in the corpus callosum (CC), fimbria, Ctx, and striatum. Note the systematic OL decrease of 40–50% in each region. (e–e1’) Immunofluorescence in P21 sagittal brain sections for Olig1, GFP, and CC1 to distinguish three stages of oligodendrogenesis: OPCs (Olig1+/CC1-), iOL1s (CC1+/Olig1-), and iOL2s/mOLs (CC1+/Olig1+) in Ctrl (e) or Tns3-iKO mice (e’). (e1) and (e1’) are higher magnification of the squared area in (e) and (e’). (f) Histograms showing the OPCs, the iOL1s, and the iOL2s/mOLs density in P21 Tns3-iKO and control mice, in the CC, fimbria, Ctx, and striatum. Note the decrease of iOL1s and iOL2s over 40% in each area quantified (except for iOL1 density in the CC). (g) Schematic representing defects in oligodendrogenesis found in Tns3-iKO compared to control. Scale bar, 20 μm.
Figure 4—figure supplement 1

Generation of Tns3 floxed allele.
(a) Schematic of Tns3 locus, Tns3Flox allele, and targeting vector with LoxP sites flanking exon 9 used to induce homologous recombination in mouse ESCs. (b) Full-length Tns3 amino acid sequence indicating its protein domains. Squared in red highlights the 109 amino acid sequence of the Tns3 peptide produced upon Cre-mediated recombination in Tns3Flox-expressing cells. (c) Peptide sequence of protein product predicted for Tns3-iKO-expressing cells. (d) Tns3Flox targeting vector sequence used for homologous recombination in mouse ESCs and generation of Tns3Flox mice, with LoxP sites highlighted in blue and exon 9 highlighted in red.
Figure 4—figure supplement 2
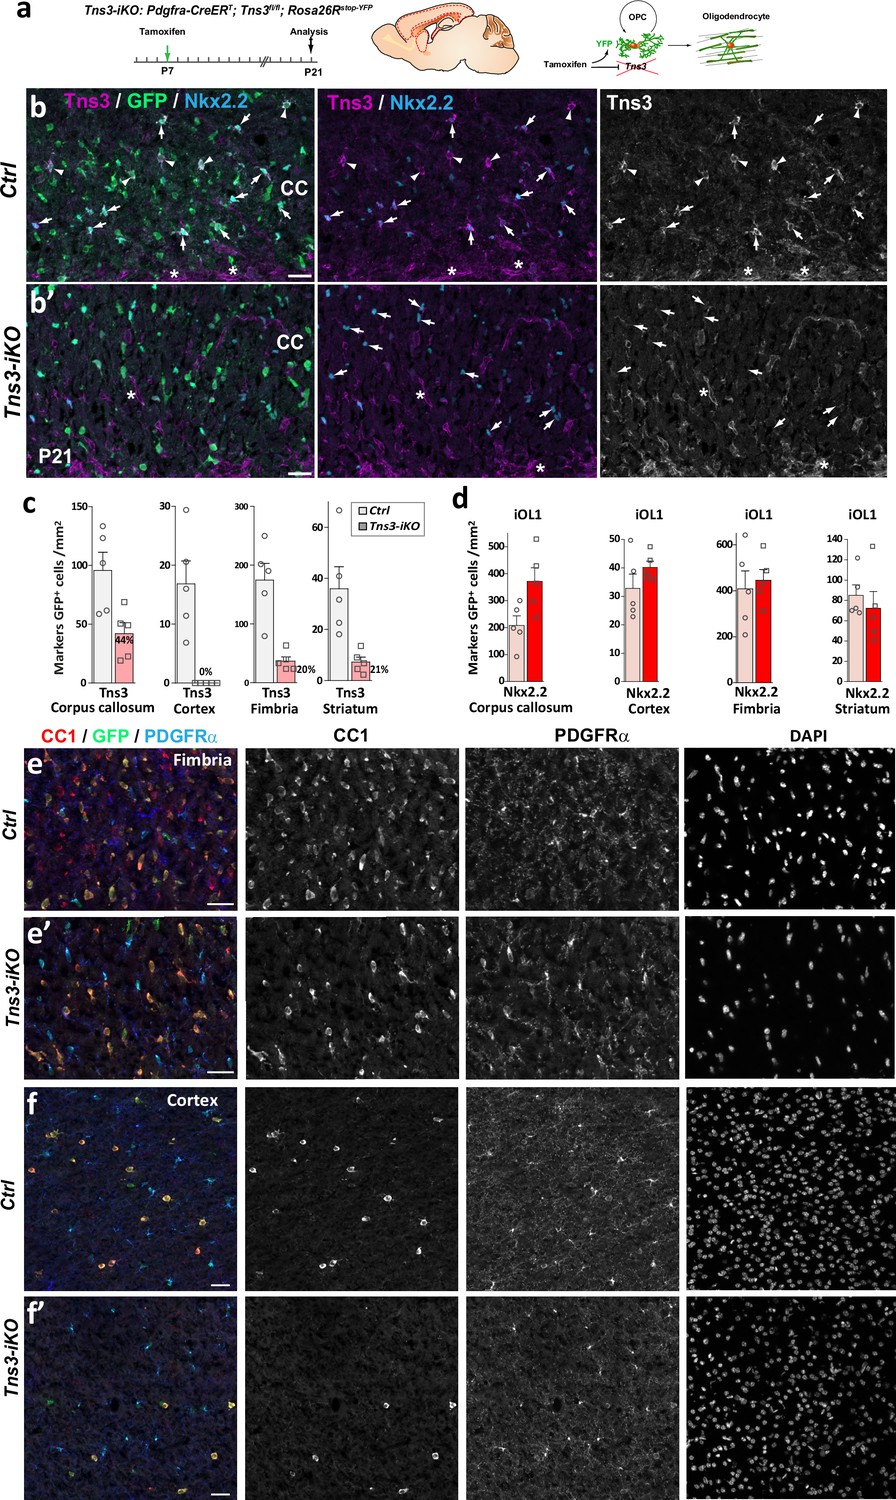
Efficient oligodendrocyte precursor cell (OPC)-specific Tns3 deletion in the postnatal brain and reduced oligodendrocyte generation from OPCs.
(a) Scheme of tamoxifen administration to Tns3-iKO (Cre+; Tns3fl/fl) and control (Cre+; Tns3+/+) mice, Cre-mediated genetic changes, and timing of experimental analysis. (b, b’) Immunofluorescence for Tns3, GFP, and Nkx2.2 in P21 mice sagittal brain sections at the level of the corpus callosum (CC), illustrating the loss of Tns3 signal in Nkx2.2high iOL1s (arrows) but not in vessels (asterisk) of Tns3-iKO (b’) compared to control (b). Note that Nkx2.2high iOL1s do not change in density in Tns3-iKO compared to control. (c) Histograms showing the Tns3+ cells density in the CC, fimbria, cortex, and striatum, in Tns3-iKO and control. (d) Histograms showing the Nkx2.2high iOL1s density in the CC, fimbria, cortex, and striatum, in Tns3-iKO and control. (e–f’) Immunostaining corresponding to Figure 4b–c’ showing individual channels for CC1, PDGFRα, and DAPI in the fimbria (e, e’) and cortex (f, f’) of control mice (e, f) and Tns3-iKO mice (e’, e’). Scale bar, 20 μm.
Figure 4—figure supplement 3
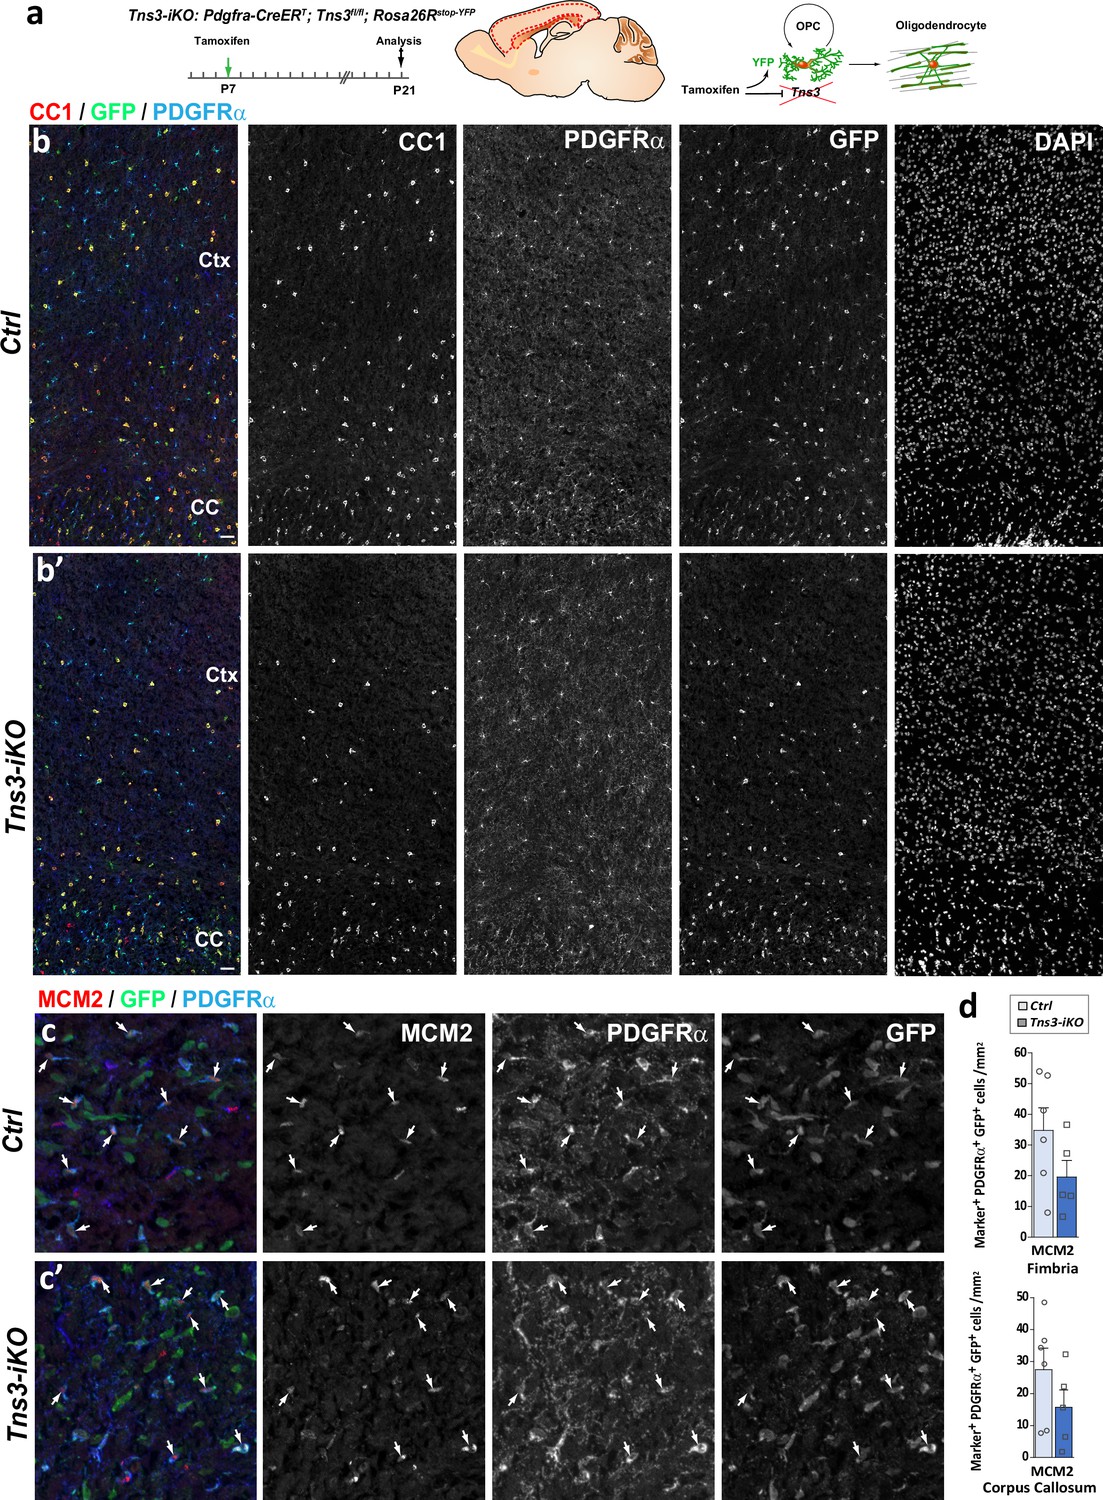
Oligodendrocyte precursor cell (OPC)-specific Tns3 deletion reduces oligodendrocyte (OL) generation without changing OPC proliferation in the postnatal brain.
(a) Scheme of tamoxifen administration to Tns3-iKO (Cre+; Tns3fl/fl) and control (Cre+; Tns3+/+) mice, Cre-mediated genetic changes, and timing of experimental analysis. (b, b’) Immunostaining illustrating at low magnification the reduction in number of CC1+ OLs but not PDGFRα+ OPCs in the cortex (Ctx) and corpus callosum (CC) of Tns3-iKO mice (b’) compared to control mice (b), showing each individual channel and DAPI. (c, c’) Immunofluorescence for MCM2 proliferative marker, GFP, and PDGFRα illustrating similar proportion of proliferative OPCs in control (c) and Tns3-iKO mice (c’). (d) Histograms quantifying the proliferative fraction of GFP+ OPCs in the fimbria (upper) and CC (lower). Note the slight reduction (nonsignificant) in proliferation in Tns3-iKO OPCs compared to control OPCs. Scale bar, 20 μm.
Figure 5 with 1 supplement
Increased cell death of Tns3-iKO oligodendroglia.
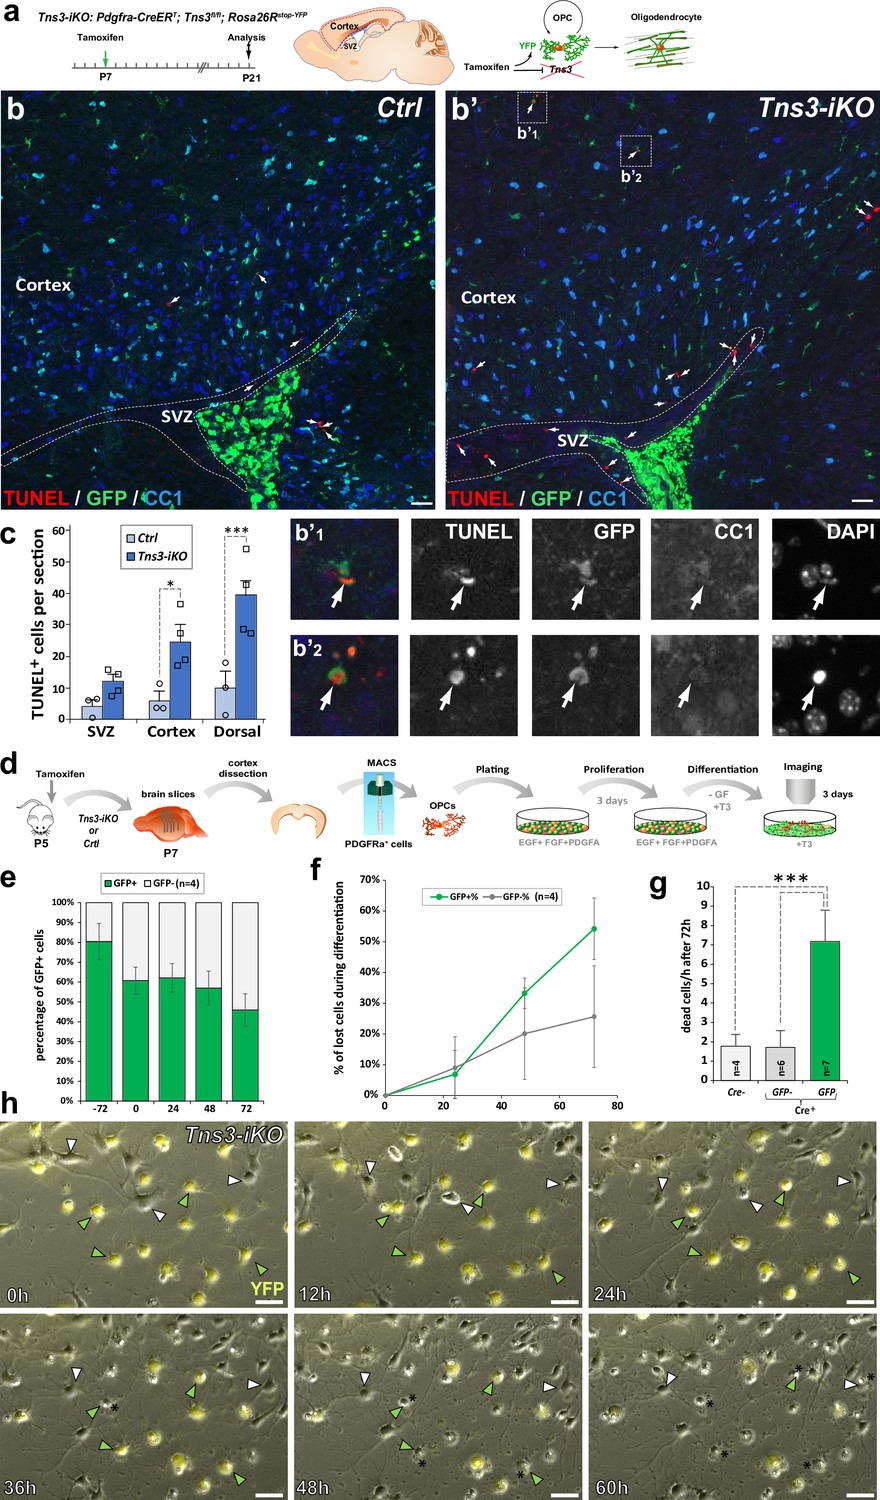
(a) Scheme of tamoxifen administration to Tns3-iKO (Cre+; Tns3fl/fl) and control (Cre+; Tns3+/+) mice, Cre-mediated genetic changes, and timing of experimental analysis. (a–b’) Immunodetection of death cells by TUNEL together with recombined cells (GFP) and oligodendrocytes (OLs) (CC1+ cells) showing increased number of TUNEL+ cells in the cortex and corpus callosum of Tns3-iKO mice (b’) compared to control mice (b), including some GFP+/CC1− oligodendrocyte precursor cells (OPCs) (insets b’1 and b’2). (c) Histograms quantifying the number of TUNEL+ cells in the subventricular zone (SVZ), cortex, and both together (dorsal) per section. (d) Scheme of the video microscopy protocol in MACSorted OPCs purified from Tns3-iKO and control P7 mice. Cells were imaged every 10 min during 72 hr in differentiation medium. (e) Histograms showing the reduction of the GFP+ cells proportion from the plating (–72 hr) to the end of the experiment (72 hr after differentiation onset). (f) Time curve quantifying the loss of GFP+ OLs compared to GFP- OLs during the 72 hr of differentiation. (g) Histograms representing the quantification of cells lost per hour during the 72 hr differentiation period, showing a fivefold increase in loss of GFP+ Tns3-iKO cells compared to GFP- cells (nonrecombined cells from Tns3-iKO mice, internal negative control) or cells coming from Cre− littermates (Cre−, external negative control). (h) Time-lapse frames showing cells every 12 hr illustrating both GFP+ (green arrowheads, recombined Tns3-iKO cells) and GFP- (white arrowheads, nonrecombined Tns3-iKO cells) that die over the time of video microscopy. Note the larger number of GFP+ OLs (cells with multibranched OL morphology) dying compared to GFP- OLs. Scale bar, 20 μm.
Figure 5—figure supplement 1
Tns3 is co-expressed with integrin signaling genes in immature oligodendrocytes (iOLs).
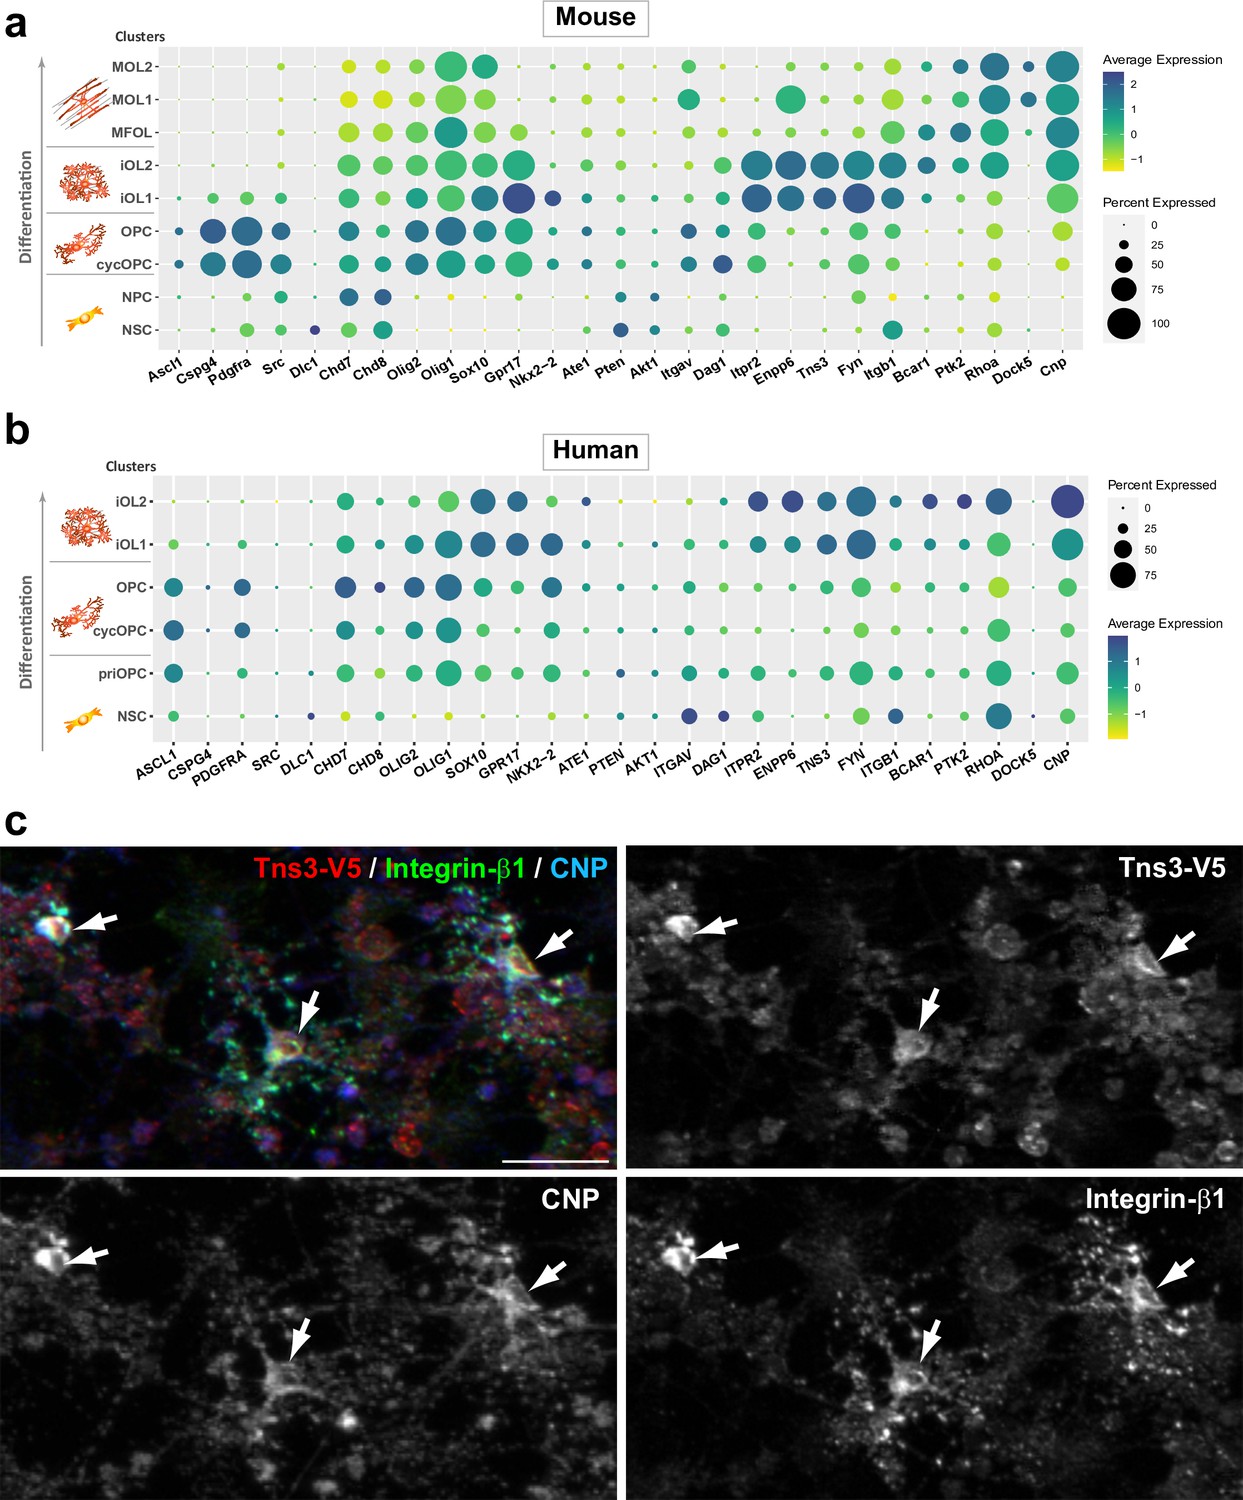
(a, b) Dot plots showing Tns3/TNS3 expression pattern in mouse (a) and human (b) single cells at different stages of oligodendrogenesis together with key markers of each cluster and genes involved in integrin signaling pathway. Note the high levels of Tns3/TNS3 in iOLs (iOL1 and iOL2) together with known genes of integrin pathway previously implicated in oligodendrogenesis (Itgb1, Fyn, FAK/Bcar1, p130Cas/Ptk2) both in mouse and human cells. (c) Immunofluorescence in neurosphere-derived neural progenitor cultures generated from Tns3Tns3-V5 neonatal brain after 3 days of differentiation showing co-expression of Tns3-V5 (V5 antibody) and Integrin-β1 in CNP+ differentiating OLs (arrows). Scale bar, 20 μm.
Figure 6
p53-mediated cell death of Tns3-iKO oligodendroglia.
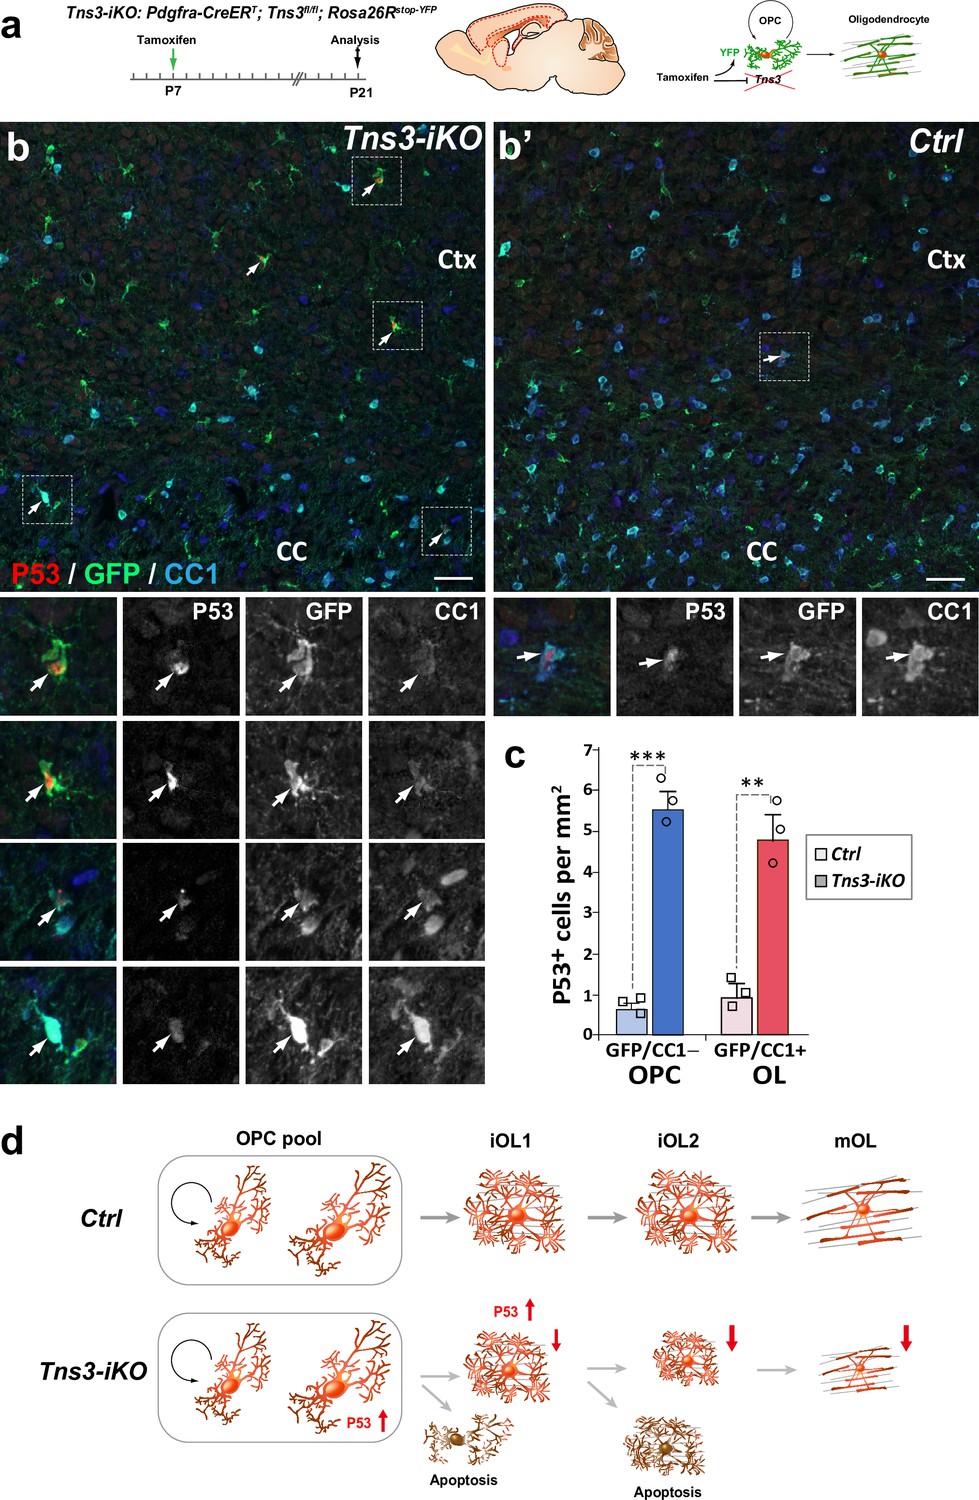
(a) Scheme of tamoxifen administration to Tns3-iKO (Cre+; Tns3fl/fl) and control (Cre+; Tns3+/+) mice, Cre-mediated genetic changes, and timing of experimental analysis. (b, b’) Immunodetection of p53 together with GFP to label recombined cells and CC1 to label oligodendrocytes (OLs) showing a strong increased number of p53+/GFP+/CC1− oligodendrocyte precursor cells (OPCs) and p53+/GFP+/CC1+ OLs in the cortex (Ctx) and corpus callosum (CC) of Tns3-iKO mice (b) compared to control mice (b’). Dotted squares highlight some cases of p53+ cells, shown at higher magnification below. (c) Histograms quantifying the number of p53+ cells per area (mm2) in the dorsal telencephalon. Scale bar, 20 μm. (d) Schematics representing Tns3-deleted phenotypes in oligodendroglia. Scale bar, 20 μm.
Figure 7 with 1 supplement

Mechanisms involved in Tns3-iKO oligodendroglial defects.
(a) Diagram representing tamoxifen (Tam) injection in P5 and P8 Ctrl and Tns3-iKO pups followed by MACSorting of O4+ cells that were used to do RNA-seq. (b) Pie chart showing the amount of differentially expressed genes (DEGs; p-value<0.05) in Tns3-iKO O4+ cells compared to Ctrl. (c, d) Gene Ontology (GO) analysis of biological processes downregulated (c) and upregulated (d) in Tns3-iKO O4+ cells compared to Ctrl. Numbers on left represent the number of deregulated genes in each GO process. (e–g) Graphs representing the logarithmic fold change (LogFC) for an example of genes involved in oligodendrocyte differentiation (e), cell cycle (f), and p53 pathway (g). (h) Summary schematics of the transcriptional dysregulation of Tns3-iKO O4+ cells, representing the upregulation of the apoptosis pathway and the conflicting signals on cell cycle arrest/progression. Red and blue arrows represent gene upregulation and downregulation, respectively, in Tns3-iKO O4+ cells compared to Ctrl.
Figure 7—figure supplement 1

Transcriptomic analysis of acutely Tns3-deleted oligodendroglia.
(a) Diagram representing tamoxifen (Tam) injection at P5 and P8 Ctrl and Tns3-iKO pups followed by the MACSorting of O4+ cells used for RNA-seq and plating. Cells were fixed 2 hr after and used to do immunostaining. (b) Immunostaining validating the loss of Tns3 protein in Tns3-iKO O4+ cells compared to Ctrl. (c) Graph representing the count of exon 9 of Tns3 in the RNA-seq data. Note the reduction of floxed exon 9 in the Tns3-iKO O4+ cells compared to control (Ctrl). (d) Immunostaining showing the composition in oligodendrocyte precursor cells (OPCs) (PDGFRα+ cells) and immature oligodendrocytes (iOLs) (CNPase+ cells) among Ctrl and Tns3-iKO O4+ cells after MACS. (e) Graph indicating that the same amount of OPCs (PDGFRα+ cells) and iOLs (CNPase+ cells) was found in Ctrl and Tns3-iKO O4+ cells after MACS. (f) Graph showing that the ratio of iOLs (CNPase+ cells)/OPCs (PDGFRα+ cells) was not altered in Tns3-iKO O4+ cells compared to Ctrl. (g) Principal component analysis (PCA) of the RNA-seq data transcripts of Ctrl (CT) and Tns3-iKO (KO) O4+ cells. (h) Volcano plot showing the upregulated (red) and downregulated (blue) in Tns3-iKO O4+ cells compared to Ctrl. Some example of genes can be found. Scale bars: (b) 50 μm; (d) 10 μm.
Tables
Key resources table
| Reagent type (species) or resource | Designation | Source or reference | Identifiers | Additional information |
|---|---|---|---|---|
| Strain, strain background (Mus musculus) | Tns3βgeo | Su Hao Lo lab (UC Davis, USA) | ||
| Strain, strain background (M. musculus) | Tn3Flox | Our lab | Available as collaboration | |
| Strain, strain background (M. musculus) | Tns3Tns3-V5 | Our lab | Available as collaboration | |
| Strain, strain background (M. musculus) | Tns3KO | Our lab | Lost in the Covid-19 | |
| Chemical compound, drug | Tamoxifen | Sigma | T5648 | |
| Chemical compound, drug | 32% PFA solution | Electron Microscopy Sciences | 50-980-495 | |
| Commercial assay or kit | Neural tissue dissociation kit (P) | Miltenyi Biotec | 130-093-231 | |
| Commercial assay or kit | Debris removal kit | Miltenyi Biotec | 130-090-101 | |
| Commercial assay or kit | Anti-PDGFRα coupled-beads | Miltenyi Biotec | 130-094-543 | |
| Commercial assay or kit | Anti-O4 coupled-beads | Miltenyi Biotec | 130-096-670 | |
| Chemical compound, drug | Normal goat serum | Eurobio | CAECHVOO-OU | |
| Chemical compound, drug | DAPI | Sigma-Aldrich | D9542 | |
| Chemical compound, drug | Fluoromount-G | SouthernBiotech | 15586276 | |
| Commercial assay or kit | In Situ Cell Death detection kit | Roche | 12156792910 | |
| Chemical compound, drug | RIPA buffer | Thermo Fisher | 89901 | |
| Chemical compound, drug | Halt Protease Inhibitor Cocktail | Thermo Fisher | 87786 | |
| Commercial assay or kit | Pierce Detergent Compatible Bradford Assay Kit | Thermo Fisher | 23246 | |
| Chemical compound, drug | Bolt LDS Sample Buffer | Thermo Fisher | B0007 | |
| Chemical compound, drug | 4–12% polyacrylamide gradient gels | Thermo Fisher | NW04122BOX | |
| Chemical compound, drug | Bolt MOPS SDS Running Buffer | Thermo Fisher | B0001 | |
| Chemical compound, drug | Mini Gel Tank and Blot Module Set | Thermo Fisher | NW2000 | |
| Chemical compound, drug | Precision Plus Protein All Blue protein standards | Bio-Rad | 1610373EDU | |
| Chemical compound, drug | Amersham Protran 0.2 μm nitrocellulose membrane | Dutscher | 10600001 | |
| Chemical compound, drug | NuPAGE Transfer Buffer | Thermo Fisher | NP0006-1 | |
| Chemical compound, drug | Pierce ECL Western Blotting Substrate | Thermo Fisher | 32109 | |
| Chemical compound, drug | Poly-l-ornithine | Sigma | P4957 | |
| Chemical compound, drug | DMEM/F12 | Life Technologies | 31331028 | |
| Chemical compound, drug | HEPES buffer | Life Technologies | 15630056 | |
| Chemical compound, drug | Glucose | Sigma | G8769 | |
| Chemical compound, drug | Penicillin/streptomycin | Life Technologies | 15140122 | |
| Chemical compound, drug | N2 supplement | Life Technologies | 17502048 | |
| Chemical compound, drug | B27 supplement | Life Technologies | 17504044 | |
| Chemical compound, drug | EGF | PeproTech | AF-100-15 | |
| Chemical compound, drug | FGF-basic | PeproTech | 100-18B | |
| Chemical compound, drug | PDGF-AA | PeproTech | 100-13A | |
| Chemical compound, drug | Insulin | Sigma | I6634 | |
| Chemical compound, drug | iDeal ChIPseq kit for Transcription Factors | Diagenode | C01010055 | |
| Antibody | Anti-Tensin1 (rabbit) | Su Hao Lo, UC Davis | 1:100 | |
| Antibody | Anti-Tensin2 (rabbit) | Su Hao Lo, UC Davis | 1:100 | |
| Antibody | Anti-Tensin3 (rabbit) | Sassan Hafizi, University of Portsmouth | 1:1000 | |
| Antibody | Anti-Tensin3 (rabbit) | Millipore | AB229 | 1:500 |
| Antibody | Anti-Tensin3 (rabbit) | Thermo Fisher | PA5-116022 | 1:1000 |
| Antibody | Anti-Tensin3 (mouse monoclonal) | Santa Cruz Biotech | sc-376367 | 1:500 |
| Antibody | Anti-Tns3 (rabbit) (C-terminal) | Sigma-Aldrich | SAB4200205 | 1:200 |
| Antibody | Anti-Tns3 (rabbit) (TN-17) | Sigma-Aldrich | SAB4200416 | 1:400 |
| Antibody | Anti-V5 tag (rabbit) | Millipore | AB3792 | 1:2000 |
| Antibody | Anti-V5 tag (mouse monoclonal) | Invitrogen | R960-25 | 1:1000 |
| Antibody | Anti-PDGFRα (rat) | BD Biosciences | 558774 | 1:250 |
| Antibody | Anti-Olig1 (mouse monoclonal) | NeuroMab | 75-180 | 1:1000 |
| Antibody | Anti-Olig2 (mouse monoclonal) | Millipore | MABN50 | 1:500 |
| Antibody | Anti-CNPase (mouse monoclonal) | Millipore | MAB326R | 1:250 |
| Antibody | Anti-IP3 receptor 2 (rabbit) (Itpr2) | Millipore | AB3000 | 1:40 |
| Antibody | Anti-Nkx2.2 (mouse polyclonal) | Developmental Studies Hybridoma Bank | 1:4 | |
| Antibody | Anti-CC1 (mouse monoclonal) (Quaking 7) | Calbiochem | OP80 | 1:100 |
| Antibody | Anti-MOG (mouse monoclonal) | ICM, Paris Hybridoma | AA3 | 1:20 |
| Antibody | Anti-Opalin (mouse monoclonal) | Santa Cruz Biotech | sc-374490 | 1:500 |
| Antibody | Anti-GFP (chicken polyclonal) | Aves Labs | GFP-1020 | 1:1000 |
| Antibody | Anti-GFP (rabbit) | Life Technologies | A6455 | 1:1000 |
| Antibody | Anti-MCM2 (mouse)(BM28) | BD Biosciences | 610701 | 1:500 |
| Antibody | Anti-p53 (rabbit) | Leica | P53-CM5P-L | 1:500 |
| Antibody | Anti-F4/80 (rat) | Abd Serotec | MCA497 | 1:100 |
| Antibody | Anti-beta-galactosidase (mouse monoclonal) | Promega | Z3783 | 1:1000 |
| Antibody | HRP-conjugated anti-rabbit | Bio-Rad | 1706515 | 1:5000 |
| Antibody | HRP-conjugated anti-mouse | Sigma-Aldrich | NA931-1ML | 1:5000 |
| Antibody | HRP-conjugated anti-rat | Thermo Fisher Scientific | A10549 | 1:5000 |
| Antibody | Anti-H3K4me3 (rabbit) | Active Motif | 39060 | |
| Antibody | Anti-H3K27Ac (rabbit) | Active Motif | 39034 | |
| Antibody | Anti-H3K27me3 (mouse) | Abcam | ab6002 | |
| Antibody | Anti-H3K4me1 (rabbit) | Ozyme | 5326T | |
| Plasmid | gRNA-pCMV-Cas9-2A-GFP | Addgene | ||
| Plasmid | gRNA-pCMV-Cas9-2A-Puro | Addgene | ||
| Plasmid | Tol2-gRNA-pCMV-Cas9-2A-GFP | Our lab | ||
| Plasmid | Tol2-gRNA-pCMV-Cas9-2A-Puro | Our lab | ||
| Plasmid | Tol2-gRNA-pCAG-Cas9-2A-GFP | Our lab | ||
| Plasmid | Tol2-gRNA-pCAG-Cas9-2A-Puro | Our lab | ||
| Plasmid | Tol2-Tns3gRNA2-pCAG-Cas9-2A-GFP | Our lab |
Additional files
-
MDAR checklist
- https://cdn.elifesciences.org/articles/80273/elife-80273-mdarchecklist1-v2.docx
-
Source data 1
Statistics summary table.
- https://cdn.elifesciences.org/articles/80273/elife-80273-data1-v2.xlsx
-
Supplementary file 1
Tables containing Olig2/Chd7/Chd8 ChIP-seq analyses and Tns3-iKO RNAseq analyses.
- https://cdn.elifesciences.org/articles/80273/elife-80273-supp1-v2.xlsx
Download links
A two-part list of links to download the article, or parts of the article, in various formats.
Downloads (link to download the article as PDF)
Open citations (links to open the citations from this article in various online reference manager services)
Cite this article (links to download the citations from this article in formats compatible with various reference manager tools)
Transient regulation of focal adhesion via Tensin3 is required for nascent oligodendrocyte differentiation
eLife 11:e80273.
https://doi.org/10.7554/eLife.80273


