Selection of HIV-1 for resistance to fifth-generation protease inhibitors reveals two independent pathways to high-level resistance
- Department of Microbiology and Immunology, University of North Carolina at Chapel Hill, United States
- Lineberger Comprehensive Cancer Center, University of North Carolina at Chapel Hill, United States
- Department of Biochemistry and Molecular Biotechnology, University of Massachusetts Medical School, United States
- Department of Biochemistry and Biophysics, University of North Carolina at Chapel Hill, United States
Figures
Figure 1
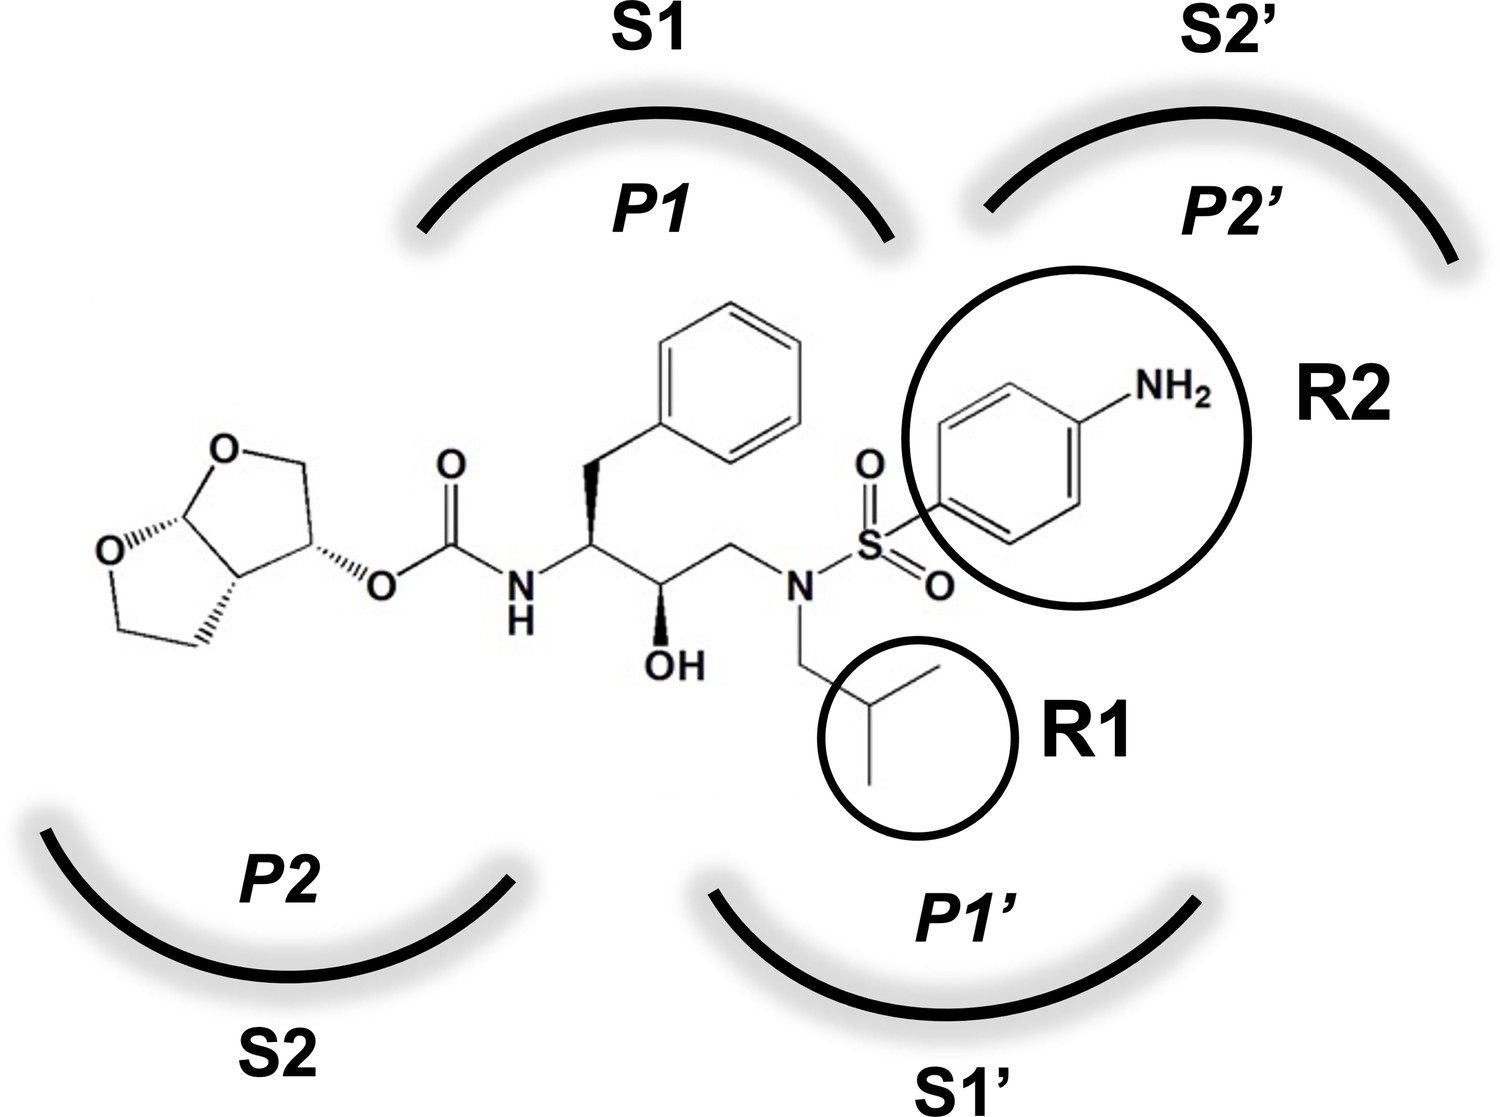
Darunavir (DRV) structure as a PR substrate analog.
The chemical structure of DRV is shown. Protease substrates are labeled following a convention where the scissile bond is flanked upstream by amino acids labeled P1, P2, etc., with the amino acids downstream labeled P1', P2', etc. The cleavage site can thus be written P1/P1'. The side chains of these amino acids extend into subsites in the protease with corresponding labels (i.e., the P1 side chain extends into the S1 subsite). In the UMASS series of analogs, the DRV structure at the equivalent of the P1' position (labeled R1) was modified as was the structure at the equivalent of the P2' position (labeled R2).
Figure 2 with 4 supplements
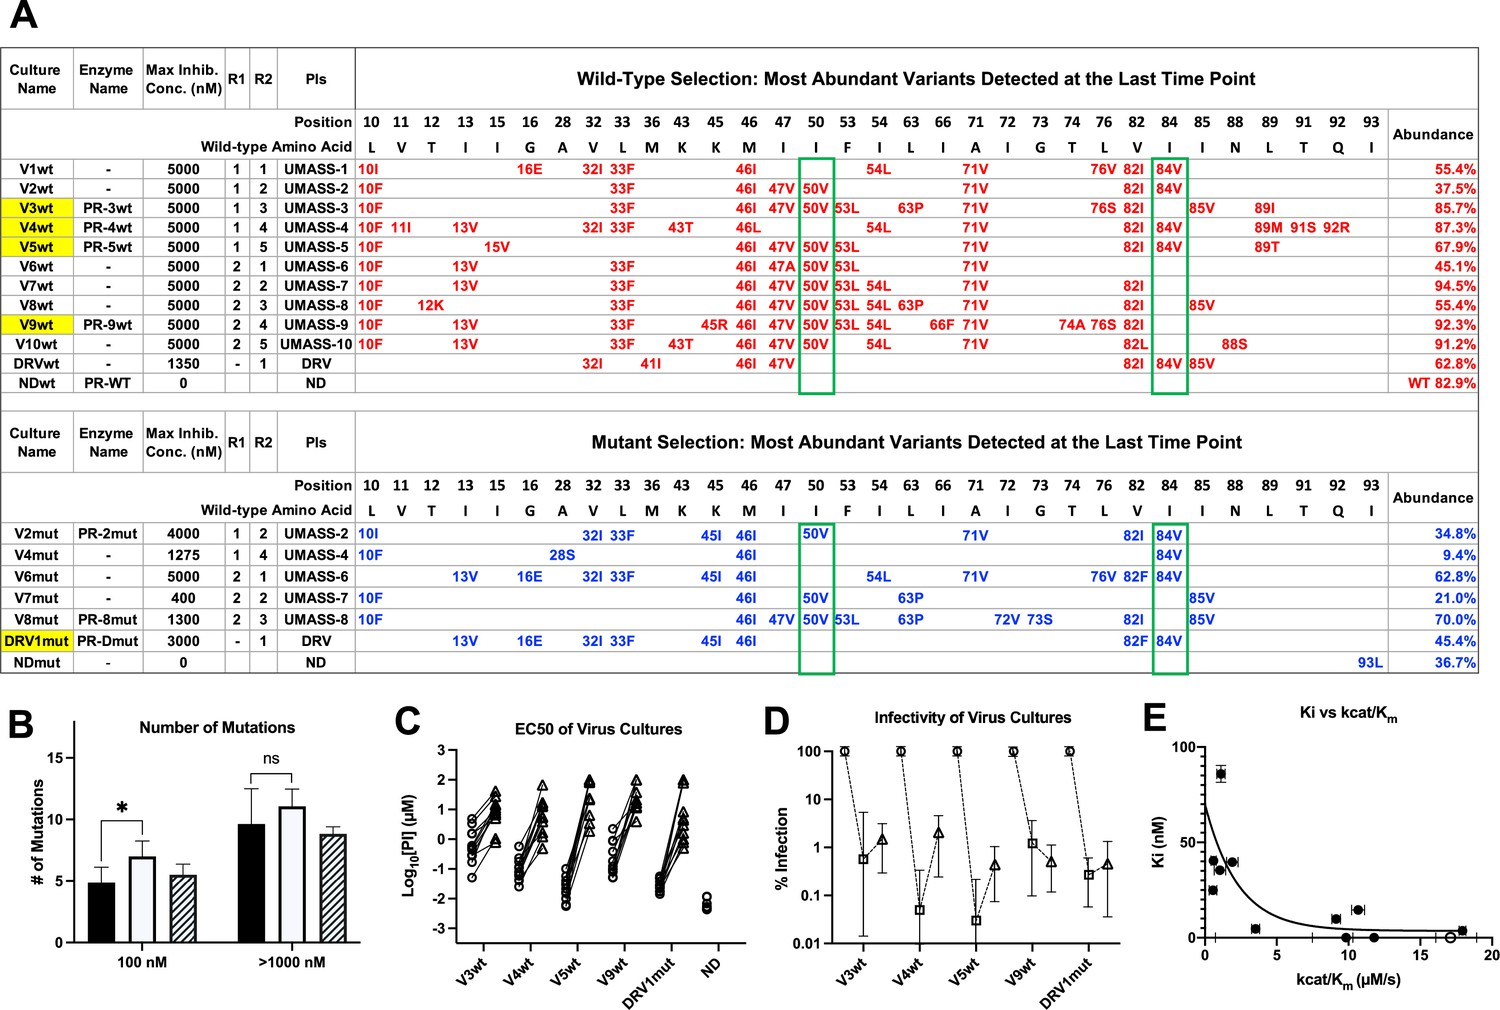
Features of viruses selected to high-level resistance against darunavir (DRV) and the UMASS-1 through -10 inhibitor series.
Infected cultures were put under drug selection starting with either wild-type virus or a pool of mutant viruses. (A) Most abundant variants present at final timepoint. Resistance mutations in the viruses selected starting with the wild-type virus are in blue, and the selection starting with the pool of mutant viruses in in red. The culture name indicates a virus pool (V), the UMASS PI number (V1), and whether the selection started with wild-type or mutants (V1wt). PR sequences that were used to generate purified recombinant protease are indicated (e.g., PR-3wt). The final protease inhibitor (PI) concentration reached and the R1 and R2 moieties are indicated along with the PI. (B) Number of mutations present in the three most abundant variants of each selection at two different PI concentrations. Cultures containing I84V resistance mutation are in black (n = 4), I50V-containing cultures are in white (n = 7), and cultures with I50V+I84V linked are shown with hatched box (n = 3). Unpaired t-test was used to compare the number of mutations in the 84V vs. the 50V cultures. (C) EC50 values for highlighted selections in panel (A) reaching 100 nM (square) and 5000 nM (triangle). (D) Relative infectivity values for the same selections shown relative to the wild-type virus (circle). Relative infectivity was measured with normalized input amounts of HIV-1 p24 CA protein in replicates (n=3). Error bars show range of values. (E) Enzyme inhibition constants (Ki) of end point PR variants versus catalytic efficiency (kcat/Km). Open circle represents wild-type NL4-3. Trendline is for visualization purposes only. * p<0.05, **p<0.01, ***p<0.001.
-
Figure 2—source data 1
Source sequence data for top abundant variant in panel A.
- https://cdn.elifesciences.org/articles/80328/elife-80328-fig2-data1-v3.xlsx
-
Figure 2—source data 2
Source sequence data for top 3 most abundant variants in panel A.
- https://cdn.elifesciences.org/articles/80328/elife-80328-fig2-data2-v3.xlsx
Figure 2—figure supplement 1
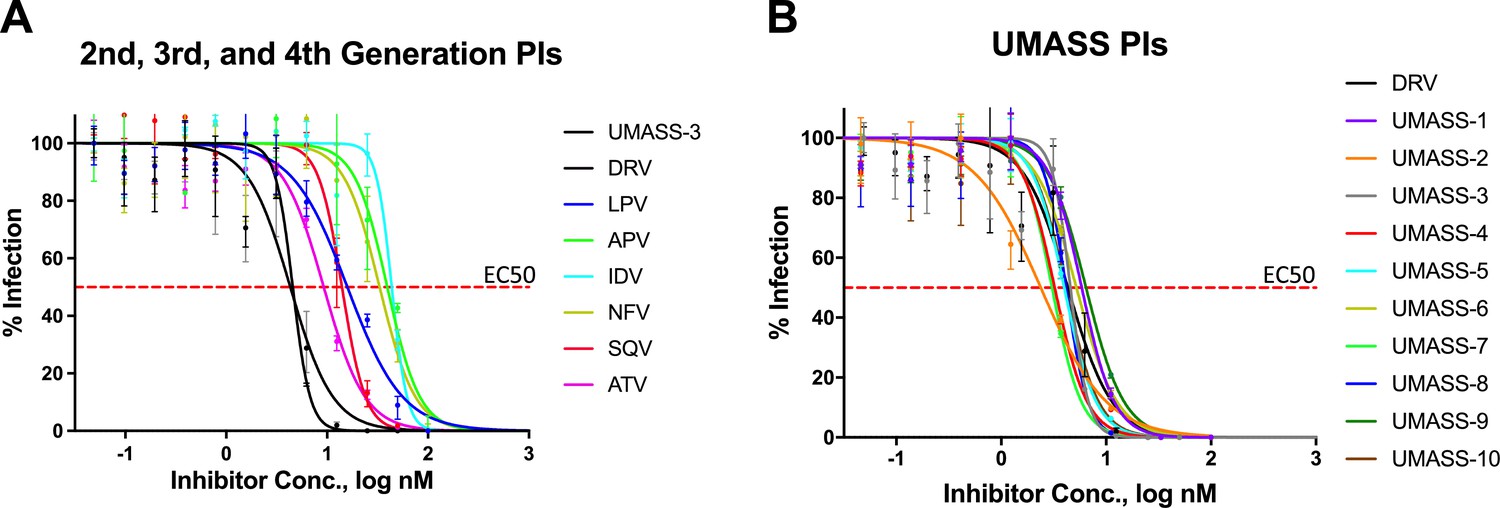
EC50 inhibition curves for 2nd, 3rd, 4th, and 5th generation protease inhibitors.
EC50 inhibition curves for (A) old and new protease inhibitors and (B) fifth-generation analogs of darunavir (DRV) (UMASS-1–10).
Figure 2—figure supplement 2
Enzymatic inhibition constant (Ki) values for UMASS-1–10 in the presence of pro with I84V or I50V/A71V mutations.
UMASS-1, -3, -6, and -8 show less potency toward these variants and are shaded in a red tint matching R2 groups. UMASS-2, -5, -7, and -10 show increased potency toward these variants and are shaded in a green tint matching R2 groups.
Figure 2—figure supplement 3
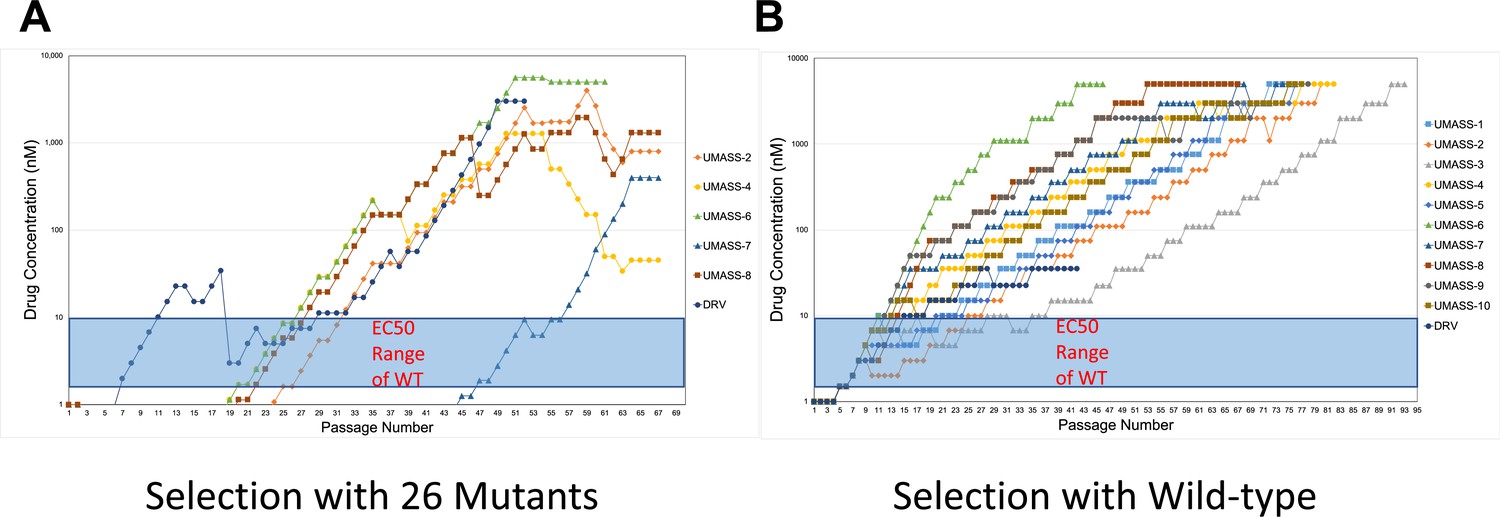
Increasing inhibitor concentrations of viral selection passages.
(A, B) Viral selections with darunavir (DRV) and UMASS-1–10 have increasing inhibitor concentrations during passaging. Passages are increased when extensive cytopathic effect (CPE) is observed during protease inhibitor (PI) selection. Virus generated from the (A) 26 single mutants or (B) NL4-3 molecular clone was passaged in the presence of increasing inhibitor concentration as described in the text. The period of time (in days) until the virus-infected culture displayed maximal CPE (massive syncytia) was 4–7 days on average.
Figure 2—figure supplement 4
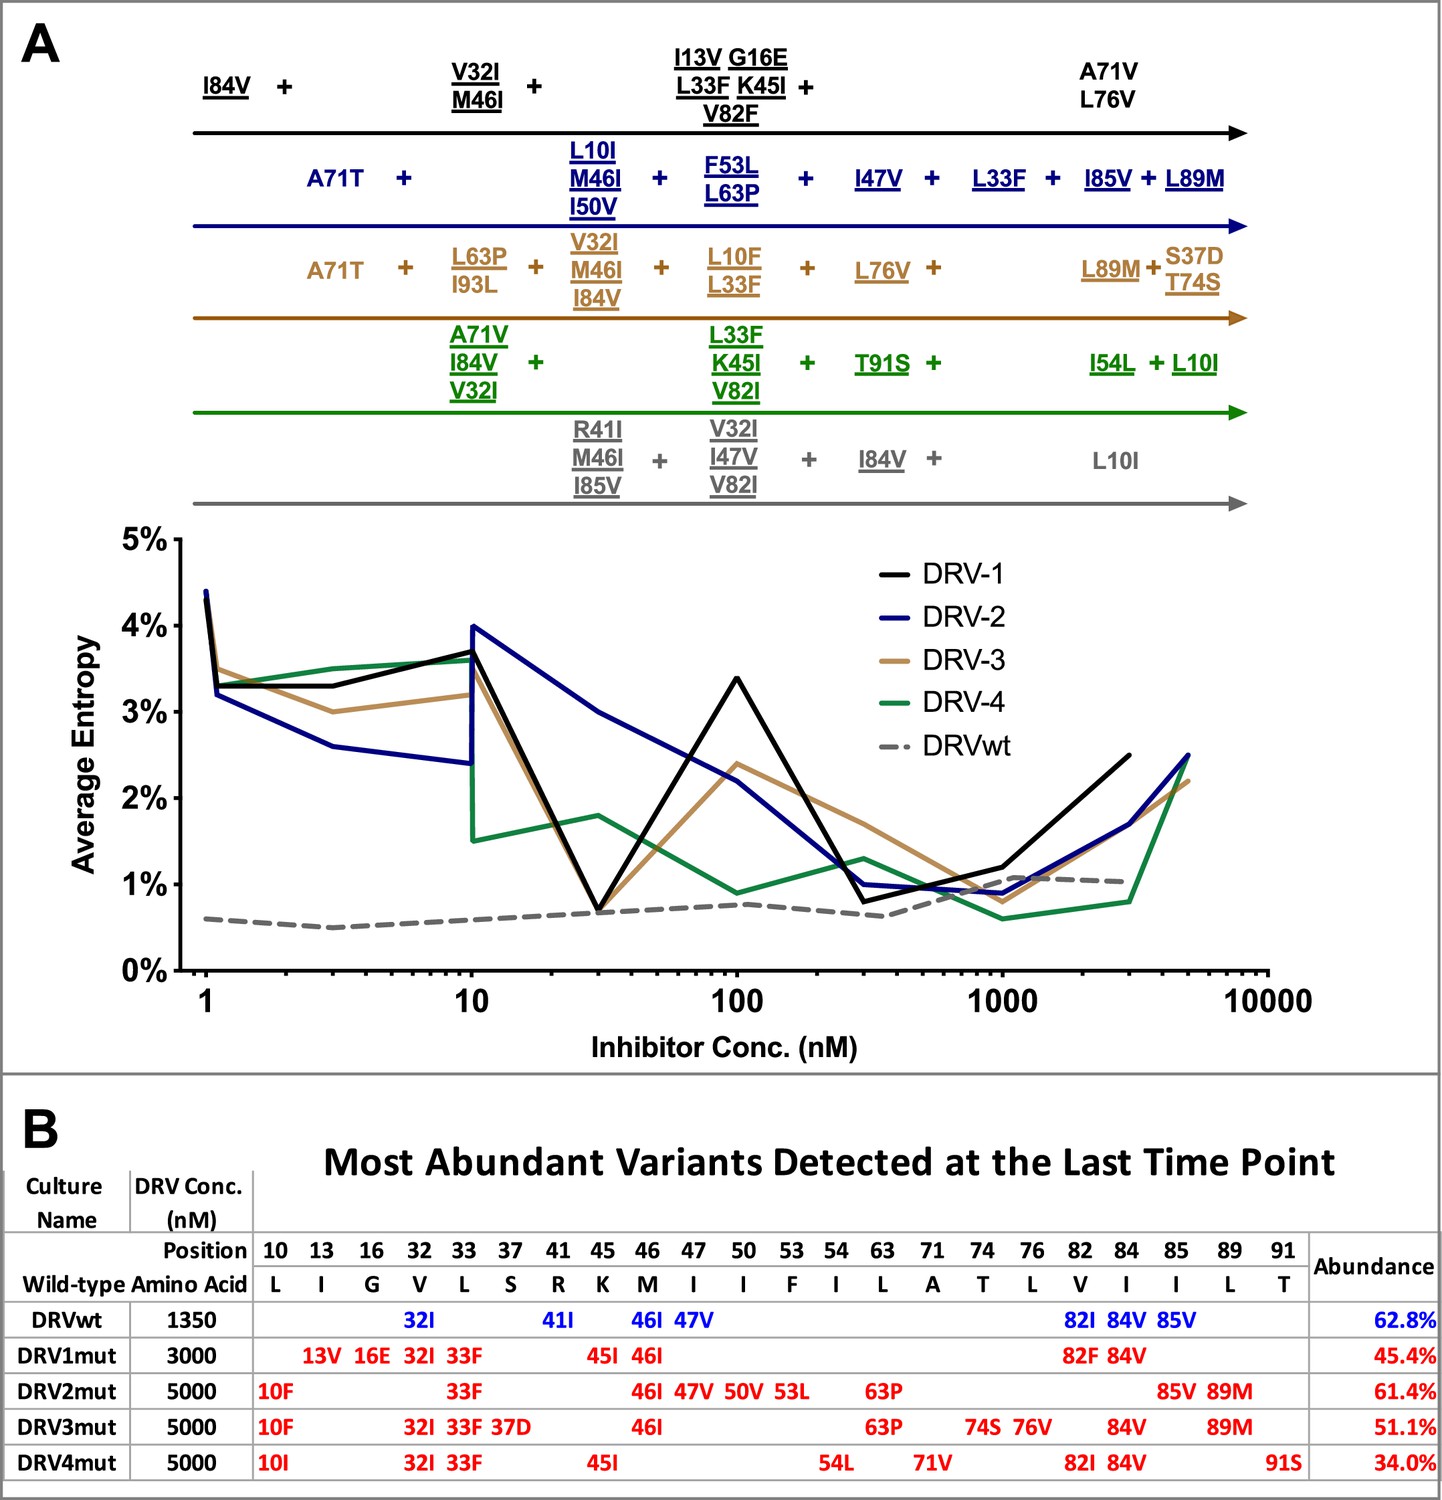
Shannon’s entropy in the protease region through five of five darunavir (DRV) selections.
(A) Shannon entropy was calculated using sequence diversity in the protease region through five darunavir (DRV) selections. Abundant mutations are shown and fixed mutations are underlined. (B) The most abundant viral variant present at the final timepoint of each selection. Mutations arising from selections beginning with wild-type virus are shown in blue while mutations occurring in selections starting from 26 mutants are shown in red. Abundance of these variants is labeled as a percentage on the right.
-
Figure 2—figure supplement 4—source data 1
Source sequence data for top abundant variant DRV passages in panel A.
- https://cdn.elifesciences.org/articles/80328/elife-80328-fig2-figsupp4-data1-v3.xlsx
Figure 3 with 2 supplements
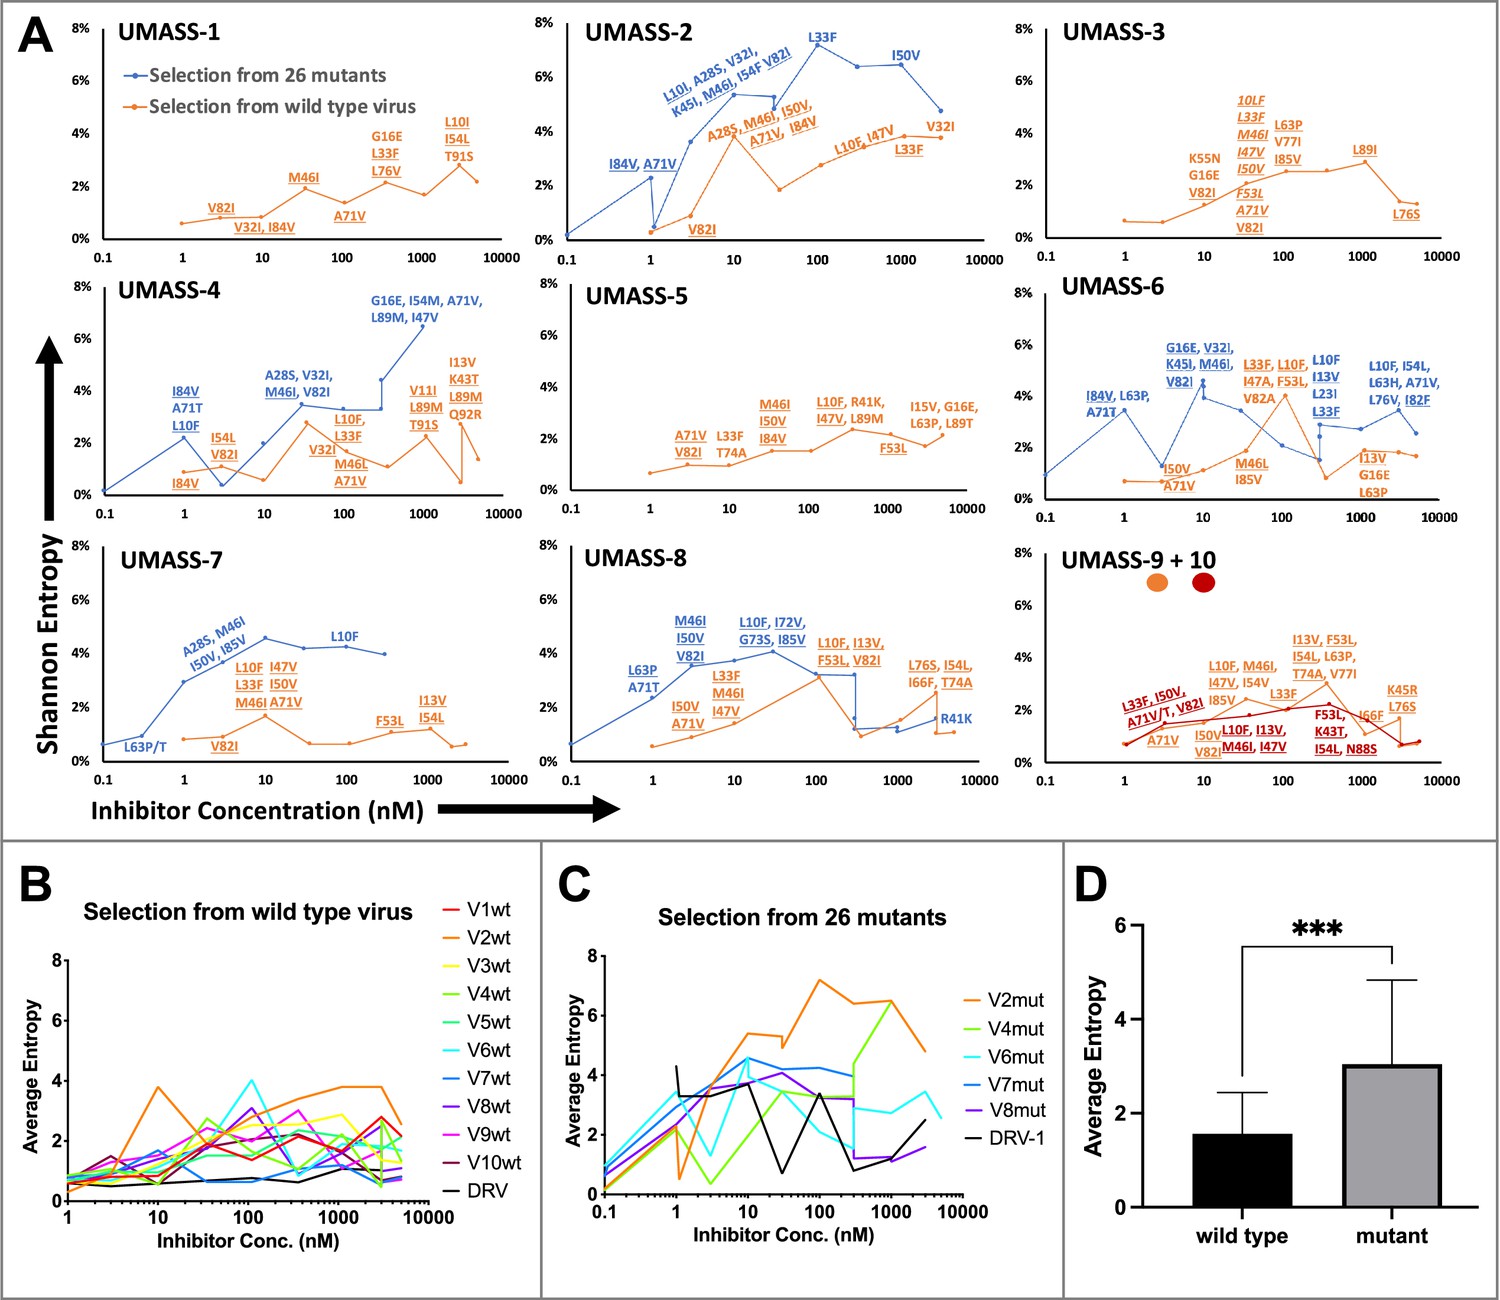
Evaluation of sequence diversity in the viral population during increasing selective pressure with protease inhibitor (PI) inhibitors.
(A) Shannon entropy was calculated using sequence diversity in the protease region. Abundant mutations are shown and fixed mutations are underlined. Selections from wild type are in orange (n = 6) and from the mutant pool (n = 11) in blue. Two selections from wild-type virus are shown in orange (UMASS-9) and red (UMASS-10). (B) Compiled Shannon entropy values from selections starting with wild-type virus that reached concentrations of >1000 nM. (C) Compiled Shannon entropy values from selections starting with the pool of mutant viruses that reached concentrations of at least 400 nM. (D) Selections starting with the pool of 26 mutants showed higher entropy than the pool starting with WT (n=10, n=10) when averaged over all analyzed drug concentrations (p<0.001 using the unpaired t-test). Error bars show standard deviation.
Figure 3—figure supplement 1
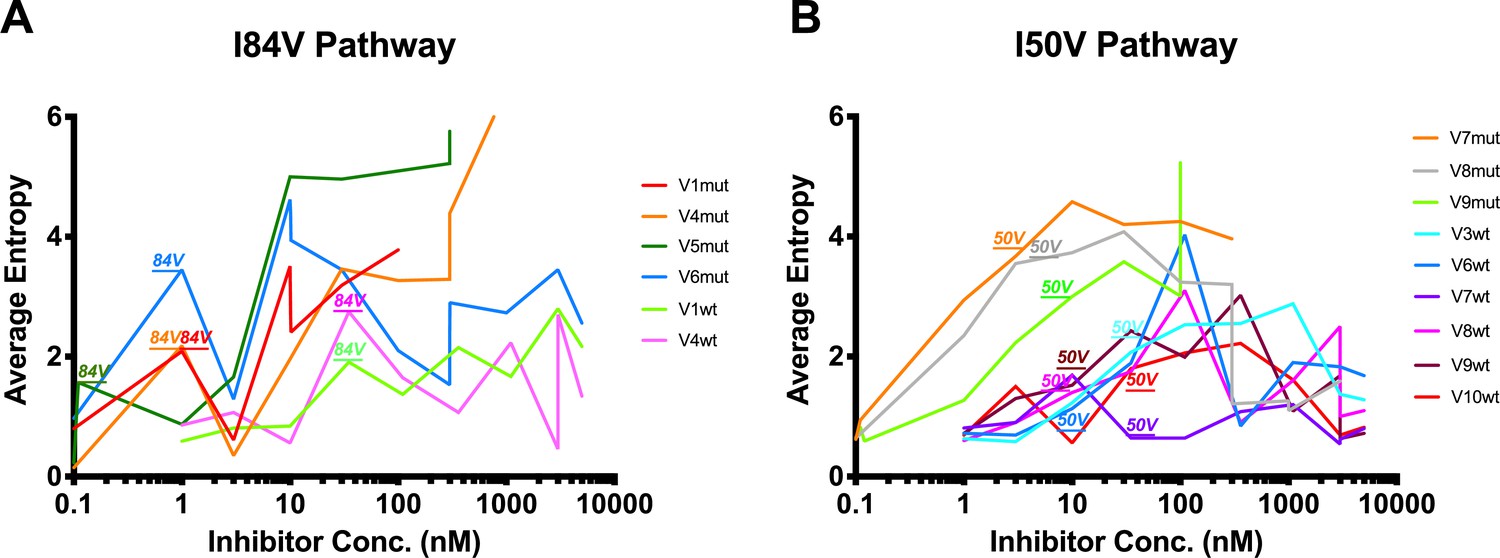
Shannon’s entropy of viral cultures undergoing difference resistance pathways.
(A, B) Shannon’s entropy of viral cultures that utilize either (A) I84V or (B) I50V as their resistance pathway. When I84V or I50V arise in the selection cultures above the Poisson distribution, that incident is labeled above the graph. I84V mutations are associated with increases/decreases in entropy while I50V mutations are not associated with major entropy differences.
Figure 3—figure supplement 2
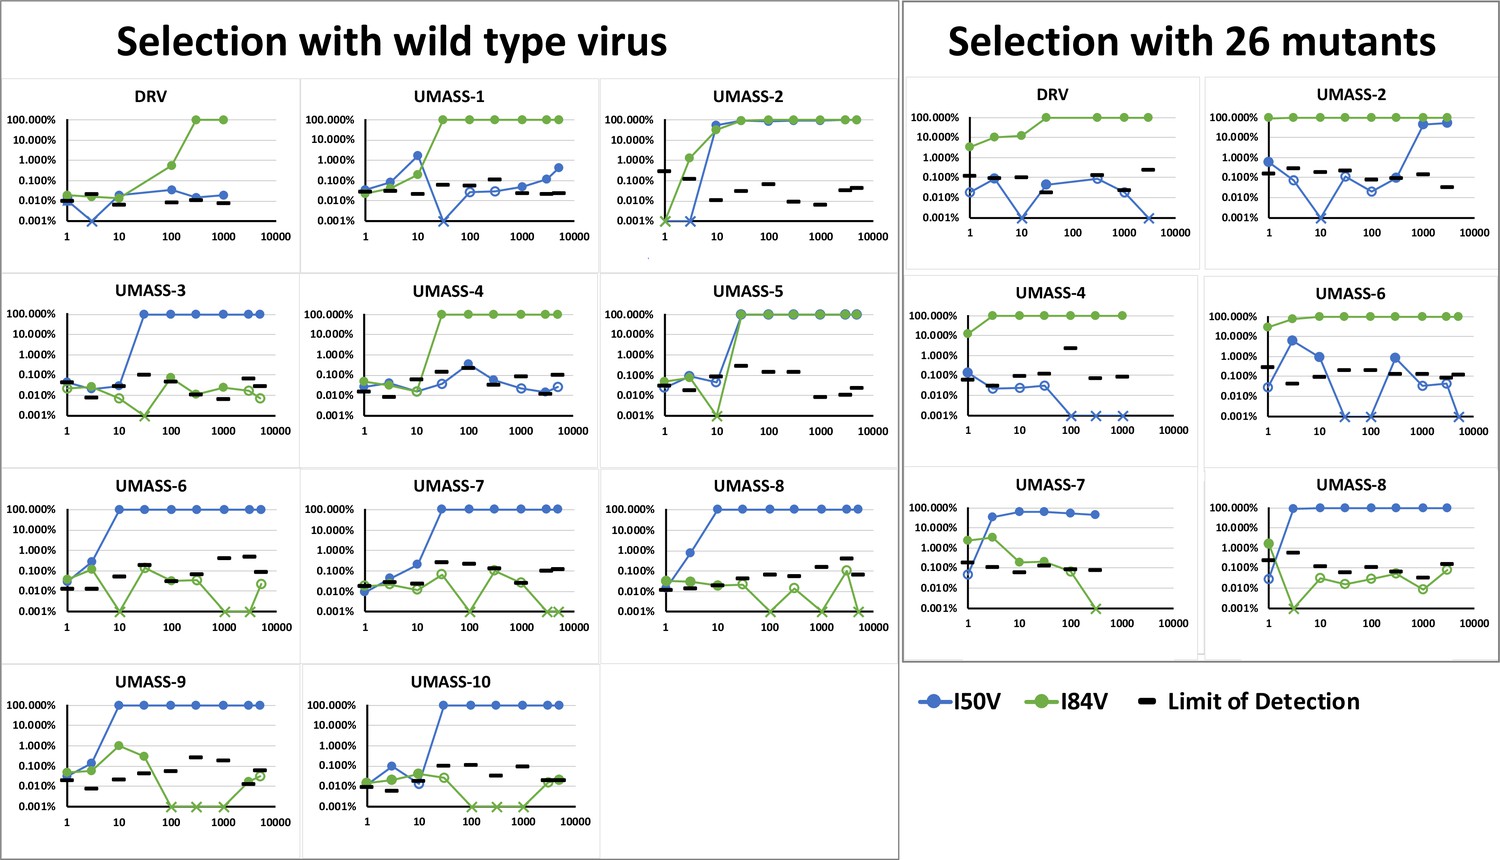
Abundance of I50V and I84V mutations at each drug concentration of all UMASS inhibitors that reached at least 1000 nM concentrations in culture.
Abundance limit of detection cutoffs are shown as black lines on each timepoint to resemble our template consensus sequences (TCS) Poisson distribution calculation as shown in Zhou et al., 2015.
Figure 4 with 1 supplement
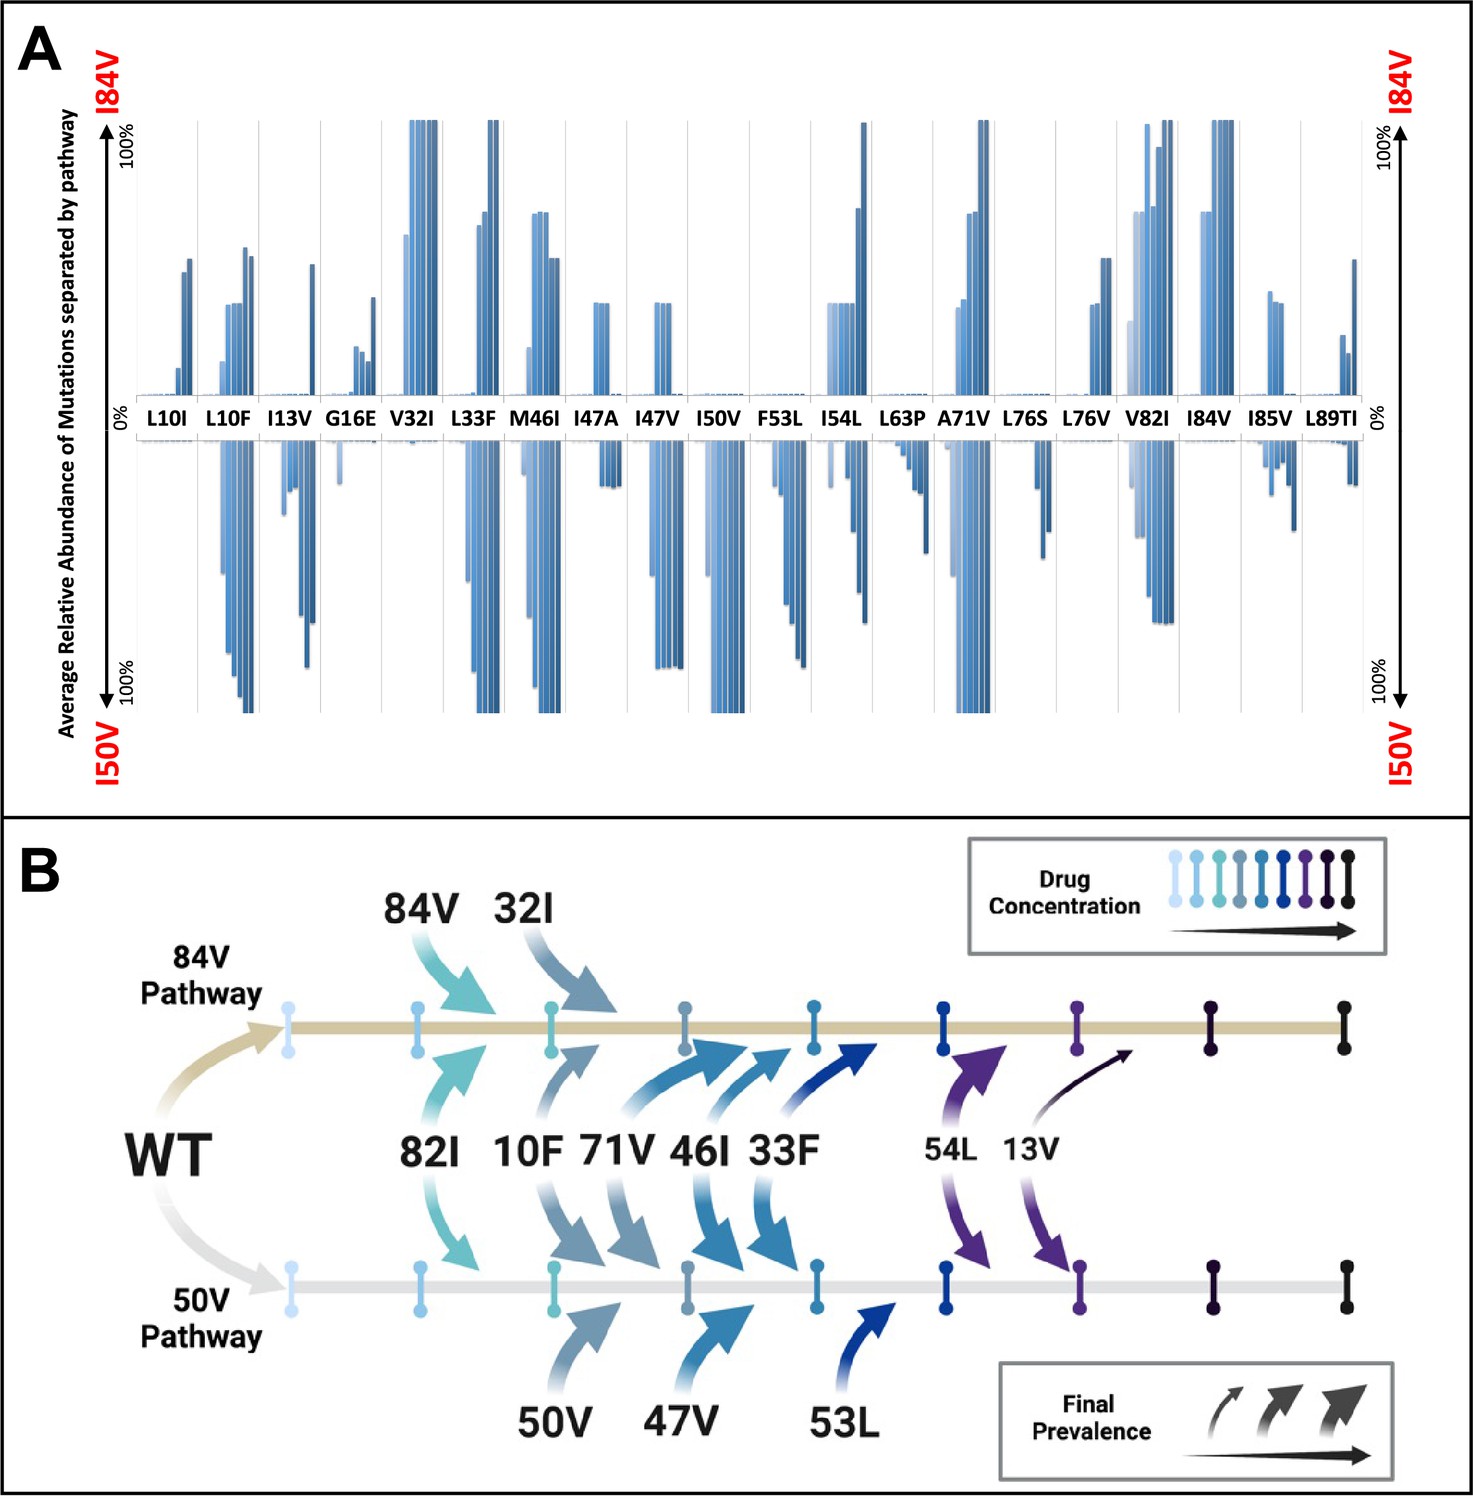
Patterns of accumulation of amino acid substitutions associated with resistance during selection.
(A) Abundance data from selections for each indicated amino acid substitution were pooled and examined sequentially at different levels of drug concentration. Selections that reached the maximum concentration of at least 3000 nM were assessed longitudinally to allow for all timepoints to be averaged equally. Mutations from selections resulting in the I84V pathway (V1wt, V4wt, and V6mut) point up, with I84V reaching 100% penetrance by definition. Similarly, those selections that fixed I50V only (V3wt, V6-10wt) are shown pointing downward, with I50V reaching 100% penetrance. (B) Schematic representations of the addition of mutations found in I84V and I50V pathways. Each mutation’s position on the timeline of drug concentrations was estimated using the pools of selections from each I84V and I50V pathways. This summary does not reflect the exact order and linkage of mutations for each individual selections in that pathway but rather the generalizable pattern inferred by comparing across the multiple cultures. The size of the arrows represents how prevalent that mutation was among the cultures at the end of the selection process.
Figure 4—figure supplement 1
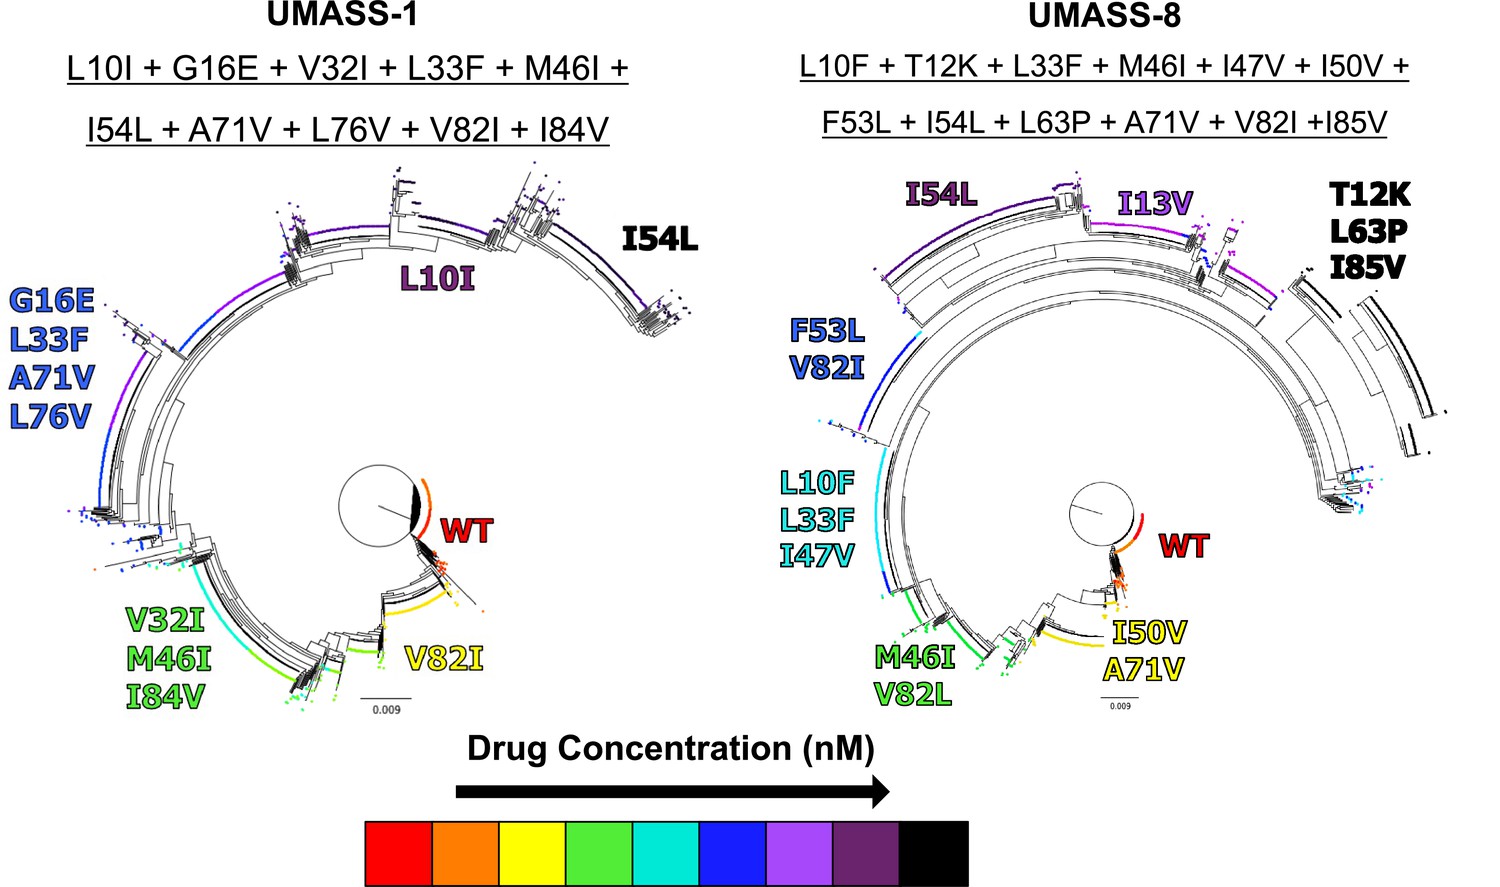
Introduction of mutations at increasing drug concentrations.
Phylogenetic trees of wild-type selection cultures against UMASS-1 and UMASS-8, showing the addition of mutations found in I84V and I50V pathways. Each mutation’s position and color denote the drug concentration at which that mutation became prevalent in the population. The most abundant viral variant present at the final timepoint of each selection is underlined above the corresponding tree.
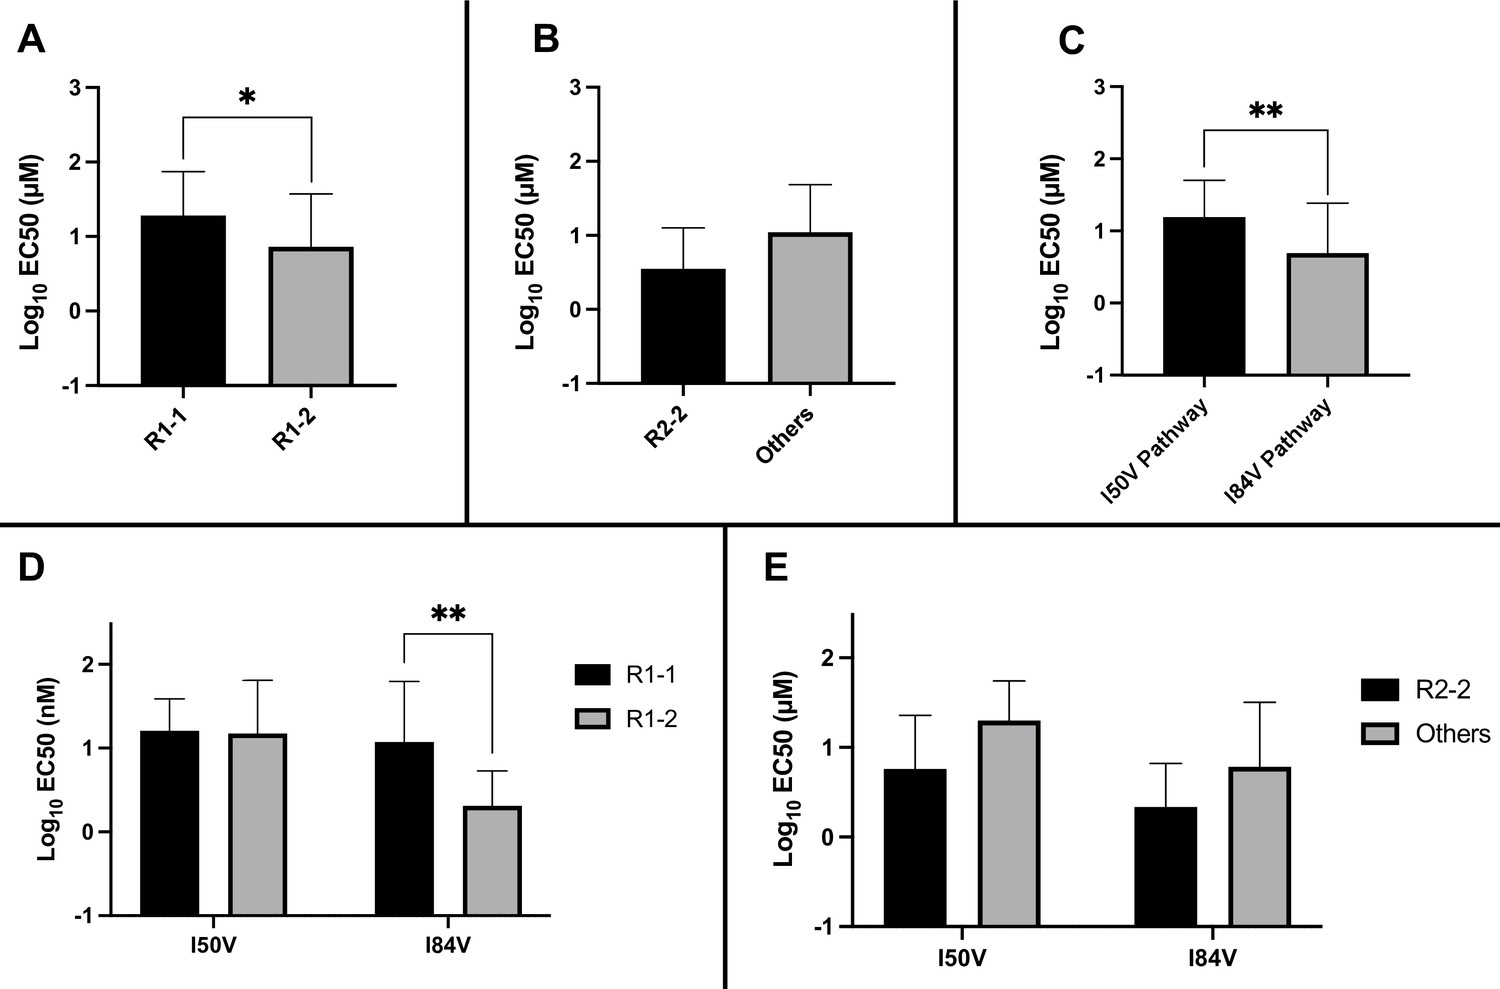
Figure 5
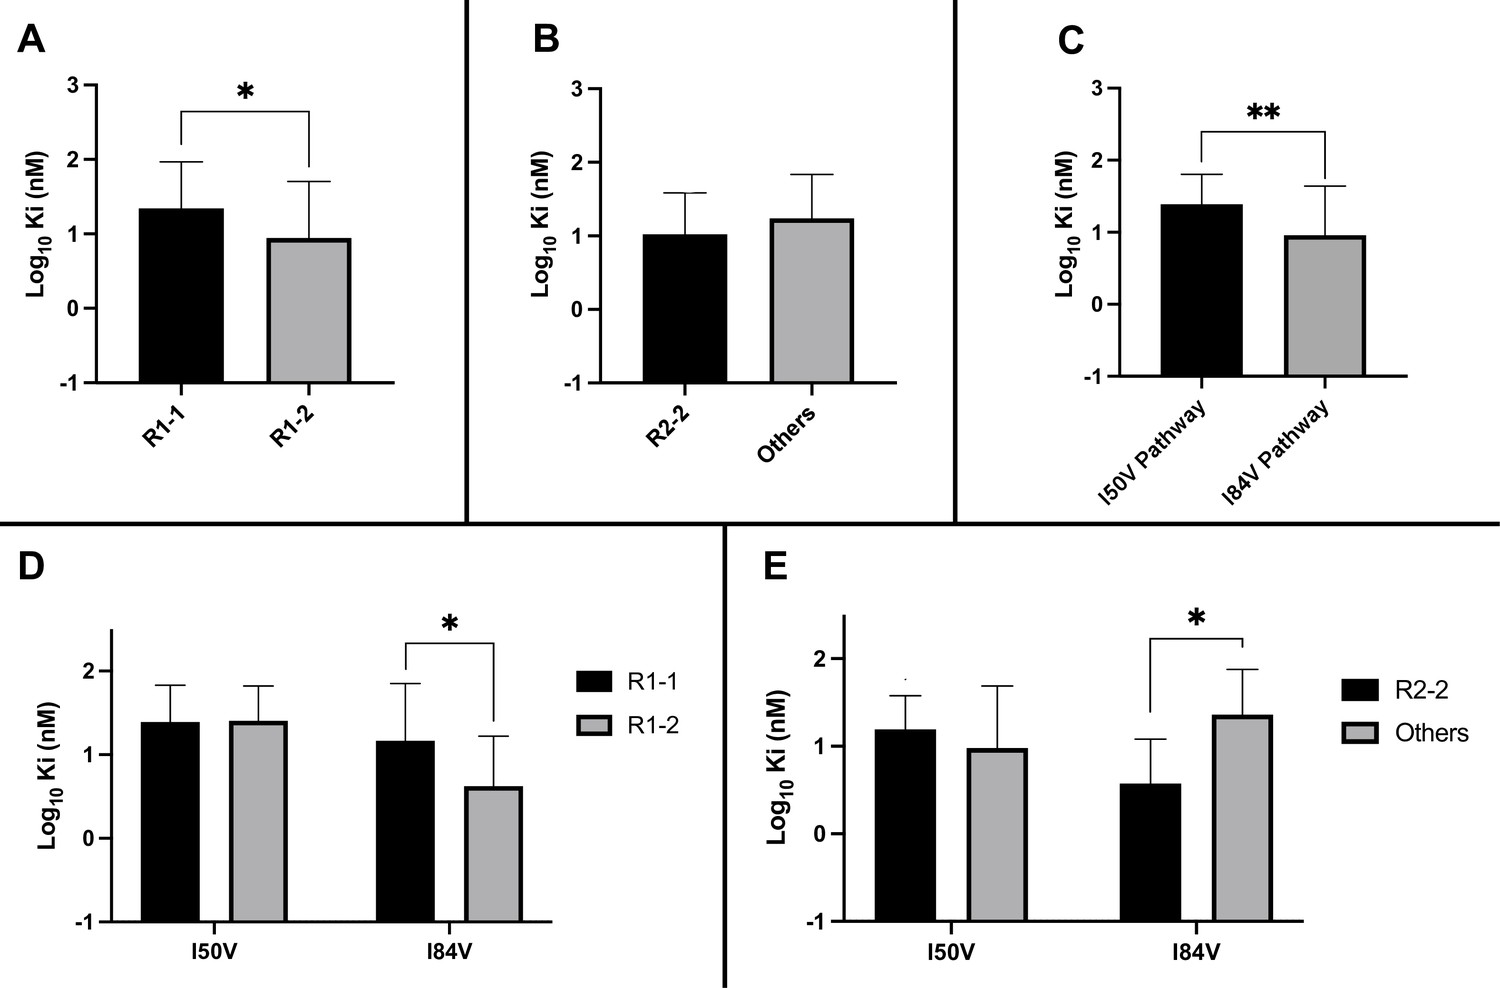
Analysis of Ki values for mutant enzymes.
Ki values were determined against all UMASS inhibitors (Table 1). Brackets above the bars represent significant p-values between the two groups using the unpaired t-test. Data were pooled in different ways for the following analyses: (A) the Ki values against the inhibitors with the larger R1-2 moiety (n = 34) were more potent against resistant proteases compared to the inhibitors with the smaller R1-1 moiety (n = 35) (B) Ki values for the inhibitors with the R2-2 group (n = 10) showed a trend toward being more potent against the highly mutated proteases compared to the other R2 groups (n = 40). (C) Ki values for enzymes with the I50V mutation (n = 33) showed greater resistance to the inhibitors compared to enzymes with the I84V mutation (n = 22). (D) The R1-2 moiety provided increased potency to enzymes with the I84V mutation (n = 20) but not the I50V mutation (n = 20). (E) The R2-2 moiety was more potent against the enzymes with I84V mutation (n = 10) compared to the enzymes with the I50V mutation (n = 10). The unpaired t-test was used to assess differences in Ki values. Error bars show standard deviation.
Figure 6
Analysis of EC50 values for mutant virus cultures.
EC50 values were determined for a subset of the selected virus cultures against a panel of inhibitors (n = 50). For (A–E), the EC50 data were pooled using the same methods and sample numbers as in Figure 5. The highest level of resistance recorded was 100 µM. The Mann–Whitney rank-sum test was used to assess differences in EC50 values. Error bars show standard deviation.
Figure 7
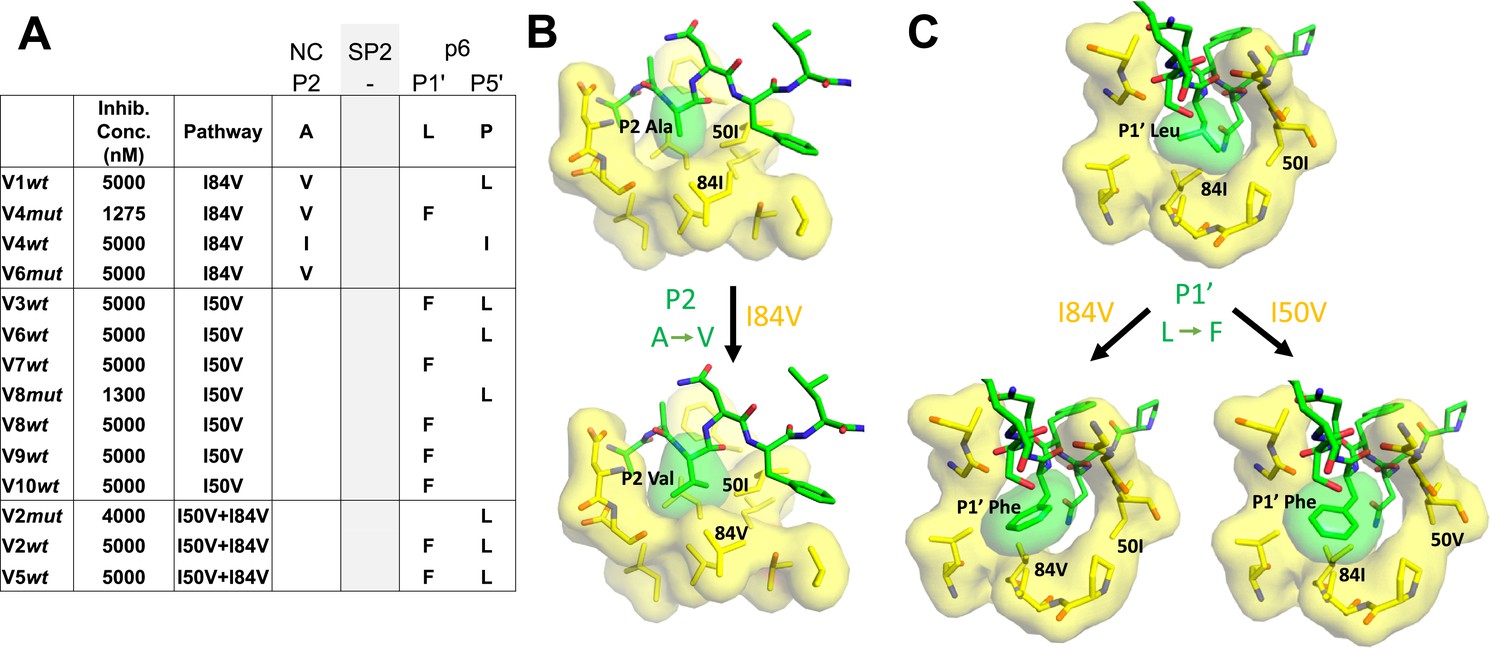
Protease cleavage site mutations observed after selection for high-level resistance.
(A) Culture names, final inhibitor concentration, and resistance pathway are shown. Changes in amino acid sequence are shown for the NC/SP2 and SP2/p6 cleavage sites. (B) P2 substitution in the NC/SP2 cleavage site with the I84V mutation modeled. Subsite structure was modeled using the original structure (PDB: 1KJH) and mutating the P2 position in the subsite pocket from alanine to valine. (C) P1' change in the SP2/p6 cleavage site with either the I84V mutation or the I50V mutations modeled. Subsite structure was modeled using the original structure (PDB: 1KJF) and mutating the P1’ position from leucine to phenylalanine.
-
Figure 7—source data 1
Sequenceing data for protease cleavage sites.
- https://cdn.elifesciences.org/articles/80328/elife-80328-fig7-data1-v3.xlsx
Figure 8
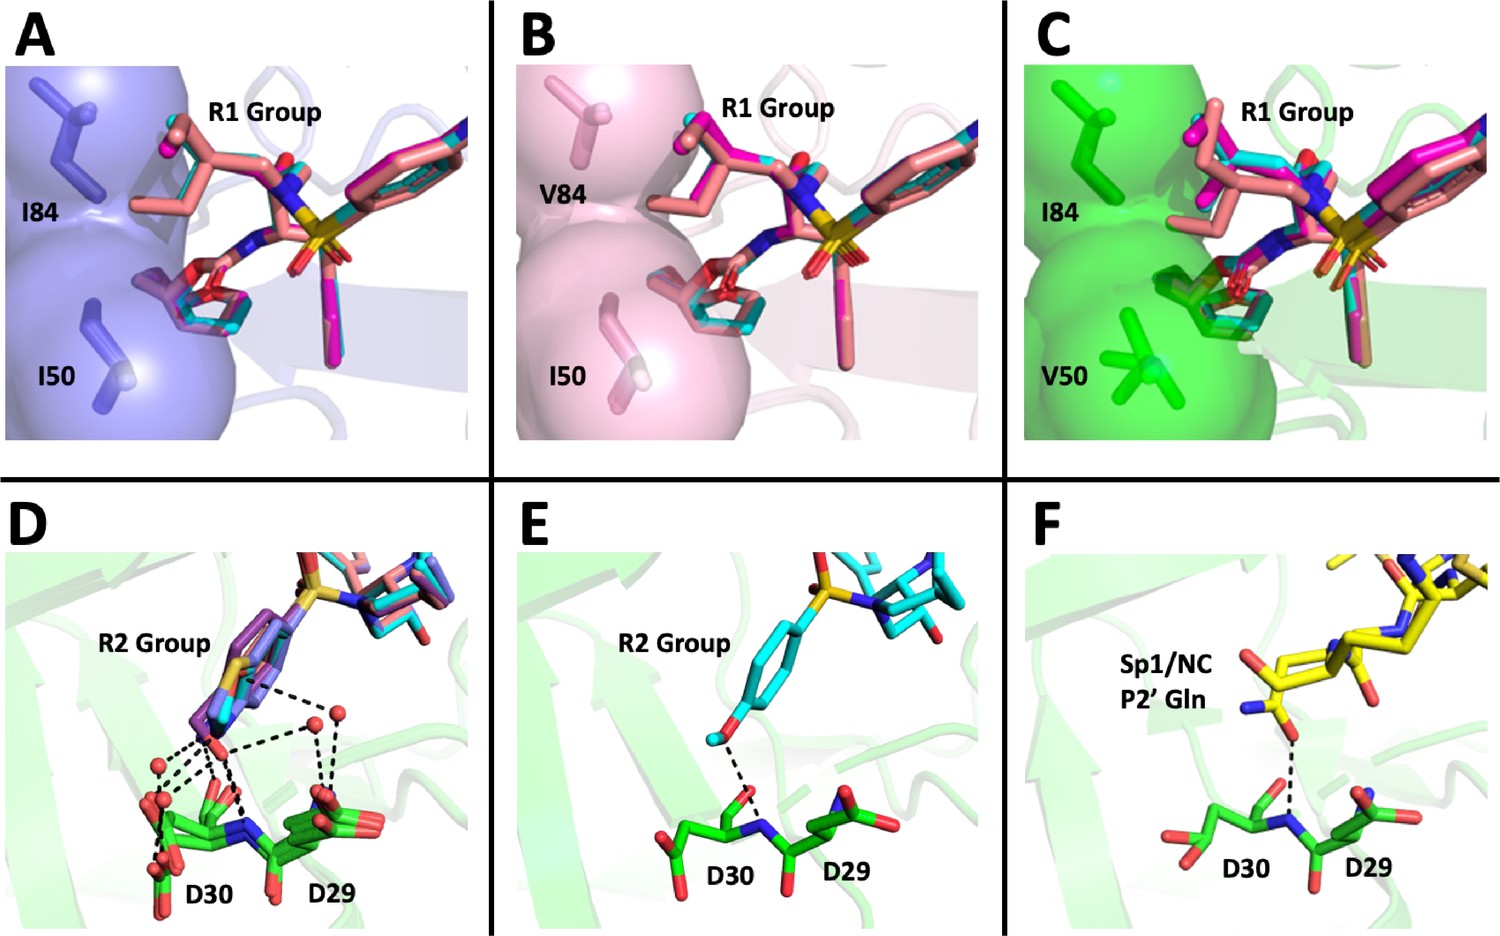
Structural interpretation of protease inhibitor resistance and of residual inhibitor potency.
(A–C) Hydrophobic packing in the S1’ subsite in complex with R1 structural groups; darunavir is shown in cyan, UMASS-1 in magenta, and UMASS-6 in salmon. (A) The two forms of R1 and darunavir (DRV) are shown packing against wild-type protease at I84 and I50 DRV, UMASS-1, UMASS-6 in wild-type protease (PDB: 6DGX [cyan], 6DGY [magenta], 6DGZ [salmon]). (B) Those same inhibitors packing against the I84V mutant (PDB: 6DH0 [cyan], 6DH1 [magenta], 6DH2 [salmon]). (C) Those same inhibitors packing against the I50V protease variant (PDB:, 6DH6 [salmon], 6DH7 [magenta], 6DH8 [salmon]). (D–F) Binding interactions with Asp29 and Asp30 of the protease S2' subsite in complex with R2 structural groups. Inhibitor/enzyme interactions are shown with black dashed lines representing hydrogen bonds (<3.0 Å). (D) UMASS-1, UMASS-3, UMASS-4, and UMASS-5 in WT protease (PDB: 3O99 [salmon], 3O9B [purple], 309C [orange], 309D [slate blue]). Water molecules are shown as red dots. (E) UMASS-2 in WT protease (PDB: 3O9A). (F) SP1/NC S2’ subsite representation of peptide substrate complexed with an inactive form of wild-type protease (PDB: 1KJ7) showing an interaction between the P2' glutamine and the protein backbone at Asp29 and Asp30.
Tables
Table 1
Structures, Ki constants, and EC50 values of the UMASS series of HIV-1 protease inhibitors (PIs).
| Inhibitor | Structure | Ki (pM) | EC50 (nM) | |||
|---|---|---|---|---|---|---|
| WT | I84V | I50V/A71V | WT | Viral culture (5000 nM) | ||
| DRV | 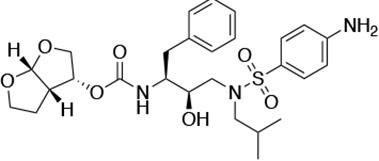 | <5.0* | 25.6 ± 5.6* | 74.5 ± 5.6* | 7.7 ± 1.6 | >100,000 |
| UMASS-1 | 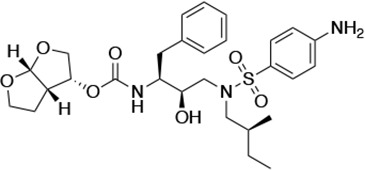 | <5.0* | 26.1 ± 3.7* | 110.3 ± 8.8* | 5.9 ± 1.0 | |
| UMASS-2 | 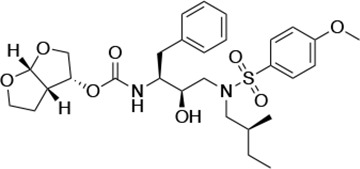 | <5.0 | <5.0 | 15.0 ± 2.7 | 2.4 ± 0.3 | |
| UMASS-3 | 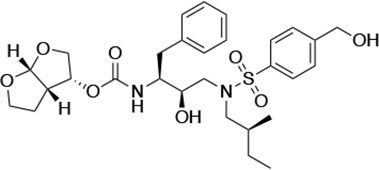 | <5.0 | 9.9 ± 2.7 | 79.9 ± 5.9 | 9.1 ± 1.0 | 14,800 ± 6800 |
| UMASS-4 |  | <5.0 | 10.5 ± 1.8 | 32.9 ± 3.0 | 3.2 ± 0.4 | 13,700 ± 6600 |
| UMASS-5 | 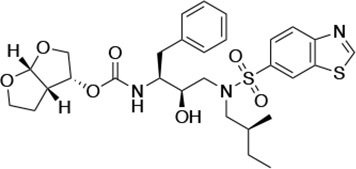 | <5.0 | 7.0 ± 1.7 | 7.8 ± 0.9 | 4.0 ± 0.5 | >100,000 |
| UMASS-6 | 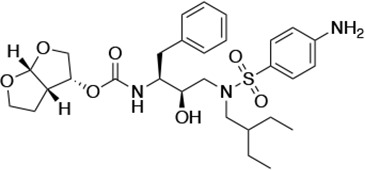 | <5.0* | 12.8 ± 3.1* | 100.0 ± 9.9* | 5.2 ± 0.8 | |
| UMASS-7 | 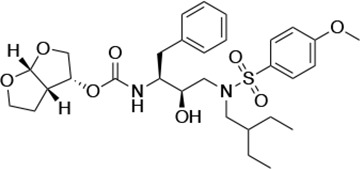 | <5.0 | 12.1 ± 4.5 | 18.2 ± 3.0 | 3.1 ± 0.5 | |
| UMASS-8 |  | <5.0 | <5.0 | 55.4 ± 4.0 | 4.2 ± 0.9 | |
| UMASS-9 | 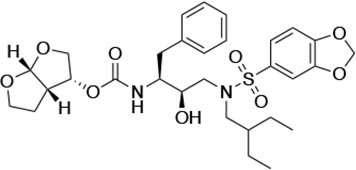 | <5.0 | 7.6 ± 1.6 | 42.3 ± 2.6 | 6.4 ± 1.2 | >100,000 |
| UMASS-10 | 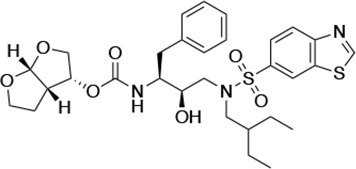 | <5.0 | 14.3 ± 9.3 | 5.8 ± 1.1 | 4.1 ± 0.9 | |
-
*
Previously reported in Lockbaum et al. (ACS Infect Dis. 2019 Feb 8; 5 (2): 316–325).
Additional files
Download links
A two-part list of links to download the article, or parts of the article, in various formats.
Downloads (link to download the article as PDF)
Open citations (links to open the citations from this article in various online reference manager services)
Cite this article (links to download the citations from this article in formats compatible with various reference manager tools)
Selection of HIV-1 for resistance to fifth-generation protease inhibitors reveals two independent pathways to high-level resistance
eLife 12:e80328.
https://doi.org/10.7554/eLife.80328


