Impaired bone strength and bone microstructure in a novel early-onset osteoporotic rat model with a clinically relevant PLS3 mutation
- Department of Endocrinology, Key Laboratory of Endocrinology, National Health and Family Planning Commission, Peking Union Medical College Hospital, Chinese Academy of Medical Sciences and Peking Union Medical College, China
- Key Laboratory of Human Disease Comparative Medicine, NHFPC, Institute of Laboratory Animal Science,Chinese Academy of Medical Sciences & Comparative Medical Center, Peking Union Medical College, China
Figures
Figure 1 with 1 supplement

Rats with PLS3 E10-16del mutation built by CRISPR/Cas9 and confirmation.
(A) Schematic diagram of targeted PLS3 gene deletion using CRISPR/Cas9 and Sanger sequencing analysis. Four specific CRISPR target sites near the genomic region of exon 10–16 were designed. CRISPR/Cas9 systems specifically cleaved the target sites. Sanger sequence confirmed the genomic deletion of exon 10–16 (No. 84172–93797 bp) and two base pair insertions at the target site due to non-homologous end joining after the DNA cleavage. (B) Polymerase chain reaction (PCR) genotyping of PLS3E10-16del/0 rats. DNA from tail snips was subjected to PCR using P-KO-F/P-KO-R and P-WT-F/P-WT-R primers for mutant and WT allele, respectively. Amplification of mutant samples resulted in one copy of the upper 554 bp fragment, while WT samples yield one copy of the lower 450 bp fragment. (C) PLS3 gene deletion confirmed by western blot. PLS3 protein expression was absent in various tissues of the PLS3E10-16del/0 rats compared to age-matched WT rats, indicating the whole-body deletion of the PLS3 gene. (D) Quantitative PCR (qPCR) confirmation of PLS3 E10-16 deletion. The results of PLS3-KO indicated the expression level of PLS3 E10-16 (knockout region). The results of PLS3 indicated the expression level of PLS3 E1-9 (uneditable region). The expression level of PLS3 E10-16 was extremely low in PLS3E10-16del/0 rats while the expression level of PLS3 exon 1–9 was similar to WT rats. Data were pooled from three independent experiments and were presented as mean ± SEM. Data were analyzed using unpaired two-tailed Student t test. *p <0.05 vs WT groups. (E) Representative image of PLS3 immunohistochemistry in the femoral sections. Os, osteocytes; Ob, osteoblasts; Oc, osteoclasts. Immunohistochemical staining images revealed that PLS3 was present in osteocytes, osteoblasts, and osteoclasts in the cortical (left) and trabecular (right) bone of WT rats. Loss of staining in osteocytes, osteoblasts, and osteoclasts in the PLS3E10-16del/0 rats confirmed the successful deletion of the PLS3 gene in bone. WT: wild-type.
-
Figure 1—source data 1
Sanger sequencing confirmation of PLS3 E10-16 knockout.
- https://cdn.elifesciences.org/articles/80365/elife-80365-fig1-data1-v2.zip
-
Figure 1—source data 2
Western blotting analysis of PLS3 protein expression.
- https://cdn.elifesciences.org/articles/80365/elife-80365-fig1-data2-v2.zip
-
Figure 1—source data 3
Original data of quantitative polymerase chain reaction (qPCR) results.
- https://cdn.elifesciences.org/articles/80365/elife-80365-fig1-data3-v2.xlsx
Figure 1—figure supplement 1
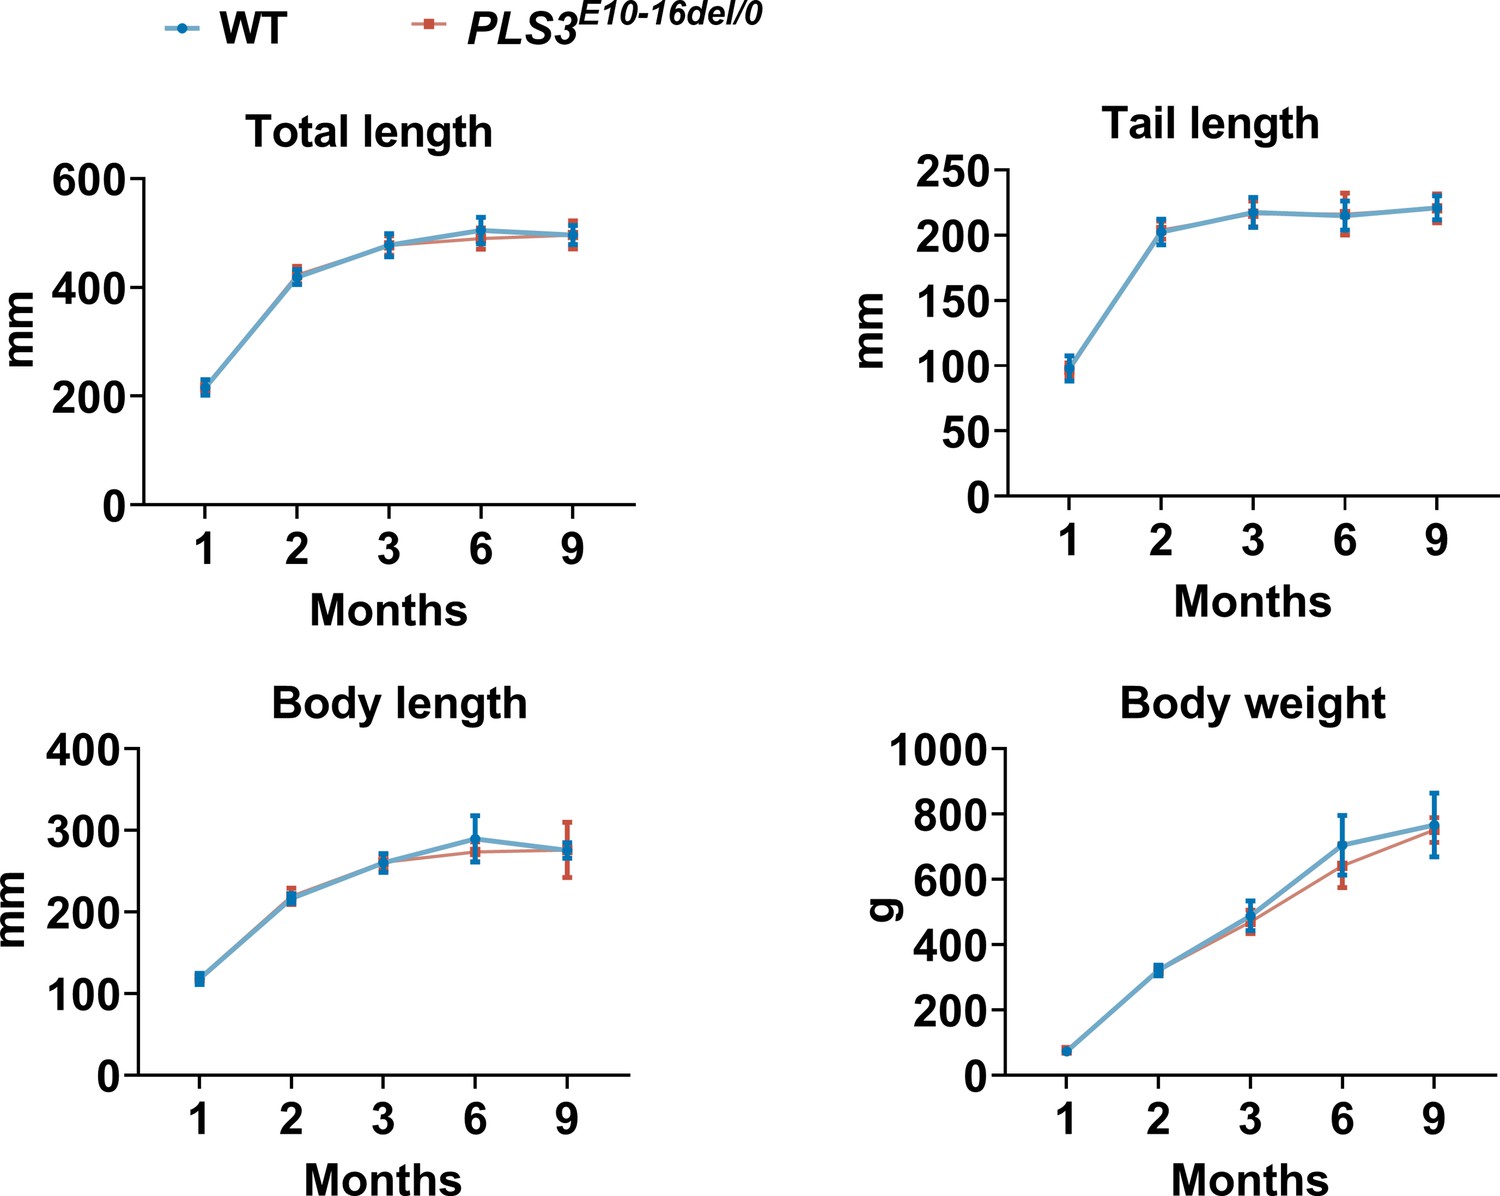
Growth curve of PLS3E10-16del/0 and WT rats (n = 5 per group).
WT: wild-type.
Figure 2 with 2 supplements
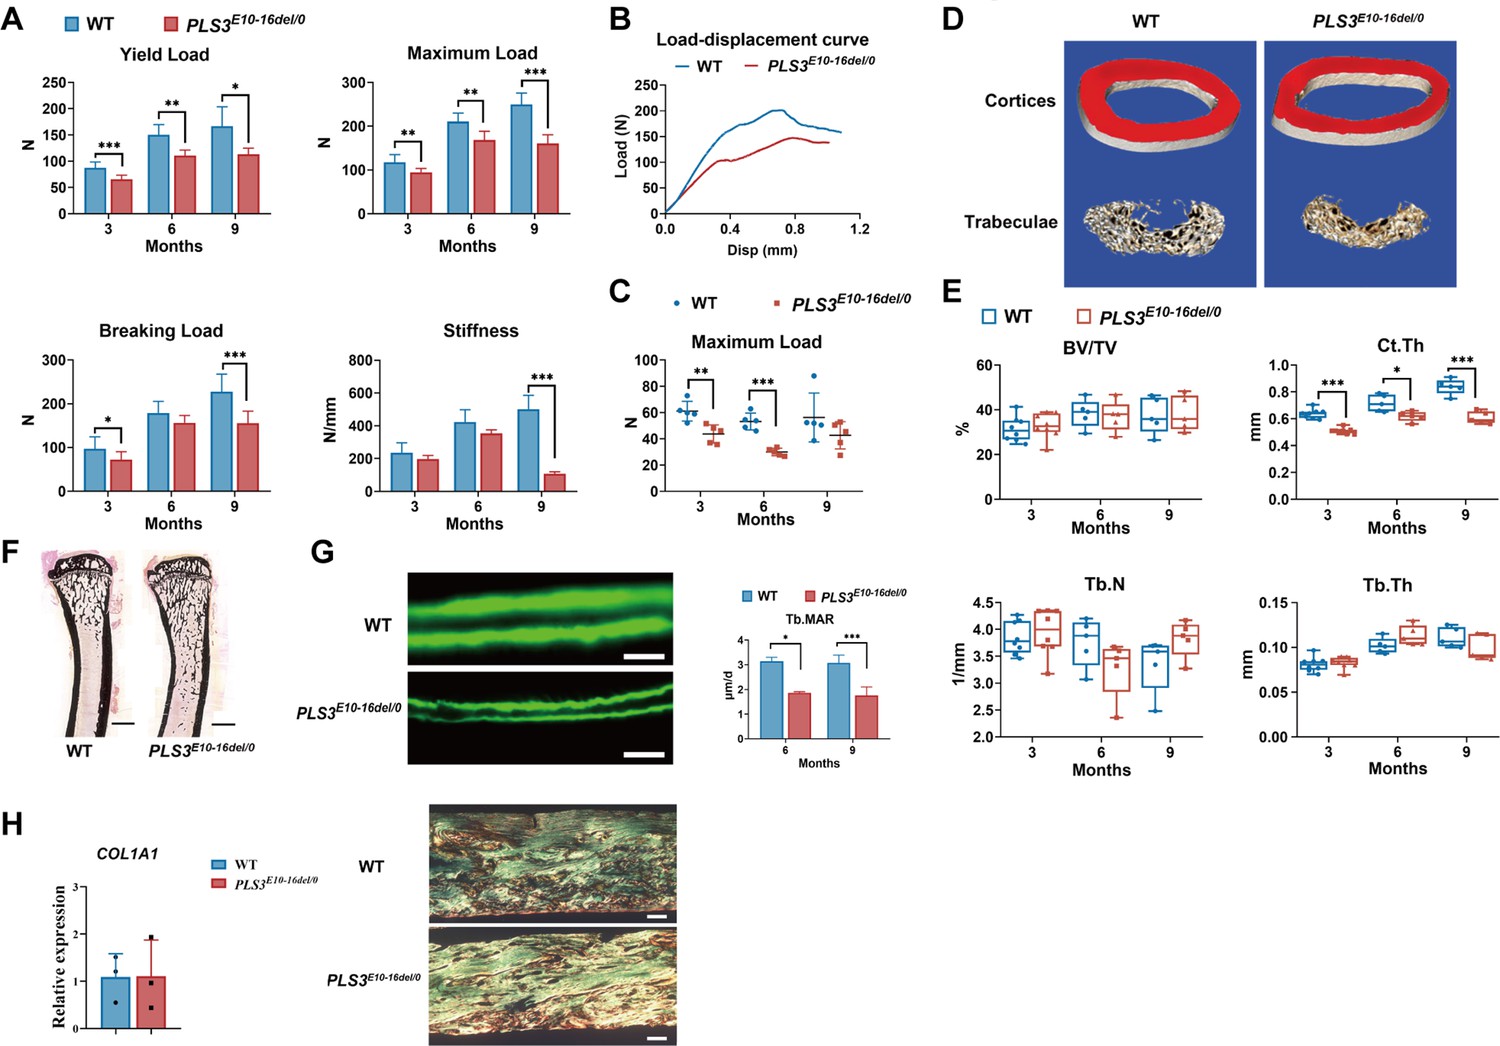
Bone strength, bone microstructure, and bone formation activity of PLS3E10-16del/0 rats.
(A) Mechanical three-point bending tests of femora from PLS3E10-16del/0 and WT rats (n=5-8 per group). (B) Typical load-displacement curves of PLS3E10-16del/0 and WT rats. (C) Indentation tests of L5 from PLS3E10-16del/0 and WT rats (n=5 per group). Data were analyzed using unpaired two-tailed Student t test. *p<0.05, **p <0.01, ***p <0.001 vs WT groups. (D) Three-dimensional reconstruction images of femurs from PLS3E10-16del/0 and WT rats. (E) Micro-CT assessment of the distal femurs from PLS3E10-16del/0 and WT rats (n=5-8 per group). BV/TV: bone volume/tissue volume, Ct.Th: cortical thickness, Tb.Th: trabecular thickness, Tb.N: trabecular number. (F) Representative von Kossa-stained sections of tibia diaphysis of PLS3E10-16del/0 and WT rats. Scale bar = 2000 μm. WT: wild-type. (G) Typical images of unstained and uncalcified vertebra of PLS3E10-16del/0 rats and comparison of mineral apposition rate (n=4 per group). Scale bar = 10 μm. Data were analyzed using unpaired two-tailed Student t test. *p<0.05 vs WT groups. Tb.MAR: mineral apposition rate of lumbar trabeculae. (H) Expression level of COL1A1 and photomicrographs of picrosirius red-stained sections of cortical bone regions of femur visualized through polarized light microscopy. Scale bar = 100 μm. Data were pooled from three independent experiments and were presented as mean ± SEM.
-
Figure 2—source data 1
Original data of the results of three-point binding tests.
- https://cdn.elifesciences.org/articles/80365/elife-80365-fig2-data1-v2.xlsx
-
Figure 2—source data 2
Original data of the results of indentation testing.
- https://cdn.elifesciences.org/articles/80365/elife-80365-fig2-data2-v2.xlsx
-
Figure 2—source data 3
Micro-computed tomography (μCT) analysis of the distal femur and histomorphometric evaluation of L4.
- https://cdn.elifesciences.org/articles/80365/elife-80365-fig2-data3-v2.xlsx
-
Figure 2—source data 4
Original data of histomorphometry.
- https://cdn.elifesciences.org/articles/80365/elife-80365-fig2-data4-v2.xlsx
Figure 2—figure supplement 1
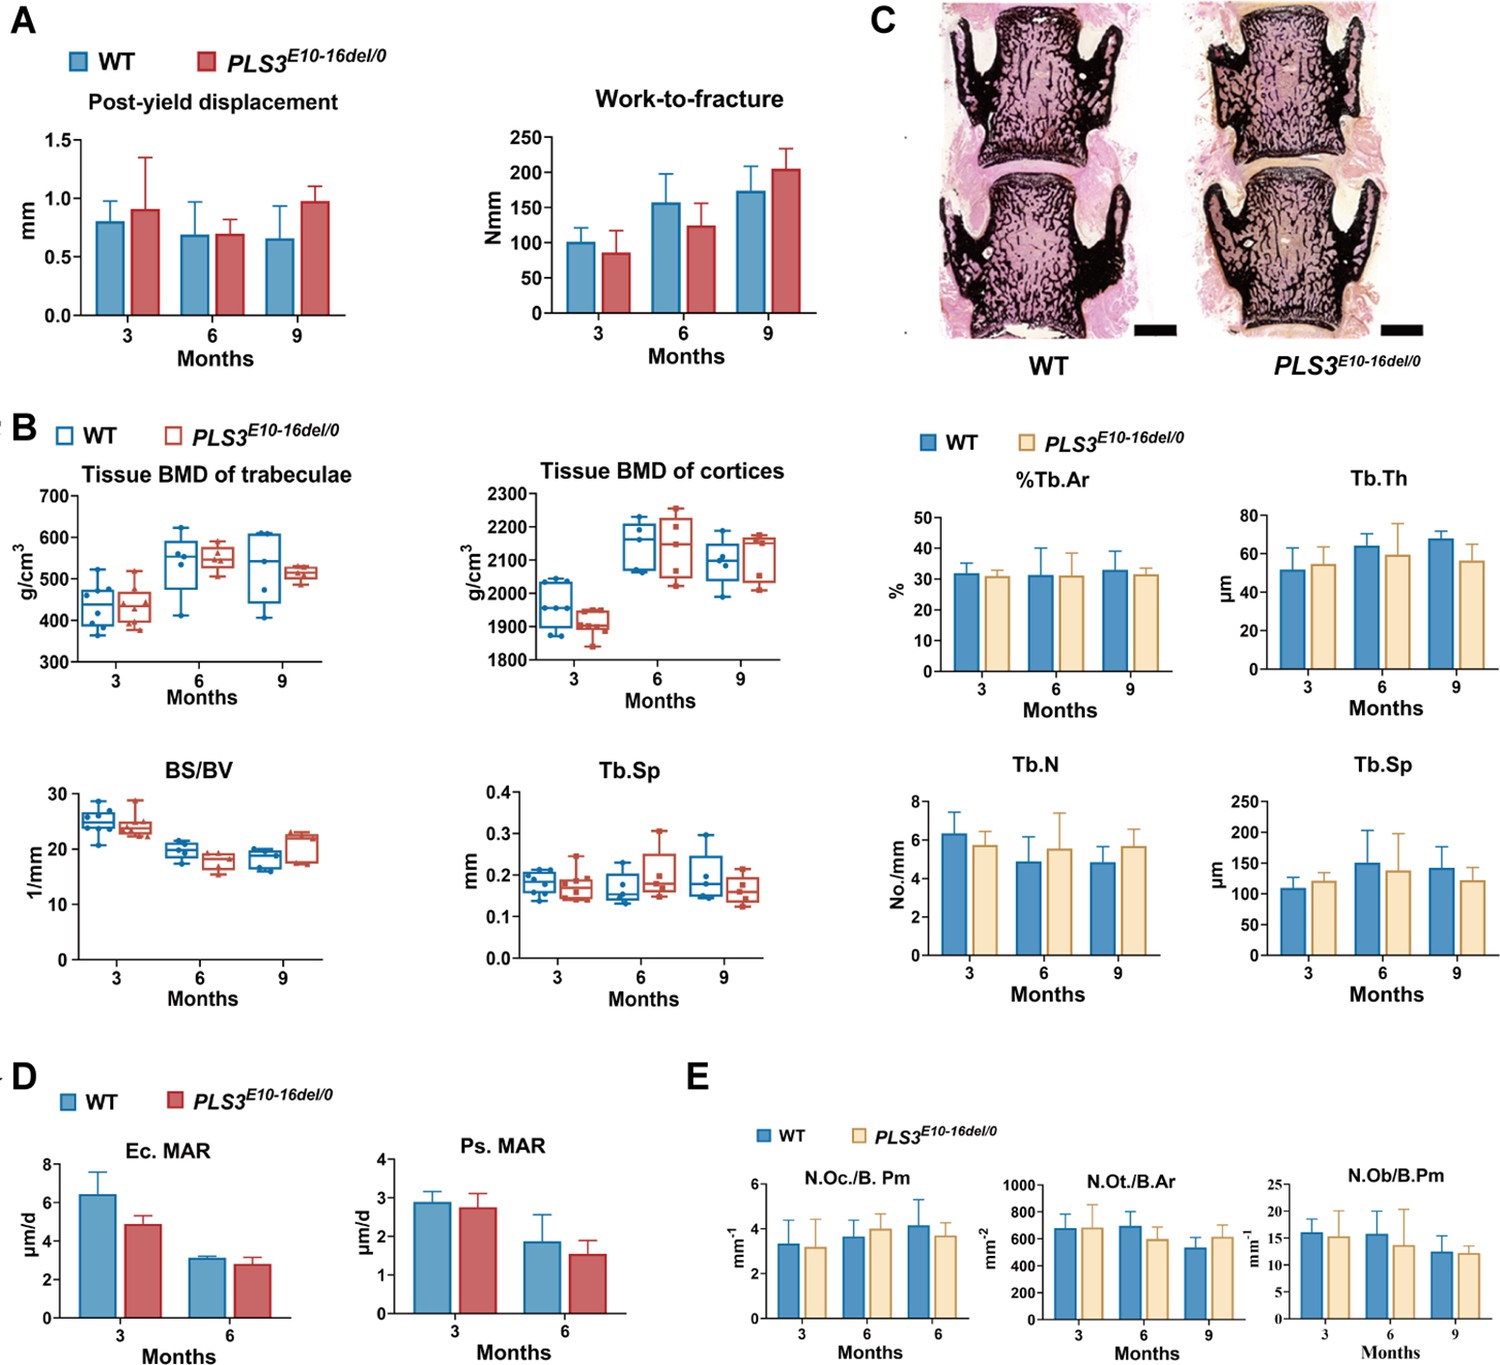
Bone strength and bone morphometry parameters of PLS3E10-16del/0 rats.
(A) Mechanical three-point bending tests of femora from PLS3E10-16del/0 and WT rats (n=5-8 per group). WT: wild-type. (B) Micro-CT assessment of the distal femur from PLS3E10-16del/0 and WT rats. BS/BV: bone surface/bone volume, Tb.Sp: trabecular separation. (C) Histomorphometric evaluation of L4 from PLS3E10-16del/0 and WT rats (n=5-7 per group). %Tb.Ar: trabecular area, Tb.Th: trabecular thickness, Tb.N: trabecular number, Tb.Sp: trabecular separation. Scale bar = 2000 μm. (D) Analysis of mineral apposition rate (MAR) in tibial cortices of PLS3E10-16del/0 rats (n=4-5 per group). Ec.MAR: mineral apposition rate of endocortical surface of tibia cortex. Ps.MAR: mineral apposition rate of periosteal surface of tibia cortex. (E) Measurements of osteoclasts, osteocytes, and osteoblasts of PLS3E10-16del/0 rats (n=5-8 per group). N.Oc./B.Pm: osteoclast number per bone perimeter, N.Ot./B.Ar: osteocyte number per bone area; N.Ob/B.Pm: osteoblast number/bone perimeter.
Figure 2—figure supplement 2
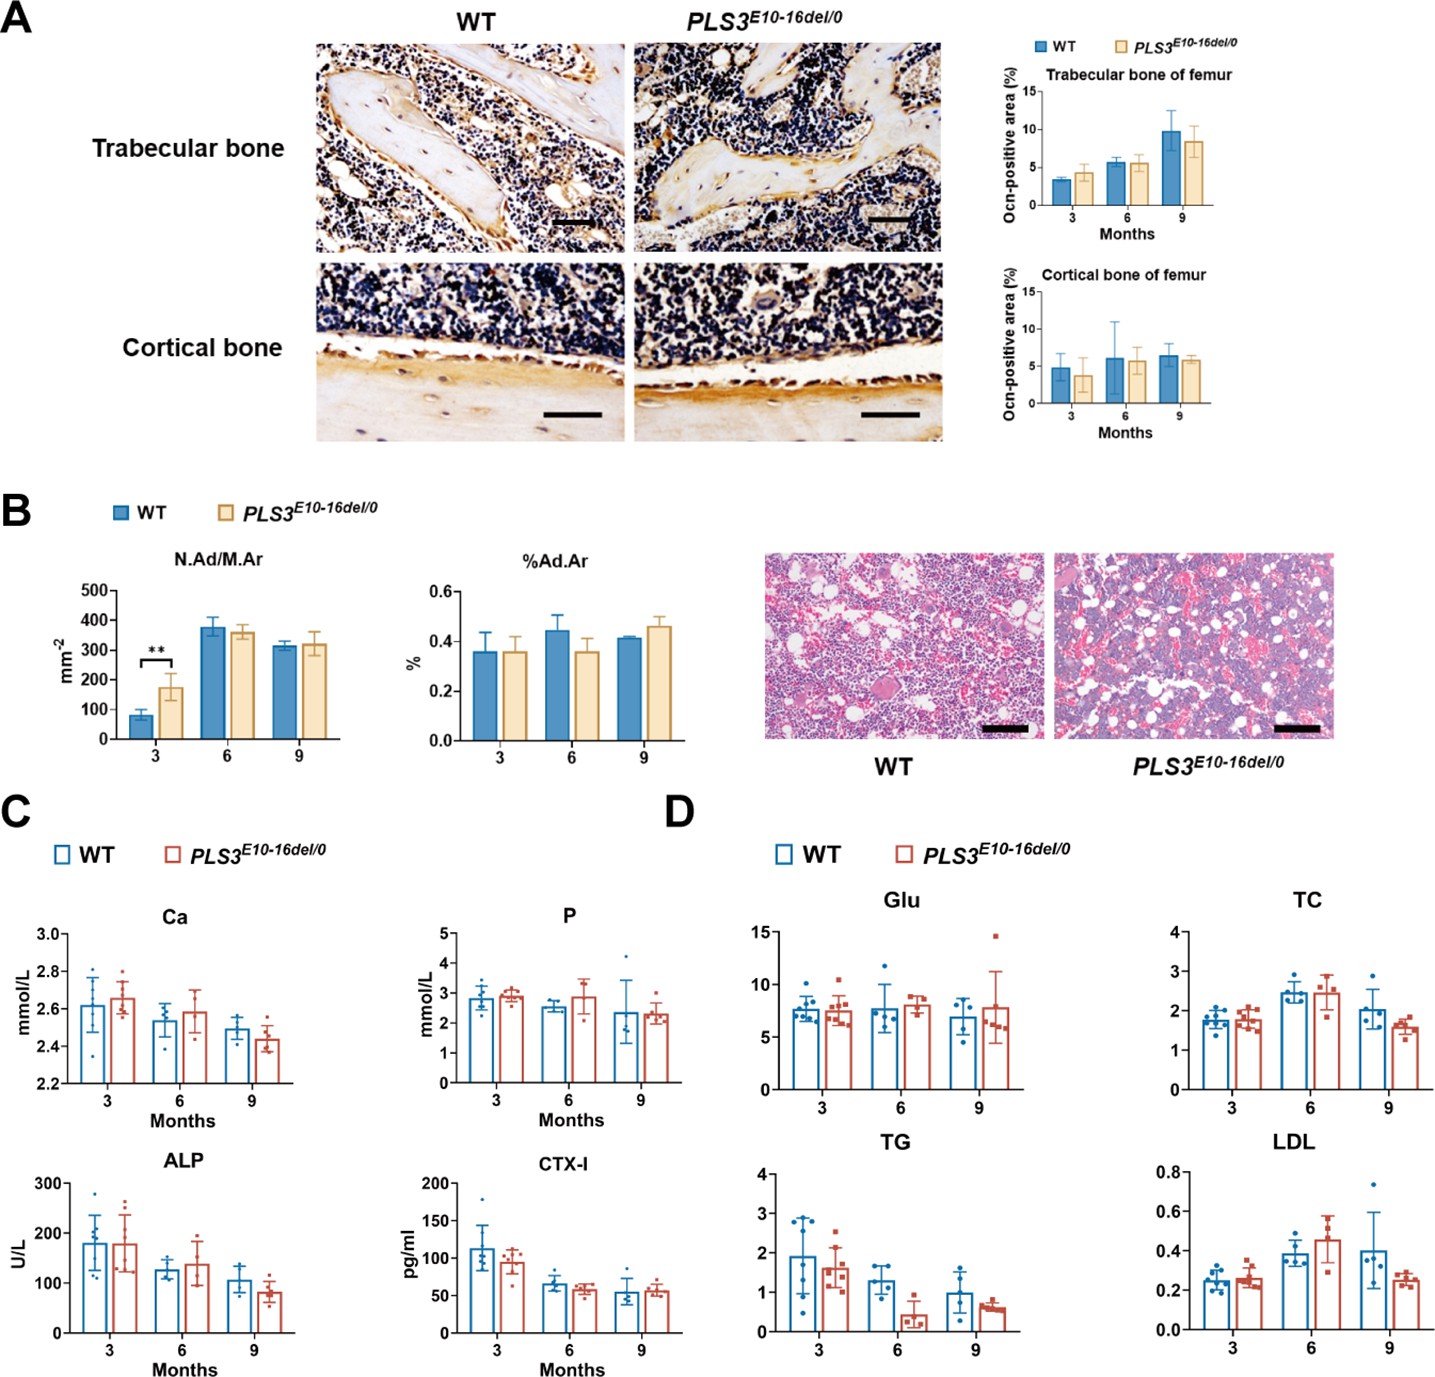
Histological, immunohistochemical, and serum biochemical analysis of PLS3E10-16del/0 rats.
(A) Representative images of osteocalcin (Ocn) immunohistochemistry in the femur bone sections and its quantification data (n=3-5 per group). Scale bar: 100 μm. (B) Measurements of adipocytes of PLS3E10-16del/0 rats (n=3-5 per group). N.Ad/Mr: number of adipocytes in the distal marrow per tissue area. %Ad.Ar: area of adipocytes in the distal marrow per tissue area. Scale bar: 100 μm.Data were analyzed using unpaired two-tailed Student t test. **p<0.01 vs WT groups. (C) Serum levels of bone metabolic markers in Pls3E10-16del/0 and wild-type (WT) rats (n=5-8 per group). Ca: calcium, P: phosphorus, β-CTX: β-C-telopeptide of type Ⅰ collagen, bone resorption marker, ALP: alkaline phosphatase. ELISAs were used to determine the levels of CTX-I. An automated chemistry analyzer was used to measure the levels of the Ca, P, and ALP. (D) Parameters of glucose and lipid metabolism in PLS3E10-16del/0 rats (n=5-8 per group). Glu: glucose, TC: total cholesterol, LDL: low-density lipoprotein, TG: total glycerides. All parameters were measured by an automated chemistry analyzer.
Figure 3
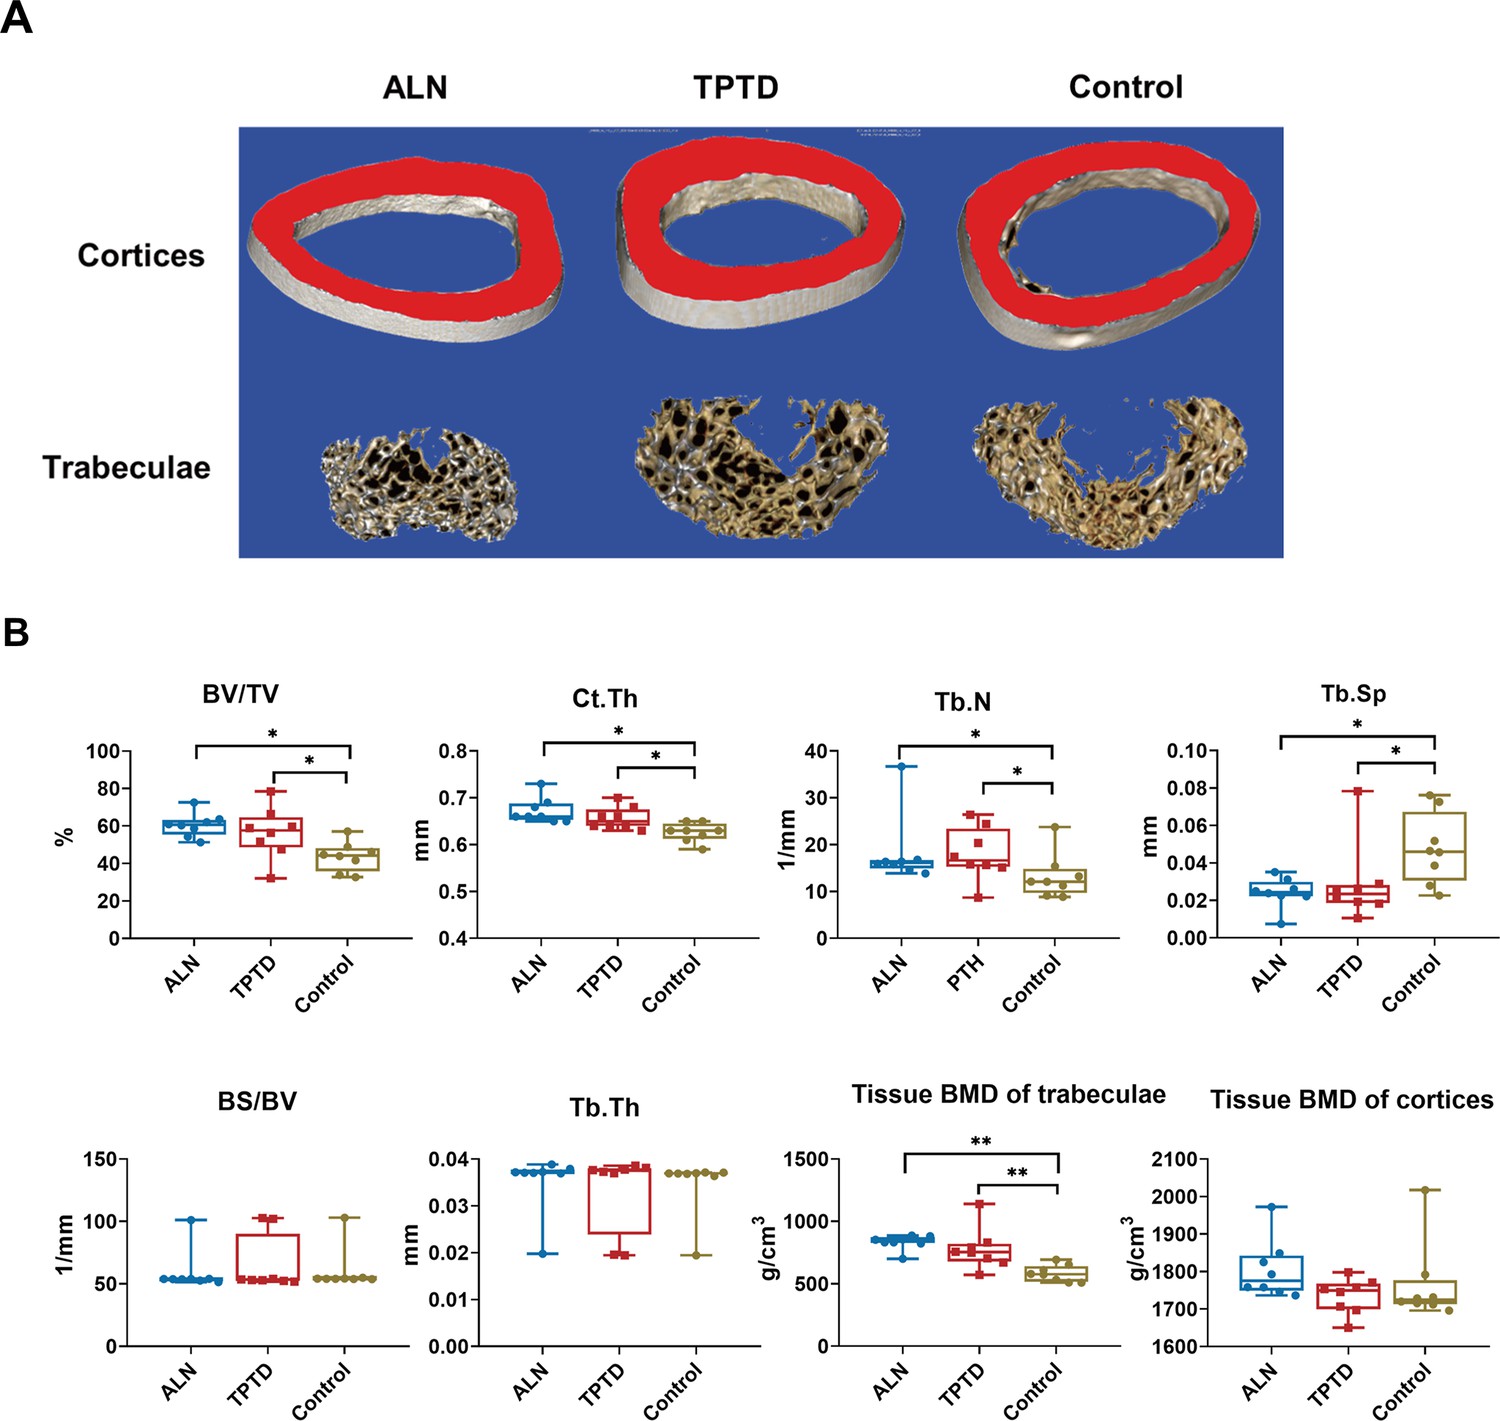
The efficacy of anti-osteoporotic treatment in PLS3E10-16del/0 rats.
(A) Three-dimensional reconstruction images of femurs after treatment. (B) Microstructural parameters of femurs by micro-CT after treatment (n=8 per group). ALN: alendronate, TPTD: teriparatide, BV/TV: bone volume/tissue volume, BS/BV: bone surface area/bone volume, Tb.Th: trabecular thickness, Tb.N: trabecular number, Tb.Sp: trabecular separation, Ct.Th: cortical thickness, BMD: tissue bone mineral density. Data were shown as the mean ± SD, evaluated by one-way ANOVA followed by Tukey’s post hoc test. *p<0.05; **p<0.01; ***p<0.001.
-
Figure 3—source data 1
Microstructural parameters of femurs measured by micro-CT after treatment.
- https://cdn.elifesciences.org/articles/80365/elife-80365-fig3-data1-v2.xlsx
Figure 4 with 1 supplement
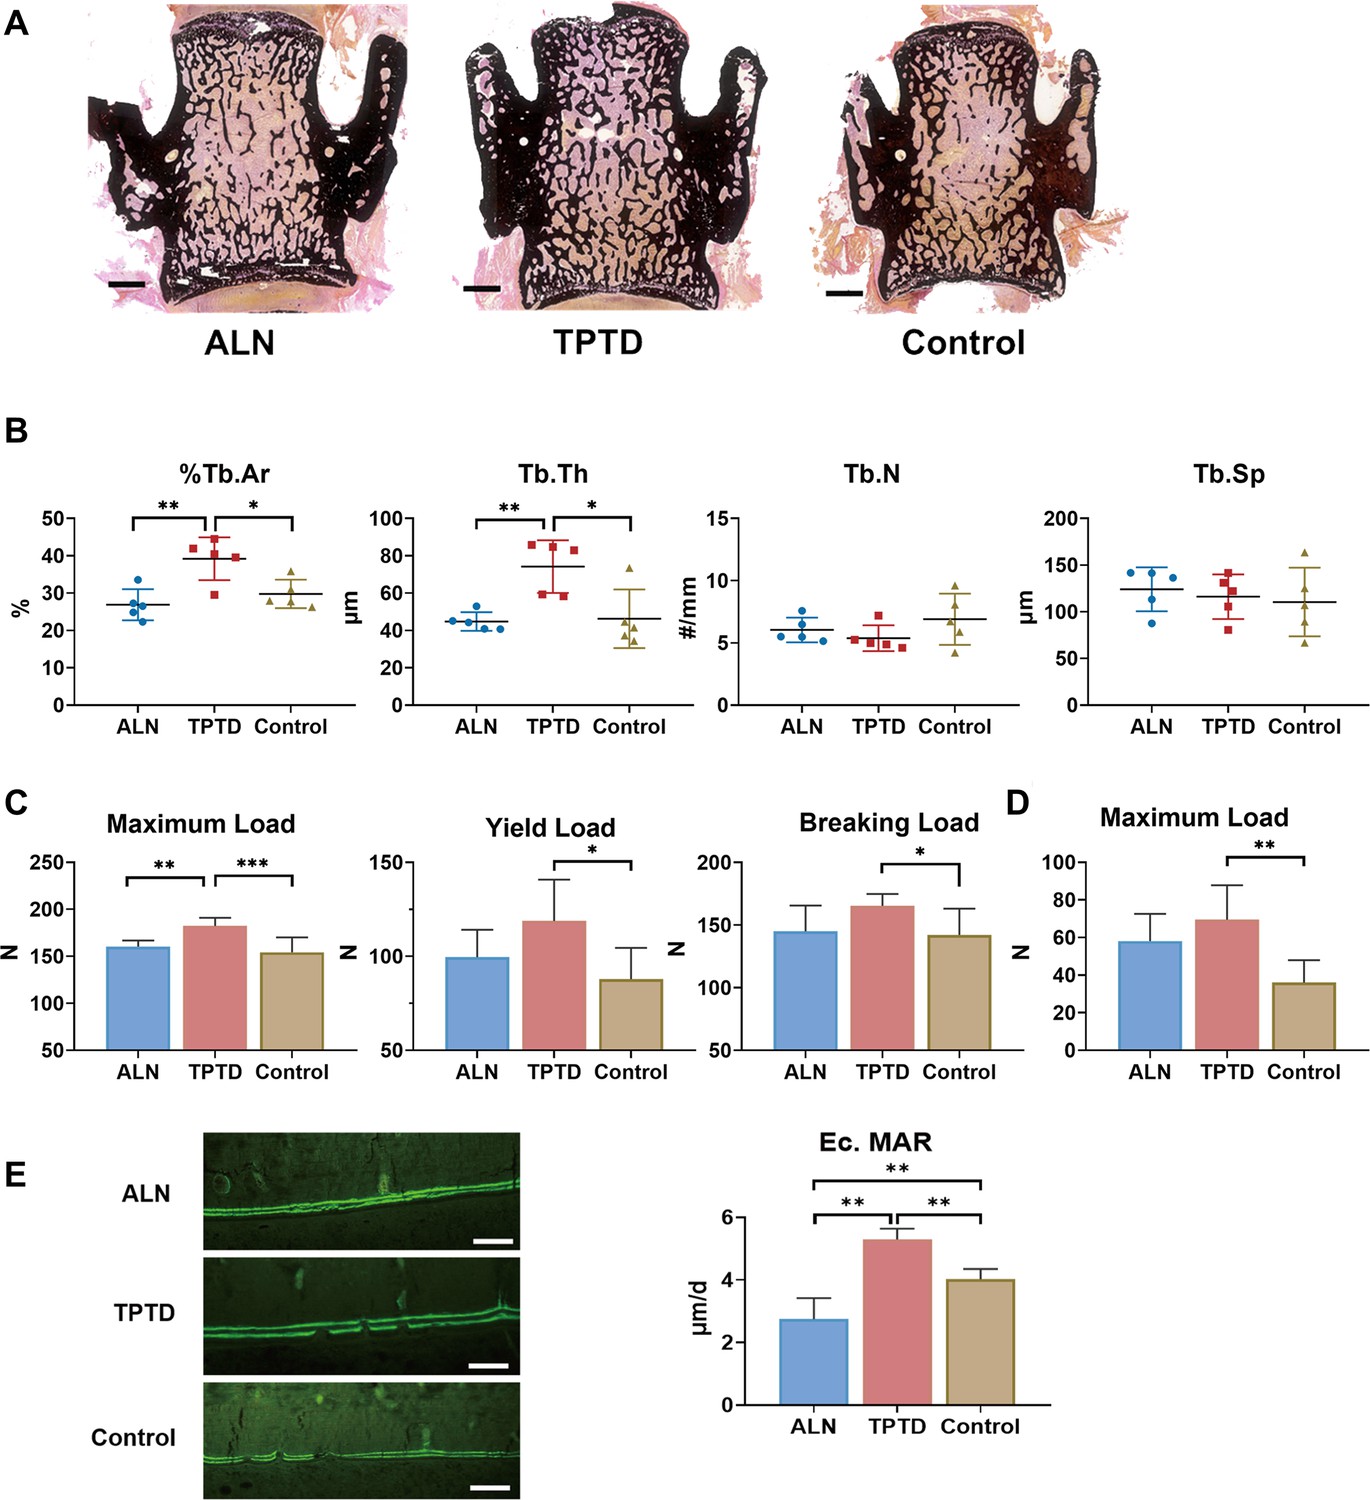
Changes in microarchitecture and strength after anti-osteoporotic treatment.
(A) Typical images of unstained and uncalcified vertebra of PLS3E10-16del/0 rats after treatment. Scale bar = 1000 μm. (B) Histomorphometric analysis of L4 after treatment (n=5 per group). %Tb.Ar: trabecular area, Tb.Th: trabecular thickness, Tb.N: trabecular number, Tb.Sp: trabecular separation. (C) Effects of treatment on the mechanical strength of femoral diaphysis (n=8 per group). The diaphysis was subjected to three-point bending test to failure, which provided data on yield load, maximum load, breaking load. (D) Effects of treatment on the mechanical strength of L5 (n=7-8 per group). The vertebral body was subjected to indentation test to acquire maximum load. (E) Comparison of Ec.MAR in the tibial cortex among three treatment groups (n=5 per group). Scale bar = 100 μm. ALN: alendronate, TPTD: teriparatide, control: saline. Ec.MAR: mineral apposition rate of endocortical surface of tibia cortex. Data were shown as the mean ± SD, evaluated by one-way ANOVA followed by Tukey’s post hoc test. *p<0.05; **p<0.01; ***p<0.001.
-
Figure 4—source data 1
Changes in strength after anti-osteoporotic treatment.
- https://cdn.elifesciences.org/articles/80365/elife-80365-fig4-data1-v2.xlsx
Figure 4—figure supplement 1
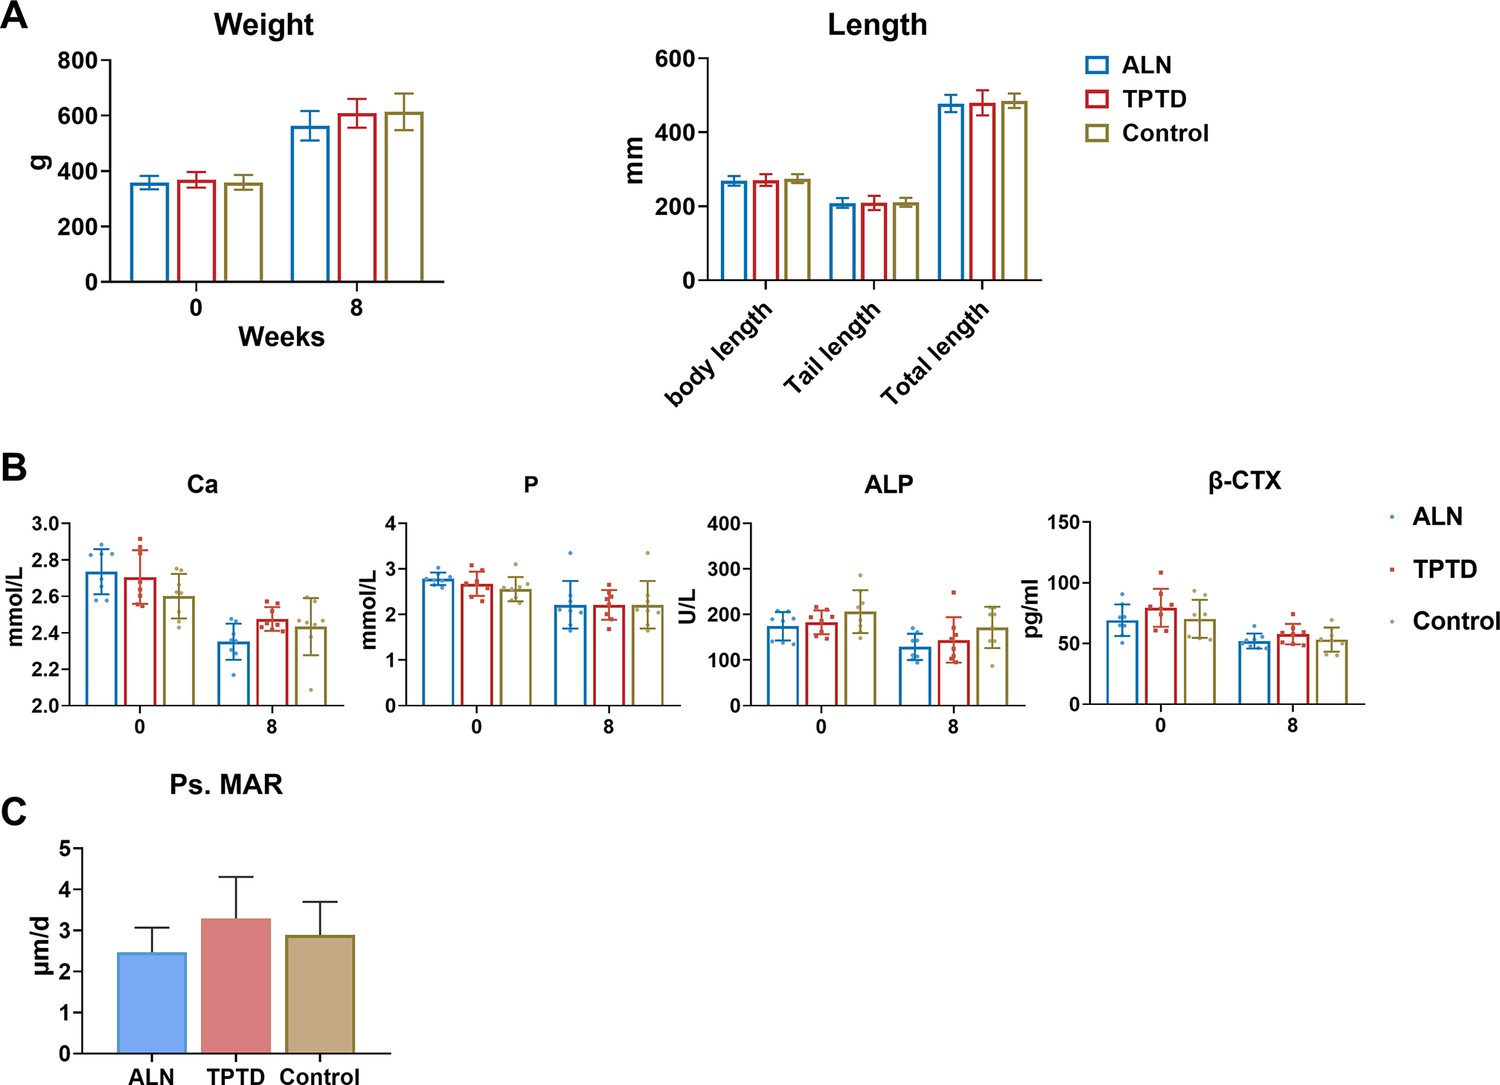
Characteristics of PLS3E10-16del/0 rats before and after treatment.
(A) Body mass and length of rats at the initiation and end of the treatment (n=8 per group). Body mass were comparable among three groups at the initiation and end of the treatment. No differences were found in body length, tail length, and total length of rats at the completion of 2 months of therapy. ALN: alendronate group; TPTD: teriparatide. (B) Serum levels of bone metabolic markers during treatment (n=8 per group). Ca: calcium, P: phosphorus, β-CTX: β-C-telopeptide of type Ⅰ collagen, bone resorption marker, ALP: alkaline phosphatase. Bone metabolic markers were measured at 0 and 8 weeks of treatment. (C) Comparison of Ps.MAR in the tibial cortex among three treatment groups (n>3 per group). Ps.MAR: mineral apposition rate of periosteal surface of tibia cortex.
Tables
Table 1
Small guide RNA (gRNA) sequence for PLS3 gene knockout.
| No. | Targeting site | Name | Sequence (5’–3’) |
|---|---|---|---|
| 1 | ATGTATTCTGGCGCCATCT | PLS3-gRNA-UP1 | TAGGatgtattctggcgccatct |
| PLS3-gRNA-DOWN1 | aaacAGATGGCGCCAGAATACAT | ||
| 2 | TACATACATACATAGATGA | PLS3-gRNA-UP2 | TAGGtacatacatacatagatga |
| PLS3-gRNA-DOWN2 | aaacTCATCTATGTATGTATGTA | ||
| 3 | TCTCAGGTGAAGTGCACA | PLS3-gRNA-UP3 | TAGGtctcaggtgaagtgcaca |
| PLS3-gRNA-down3 | aaacTGTGCACTTCACCTGAGA | ||
| PLS3-gRNA-UP4 | TAGGATCCAGGTCTACAGGAAAG | ||
| PLS3-gRNA-down4 | aaacctttcctgtagacctggat | ||
| 4 | CTTTCCTGTAGACCTGGAT | PLS3-gRNA-UP5 | TAGGATCCAGGTCTACAGGAAAG |
| PLS3-gRNA-down5 | AAACCTTTCCTGTAGACCTGGAT |
-
The gRNAs were designed based on Rattus norvegicus (Norway rat) genome assembly Rnor_6.0 (rn6), using CRISPR Design Tool (http://tools.genome-engineering.org).
-
Gene ID: 81748; Location: Chromosome X - NC_005120.4.
-
The words in red represented the protospacer adjacent motif (PAM) sequences (5’–3’).
Table 2
Primers used for Sanger sequencing, genotyping, and qPCR.
| Primer name | Sequence (5’–3’) | GenBank accession number | Nucleotide position |
|---|---|---|---|
| P-WT-F | CCCATAAGTTGTTCCTTGATTTCC | NC_051356.1 | 88350–88373 |
| P-WT-R | CACTGCCTGAATAAGACCCACTC | NC_051356.1 | 88777–88799 |
| P-WT-F’ | CCTTGTGGAAGTAAAACCGAA | NC_051356.1 | 93529–93549 |
| P-WT-R’ | TACAAAGGCCAAGTTCAG | NC_051356.1 | 84492–84510 |
| P-KO-F | CTTCATTCCCTTTGCACGTT | NC_051356.1 | 84092–84111 |
| P-KO-R | TACAAAGGCCAAGTTCAG | NC_051356.1 | 94242–94262 |
| PLS3-KO-F | AAATTCTCCTTGGTTGGCATT | NM_031084.1 | 1507–1527 |
| PLS3-KO-R | TCCAGCTTCACTCAATGTTCC | NM_031084.1 | 1672–1692 |
| PLS3-F | GAAAATGATCCCGATTGCAG | NM_031084.1 | 496–515 |
| PLS3-R | CTCTCATCAATTGTATCGGGAA | NM_031084.1 | 605–626 |
| COL1A1-F | TCCTGACGCATGGCCAAGAA | NM_053304.1 | 164–183 |
| COL1A1-R | CATAGCACGCCATCGCACAC | NM_053304.1 | 289–308 |
| GAPDH-F | TTCAACGGCACAGTCAAGG | NM_017008.4 | 235–253 |
| GAPDH-R | CTCAGCACCAGCATCACC | NM_017008.4 | 331–348 |
-
Primers PLS3-KO-F/PLS3-KO-R were selected to amplify a fragment spanning from exon 13 to exon 14 of the rat PLS3 cDNA. The qPCR results were used to indicate the expression level of PLS3 E10-16 (knockout region). Primers PLS3-F/PLS3-R were selected to amplify a fragment spanning from exon 5 to exon 6 of the rat PLS3 cDNA. The qPCR results were used to indicate the expression level of PLS3 E1-9 (uneditable region).
-
F: forward, R: reverse, WT: wild-type, KO: knockout.
Additional files
Download links
A two-part list of links to download the article, or parts of the article, in various formats.
Downloads (link to download the article as PDF)
Open citations (links to open the citations from this article in various online reference manager services)
Cite this article (links to download the citations from this article in formats compatible with various reference manager tools)
Impaired bone strength and bone microstructure in a novel early-onset osteoporotic rat model with a clinically relevant PLS3 mutation
eLife 12:e80365.
https://doi.org/10.7554/eLife.80365


