AGS3 antagonizes LGN to balance oriented cell divisions and cell fate choices in mammalian epidermis
- Department of Pathology and Laboratory Medicine and Biology, University of North Carolina at Chapel Hill, United States
- Curriculum in Cell Biology & Physiology, Lineberger Comprehensive Cancer Center, University of North Carolina at Chapel Hill, United States
- Bioinformatics and Analytics Research Collaborative, University of North Carolina at Chapel Hill, United States
- Lineberger Comprehensive Cancer Center, The University of North Carolina at Chapel Hill, United States
Figures
Figure 1
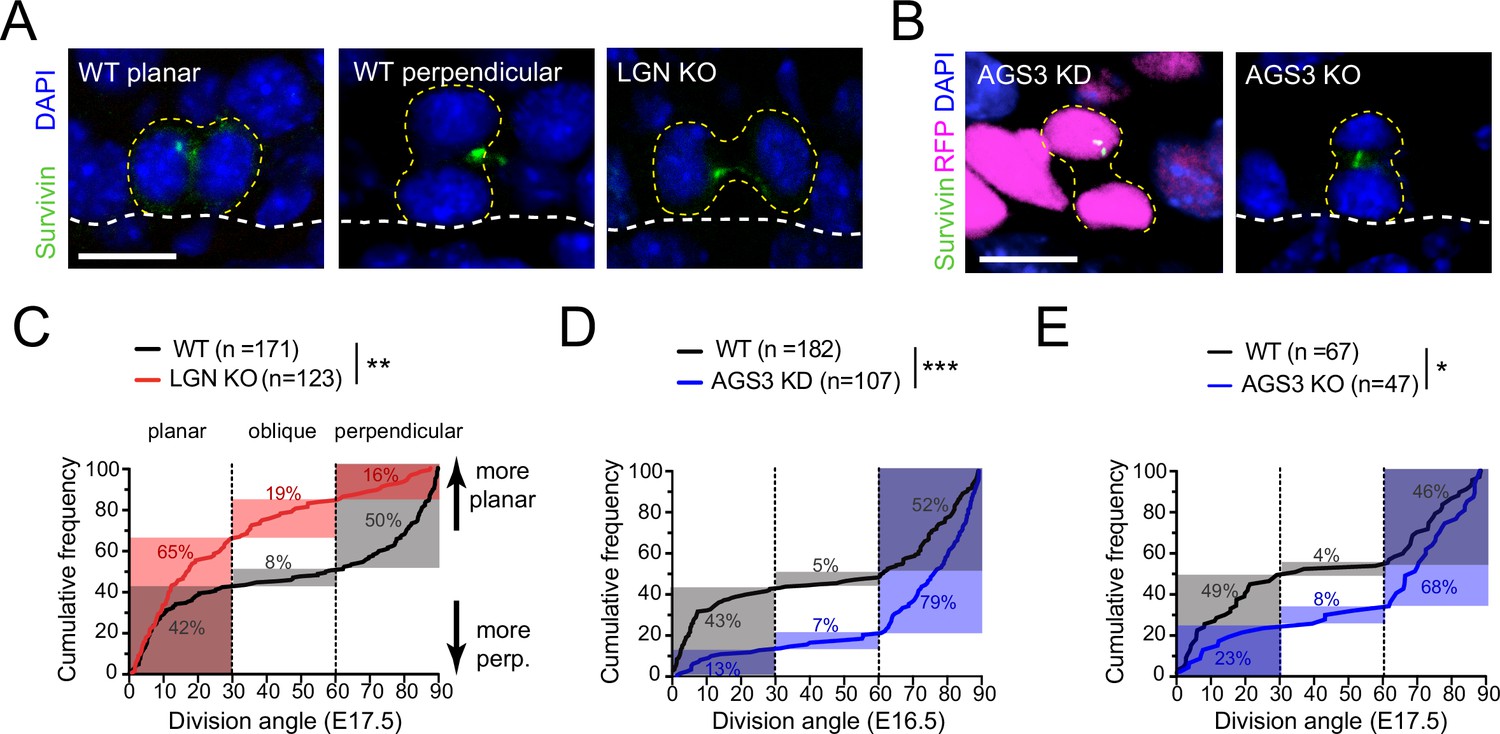
LGN/Gpsm2 and AGS3/Gpsm1 have opposing effects on division orientation.
(A) Images from embryonic day (E) 17.5 sagittal sections stained for Survivin (green), a late-stage mitotic marker that localizes to the spindle midbody during telophase, showing wild-type (WT) planar and perpendicular divisions, and LGN KO (Gpsm2−/−) planar division. (B) Images as in (A) from AGS3 KD (Gpsm11147 shRNA) and AGS3 KO (Gpsm1−/−). (C) Cumulative frequency distribution of terminal division angles from fixed E17.5 sections of WT littermate controls and LGN KO embryos. Planar (0–30°), oblique (30–60°), and perpendicular (60–90°) bins are shown by dashed lines. Shaded areas indicate the proportion of divisions occurring within each bin for WT (black) and Gpsm2−/− KO (red) cells. The upward shift in the LGN KO curve reflects increased planar divisions. (D) Cumulative frequency distributions as in (C) for E16.5 Gpsm11147 knockdown (blue) and uninjected control littermates (black). (E) Cumulative frequency distributions for E17.5 AGS3 KO (blue) and WT littermates (black). Scale bars: 10 µm. *p < 0.05, **p < 0.01, and ***p < 0.001 by Kolmogorov–Smirnov test. n values (parentheses) indicate cells from >4 embryos per genotype.
Figure 2 with 1 supplement

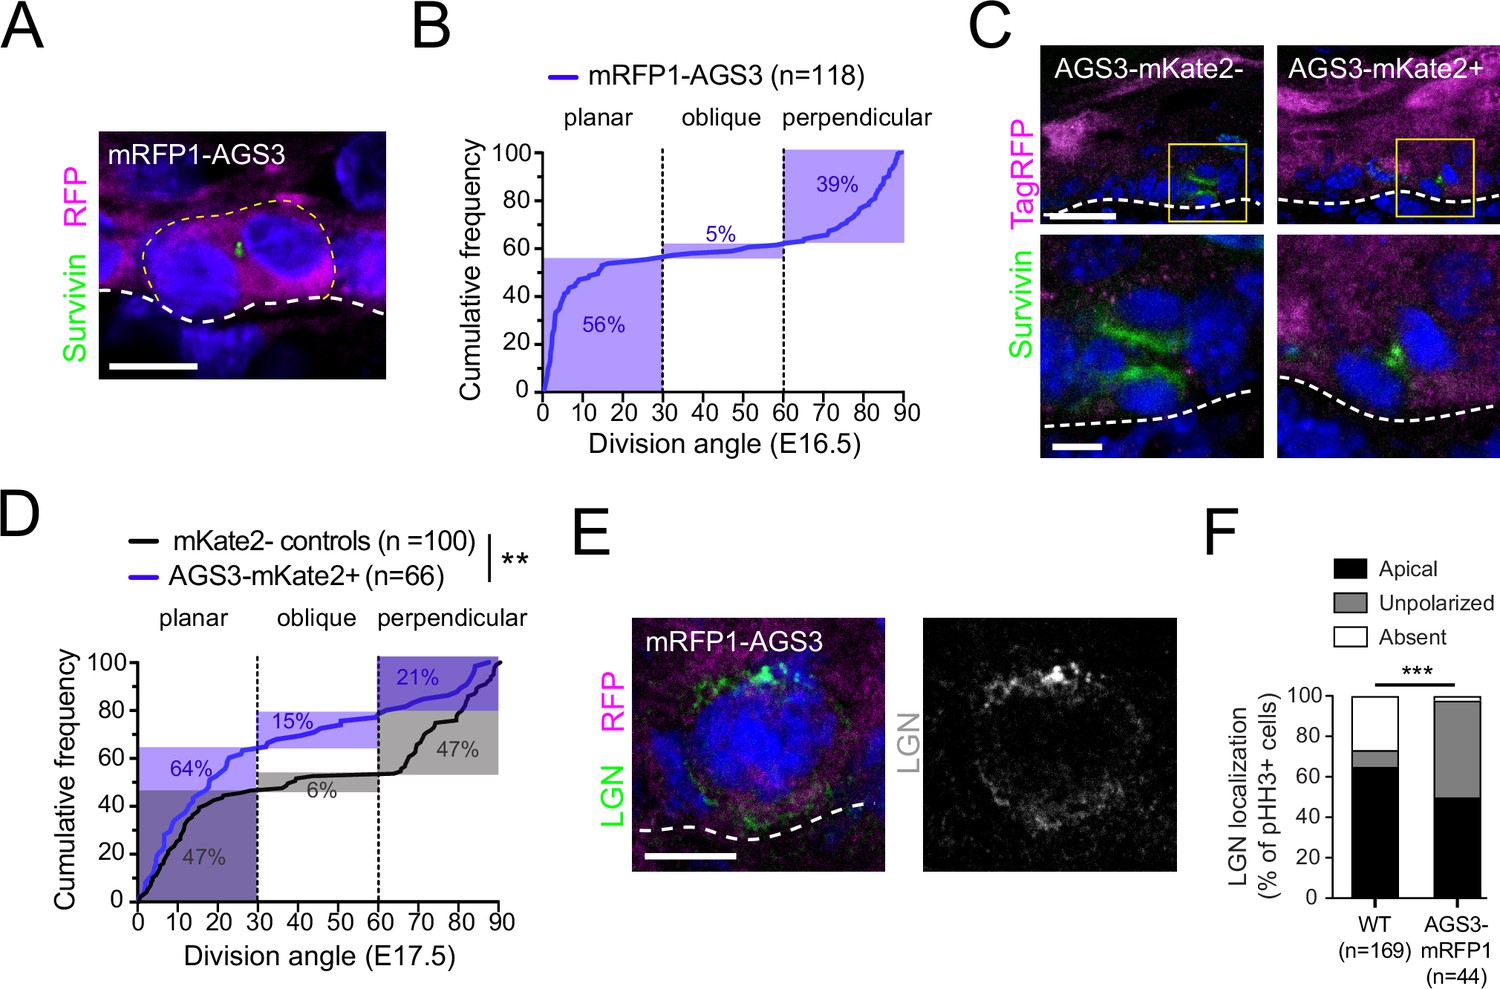
AGS3 localizes to the cytoplasm during mitosis.
(A) Immunofluorescent images from E17.5 sagittal sections of wild-type littermate controls (left) and LGN KO (Gpsm2−/−) embryos (right) showing mitotic basal cells stained for guinea pig (GP) anti-LGN (green) and rabbit (Rb) anti-LGN/AGS3 (magenta). Merged images shown at top and single channels below. Cortical signal is lost in LGN KOs while LGN/AGS3 shows cytoplasmic localization in LGN KO cells. (B) E16.5 epidermal basal cell transduced with mRFP1-AGS3 (magenta) and stained for LGN (green). RFP signal shows AGS3 cytoplasmic localization. (C) Fluorescence intensity quantification of whole-cell RFP signal in mRFP1-AGS3 transduced basal cells. Overexpression of mRFP1-AGS3 primarily localizes cytoplasmically. (D) E16.5 epidermal basal cell transduced with AGS3-V5 and stained for V5 (magenta). (E) Image from a movie of a Krt14Cre; Rosa26mT/mG E16.5 epidermis showing membrane GFP (green), transduced with AGS3-mKate2 (magenta). At bottom, cropped images from yellow dashed box area showing unprocessed (raw) image (left), and denoised/bleach corrected image (right). (F) Denoised stills from movie in (E); t = 0 represents metaphase–anaphase transition. Scale bars: 10 µM (A, B, D, F), 50 µm (E). Here and in all subsequent figures: dashed white (basement membrane), and dashed yellow line (rough outline of cell borders).
Figure 2—figure supplement 1

AGS3 is mainly cytoplasmic throughout mitosis.
(A) Images from E16.5 sagittal sections of mRFP-AGS3 transduced mitotic basal cell stained for LGN/AGS3 (gray) and RFP (magenta); single channel images shown below. (B) E17.5 LGN KO (Gpsm2−/−) (left) or AGS3/LGN double KO (Gpsm1−/−; Gpsm2−/−) (right) epidermis showing mitotic basal cells stained for LGN/AGS3 (magenta). Note loss of LGN/AGS3 signal in double mutant. (C) Sagittal sections from E16.5 embryos showing mRFP1-AGS3+ mitotic basal cells at indicated stages. Apical LGN (green) is present in prophase, metaphase, and telophase, but absent in interphase while RFP signal (magenta) is unpolarized at all stages. Scale bars, 10 µm.
Figure 3
AGS3 overexpression promotes planar divisions and disrupts LGN localization.
(A) Image of telophase basal cell from E16.5 epidermis transduced with lentiviral N-terminal tagged mRFP1-AGS3. (B) Cumulative frequency distribution of division angles for mRFP1-AGS3+ basal cells. (C) Images of telophase cells from E16.5 epidermis transduced with C-terminal tagged AGS3-mKate2, showing examples of mKate2− (left) and mKate2+ (right) cells. Survivin (green) was used to detect late-stage mitotic cells while a TagRFP antibody (magenta, Invitrogen R10367) was used to detect mKate2, and to discriminate between positive and negative cells. Boxed insets are shown at higher magnification in lower images. (D) Cumulative frequency distribution plots of division angles for mKate2+ (blue) and mKate2− (black) cells from mosaically transduced epidermis. Note that mKate2+ cells express AGS3-mKate2 as well as the Gpsm11147 shRNA to knock down endogenous AGS3, so that exogenous AGS3-mKate2 should be the majority species. (E) Example of ‘unpolarized’ LGN expression in a mitotic basal cell-overexpressing mRFP1-AGS3. (F) Quantification of LGN expression patterns observed in wild-type (WT) and mRFP1-AGS3+ mitotic cells. Scale bars: 5 µm in A, C (bottom), E; 20 µm in C (top). **p < 0.01 by Kolmogorov–Smirnov test (D); ***p < 0.001 by chi-square test (F).
Figure 4 with 1 supplement
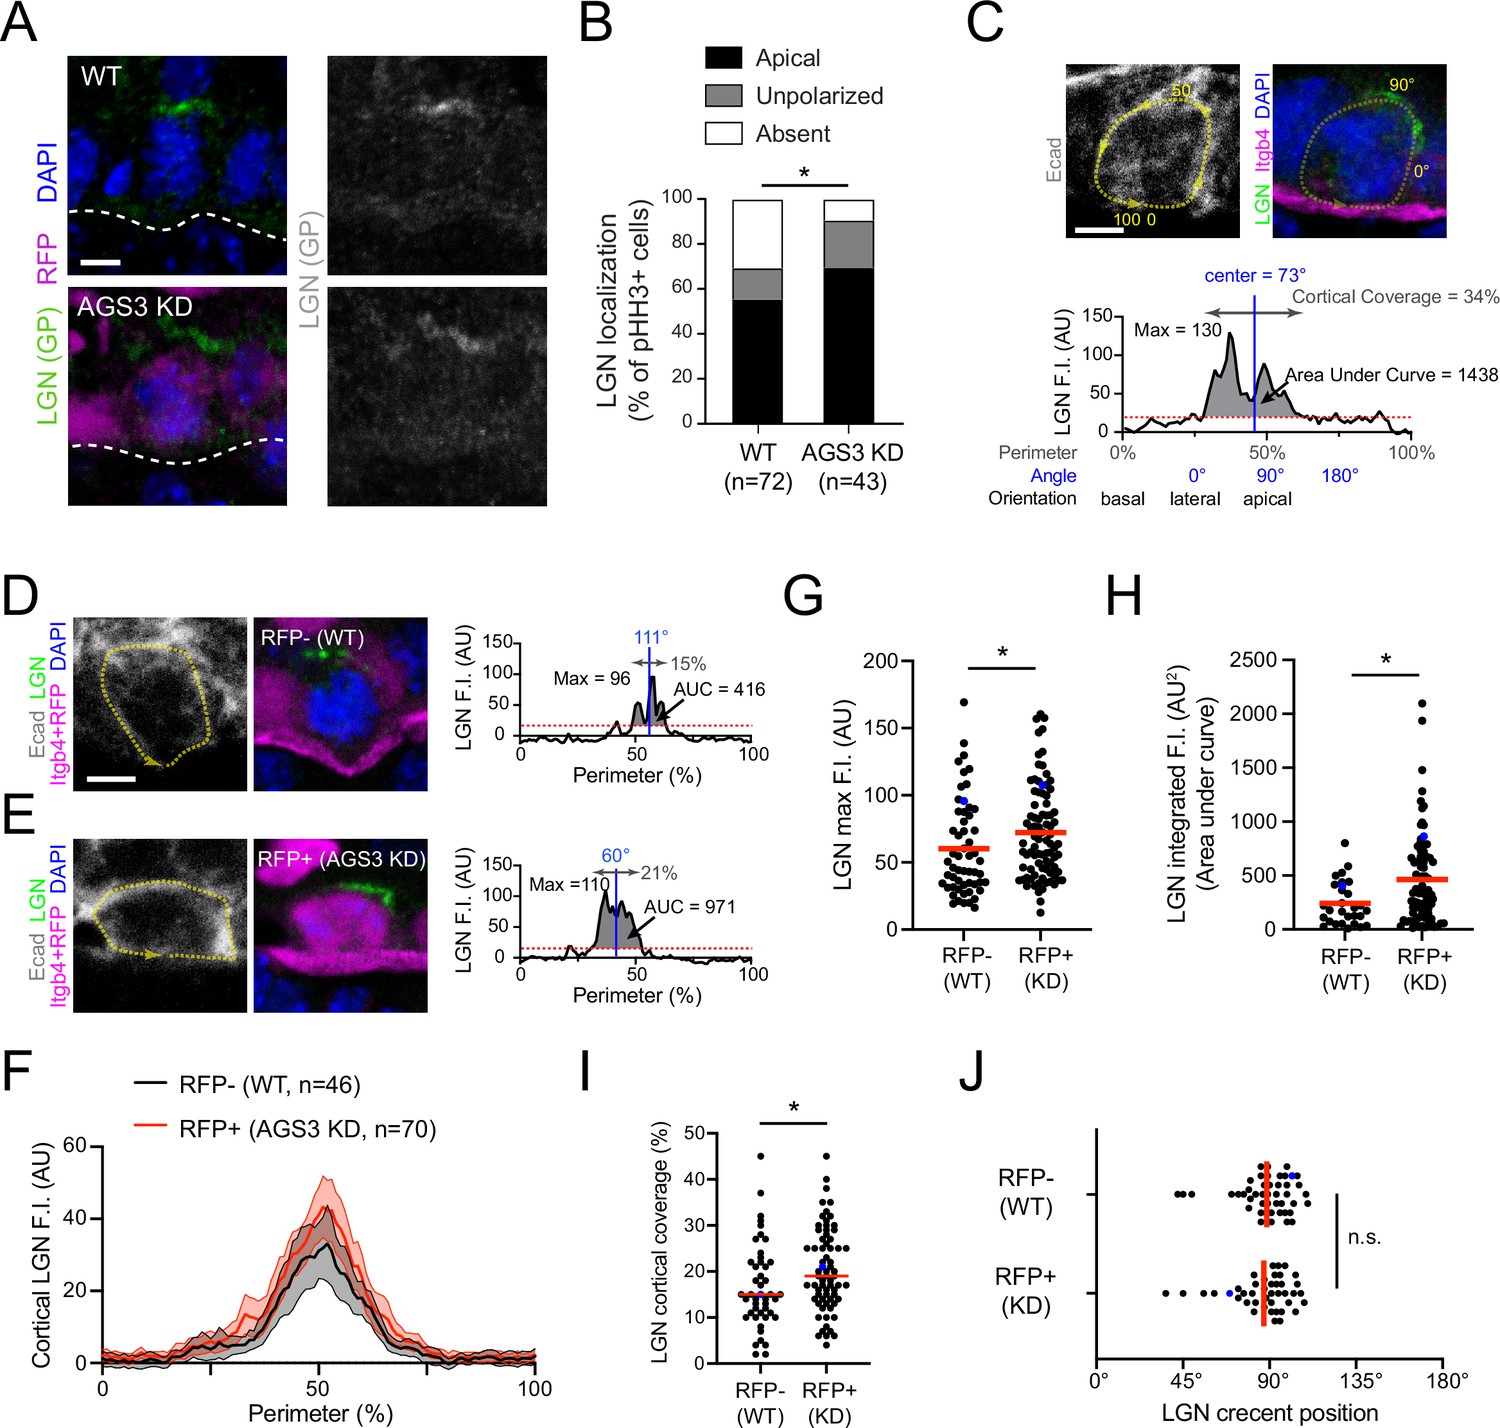
AGS3 loss enhances cortical localization of LGN.
(A) Images of LGN (green) and H2B-RFP (magenta) antibody staining from E16.5 sagittal sections of wild-type (WT; top) and AGS3 KD (bottom) prophase basal cells. (B) Quantification of LGN localization patterns in WT (RFP−) and AGS3 KD (RFP+) pHH3+ mitotic basal cells. (C–J) Quantification of LGN cortical fluorescent intensity (F.I.) in RFP− controls and RFP+ AGS3 KD mitotic cells. A visual depiction of the methodology used for an example cell is shown in (C), with representative RFP− and RFP+ cells shown in (D, E). E-cadherin staining is used to define the cell perimeter (0–100% starting from basal; yellow dashed line), with linescans along this mask used to measure LGN F.I., as shown in the graphs in (C–E). Red dashed lines indicate the threshold (20 AU) used to discriminate signal from noise. (F) Aggregate graphs depicting the mean F.I. (±95 CI) by position for RFP− (n = 46) and RFP+ (n = 70) cells. (G) LGN maximum F.I., which equals the highest value of the cortical linescan for each cell. (H) Integrated F.I., calculated as the area under this curve (AUC, shaded regions in C–E). (I) Cortical coverage, calculated as the contiguous proportion of the perimeter where the signal exceeds this threshold (gray double arrows in C–E). (J) LGN crescent position, defined as the center of this area of cortical coverage (depicted by blue vertical lines in C–E). Blue dots in (G–J) represent the actual cells shown in (D, E). Scale bars, 5 µm. n.s., not significant; *p < 0.05 by chi-square (B) or Mann–Whitney test (G–J).
Figure 4—figure supplement 1
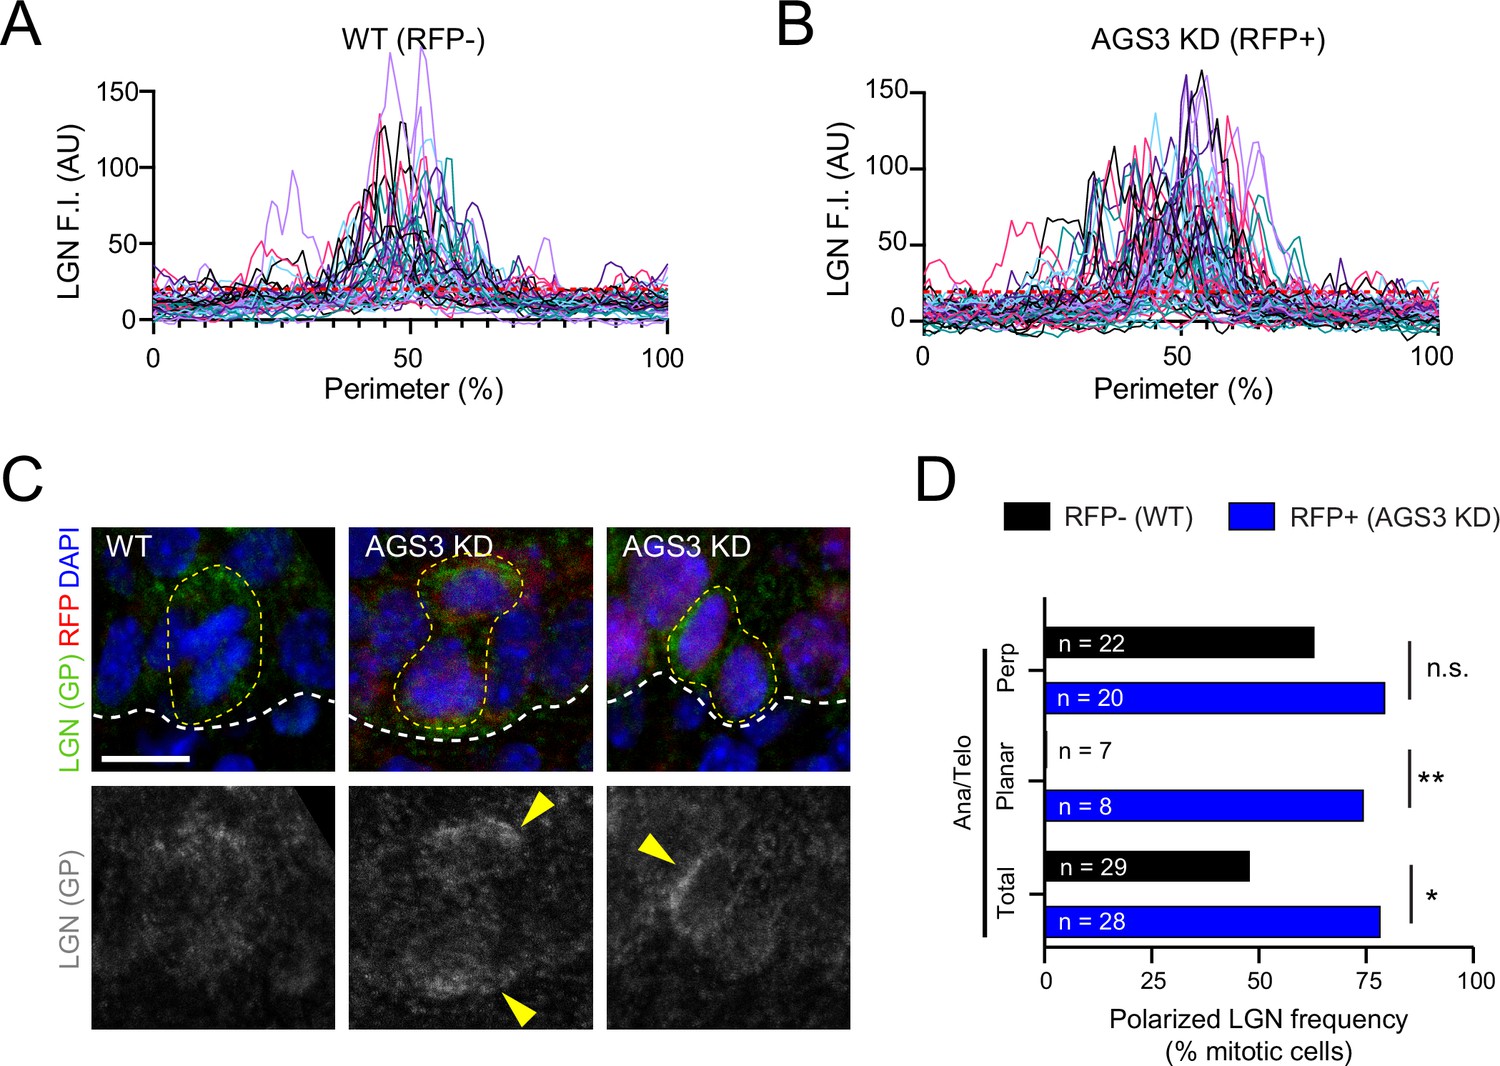
LGN localization is altered upon AGS3 loss.
(A, B) Individual intensity plots of LGN fluorescent intensity (F.I.) at the perimeter of wild-type (WT) RFP− (A) and AGS3 KD RFP+ (B) mitotic cells. Cell perimeter is as defined in Figure 4C, and aggregated data are shown in Figure 4F. (C) LGN expression (green in merged images and gray below) in telophase E16.5 epidermal basal cells. Yellow arrows indicate atypical LGN expression patterns observed upon AGS KD using the Gpsm11147 shRNA. (D) Quantification of frequency that LGN is polarized at indicated mitotic stages for AGS3 KD (blue) and WT controls (black). Ana/telophase cells are split into groups based on division orientation. Scale bars, 10 µm; n values indicate cells from >3 embryos/genotype (D); n.s., not significant, *p < 0.05, **p < 0.01 by Fisher’s exact test (D).
Figure 5 with 1 supplement
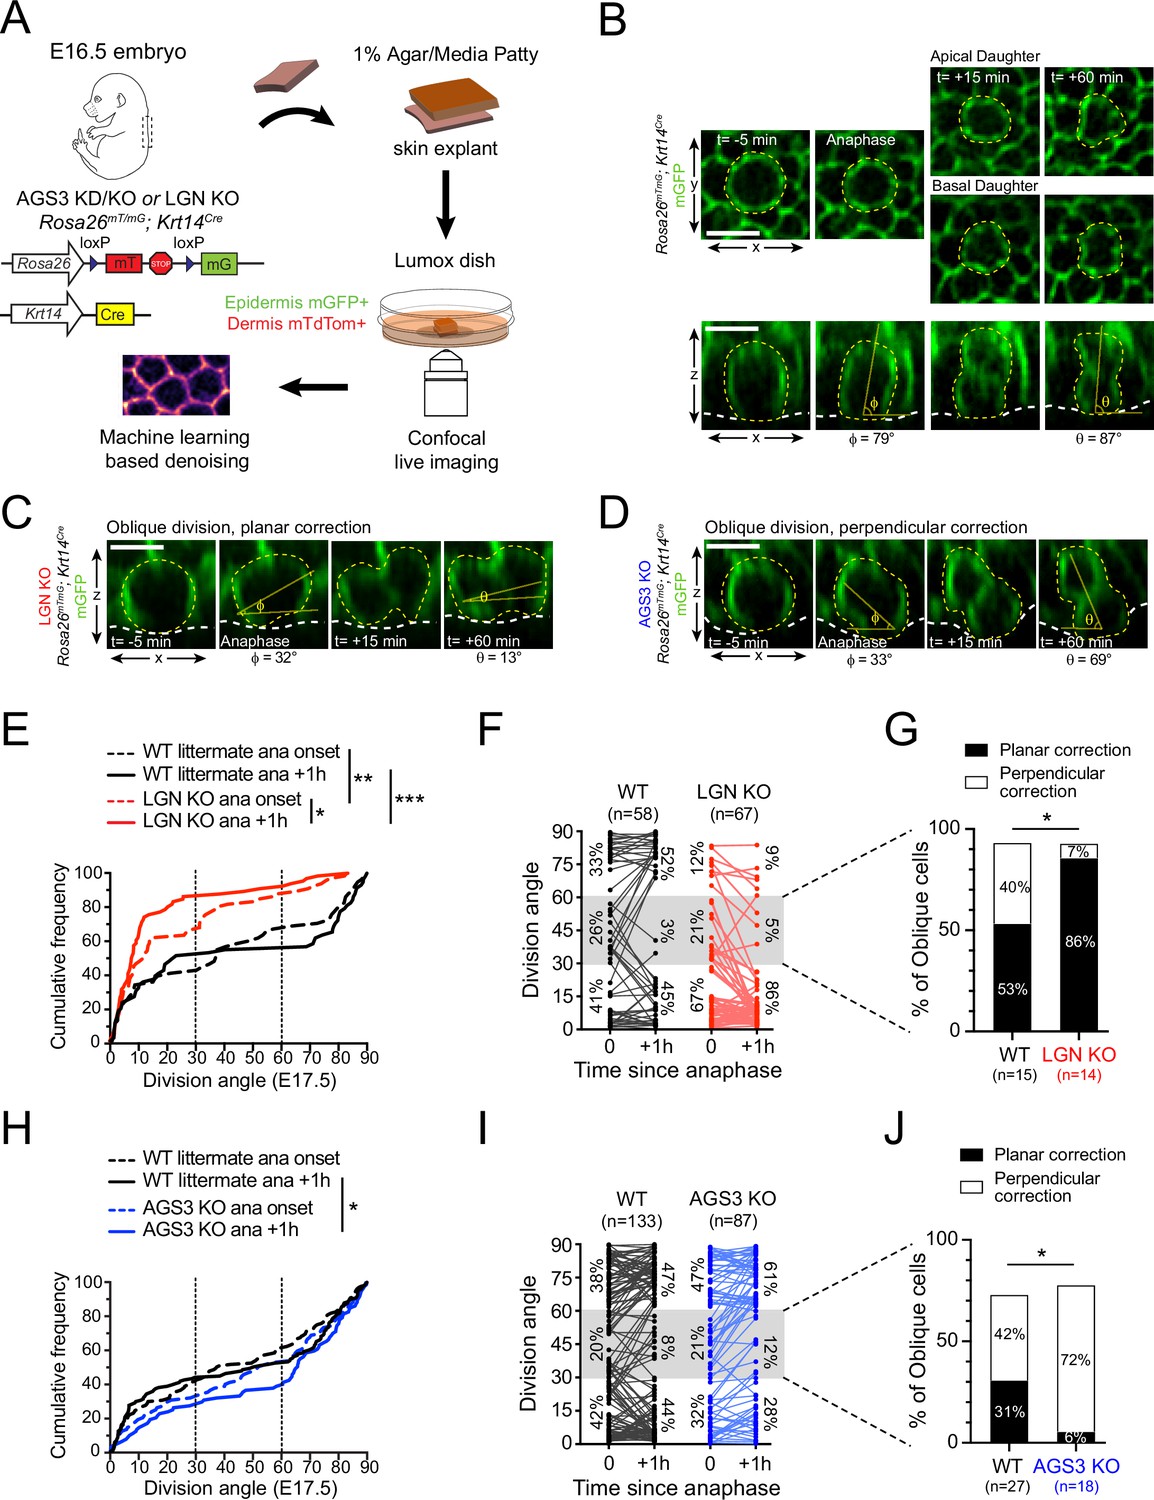
AGS3/Gpsm1 loss biases telophase reorientation toward perpendicular.
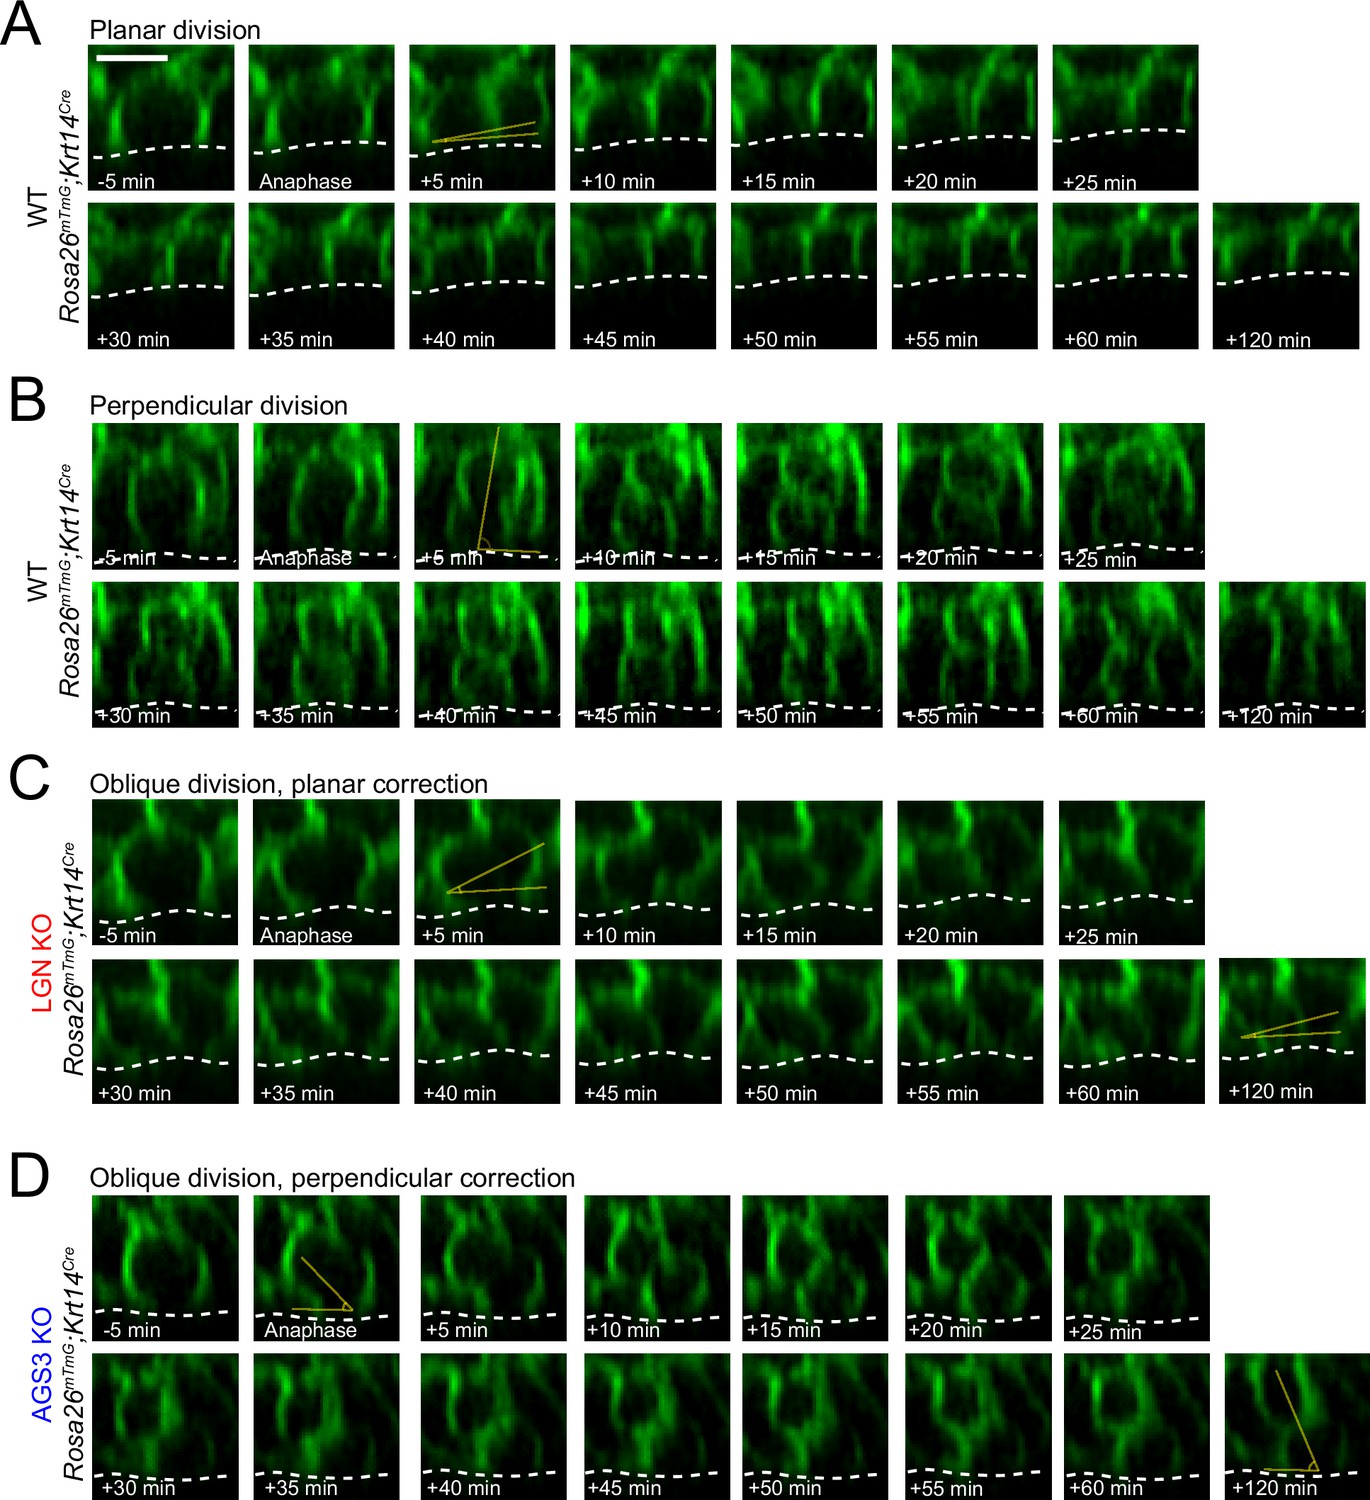
(A) Schematic for ex vivo live imaging of wild-type (WT), AGS3 KO (Gpsm1−/−), and LGN KO (Gpsm2−/−) embryonic epidermal explants on a Krt14Cre; Rosa26mT/mG background, where epithelial cell membranes are GFP+. (B) Native en face (top) and z-projections (bottom) movie stills of a WT mitotic cells as it enters anaphase (t = 0), through 1 hr later, depicting a perpendicular division. Division orientation angles are shown below (φ, anaphase onset; θ, +1 hr). Z-projection movie still from equivalent timepoints showing a LGN KO (C) or AGS3 KO (D) division. See Figure 4—figure supplement 1C, D for additional timepoints. (E) Cumulative frequency distribution of division orientation for E17.5 LGN KO embryos at anaphase onset and +1 hr later. (F) Line graphs of individual cell data from (E) depicting orientation at anaphase onset and 1 hr later for LGN KO cells (red) and WT littermate controls (black). Percentages of cells in each orientation bin are shown to the left (t = 0) and right (t = +1 hr) of the data points. (G) Data from (F) depicting behavior of anaphase (t = 0) obliques (gray zone in (E)), and frequency of planar vs. perpendicular correction; rare cells that remain oblique are not included. (H–I) Similar plots as (E–G) for AGS3 KO cells (blue) and WT littermate controls (black). Scale bars, 10 µm; n values indicate events from three to four embryos imaged in two technical replicates per genotype; *p < 0.05, **p < 0.01, ***p < 0.001 by Kolmogorov–Smirnov test (E, H) or Fisher’s exact test (G, J).
Figure 5—figure supplement 1
Additional movie stills of telophase correction behavior.
(A–D) Individual movie frames collected at 5-min intervals from ex vivo explant live-imaging experiments using Krt14Cre; Rosa26mT/mG, in combination with AGS3 KO (Gpsm1−/−) or LGN KO (Gpsm2−/−) alleles. Shown are examples of divisions that are planar (A), perpendicular (B), oblique with planar correction (C), or oblique with perpendicular correction (D).
Figure 6
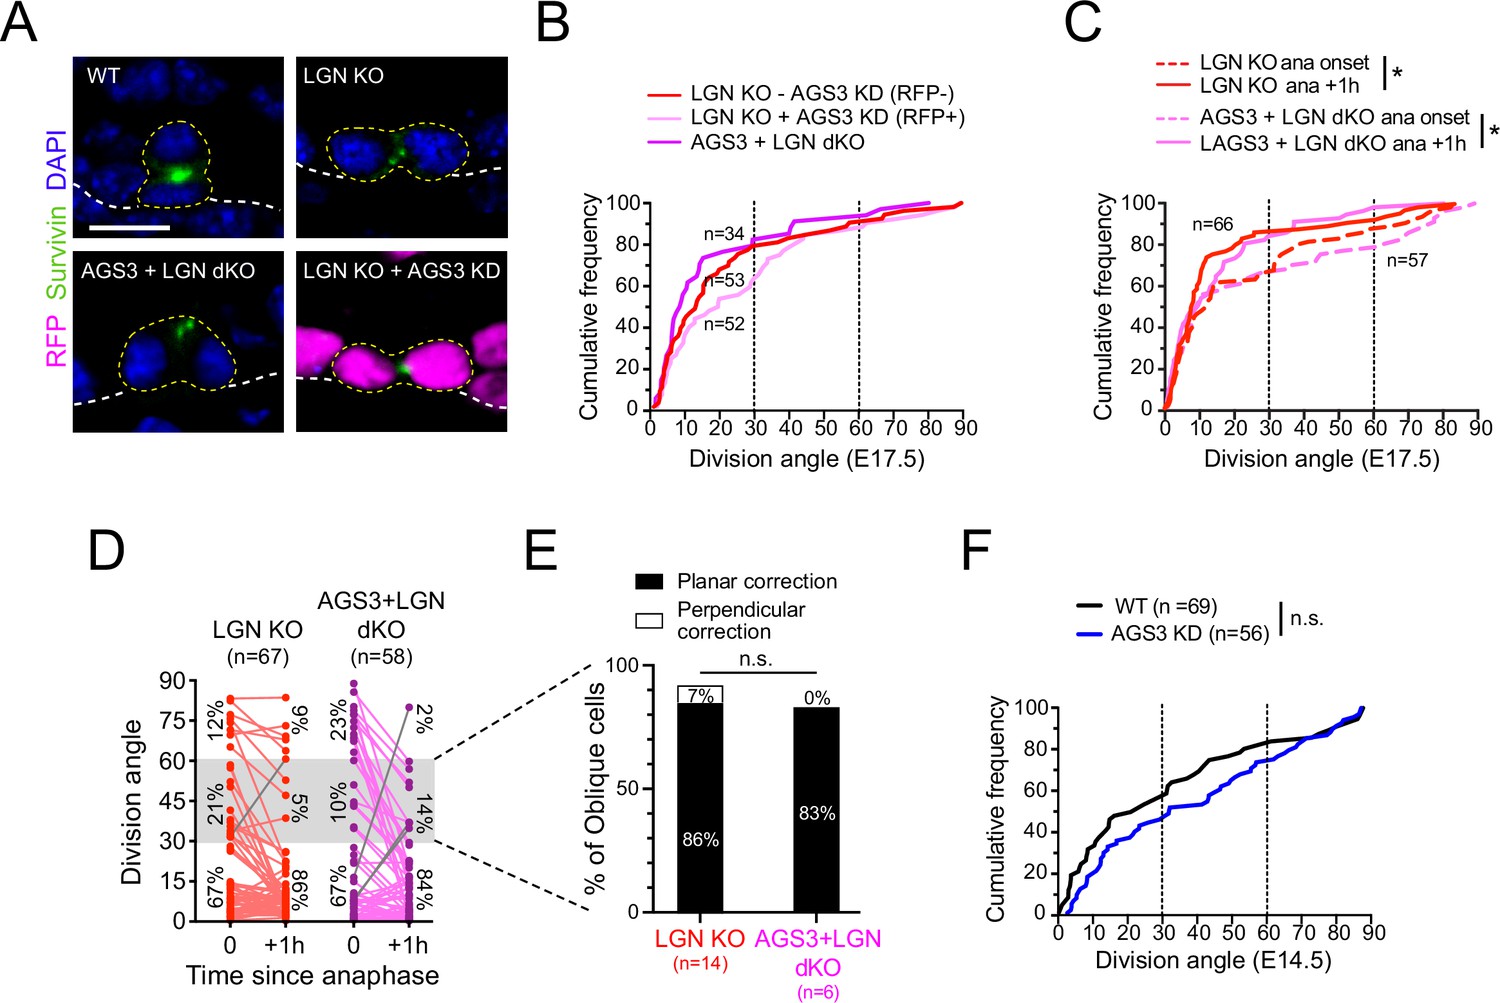
Gpsm2 is epistatic to Gpsm1.
(A) Images of telophase cells from E17.5 wild-type (WT), LGN KO (Gpsm2−/−), AGS3 + LGN dKO (Gpsm1−/−; Gpsm2−/−), and AGS3 KD + LGN KO (Gpsm11147; Gpsm2−/−) backskin epidermis, labeled with the late-stage mitotic marker Survivin (green). (B) Cumulative frequency distribution of telophase division angles from fixed sections for indicated genotypes: Gpsm2−/−; Gpsm11147 H2B-RFP− (LGN KO, red dashed line), Gpsm2−/−; Gpsm11147 H2B-RFP+ (LGN KO +AGS3 KD, magenta dashed line), and Gpsm1−/−; Gpsm2−/− (AGS3 + LGN dKO, magenta line). (C) Cumulative frequency distribution of division angles at anaphase onset (dashed lines) and 1 hr later (solid lines) from live-imaging experiments of LGN single KOs (red, replotted from Figure 4E) and AGS3 + LGN dKOs (magenta). (D) Line graphs of individual cell data from (C) depicting orientation at anaphase onset and 1 hr later for LGN KO (red) and AGS3 + LGN dKO cells (magenta). (E) Data from (D) depicting planar vs. perpendicular telophase correction behavior for anaphase obliques (gray bar), showing that 83% of double knockout cells correct to planar, similar to the 86% observed in LGN single KOs. (F) Cumulative frequency distribution of telophase division angles quantified from E14.5 back skin sections for AGS3 KD (Gpsm11147 H2B-RFP+) cells (blue) and WT uninjected littermate controls (black). Scale bars, 10 µm; n value indicates cells from >3 independent embryos per genotype (B) with at least 2 technical replicates (C–E); n.s., not significant; *p < 0.05, by Kolmogorov–Smirnov test (B, C, F) or chi-square test (E).
Figure 7
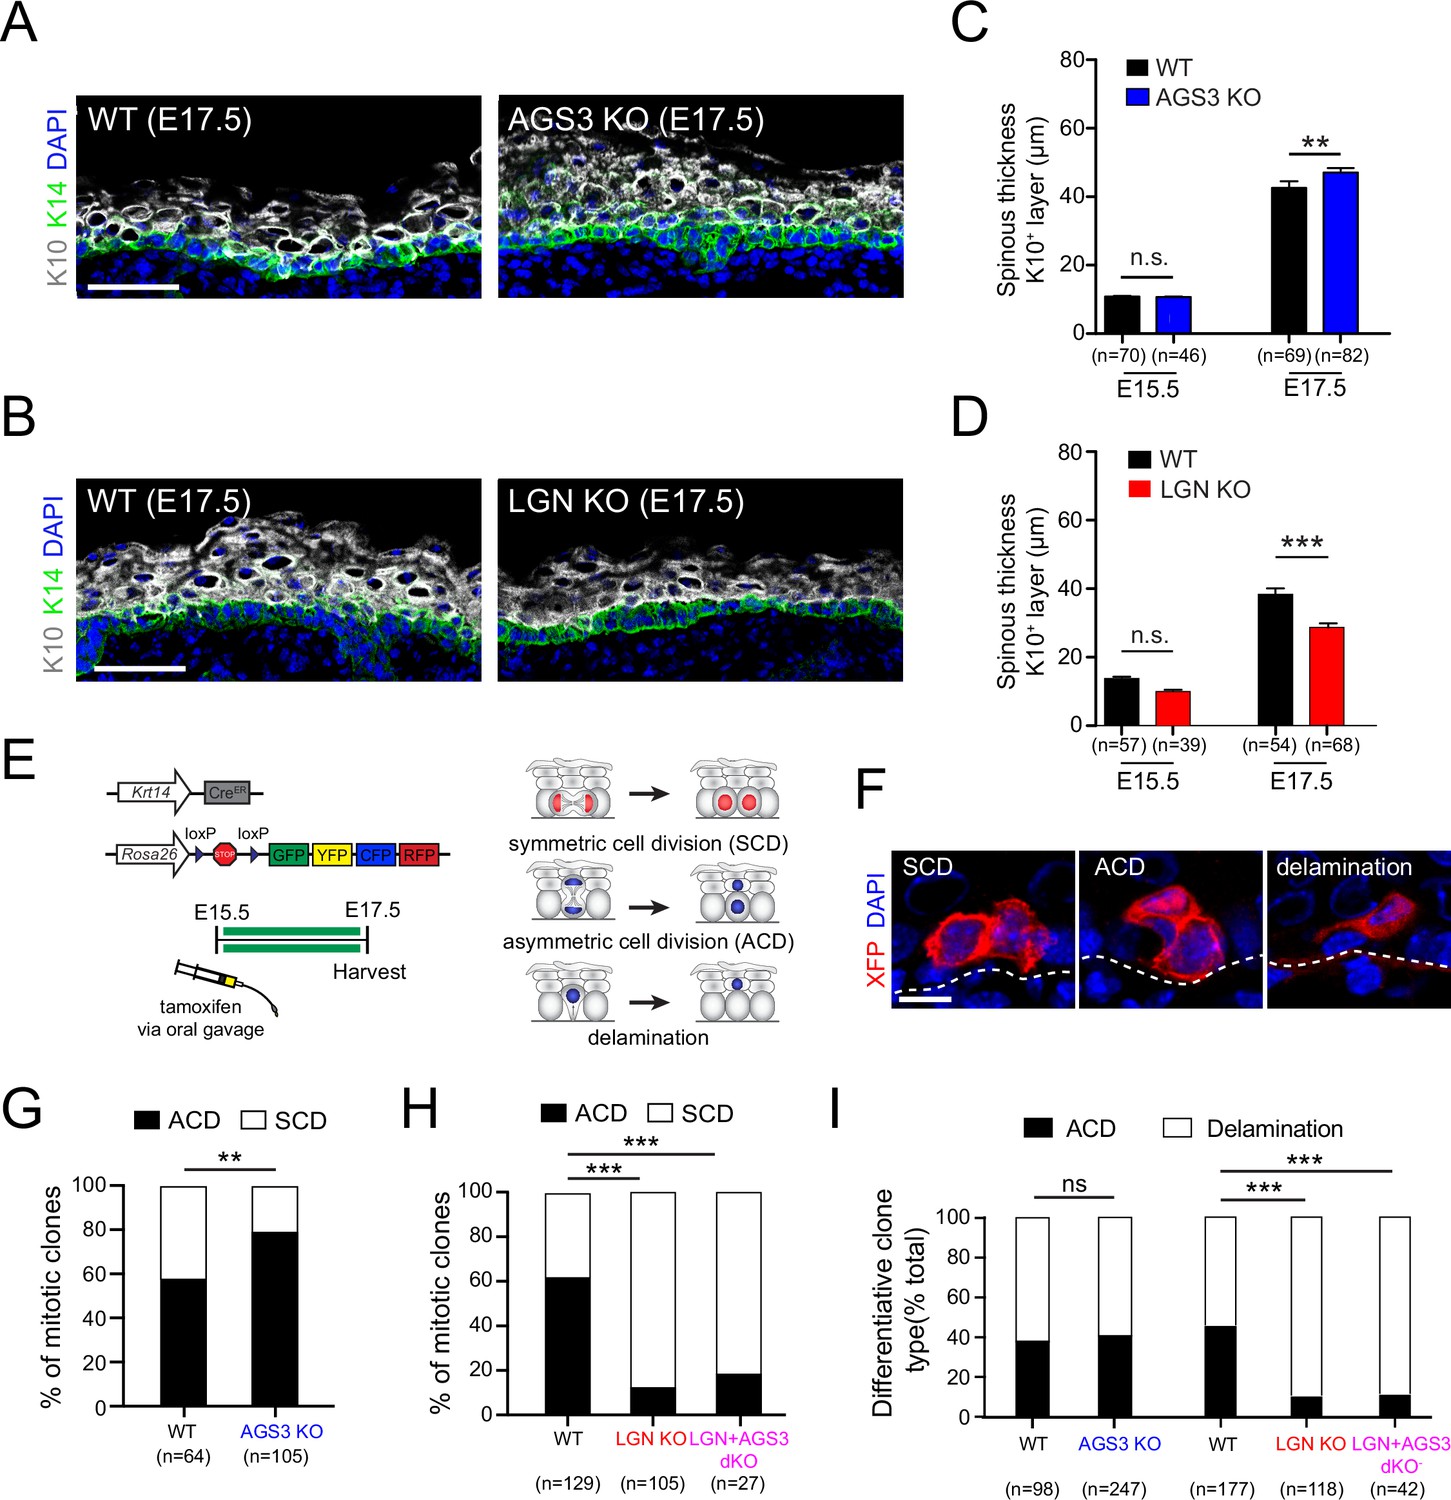
AGS3/Gpsm1 loss promotes asymmetric cell fates and differentiation.
Immunofluorescent images (A, B) and quantification (C, D) of spinous (K10, gray) layer thickness in AGS3 KOs (A, C) and LGN KOs (B, D) compared to wild-type (WT) littermate controls. (E) Graphical depiction of clonal lineage tracing strategy using Krt14CreER and the multi-colored Rosa26confetti reporter, for data shown in (F–I). (F) Representative images of showing three types of clones. (G) Quantification of proportion of symmetric cell division (SCD) vs. asymmetric cell division (ACD) clones in AGS3 KOs (Gpsm1−/−) (blue) compared to heterozygote and WT (Gpsm1+/) controls (black). (H) Same analysis as (G) but for WT (black), LGN KO (Gpsm2−/−, red), and AGS3 + LGN dKO (Gpsm1−/−; Gpsm2−/−, magenta) clones. (I) Proportions of differentiative clones occurring by ACD vs. delamination for indicated genotypes. Scale bars: 50 µm in (A, B), 10 µm in (F); n values indicate measurements (C, D) or clones (G–I) from >3 independent embryos per genotype; n.s., not significant, **p < 0.01, ***p < 0.001 by unpaired t-test (C, D) or chi-square (G–I).
Figure 8
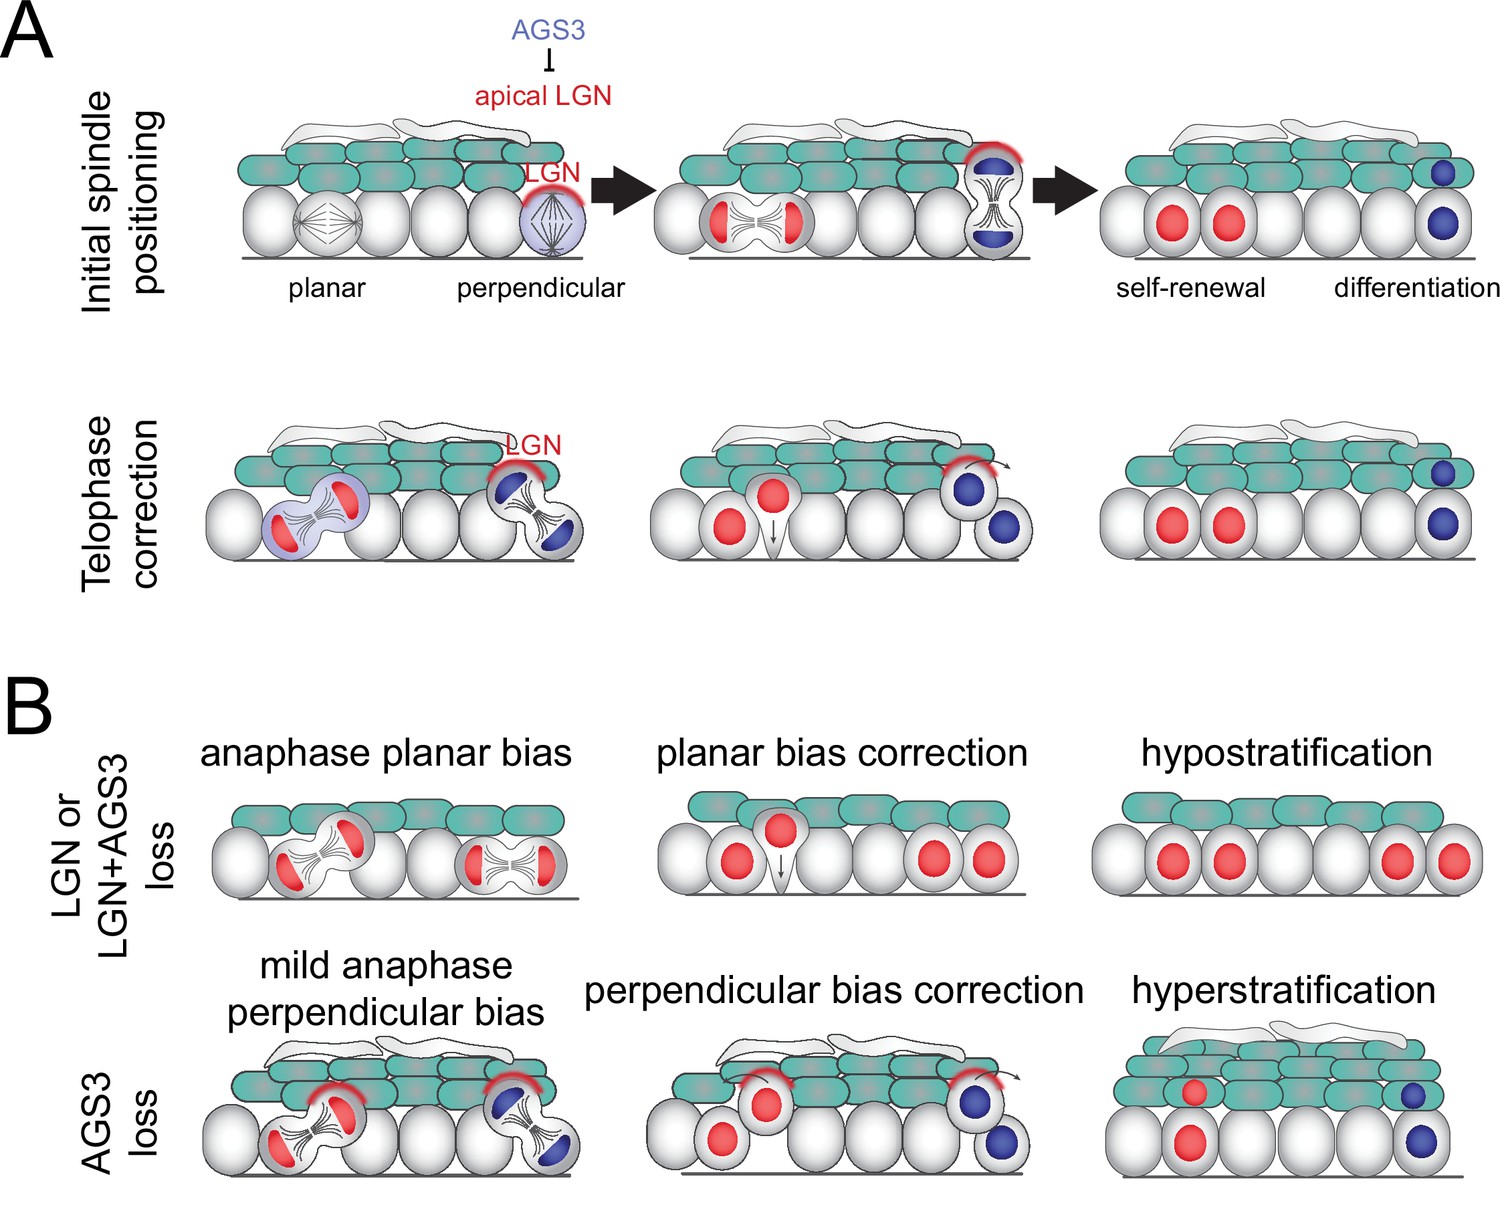
Model of two-step process for oriented cell divisions.
(A) Basal progenitors can undergo either self-renewing planar symmetric divisions (red cell) or differentiative perpendicular asymmetric divisions (blue cell). Oriented cell divisions are regulated in a two-step process: (1) initial spindle positioning (top) and (2) telophase correction (bottom). Polarized apical LGN promotes apical spindles at metaphase and also promotes perpendicular reorientation during telophase. Primarily cytoplasmic AGS3 displaces LGN from the cortex throughout mitosis to inhibit perpendicular divisions. (B) Phenotypes resulting from loss of LGN and/or AGS3.
Additional files
-
MDAR checklist
- https://cdn.elifesciences.org/articles/80403/elife-80403-mdarchecklist1-v2.docx
-
Source data 1
Source data contains raw data measurements for all figure panels with data quantification.
- https://cdn.elifesciences.org/articles/80403/elife-80403-data1-v2.xlsx
Download links
A two-part list of links to download the article, or parts of the article, in various formats.
Downloads (link to download the article as PDF)
Open citations (links to open the citations from this article in various online reference manager services)
Cite this article (links to download the citations from this article in formats compatible with various reference manager tools)
AGS3 antagonizes LGN to balance oriented cell divisions and cell fate choices in mammalian epidermis
eLife 12:e80403.
https://doi.org/10.7554/eLife.80403


