Regulation of pDC fate determination by histone deacetylase 3
- Institute for Immunology, Tsinghua-Peking Center for Life Sciences, School of Medicine, Tsinghua University, China
- Beijing Key Laboratory for Immunological Research on Chronic Diseases, China
Figures
Figure 1 with 4 supplements
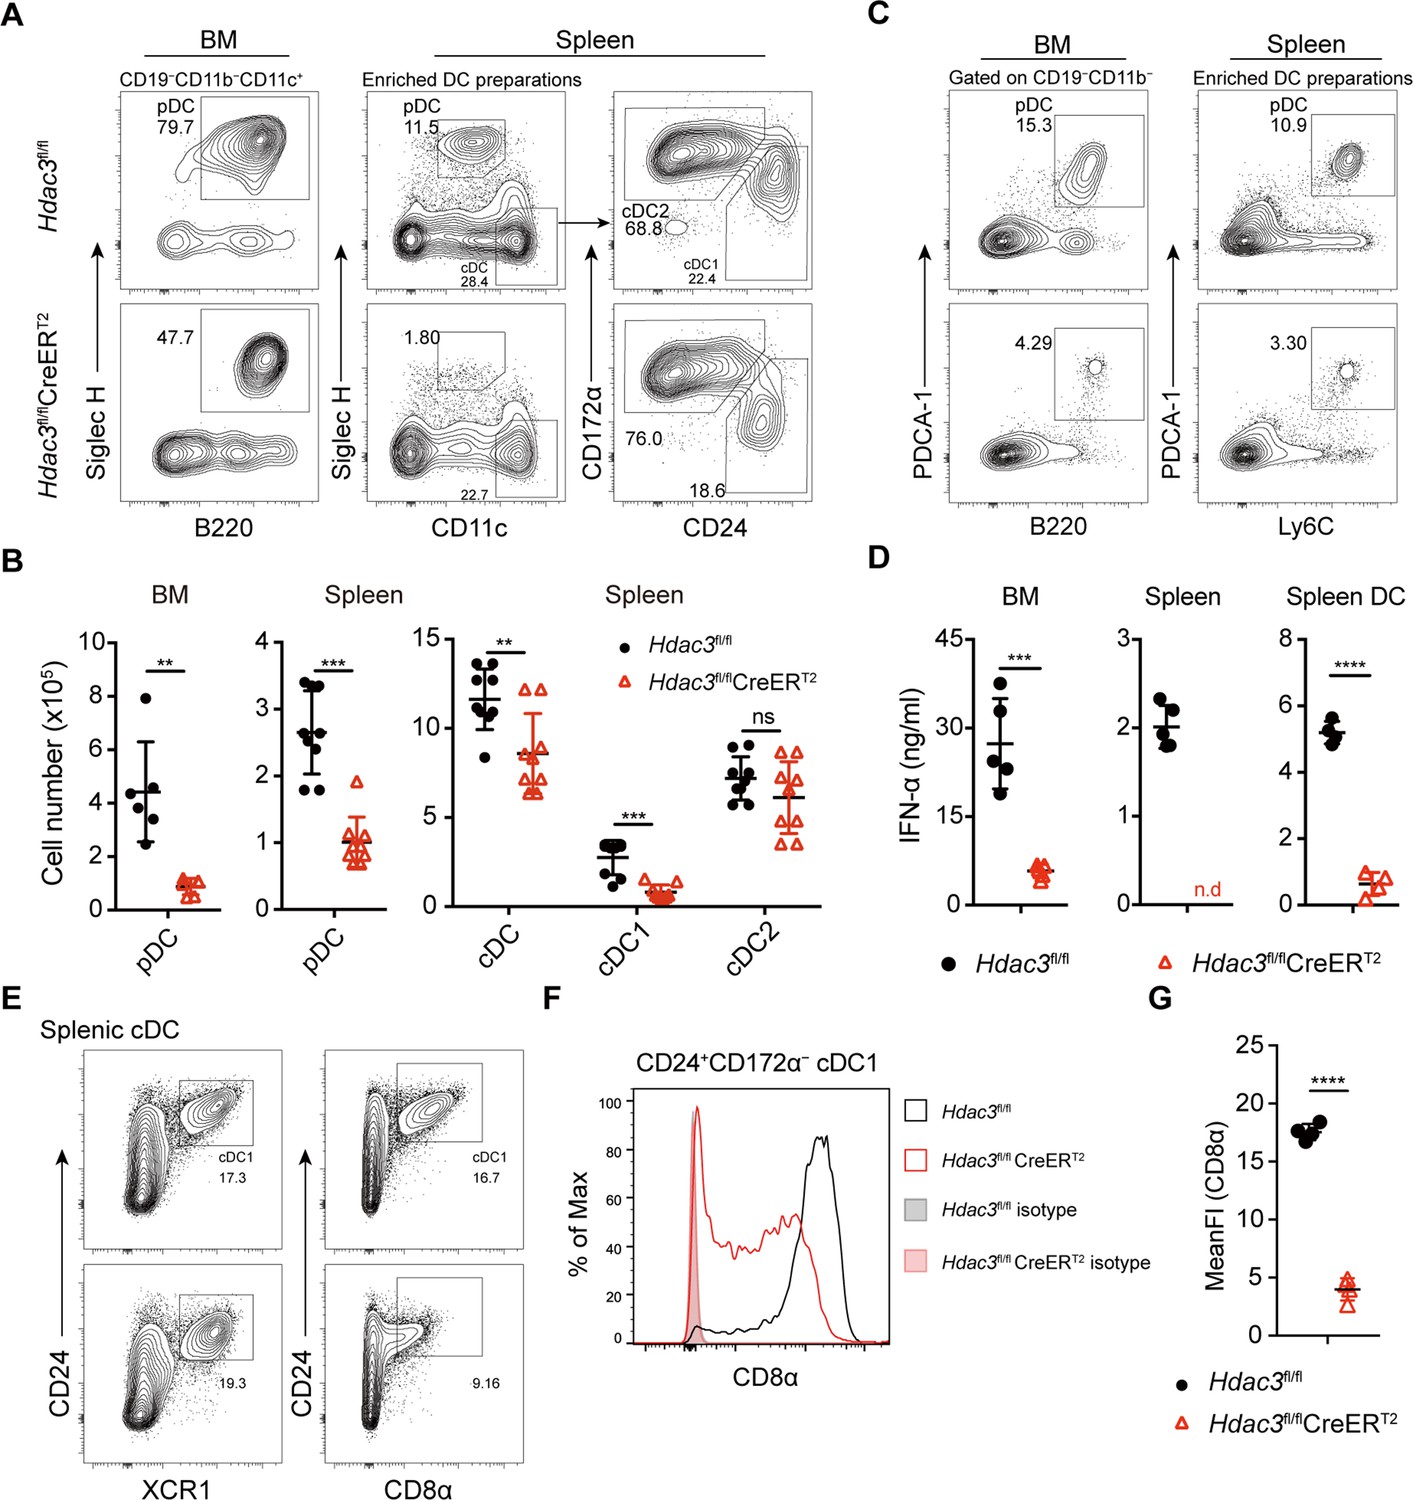
Impaired pDC development in Hdac3-deficient mice.
(A–B) Representative flow cytometry profiles of BM pDCs and splenic DC subsets (A) and the absolute numbers of each DC subset of Hdac3fl/fl and Hdac3fl/fl CreERT2 mice (B). (C) The pDC populations in BM and spleen were defined using a combination of indicated markers. Shown are staining profiles of gated CD11b−CD19− cells from the BM and DC enrichment preparations from the spleens. (D) IFN-α production by Hdac3fl/fl or Hdac3fl/fl CreERT2 cells in vitro. Total BM cells, splenocytes or purified DC preparations from the spleens were stimulated with CpG ODN 2216, and IFN-α in the supernatants was measured after 18 hr by ELISA. Cells were harvested from 4 to 5 mice each group. (E) The cDC1 populations in spleen were defined using a combination of indicated markers. Staining profiles of gated Siglec H−CD11c+ cells from the spleen are shown. (F–G) The expression and mean fluorescent intensities (MFIs) of CD8α in splenic CD24+CD172α− cDC1s from Hdac3fl/fl and Hdac3fl/fl CreERT2 mice. Data were pooled from two to three independent experiments, and shown as mean ± SD. * p<0.05; ** p<0.01; *** p<0.001; **** p<0.0001, by two-tailed Student’s t-test.
Figure 1—figure supplement 1
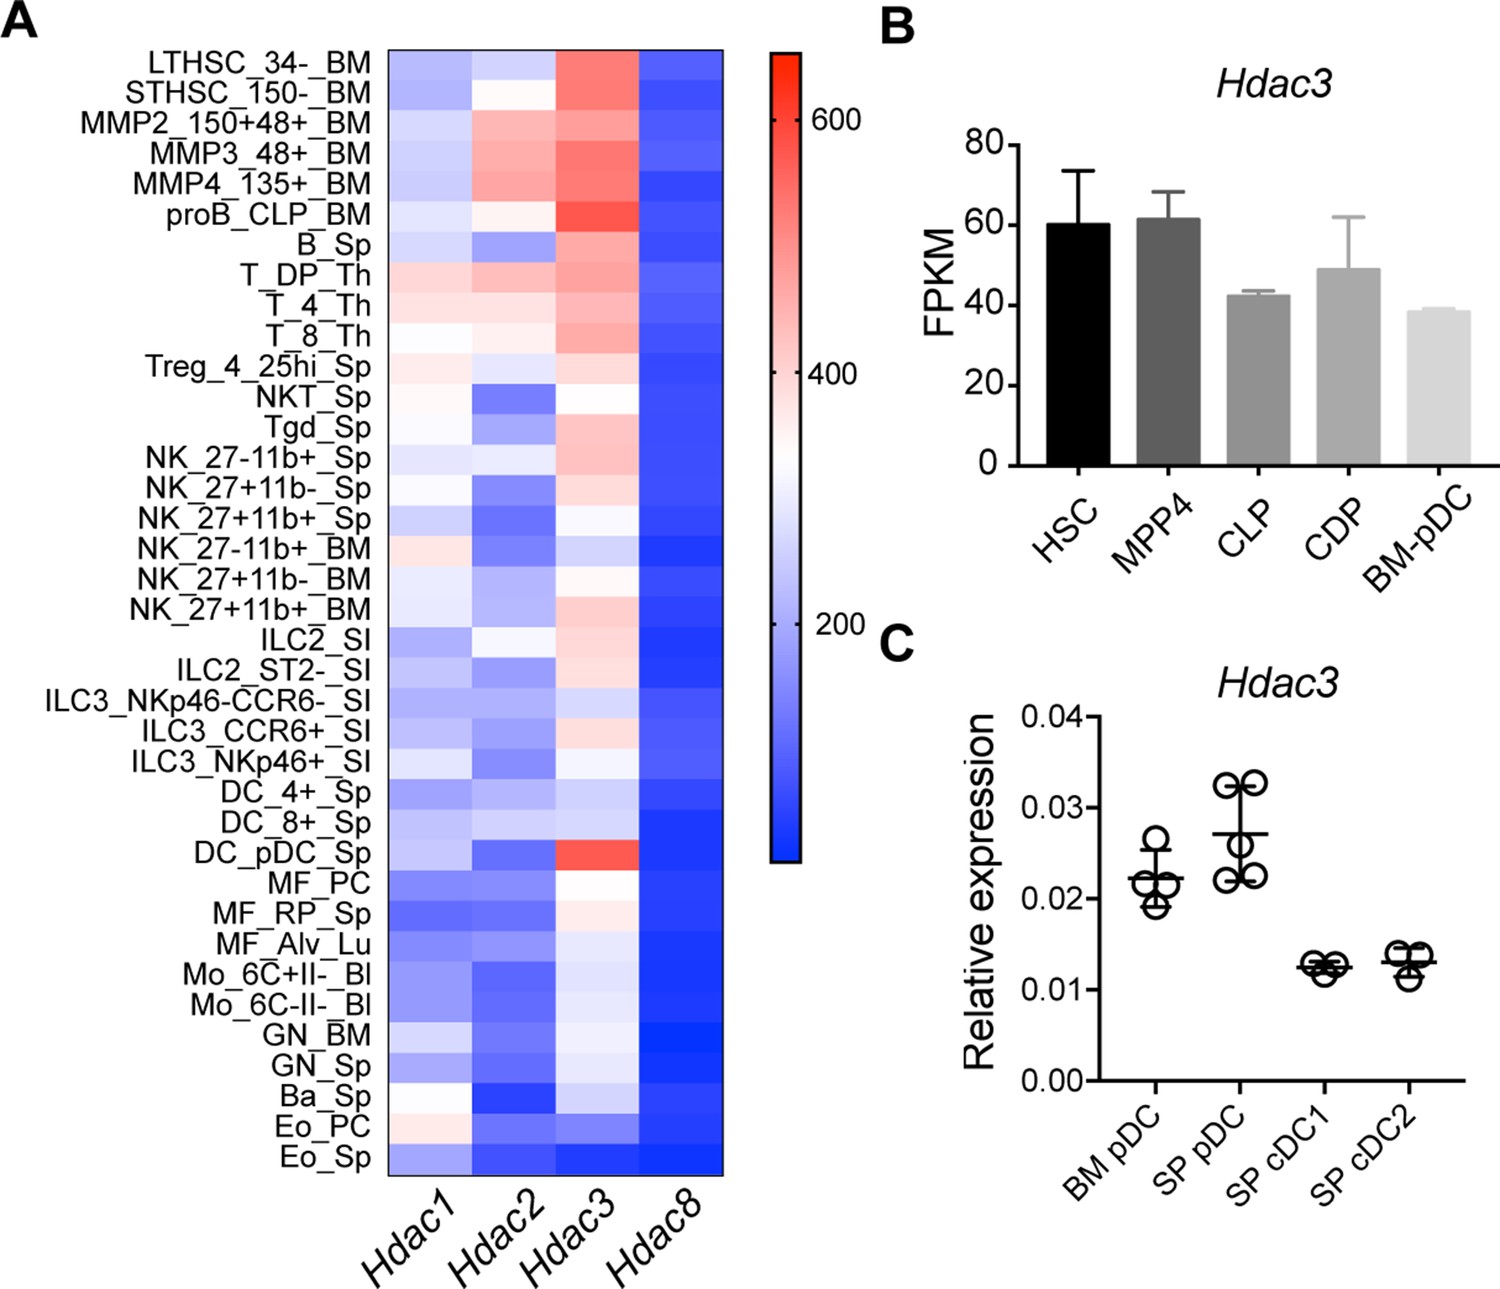
Hdac3 was preferentially expressed in pDC.
(A) The expression level of Hdac3 in murine immune cell types. Shown are the expression profiles of Hdac3 in the ImmGen mRNA expression database of selected immune cell populations. (B) Relative Hdac3 expression in different hematopoietic progenitors, based on the data from ImmGen. (C) Quantification of relative Hdac3 mRNA levels (mean ± SD) of sorted DC subsets by qRT-PCR. Results are from one experiment representative of two independent experiments, each including 3–5 mice. LT-HSC, long-term hematopoietic stem cell; ST-HSC, short-term HSC; MPP, multipotent progenitor; MEP, megakaryocyte–erythroid progenitor; CLP, common lymphoid progenitor; CMP, common myeloid progenitor; GMP, granulocyte-monocyte progenitors; MDP, monocyte-dendritic cell progenitor; CDP, common dendritic cell progenitor.
Figure 1—figure supplement 2
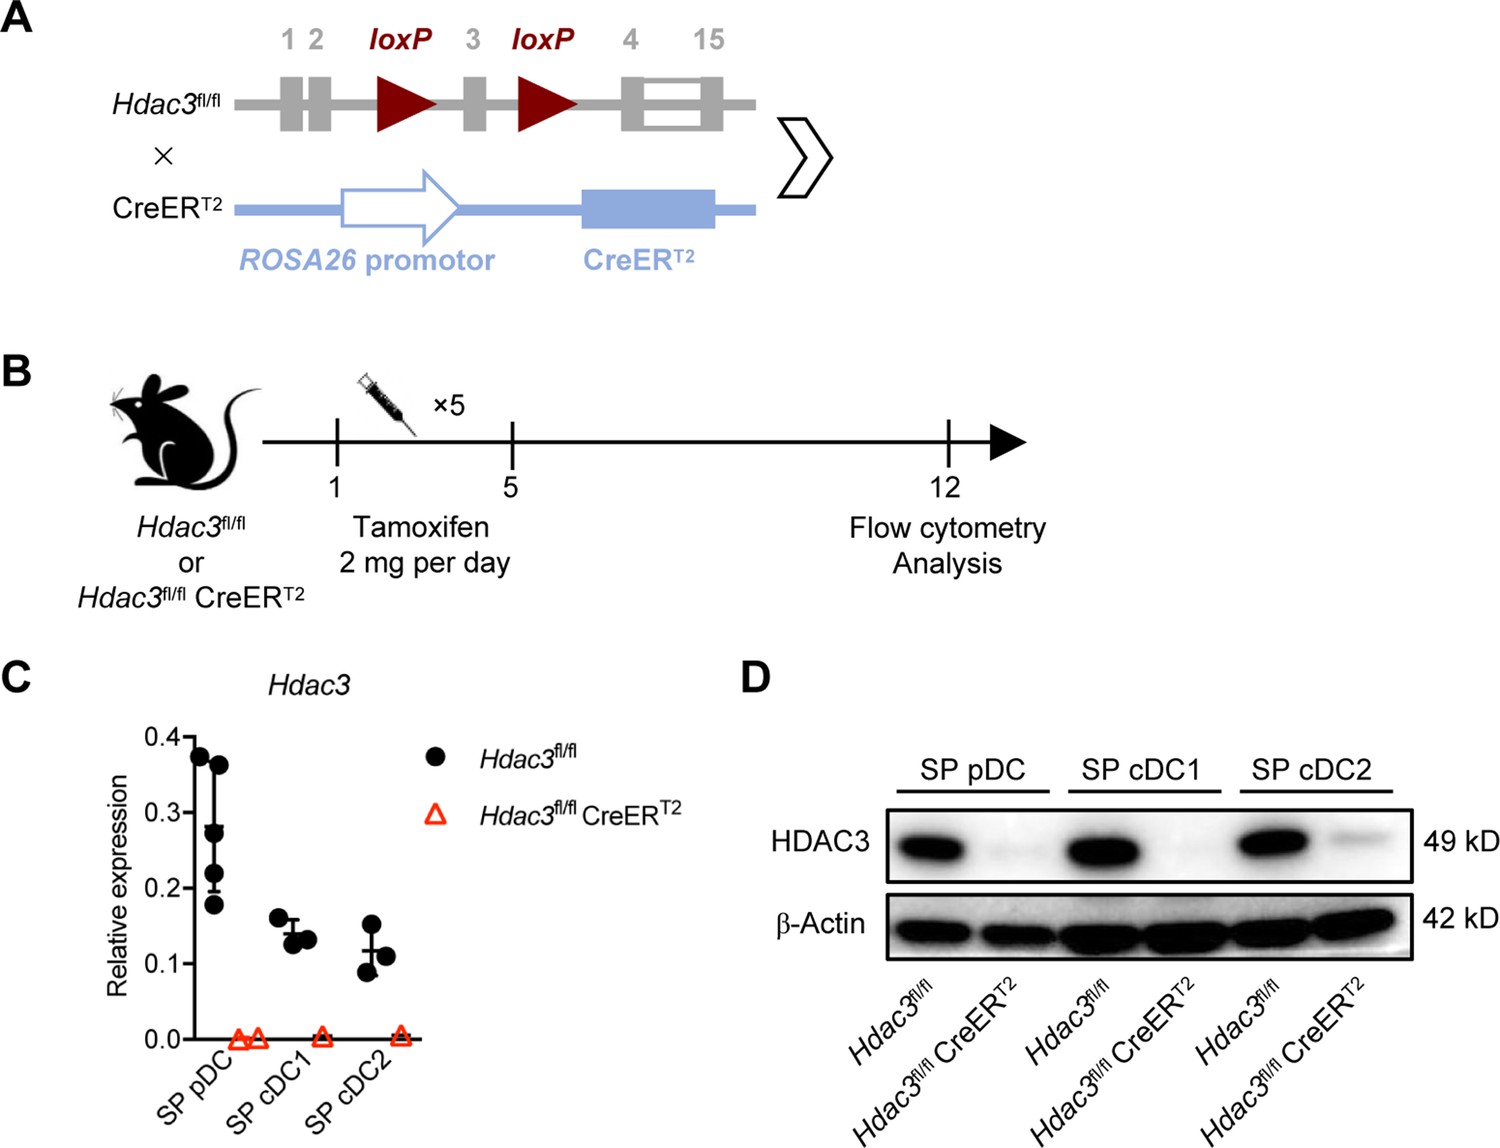
Hdac3 was efficiently deleted by Tamoxifen treatment in Hdac3fl/fl CreERT2 mice.
(A–B) (A) Schematic representation for generation of Hdac3fl/fl CreERT2 mice. (B) Schematic diagram of tamoxifen-induced Hdac3 deletion in Hdac3fl/fl CreERT2 mice. (C–D) Deletion efficiency determined by qRT-PCR (C, mean ± SD of indicated cells from 3 to 4 mice) and Western blot (D) for protein levels.
-
Figure 1—figure supplement 2—source data 1
Western blot of HDAC3 knockout efficiency in Rosa26-CreERT2 induce HDAC3 conditional knockout splenic DC subsets.
- https://cdn.elifesciences.org/articles/80477/elife-80477-fig1-figsupp2-data1-v4.zip
Figure 1—figure supplement 3
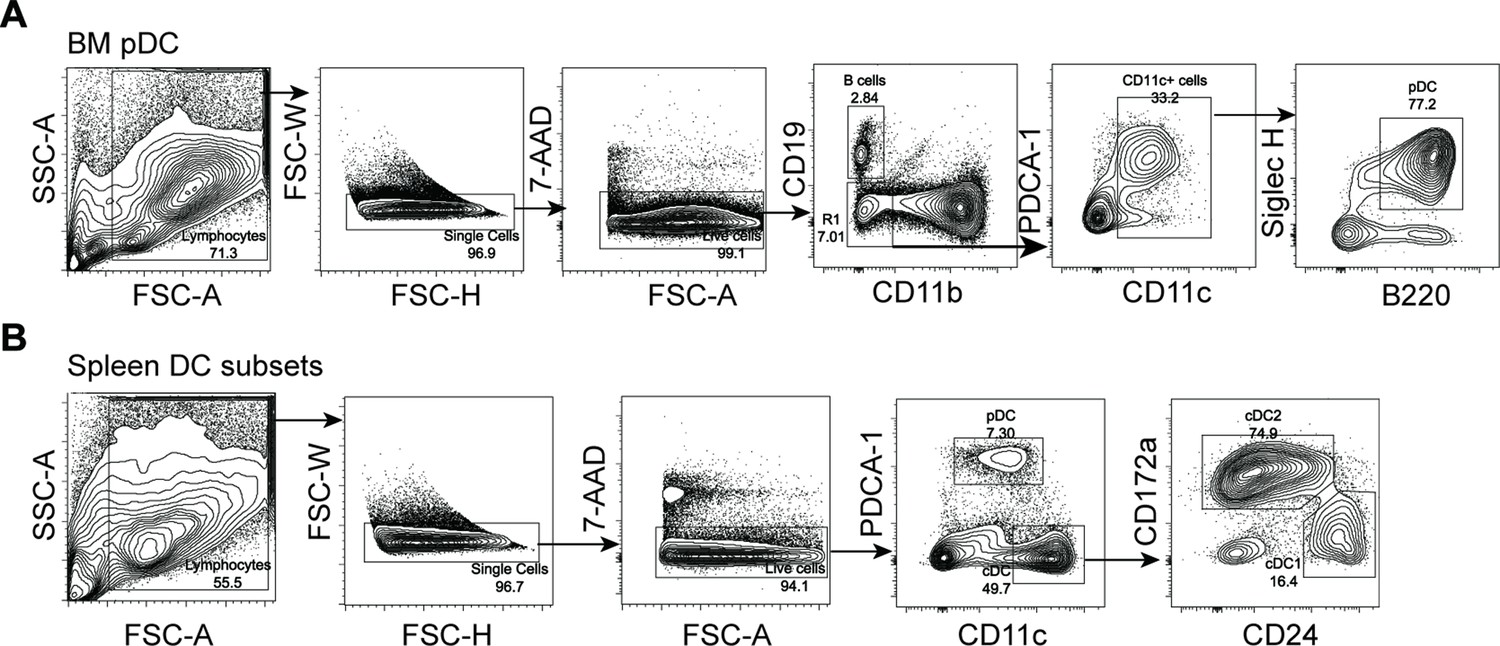
Gating strategy for pDCs and cDCs.
(A) Identification of pDCs from bone marrow, as CD45+CD11b−CD19−CD11cint PDCA-1+B220+Siglec H+ population. (B) Identification of pDCs from spleen. Splenocytes were enriched by deleting indicated lineage cells via antibody cocktail (CD3/CD90/TER-119/Ly6G/CD19) and stained for flow cytometry analysis and sorting of pDCs.
Figure 1—figure supplement 4
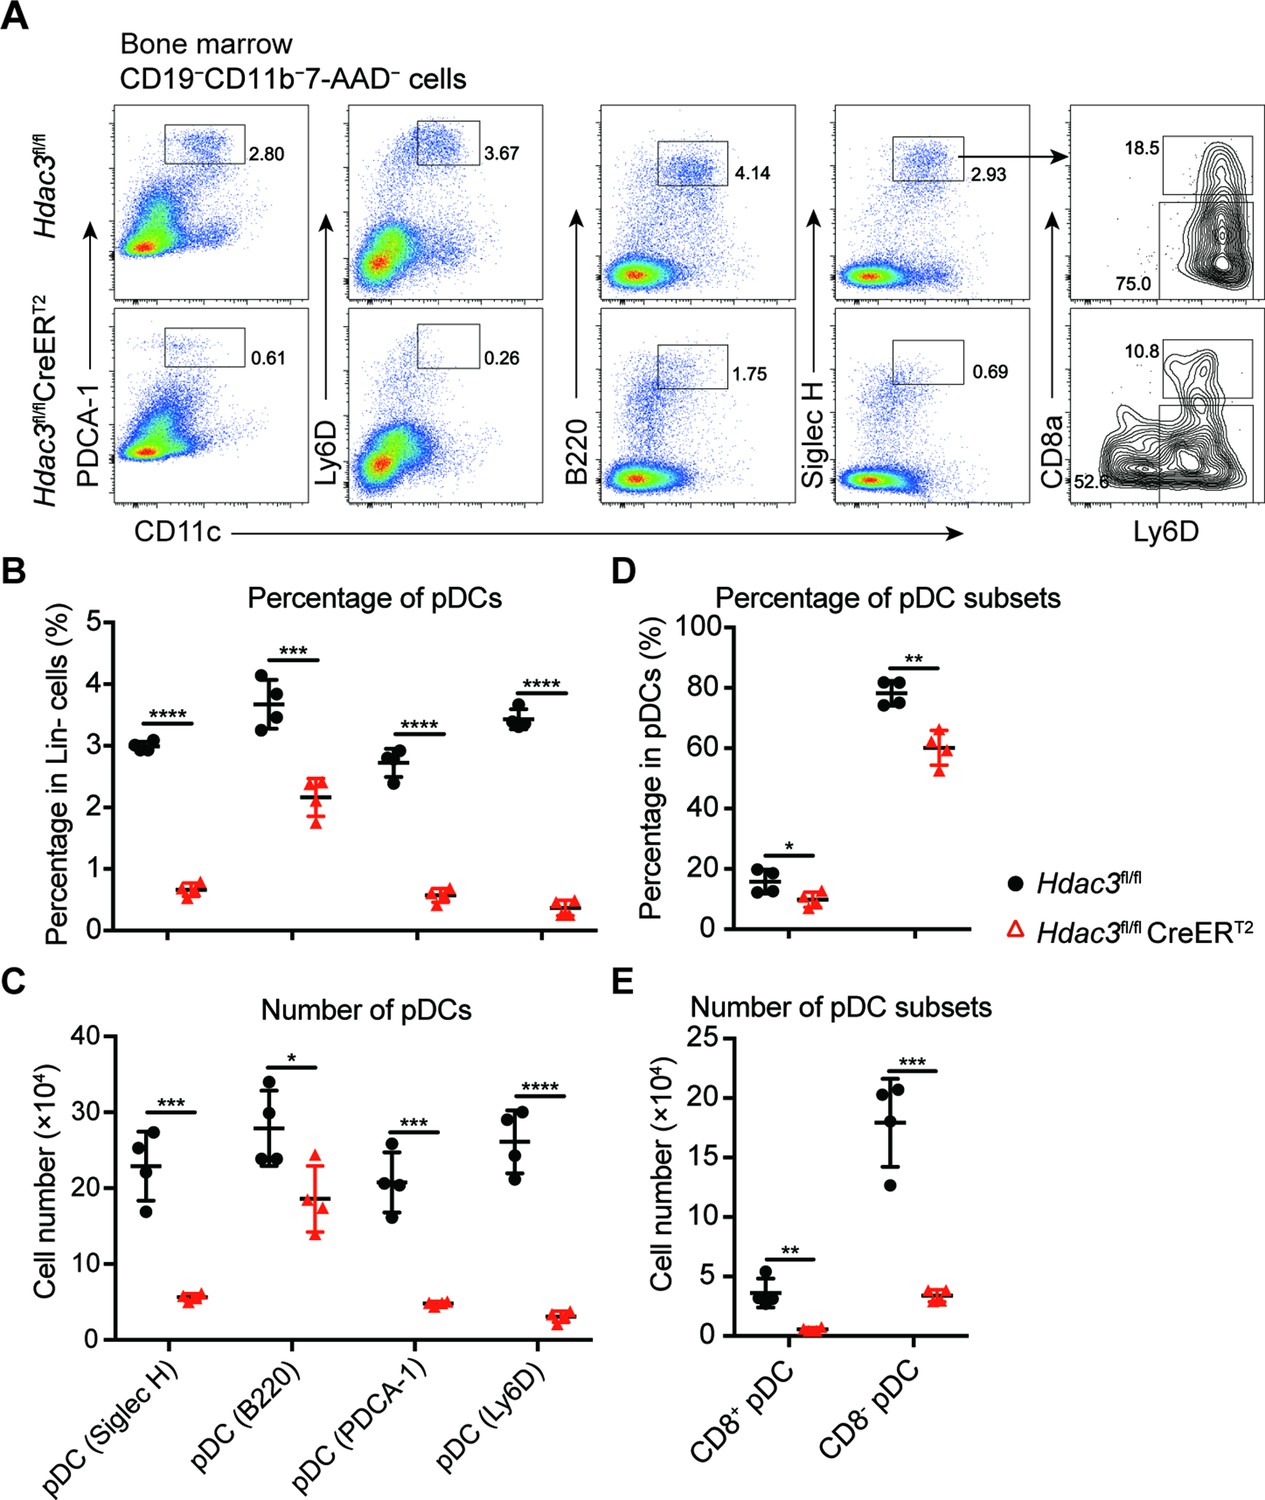
pDC gating by different surface markers.
(A) Representative flow cytometry profiles of bone marrow pDCs by PDCA-1, Ly6D, B220, Siglec H, and CD8 expression in pDCs. Percentage (B and D) and cell number (C and E) of pDCs revealed by indicated surface marker, and pDC subsets. Data were pooled from two independent experiments, and shown as mean ± SD. * p<0.05; ** p<0.01; *** p<0.001; **** p<0.0001, by two-tailed Student’s t-test.
Figure 2
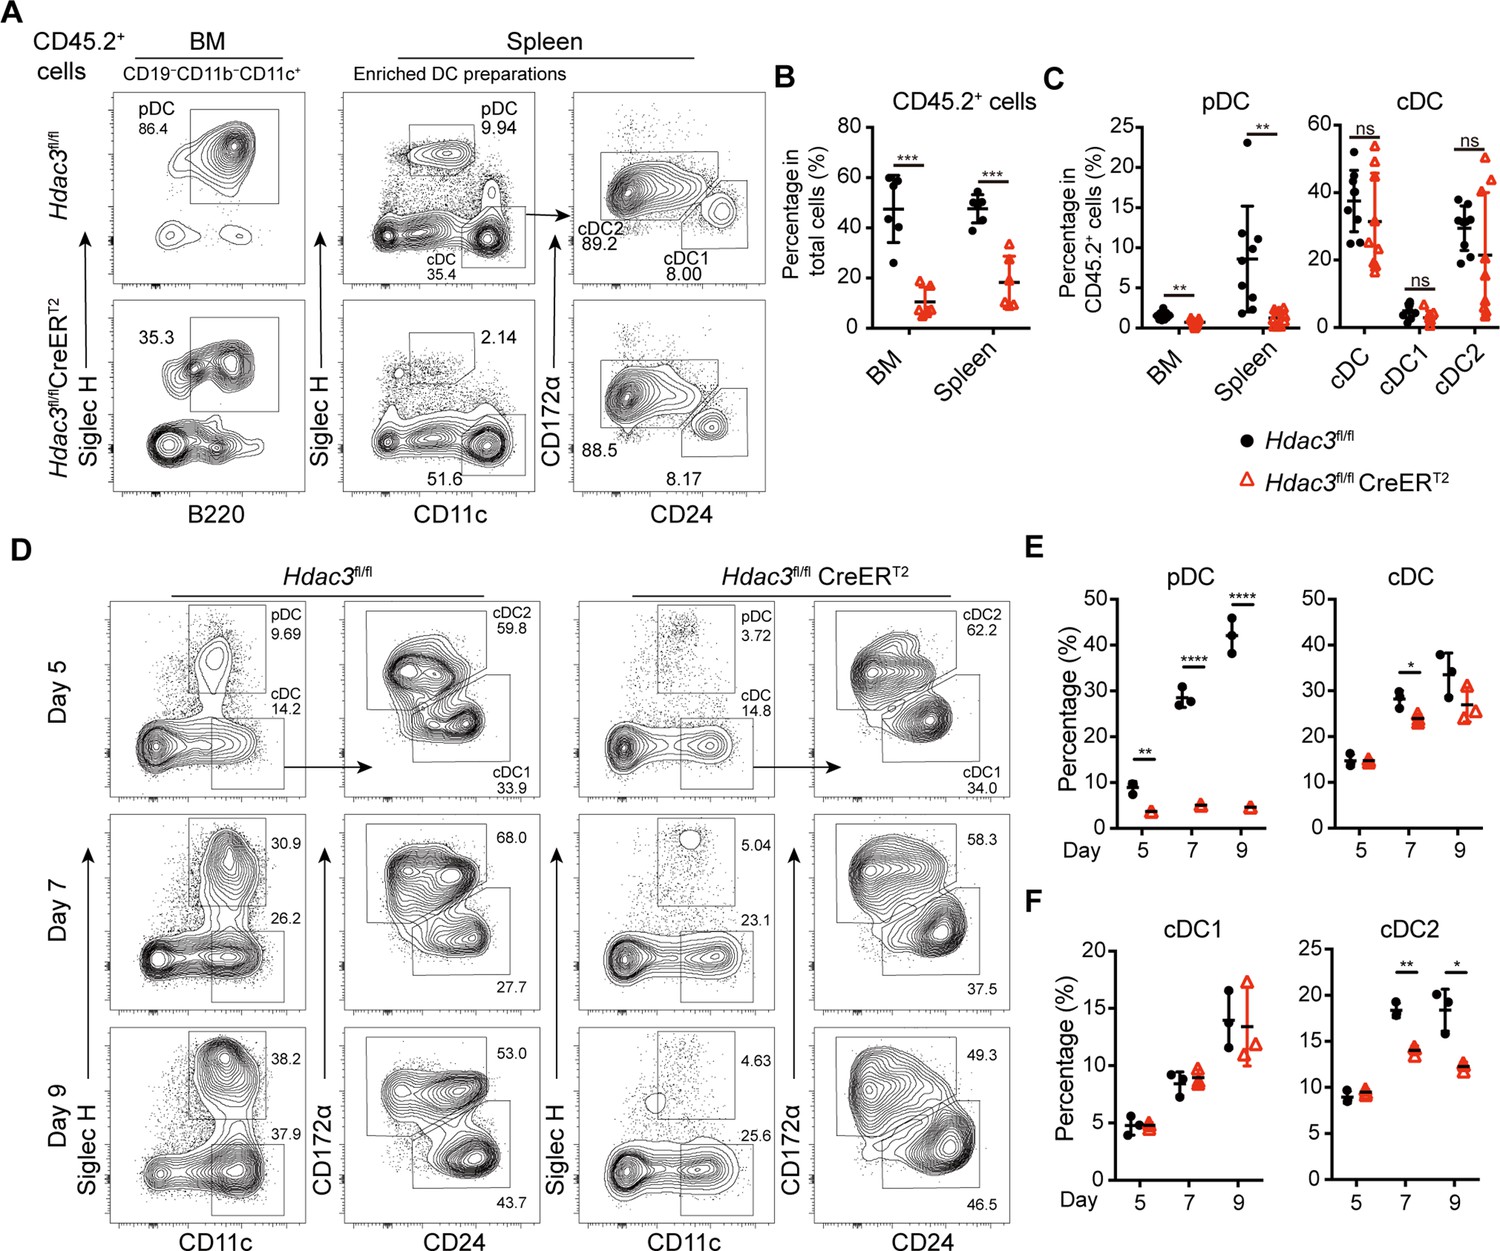
HDAC3 regulated pDC development in a cell-intrinsic manner.
Lethally irradiated CD45.1 WT mice were reconstituted with a mixture of CD45.1 WT BM and BM from CD45.2 Hdac3fl/fl or Hdac3fl/fl CreERT2 mice at 1:1 ratio. Eight weeks after reconstitution, Hdac3 deletion was induced by tamoxifen. (A–C) Results shown are staining profiles of gated CD11b−CD19−CD11c+ cells from the BM and enriched DC preparations from the spleens. Representative flow cytometry profiles of CD45.2+ donor-derived BM pDCs and splenic DC subsets (A), the percentage of CD45.2+ cells in BM and spleen (B), and the percentage of each DC subset among CD45.2+ cells (C) in the BM chimeric mice. Results are from one experiment representative of three independent experiments with three animals per group. (D–F) Total BM cells were plated at 1.5×10⁶ cells/ml in the presence of 200 ng/ml FLT3L and 1 μM 4-Hydroxytamoxifen (4OH-T). Results shown representative flow cytometry profiles (D) and the percentage of DC subsets (E–F) of FLT3L stimulated BM cultures on days 5, 7, and 9. Results are from one experiment representative of three independent experiments with three animals per group. Data are shown as mean ± SD. * p<0.05; ** p<0.01; *** p<0.001; **** p<0.0001, by two-tailed Student’s t-test.
Figure 3 with 2 supplements
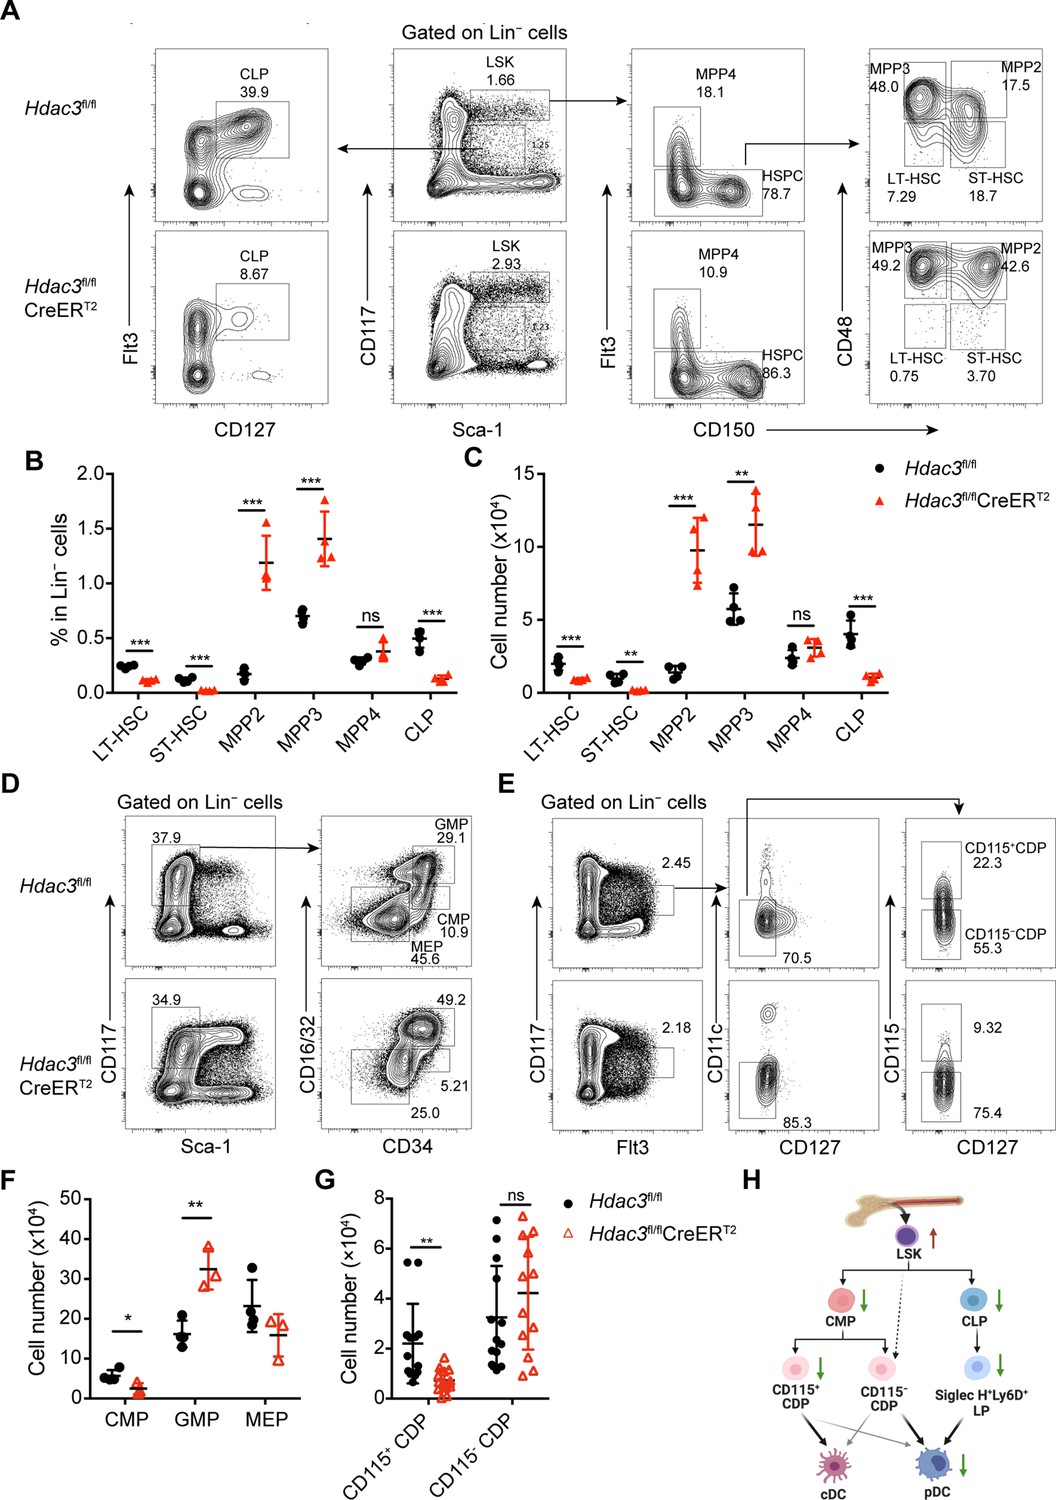
HDAC3 deficiency resulted in altered numbers of DC progenitor populations.
(A to C) Representative flow cytometry profiles (A), the percentage (B) and the absolute cell number (C) of HSC subsets, MPP subsets and CLPs in Hdac3fl/fl or Hdac3fl/fl CreERT2 mice.(D–G) Representative flow cytometry profiles (D and E) and the absolute cell number (F and G) of CMP, GMP and MEP (D and F), and CDP subsets (E and G) in Hdac3fl/fl or Hdac3fl/fl CreERT2 mice. (H) A schematic diagram summarizing the changes in numbers of progenitors with DC differentiation potential in HDAC3 deficient mice. Data were from one experiment representative of at least two independent experiments with three to four animals per group, and shown as mean ± SD. * p<0.05; ** p<0.01; *** p<0.001; **** p<0.0001, by two-tailed Student’s t-test.
Figure 3—figure supplement 1

Pre-DC analysis in Hdac3 deficient mice.
(A–C) Representative flow cytometry profiles (A), the percentage (B) and absolute number of pre-DCs and their subsets in Hdac3fl/fl or Hdac3fl/fl CreERT2 mice. (D–F) Representative flow cytometry profiles (D), the percentage (E) and the absolute number (F) of pre-cDC1 in Hdac3fl/fl or Hdac3fl/fl CreERT2 mice. Data represented two independent experiments and were shown as mean ± SD. * p<0.05; ** p<0.01; *** p<0.001; **** p<0.0001, by two-tailed Student’s t-test.
Figure 3—figure supplement 2

HDAC3 deficiency resulted in disturbed proliferation of DC progenitor cells.
(A) The representative flow cytometry profiles of BrdU-incorporation assays of indicated progenitor cells from control or HDAC3 knockout group. (B) The frequency of BrdU + cells in indicated cell groups. Results are from one experiment representative of at least two independent experiments with three to four animals per group. Data are shown as mean ± SD. * p<0.05; ** p<0.01; *** p<0.001; **** p<0.0001, by two-tailed Student’s t-test.
Figure 4 with 1 supplement
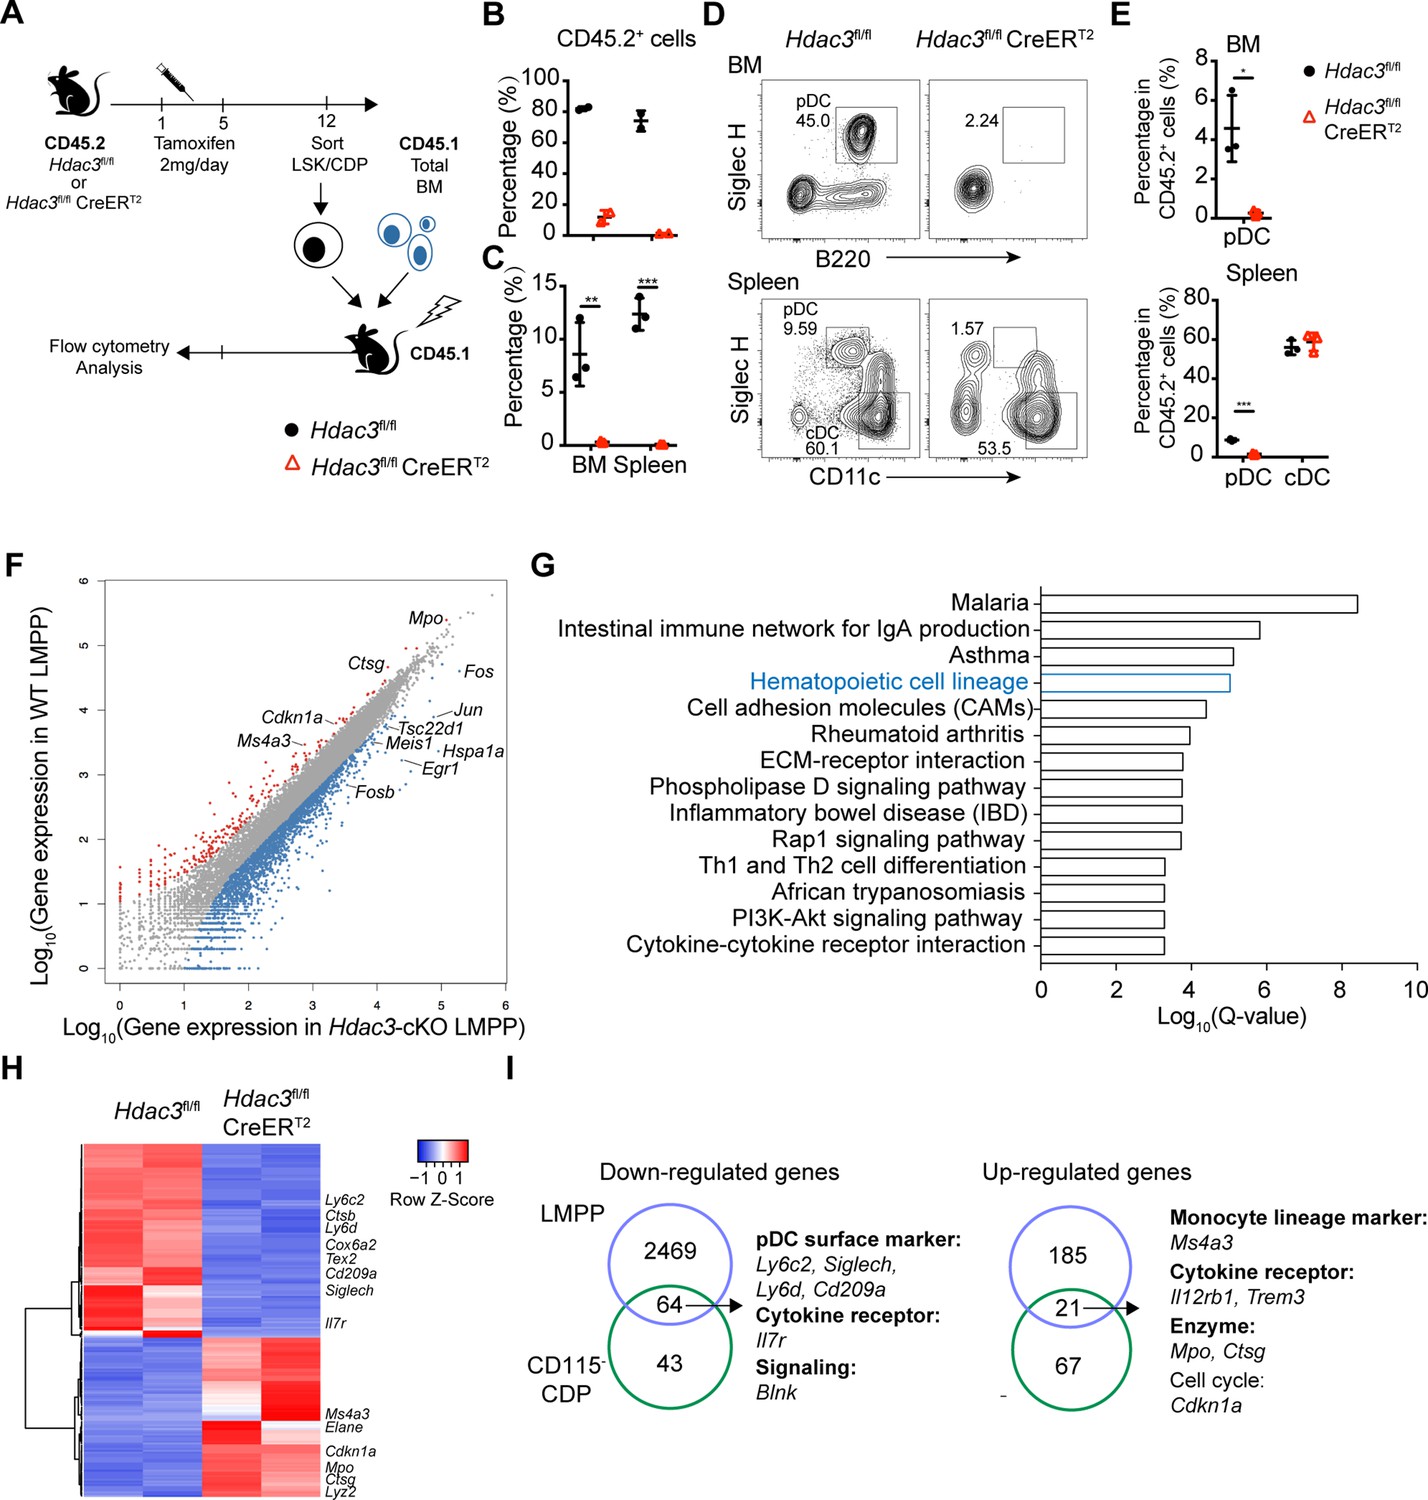
HDAC3 regulated pDC development by modulating the expression of pDC signature genes.
(A) Schematic diagram of progenitor transplantation experiment. HSCs and CD115−CDPs were purified from the BM of Hdac3fl/fl and Hdac3fl/fl CreERT2 mice after tamoxifen treatment, and then transplanted together with CD45.1 BM competitors into lethally irradiated CD45.1 WT mice. Three weeks (LSK) or 10 days (CD115−CDPs) post reconstitution, BM and spleen cells from BM chimeric mice were analyzed for pDC and cDC repopulation. (B–C) The percentage of CD45.2+ cells in BM chimeric mice repopulated with LSK (B) or CD115−CDP (C). (D–E) Representative flow cytometry profiles of BM pDCs and splenic DC subsets in CD45.2+ cells (D) and the percentage of DC subsets among CD45.2+ cells in the BM and spleen (E) of BM chimeric mice reconstituted with CD115−CDPs. Results are from one experiment representative of at least three independent experiments with two to three animals per group. Data are shown as mean ± SD. * p<0.05; ** p<0.01; *** p<0.001; **** p<0.0001, by two-tailed Student’s t-test. (F) Scatter plot shows the differentially expressed genes (DEGs; Fold Change >2, q-value ≤0.001), which were up-regulated (red) and down-regulated (blue) in Hdac3-deficient LMPPs compared with WT LMPPs. Duplicate samples for each genotype were analyzed. (G) KEGG pathway analysis of DEGs in Hdac3-deficient LMPPs compared with WT LMPPs. Shown are pathways with Q-value ≤0.001. (H) Heatmap shows the DEGs (Fold Change >2, q-value ≤0.05) between Hdac3-deficient and WT CD115−CDPs. Duplicate samples for each genotype were analyzed. (I) Common genes down-regulated or up-regulated in Hdac3-deficient LMPPs and CD115−CDPs compared with those from WT LMPP and CD115−CDPs.
Figure 4—figure supplement 1

Purity of CD115−CDPs after sorting.
Representative flow cytometry profile of CDPs in Hdac3fl/fl or Hdac3fl/fl CreERT2 mice before and after sorting.
Figure 5 with 1 supplement
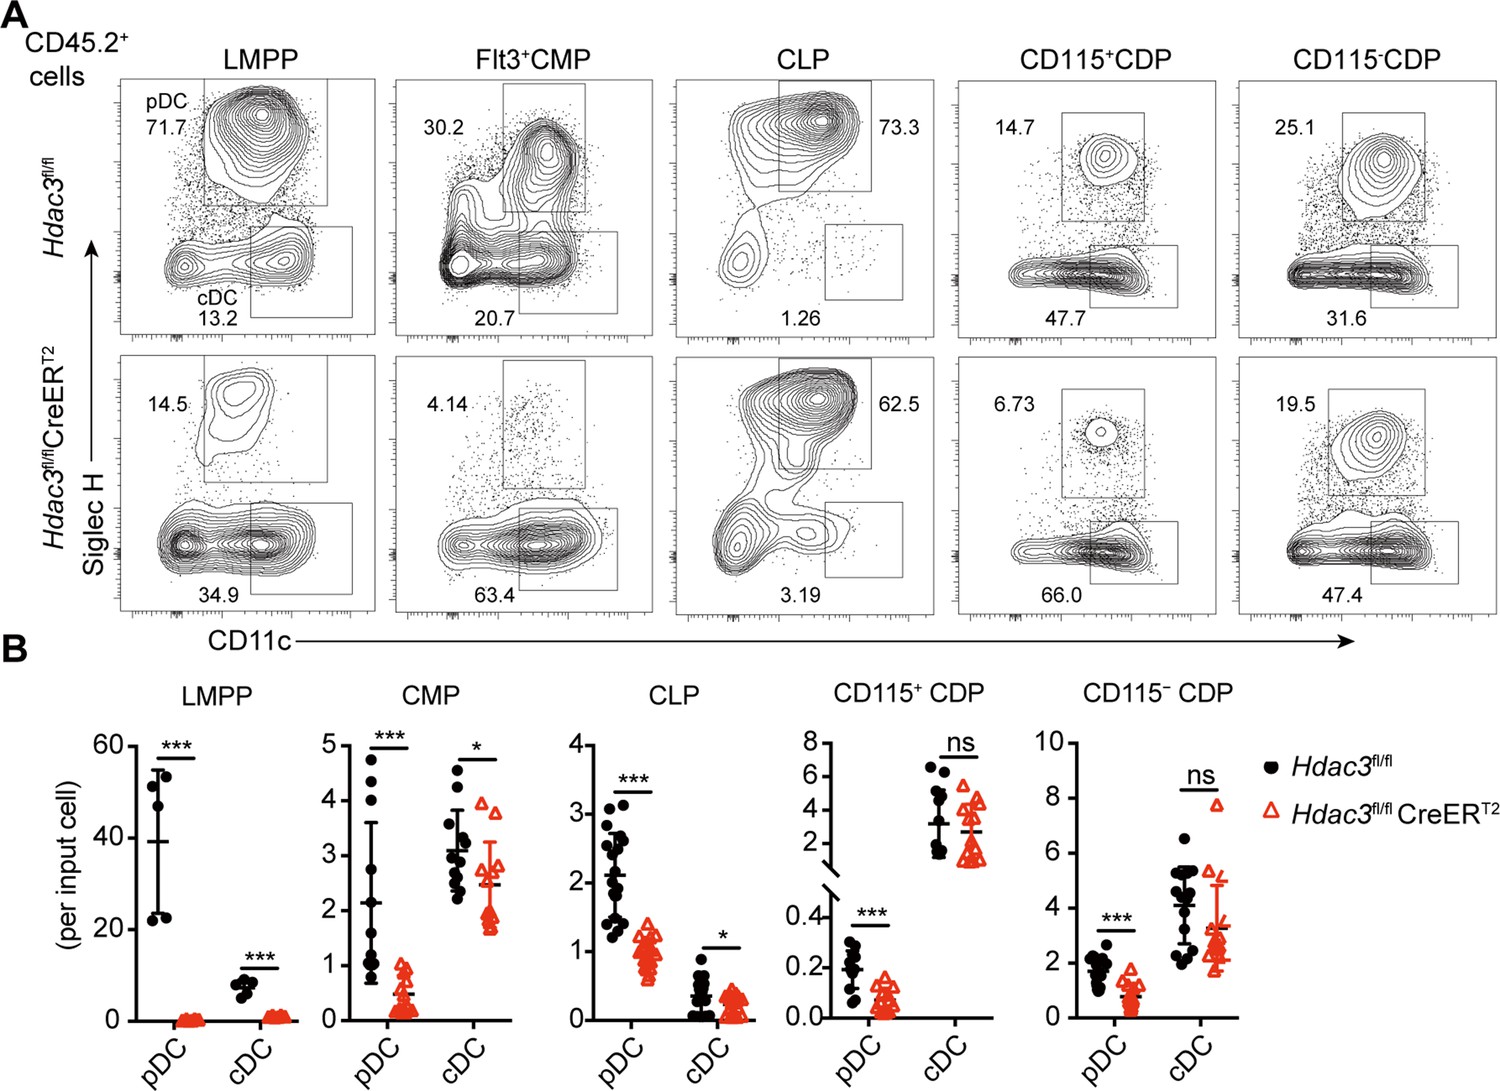
The development of pDCs from BM progenitors required HDAC3.
The progenitor populations Flt3+ HSCs, Flt3+ CMPs, CLPs, and CDPs, were isolated from BM of Hdac3fl/fl or Hdac3fl/fl CreERT2 mice, and cocultured with CD45.1 BM feeder cells in the presence of FLT3L with 1 μM 4OH-T. Representative flow cytometry profiles (A) and the number of DCs generated in each FLT3L stimulated culture per indicated input progenitor (B). Data were pooled from two to three independent experiments, and shown as mean ± SD. * p<0.05; ** p<0.01; *** p<0.001; **** p<0.0001, by two-tailed Student’s t-test.
Figure 5—figure supplement 1
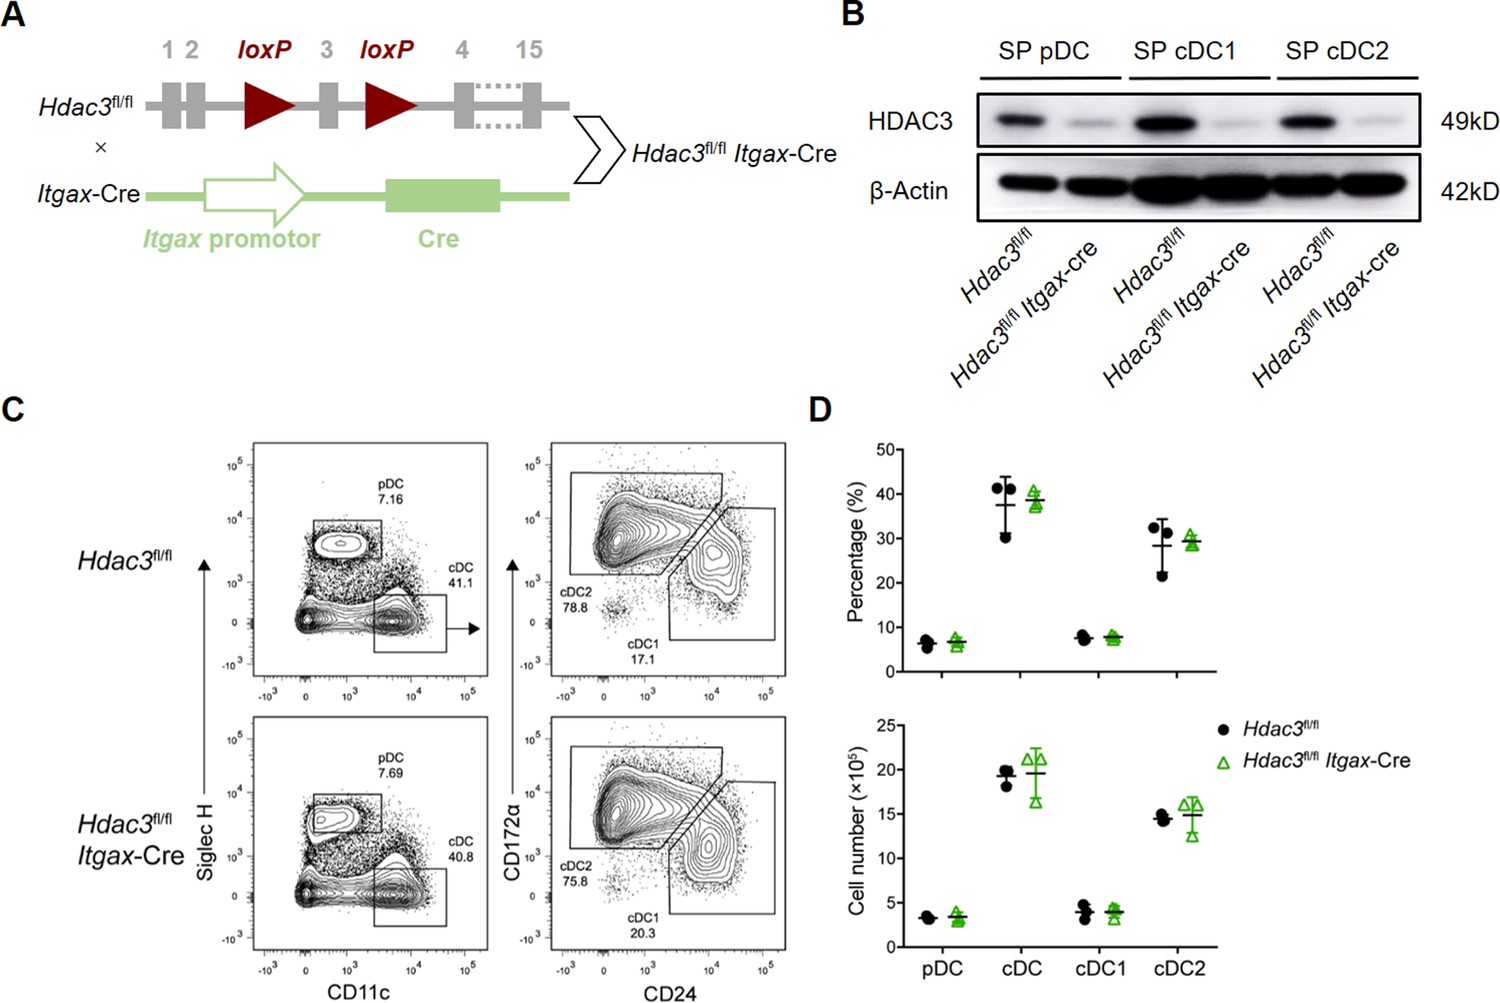
HDAC3 was dispensable for Terminal differentiation of DCs.
(A) Schematic representation of the generation of Hdac3fl/fl Itgax-Cre mice. (B) HDAC3 deletion efficiency determined by Western blot. (C–D) Representative flow cytometry profiles of splenic DC subsets (C) and the absolute numbers of each DC subset of Hdac3fl/fl and Hdac3fl/fl Itgax-Cre mice (D). Results are from one experiment representative of three independent experiments with 3 mice per group (mean ± SD of 3 mice).
-
Figure 5—figure supplement 1—source data 1
Western blot of HDAC3 knockout efficiency in Itgax-Cre induce HDAC3 conditional knockout splenic DC subsets.
- https://cdn.elifesciences.org/articles/80477/elife-80477-fig5-figsupp1-data1-v4.zip
Figure 6
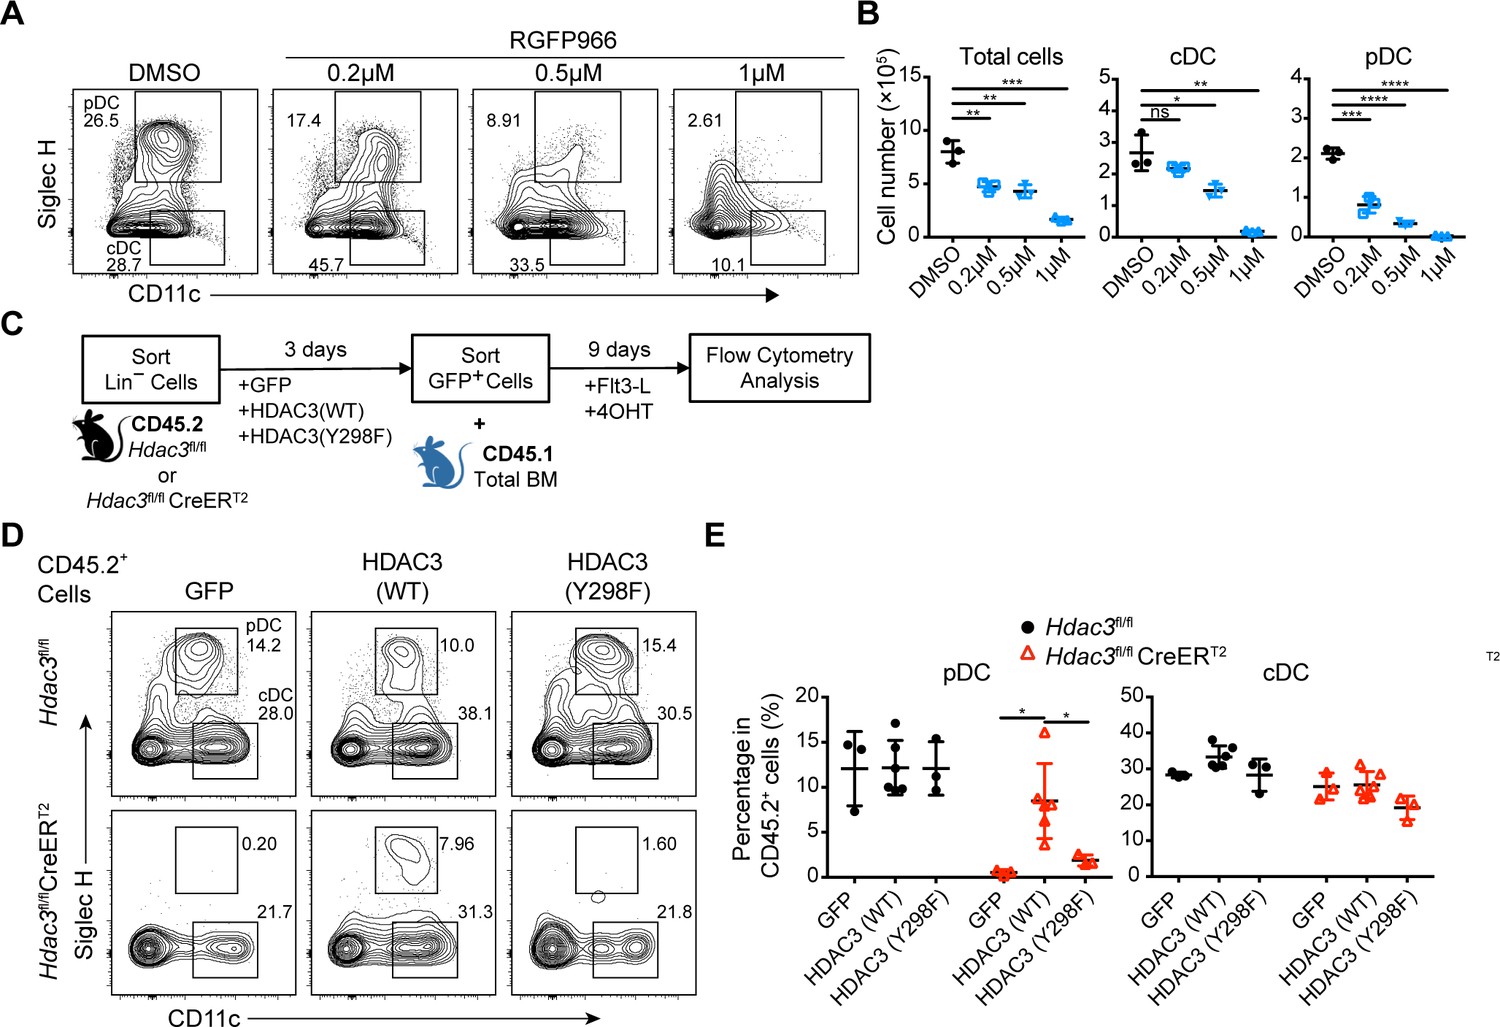
Deacetylase-dependent regulation of pDC development by HDAC3.
(A–B) Total BM cells were plated at 1.5×10⁶ cells/ml in the presence of 200 ng/ml FLT3L and indicated concentration of RGFP966, a selective HDAC3 inhibitor. Representative flow cytometry profiles (A), and the absolute number of total cells, pDC and cDC (B) generated in FLT3L stimulated BM cultures on day 9. Results are representative of at least 2 independent experiments with 3 mice per group. (C) BM Lin− cells were transfected with empty (GFP), HDAC3-GFP (WT) and deacetylase-inactivated HDAC3-GFP (indicated as HDAC3(Y298F)) and cultured in the presence of FLT3L for 9 days. (D–E) Representative flow cytometry profiles (D), the percentage (E) of DCs generated in FLT3L stimulated cultures from retrovirus-transfected CD45.2+ BM Lin− cells. Results are representative of at least two independent experiments with 3–6 duplicated wells per group. Data are shown as mean ± SD. * p<0.05; ** p<0.01; *** p<0.001; **** p<0.0001, by two-tailed Student’s t-test.
Figure 7 with 2 supplements
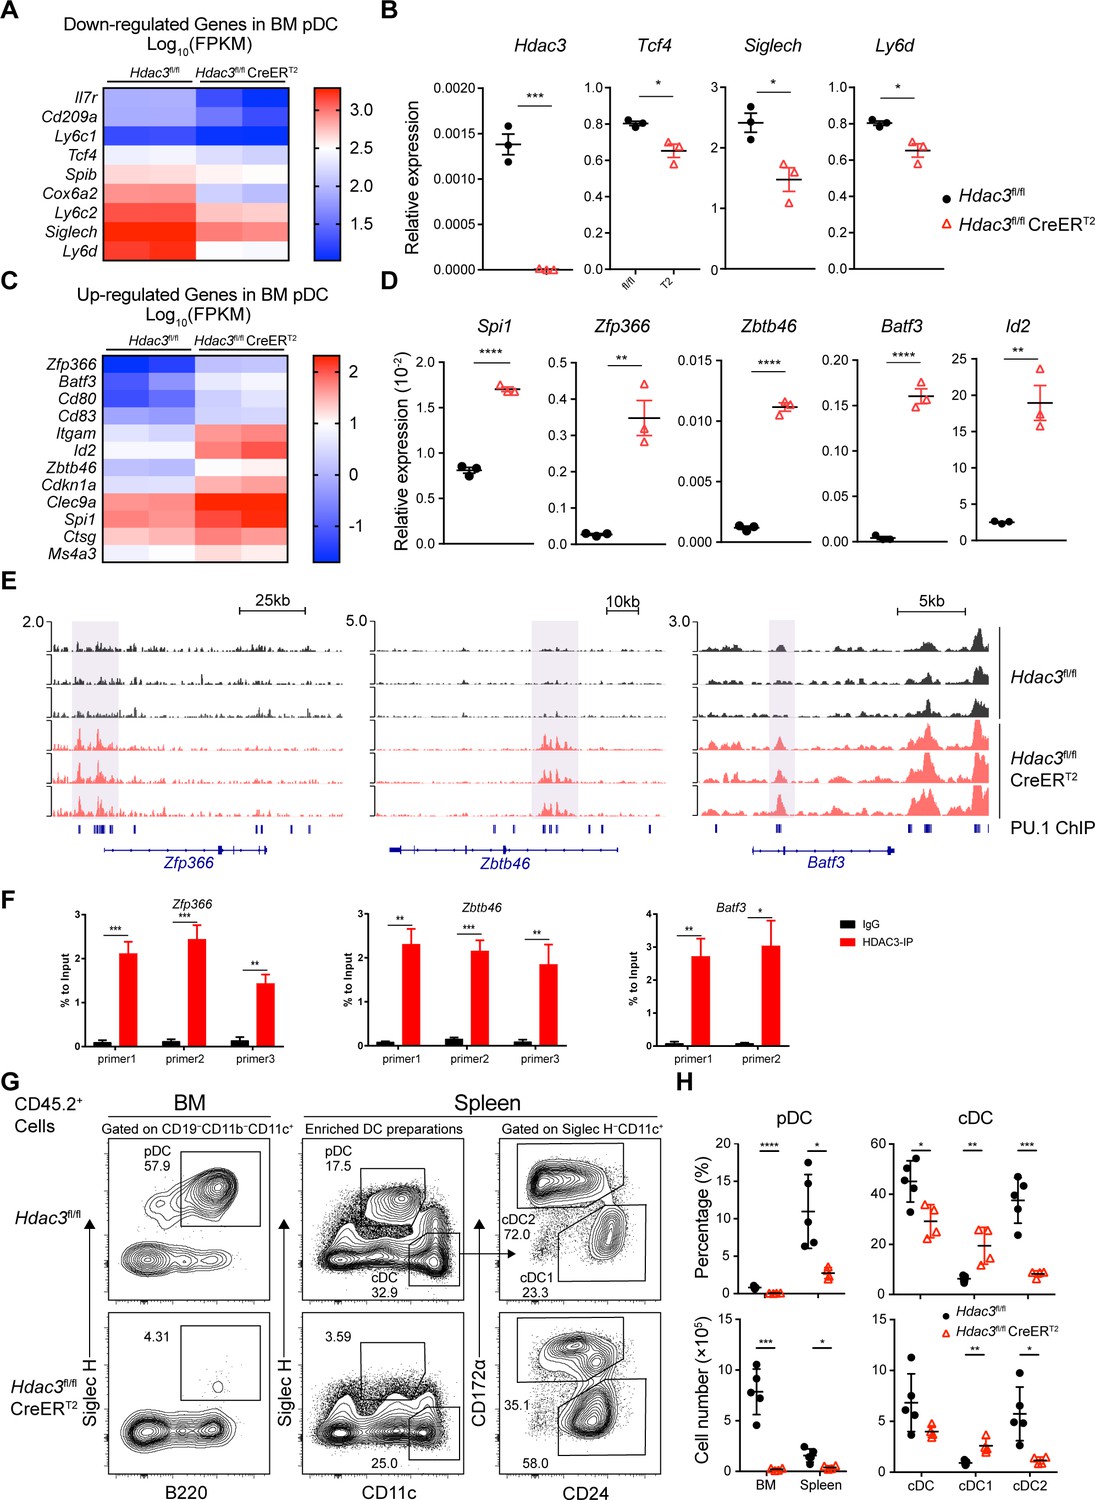
HDAC3 repressed H3K27ac around PU.1-binding sites at cDC genes loci.
(A–D) Up-regulated and down-regulated DEGs (Fold Change >2, q-value ≤0.05) in Hdac3-deficient BM pDCs compared with WT pDCs, determined by RNA-seq analysis (A, C) and confirmed by qRT-PCR (B, D). (E) Sequencing tracks of CUT&Tag analysis, with anti-H3K27ac antibody, of BM pDC sorted from Hdac3fl/fl and Hdac3fl/fl CreERT2 mice. Loci of cDC transcription factor Zfp366, Zbtb46, Batf3 are displayed. (F) ChIP-qPCR validation of HDAC3 binding sites in BM pDCs on Zfp366, Zbtb46, Batf3 loci identified in CUT&Tag analysis. Representative data of two independent experiments with similar pattern. (G–H) Lethally irradiated CD45.1 WT mice were reconstituted with BM alone from CD45.2 Hdac3fl/fl or Hdac3fl/fl CreERT2 mice. Eight weeks after reconstitution, Hdac3 deletion was induced by Tamoxifen and BM cells and splenocytes were analyzed after three weeks. Representative flow cytometry profiles of CD45.2+ BM pDCs and splenic DC subsets (G), the percentage of DC subsets among CD45.2+ cells and absolute cell number (H) in BM chimeric mice. The staining profiles of pDC and cDC subsets on gated CD45.2+CD11b−CD19−CD11c+ cells from the BM and CD45.2+ enriched DC preparations from the spleens are shown. Results are from one experiment representative of three independent experiments with four to five animals each group. Data are shown as mean ± SD. * p<0.05; ** p<0.01; *** p<0.001; **** p<0.0001, by two-tailed Student’s t-test.
Figure 7—figure supplement 1
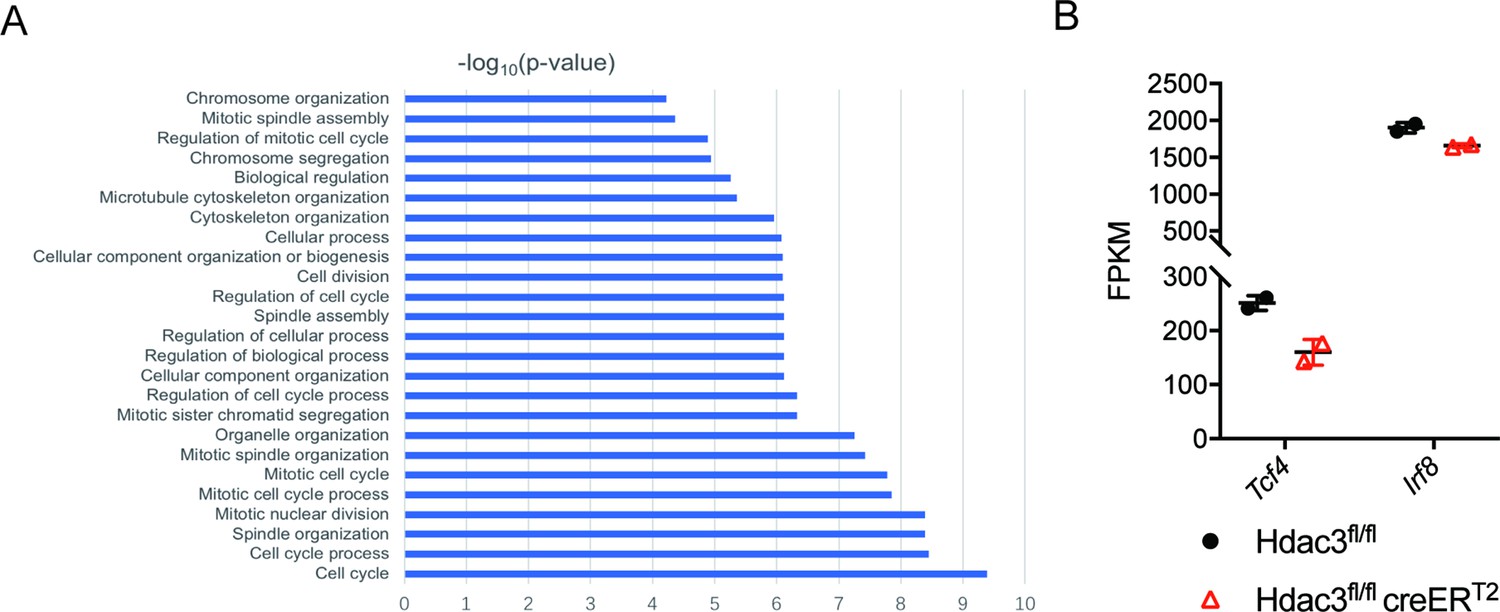
HDAC3 deficiency increased the cell-cycle related genes.
(A) Enrichment analysis of genes increased in Hdac3 deficient bone marrow pDCs. (B) Tcf4 and Irf8 expression in Hdac3 deficient BM pDCs revealed by RNA-seq analysis.
Figure 7—figure supplement 2
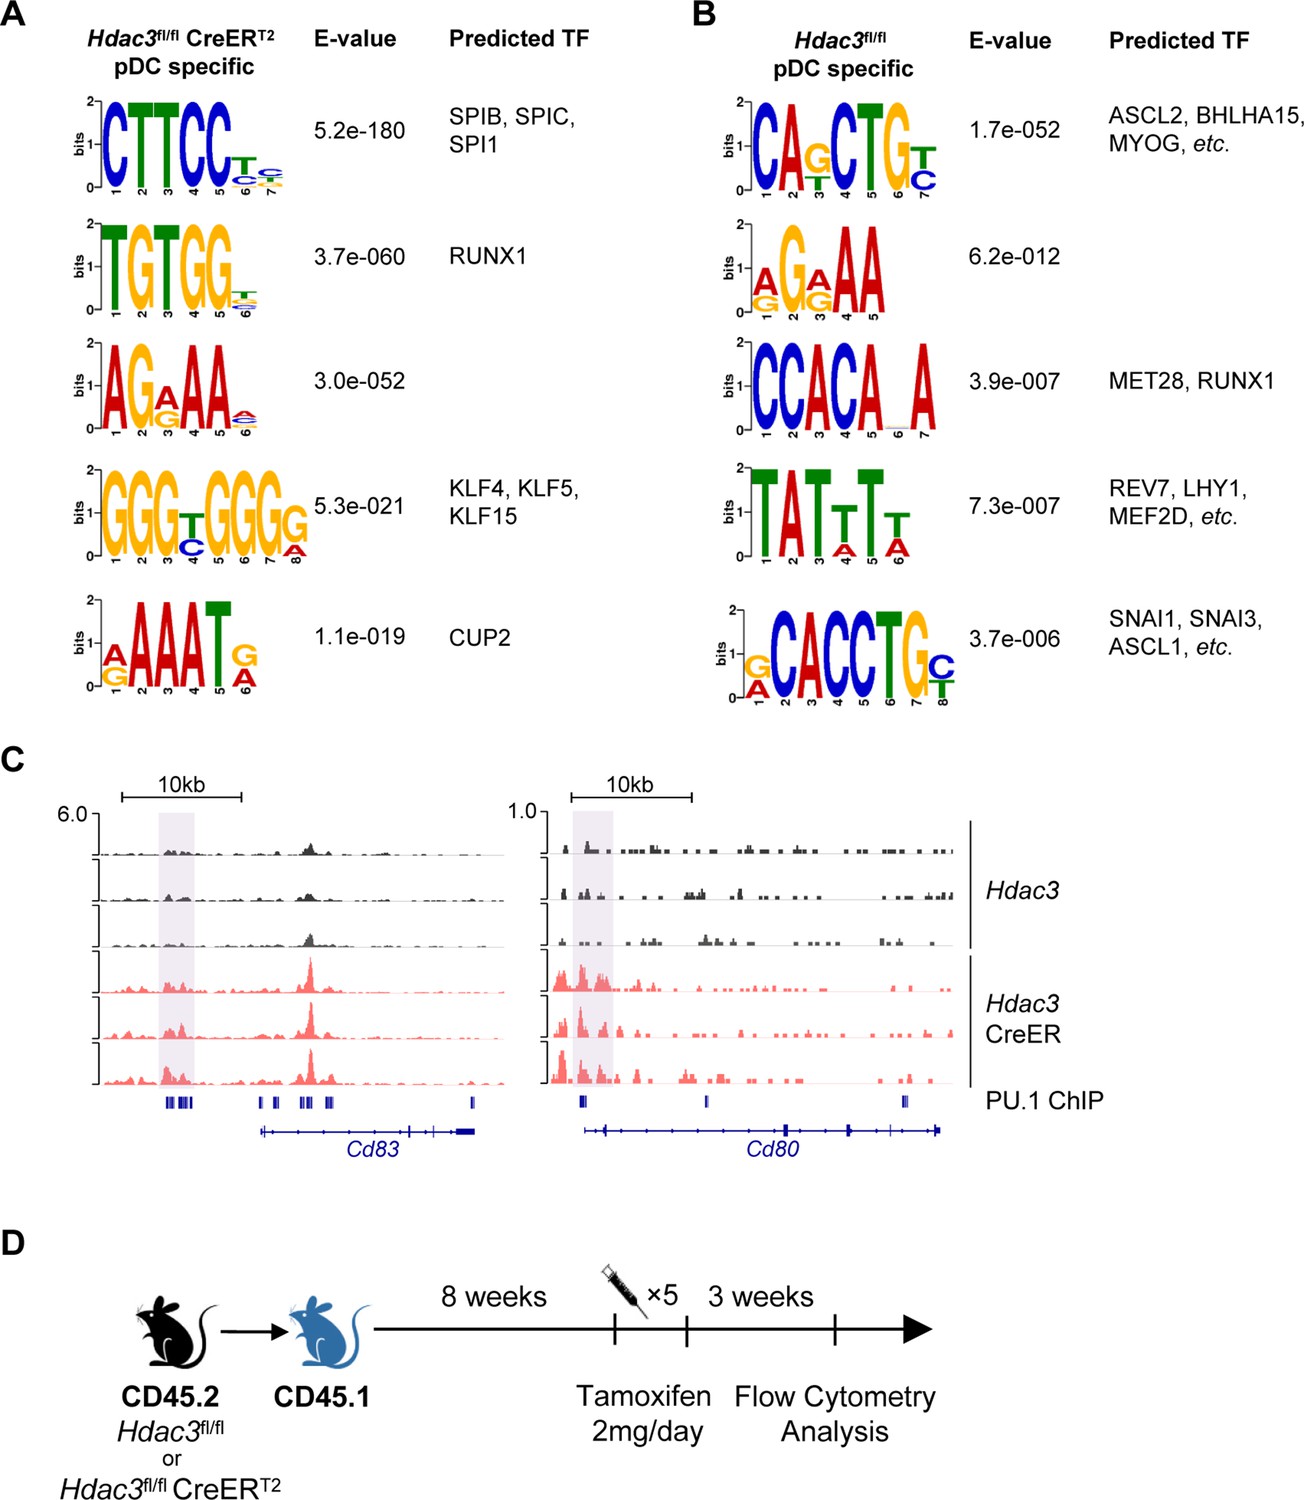
HDAC3 regulated H3K27ac around PU.1-binding sites at cDC genes loci.
(A and B) Identification of sequence motifs enriched in different H3K27ac regions in BM pDCs of Hdac3fl/fl (A) and Hdac3fl/fl CreERT2 (B) mice. Statistics were analyzed with DREME and Tomtom Top motifs are shown. (C) Sequencing tracks of CUT&Tag with anti-H3K27ac antibody of BM pDC sorted from Hdac3fl/fl and Hdac3fl/fl CreERT2 mice. Loci of cDC surface marker Cd83 and Cd80. (D) Schematic diagram of generation of BM chimeric mice. Total BM cells from Hdac3fl/fl and Hdac3fl/fl CreERT2 mice were transplanted into lethally irradiating CD45.1 WT mice. BM chimeric mice were injected with Tamoxifen to induce Hdac3-deletion in hematopoietic system and sacrificed 3 weeks after the last injection.
Tables
Table 1
Reagents.
| Antibody | Clone | Source |
|---|---|---|
| CD45 | 30-F11 | BioLegend |
| CD45.1 | A20 | BioLegend |
| CD45.2 | 104 | BioLegend |
| CD19 | EBio103 | eBioscience |
| B220 (CD45R) | RA3-6B2 | eBioscience |
| CD3ε | 145–2 c11 | eBioscience |
| CD4 | GK1.5 | eBioscience |
| CD8α | 53–6.7 | BioLegend |
| CD11b | M1/70 | eBioscience |
| CD11c | N418 | eBioscience |
| Siglec H | eBio440C | eBioscience |
| PDCA-1 (CD317) | 927 | BioLegend |
| XCR1 | ZET | BioLegend |
| CD205 | 205yekta | eBioscience |
| CD24 | M1/69 | BioLegend |
| CD127 (IL-7Rα) | A7R34 | BioLegend |
| CD117 (c-Kit) | ACK2 | BioLegend |
| CD115 (c-fms) | AFS98 | BioLegend |
| FLT3 (CD135) | A2F10 | eBioscience |
| Sca-1 (Ly-6A/E) | D7 | eBioscience |
| CD34 | RAM34 | eBioscience |
| CD16/32 | 93 | BioLegend |
Additional files
-
Supplementary file 1
Differentially expressed genes in Hdac3 deficient bone marrow pDCs.
Genes increased or decreased in Hdac3 deficient bone pDCs (fold change ≥2 and P-value ≤0.5).
- https://cdn.elifesciences.org/articles/80477/elife-80477-supp1-v4.xlsx
-
MDAR checklist
- https://cdn.elifesciences.org/articles/80477/elife-80477-mdarchecklist1-v4.pdf
Download links
A two-part list of links to download the article, or parts of the article, in various formats.
Downloads (link to download the article as PDF)
Open citations (links to open the citations from this article in various online reference manager services)
Cite this article (links to download the citations from this article in formats compatible with various reference manager tools)
Regulation of pDC fate determination by histone deacetylase 3
eLife 12:e80477.
https://doi.org/10.7554/eLife.80477


