Two novel, tightly linked, and rapidly evolving genes underlie Aedes aegypti mosquito reproductive resilience during drought
- Laboratory of Neurogenetics and Behavior, Rockefeller University, United States
- Howard Hughes Medical Institute, United States
- Laboratory of Evolutionary Genetics and Genomics, Rockefeller University, United States
- Kavli Neural Systems Institute, United States
- Proteomics Resource Center, Rockefeller University, United States
Figures
Figure 1 with 1 supplement
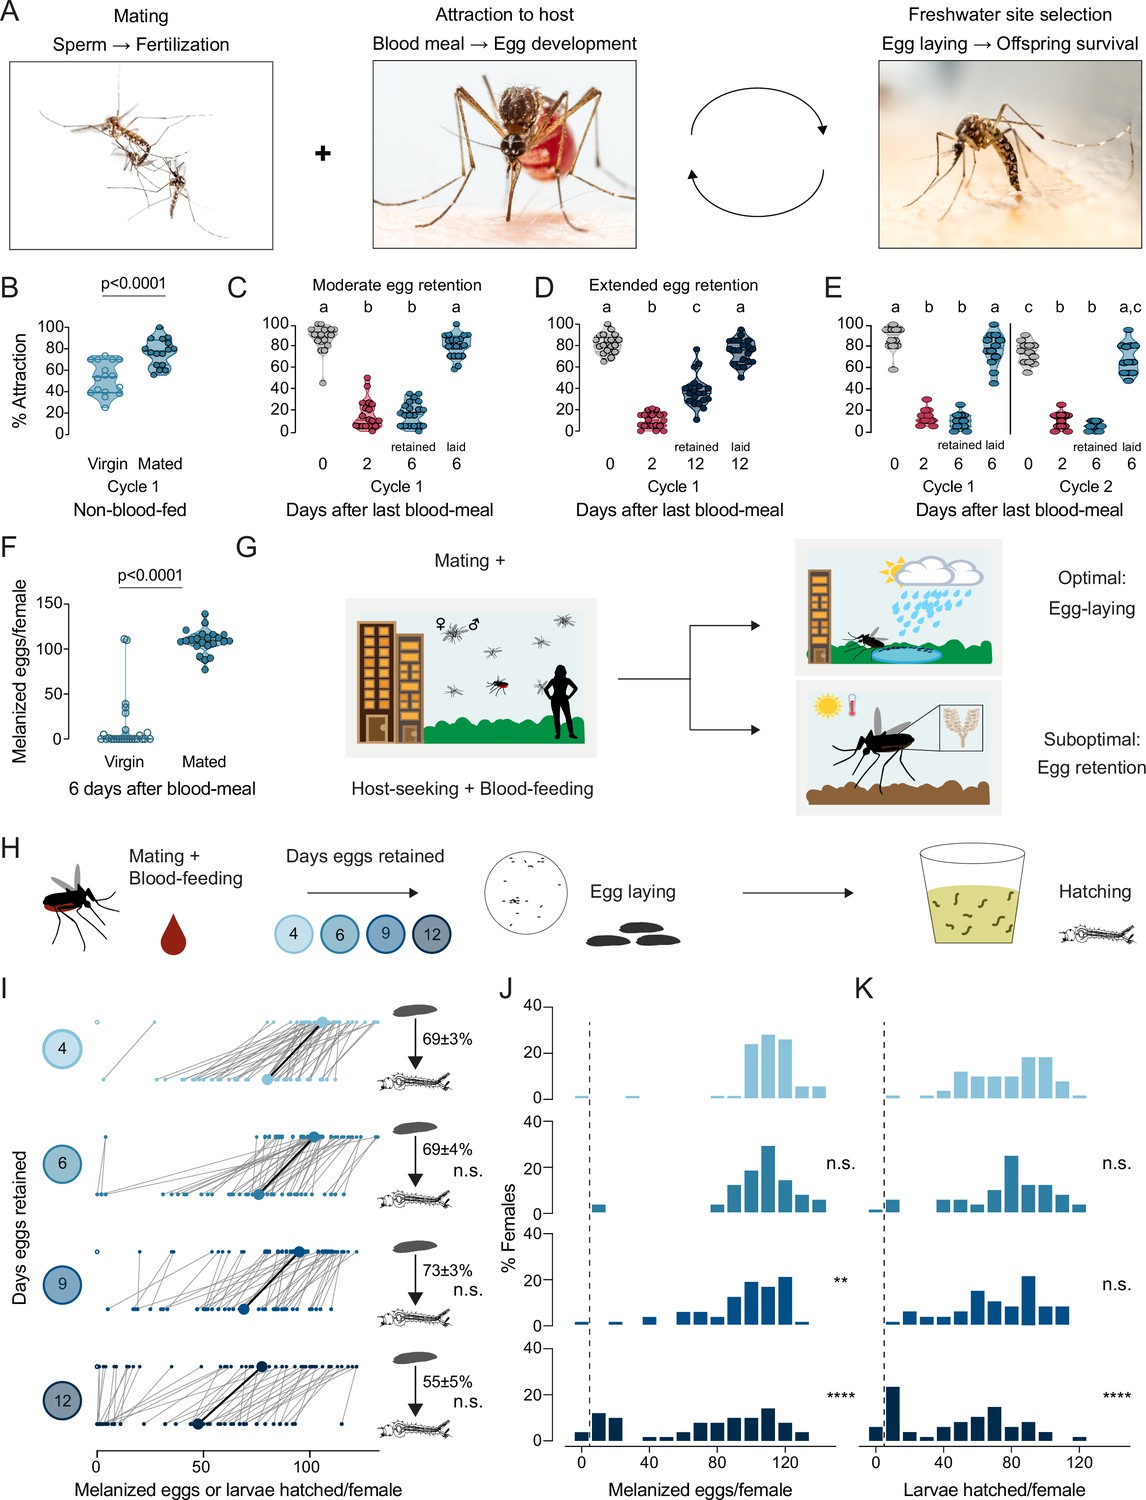
Aedes aegypti female reproduction is drought-resilient.
(A) Aedes aegypti male and female mating (left), female blood-feeding from a human host (center), and female laying eggs in water (right). (B–E) Attraction of wild type females to a human forearm at the indicated reproductive state and cycle. Females are mated for all host-seeking experiments except where specified in (B). Each point represents a single trial with ~20 females, n=12–20 trials/group. Data are plotted as violin plots with median and 1st/3rd quartiles and showing all data points. Data labeled with different letters are significantly different: (B) Unpaired t-test, p<0.0001. (C) Kruskal-Wallis, Dunn’s multiple comparisons test, p<0.05. (D, E) one-way ANOVA, Tukey’s multiple comparisons test, p<0.05. (F) Number of melanized eggs laid by mated or virgin females. Data points from single females, n=22–26 females/group, shown as a violin plot with median and 1st/3rd quartiles with all data points. Mann-Whitney test, p<0.0001. (G) Schematic of a female mosquito’s reproductive decision point after egg maturation under optimal and suboptimal egg-laying conditions of freshwater abundance and scarcity, respectively. (H) Schematic of experiment to test effect of egg retention on melanized egg laying and larval hatching. (I) Number of melanized eggs laid (top) and larvae hatched (bottom) by single females that experienced the indicated egg retention periods. Females laying no melanized eggs are depicted by open circles. Lines connect melanized eggs and hatched larvae from the same individual. Larger circles and bold lines represent medians. Numbers at right show hatching rate (mean ± S.E.M) from each egg retention group, n=46–50 females/group. (J, K) Distribution of melanized eggs (J) and larvae hatched (K) after the indicated length of egg retention, analyzed from data in (I). Zero values are binned separately for each group. All other bins are groups of 10 starting with [1-10] and with closed/inclusive intervals. The groups for number of melanized eggs (J), number of larvae hatched (K), and % hatched (I, numbers), respectively, at 6-, 9-, and 12 days post-blood-meal are compared to 4 days post-blood-meal to determine significant difference (Kruskal-Wallis, Dunn’s multiple comparison test; n.s.: not significant, p>0.05; **p<0.01; ****p<0.0001). Mosquito photographs (A): Alex Wild.
Figure 1—figure supplement 1
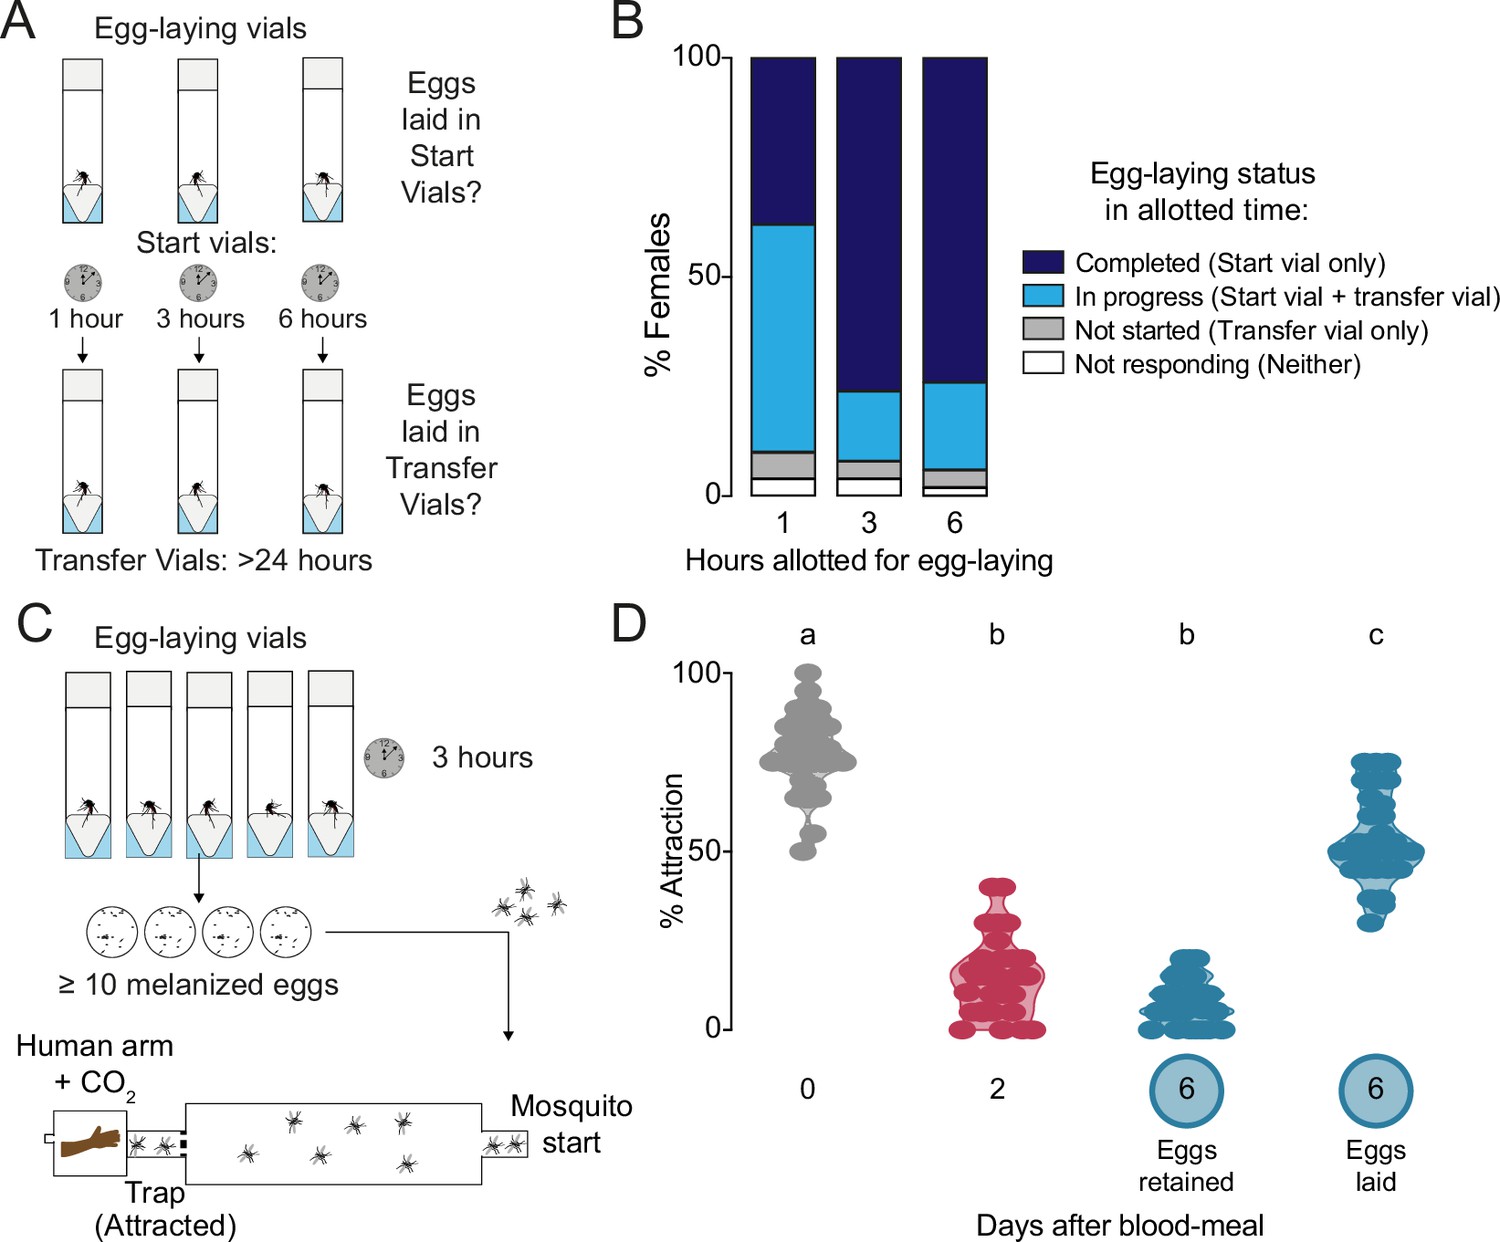
Timing of egg-laying and return to human host seeking.
(A) Assay schematic to determine the length of time taken for individual wild type females to complete egg laying. (B) Temporal dynamics of egg-laying (n=50 females/time-point) according to criteria indicated in legend at right. (C) Cartoon of independent assay to verify and collect females that have restored attraction to humans as soon after egg-laying as possible for ovary RNA-sequencing, ovary proteomics, and hemolymph proteomics (Figure 2). Females were given 3 hr for egg-laying based on results in (B) and only females that had laid at least 10 melanized eggs – those presumed to have completed egg-laying – were chosen for subsequent testing of attraction to humans within an additional 2 hr using a long-range, live human stimulus olfactometer (Basrur et al., 2020). (D) Attraction of wild type females to a human forearm at indicated reproductive state. Violin plot with median and 1st/3rd quartiles and showing all data points. Each point represents a single trial with a group of ~20 female mosquitoes with n=30–31 replicates/group. Data labeled with different letters are significantly different (one-way ANOVA, Tukey’s multiple comparisons test, p<0.0001).
Figure 2
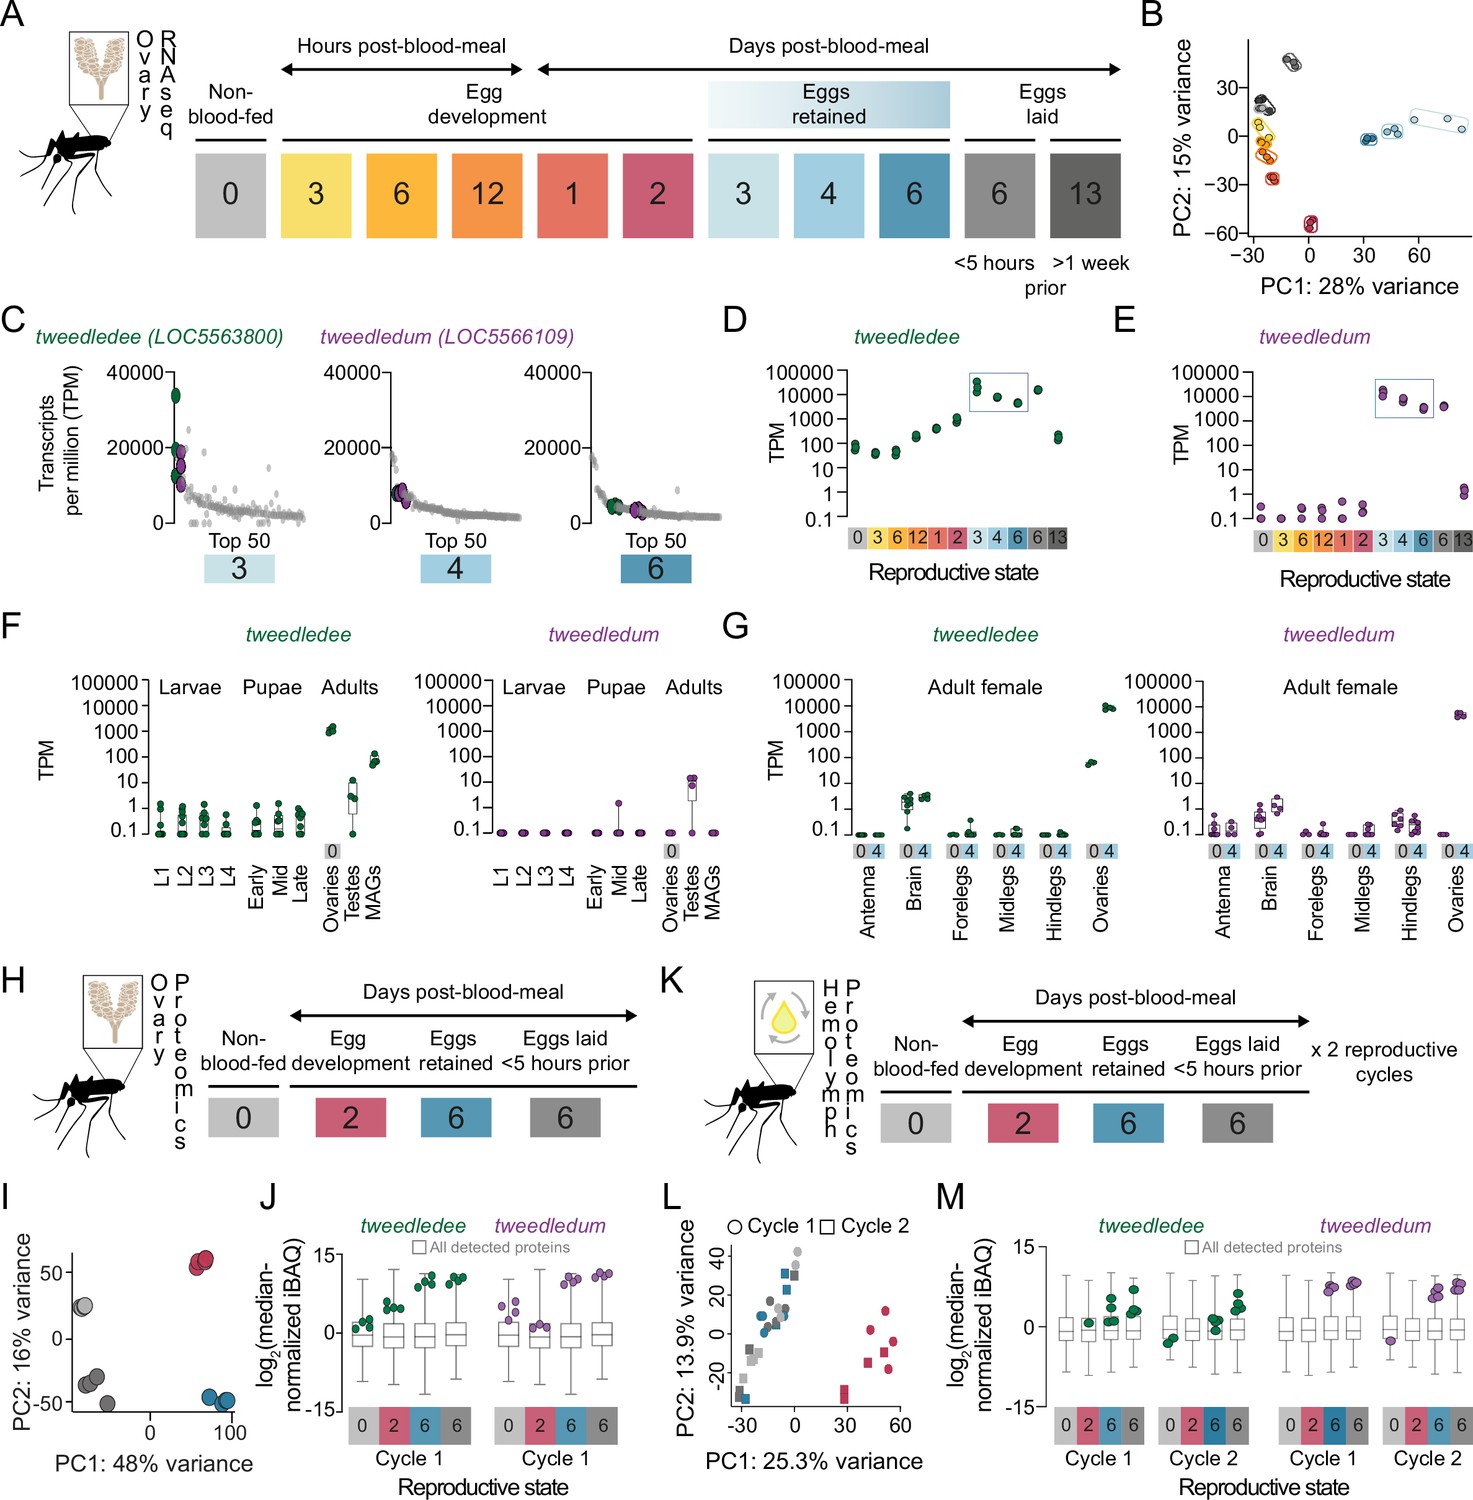
tweedledee and tweedledum are ovary-enriched and strongly upregulated during egg retention.
(A) Reproductive time-points sampled for bulk ovary RNA-sequencing (RNA-seq), n=3 replicates/group, 11 groups. (B) Principal component analysis (PCA) of DESeq2-normalized, transformed counts from ovary RNA-seq. (C) Top 50 most abundant transcripts ranked by median transcripts per million (TPM) for egg retention groups, 3-, 4-, and 6 days post-blood-meal (total = 150 transcripts). Gray dots represent replicates for each transcript in the top 50, green dots indicate tweedledee, and purple dots represent tweedledum. (D–E) Transcript expression pattern in the ovaries of tweedledee (D) and tweedledum (E). The blue rectangle indicates the period of egg retention. (F) TPM values for tweedledee (left) and tweedledum (right) during larval, pupal, and adult stages of development [data from Matthews et al., 2018], MAGs = male accessory glands, n=4–13 replicates/group. (G) TPM values for tweedledee (left) and tweedledum (right) in adult female tissues (data originally from Matthews et al., 2016), reanalyzed in Matthews et al., 2018, n=3–8 replicates/group. (H) Reproductive time-points sampled for ovary proteomics, n=4 replicates/group, 4 groups. (I) PCA of iBAQ values from ovary proteomics. (J) Distribution of iBAQ values as a metric of abundance for all proteins detected per group in ovary proteomics. Overlaid green dots represent individual replicate values for tweedledee and purple dots represent replicates for tweedledum. All values are pre-imputation and represent log2-transformed median iBAQ signals normalized by subtracting the median iBAQ signal for the group. (K) Reproductive time-points sampled for hemolymph proteomics, n=4 replicates/group, 8 groups. (L) PCA of iBAQ values from hemolymph proteomics. (M) Distribution of iBAQ values as a metric of abundance for all proteins detected per group in hemolymph proteomics. Overlaid green dots represent individual replicate values for tweedledee and purple dots represent replicates for tweedledum. All values are pre-imputation and represent log2-transformed median iBAQ signals normalized by subtracting the median iBAQ signal for the group. Box plots in F, G, J, M: median, 1st/3rd quartile, minimum to maximum whiskers.
Figure 3
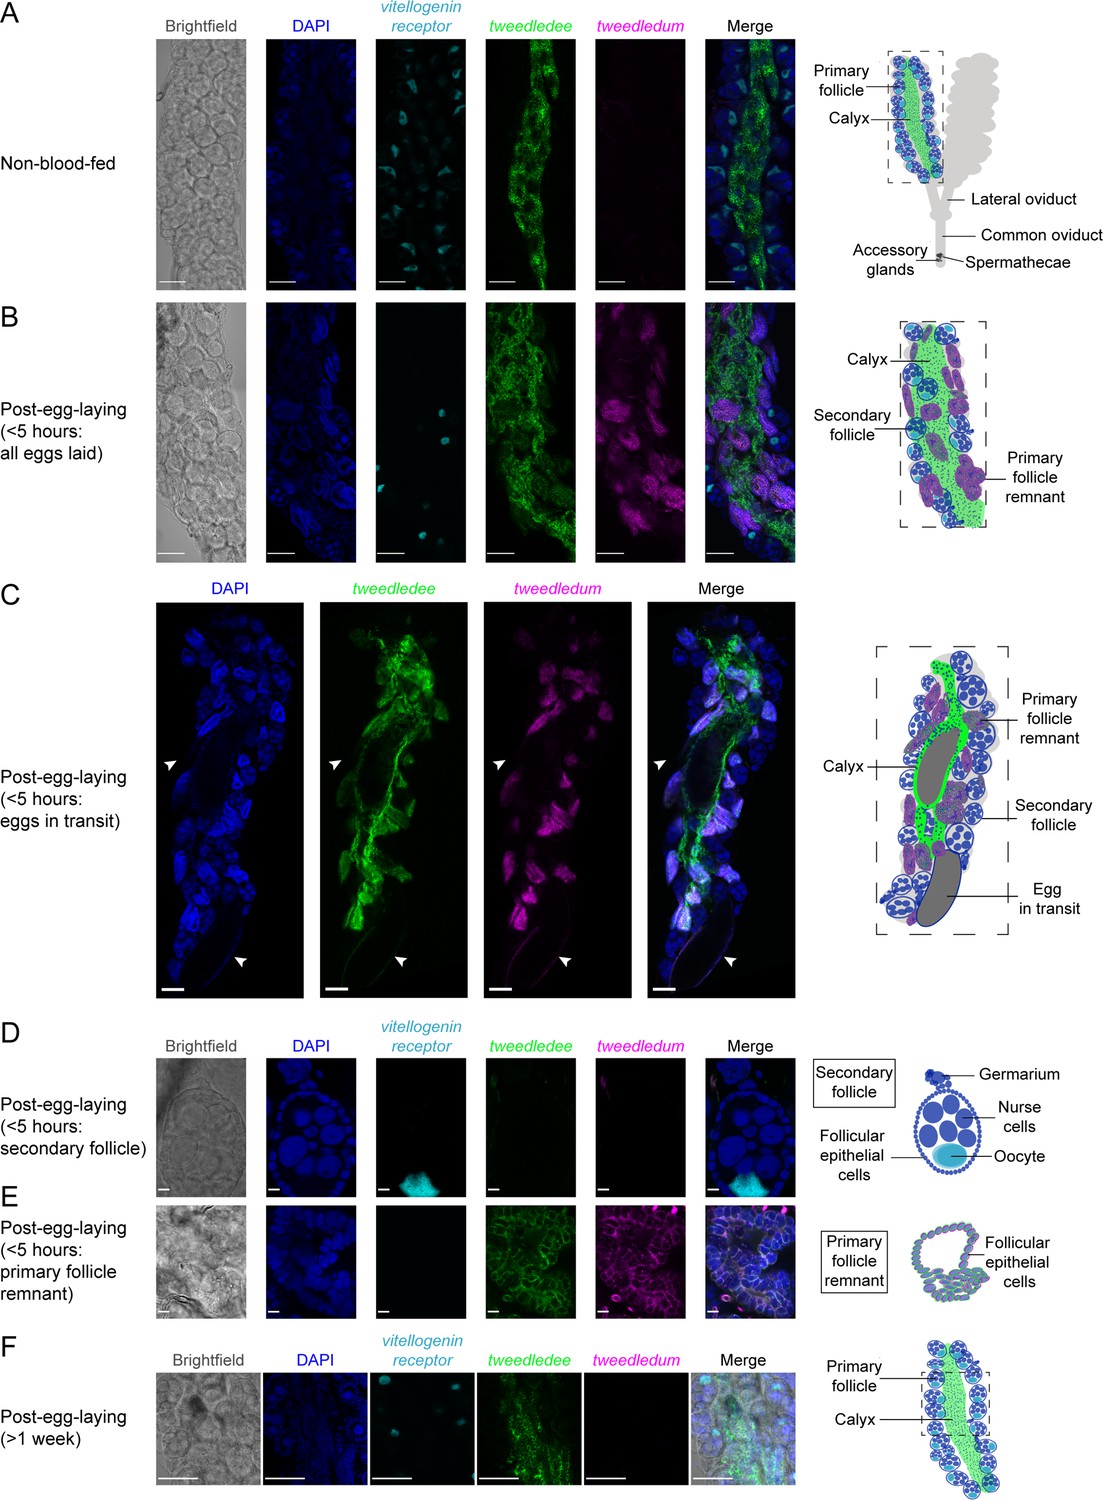
tweedledee and tweedledum are expressed in cells encapsulating mature eggs.
(A) Left: Single confocal section of whole-mount fluorescence RNA in situ hybridization of a non-blood-fed ovary with the indicated probes. Right: cartoon of a pair of ovaries and the female reproductive system, with left ovary representing a cross-section of one ovary. (B, C) Left: Single confocal section of whole-mount fluorescence RNA in situ hybridization of an ovary <5 hr post-egg-laying with all eggs laid (B) or with two eggs in transit indicated by white arrows (C) with the indicated probes. Right: cartoons representing cross-section through a post-egg-laying ovary with probe expression patterns depicted in different ovary structures. (D, E) Left: Single confocal section of whole-mount fluorescence RNA in situ hybridization of an ovary <5 hr post-egg-laying with the indicated probes showing a secondary follicle ready to develop into an egg upon consumption of a second blood meal (D) and a post-egg-laying follicle that is the remnant of a primary follicle which previously contained an egg (E). Right: cartoons depicting tweedledee and tweedledum expression pattern uniquely in the post-egg-laying follicle/primary follicle remnant (E), but not in the secondary follicle expressing vitellogenin receptor (D). (F) Left: Single confocal section of whole-mount fluorescence RNA in situ hybridization of an ovary >1 week post-egg-laying with the indicated probes. Right: cartoon of a single ovary cross-section. Scale bars: 100µm in A-C, F and 10 µm in D-E.
Figure 4
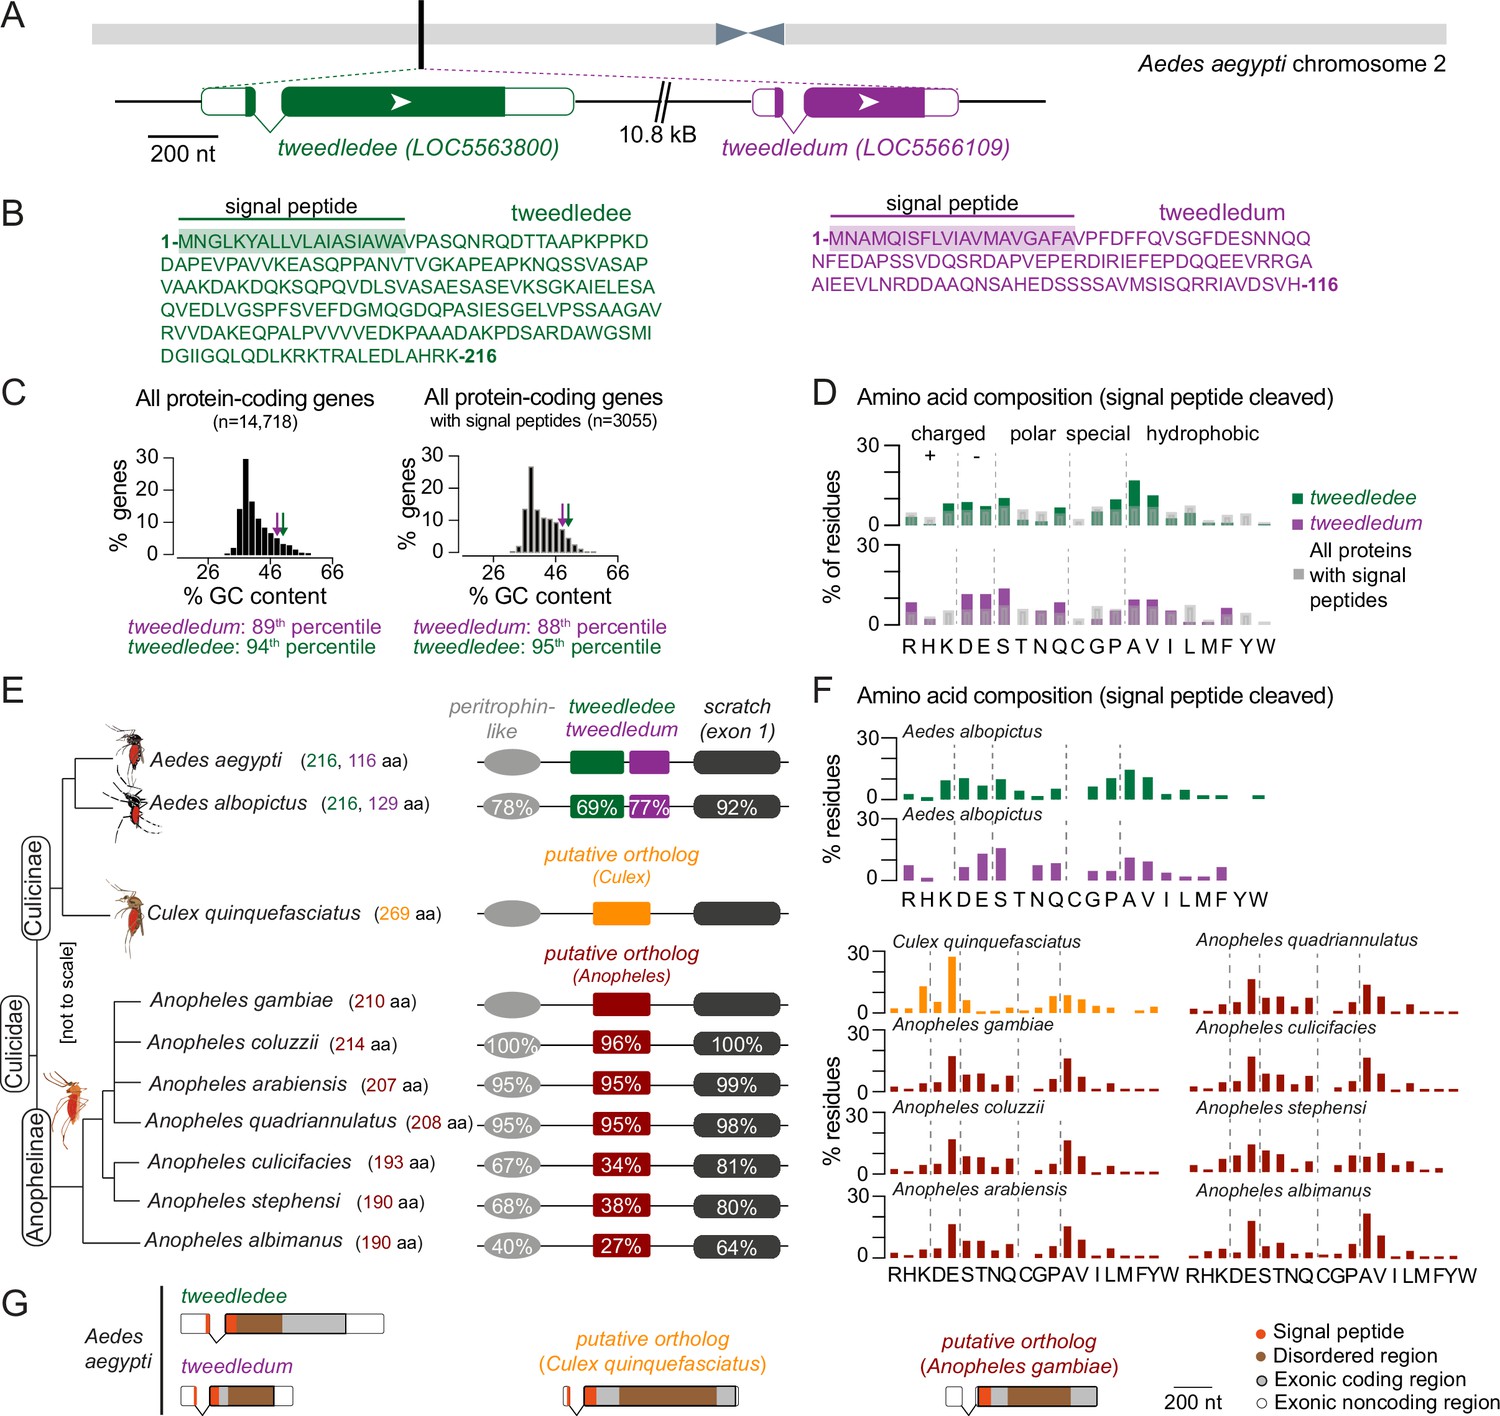
tweedledee and tweedledum are linked, taxon-restricted, syntenic, and rapidly evolving genes.
(A) Chromosomal location and gene structure of tweedledee and tweedledum. (B) Amino acid sequences of tweedledee (left) and tweedledum (right) with predicted N-terminal signal peptides indicated. (C) GC content of all protein-coding genes in the Aedes aegypti (AaegL5) genome (left) and of all protein-coding genes with predicted signal peptides (right), with tweedledee and tweedledum indicated by arrows. (D) Amino acid composition of Aedes aegypti tweedledee and tweedledum, as compared to mean percent residue for 3,040 proteins with predicted signal peptides in the Aedes aegypti genome, calculated after signal peptide cleavage. (E) Syntenic loci in Aedes, Culex, and Anopheles mosquito species are shown (not to scale), ordered by the topology of the mosquito phylogenetic tree. The protein length of tweedledee, tweedledum, or the putative ortholog is shown in parentheses next to the species name. Protein sequence identity is shown for each gene as calculated using a reference species for each genus, either Aedes aegypti or Anopheles gambiae. For scratch, protein sequence identity was calculated by aligning exon 1 of each species due to a fragmented annotation in multiple reference genomes (see Methods). Accession numbers for all genes are at https://doi.org/10.5281/zenodo.5945524. (F) Amino acid composition of tweedledee and tweedledum in Aedes albopictus and of the putative ortholog in Culex and Anopheles species. (G) Gene structures of Aedes aegypti tweedledee and tweedledum and the putative ortholog in Culex quinquefasciatus and Anopheles gambiae are shown to scale with signal peptide and disordered domains annotated. The 3’UTR of the Anopheles gambiae putative ortholog is lacking in the current genome annotation.
Figure 5 with 1 supplement

tweedledee and tweedledum are rapidly evolving and may be subject to climate variability-driven selective pressures.
(A) The distribution of dN/dS values for 8,030 protein-coding genes in Aedes aegypti (outgroup: Aedes albopictus) and 9,958 protein-coding genes in Anopheles gambiae (outgroup: Anopheles stephensi). tweedledee, tweedledum and the Anopheles gambiae putative ortholog are shown with arrows. (B) dN/dS values were calculated for a 102-nucleotide sliding window size of 34 nucleotides each with a 3 amino acid overlap across the coding sequence of Aedes aegypti tweedledee and tweedledum. Coding sequences were aligned to orthologs in Aedes albopictus. (C) Correlation test for 12 bioclimatic and 2 anthropological variables (total=14 ecological variables) calculated using all genetic variants. The distributions of 14,438 protein-coding genes in Aedes aegypti are plotted with Correlation Test calculated and plotted on the y-axis using the following formula: -log10(harmonic mean combined Pearson’s correlation p-value). Individual Pearson’s correlation for all genetic variants in all protein-coding genes were included in the calculation. Boxes show median and 1st/3rd quartiles. Red X indicates 90th percentile. Violin tails extend to show the entire range of data points. The positions of tweedledee (green) and tweedledum (purple) are indicated by arrows. (D, E) Permutation tests were conducted for tweedledee (D) and tweedledum (E). Genetic variants were randomly sampled from all protein-coding genes to simulate 10,000 genes with the same number of genetic variants as either tweedledee (358) or tweedledum (292). Boxes show median and 1st/3rd quartiles and whiskers extend to the 5th/95th percentiles. Significance was measured using p<0.05 (above the 95th percentile). Violin tails extend to show the entire range of data points. The positions of tweedledee (D) and tweedledum (E) are indicated by an arrow. Significance is indicated by arrow color (red: p<0.05; black: p>0.05). Violins with p<0.05 are shaded green for tweedledee (D) or purple for tweedledum (E).
Figure 5—figure supplement 1
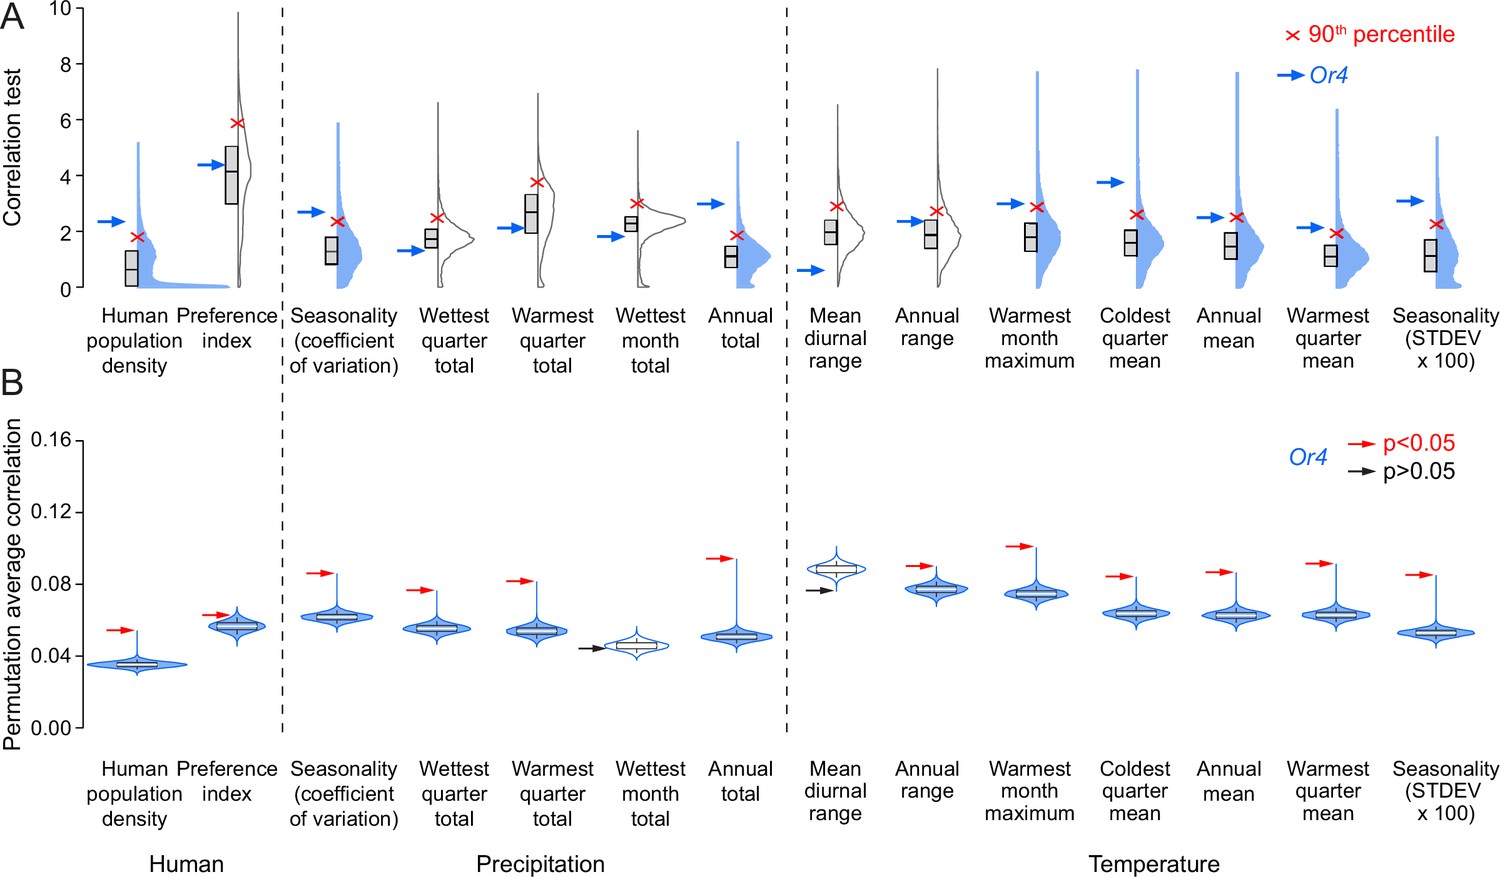
Or4 is significantly correlated with human-related and other ecological variables.
(A) Correlation test for 12 bioclimatic and 2 anthropological variables (total=14 ecological variables) calculated using all genetic variants. The distributions of 14,438 protein-coding genes in Aedes aegypti are plotted with Correlation Test calculated and plotted on the y-axis using the following formula: -log10(harmonic mean combined Pearson’s correlation p-value). Individual Pearson’s correlation for all genetic variants in all protein-coding genes were included in the calculation. Boxes: median and 1st/3rd quartiles; red X: 90th percentile; blue arrow: Or4. Violin tails extend to show the entire range of data points. Violins where Or4 is at or above the 90th percentile are shaded blue. (B) Permutation tests were conducted for Or4. Genetic variants were randomly sampled from all protein-coding genes to simulate 10,000 genes with the same number of genetic variants as Or4. Boxes: median and 1st/3rd quartiles and whiskers extend to the 5th/95th percentiles. Significance was measured using p<0.05 (above the 95th percentile). Violin tails extend to show the entire range of data points. The position of Or4 is indicated by an arrow, with significance corresponding to arrow color (red: p<0.05; black: p>0.05). Violins where Or4 p<0.05 are shaded blue.
Figure 6 with 2 supplements
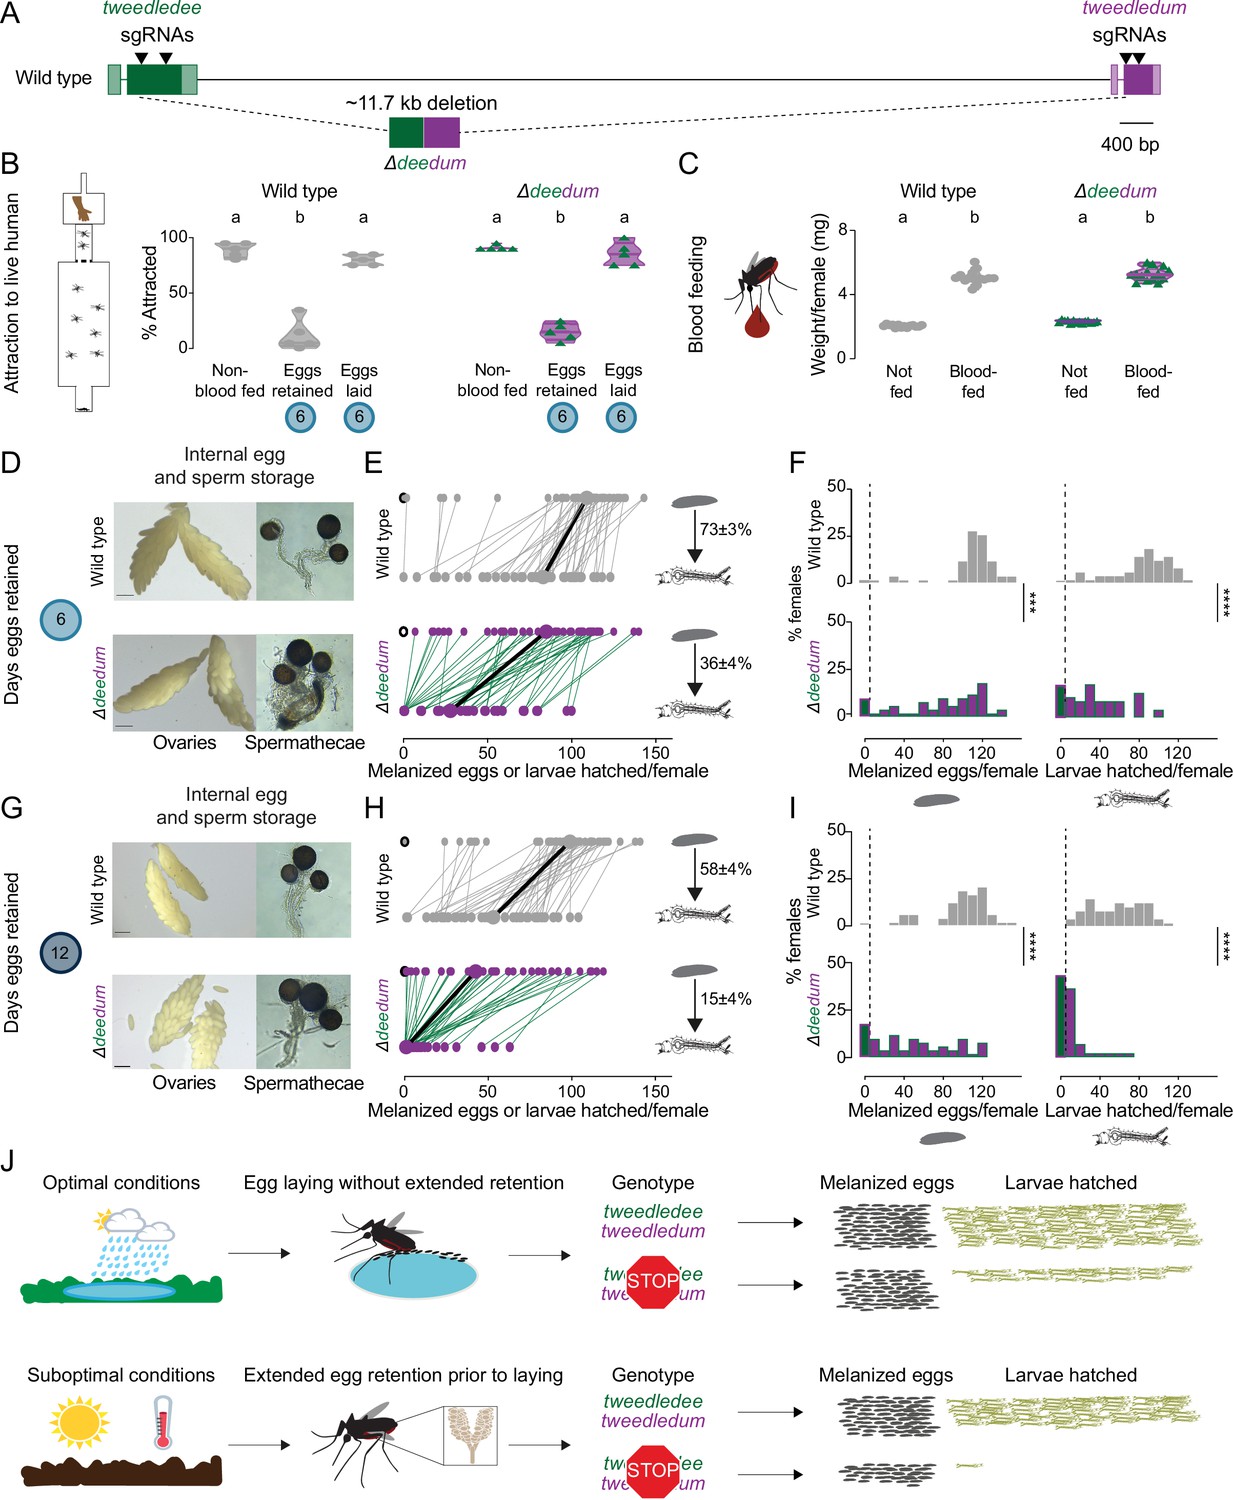
tweedledee and tweedledum are required for reproductive resilience during drought.
(A) Schematic of Δdeedum mutant that deletes both tweedledee and tweedledum. (B) Attraction of wild type and Δdeedum mutant females to a human forearm. Data are plotted as violin plots with median and 1st/3rd quartiles and showing all data points. Each point represents a single trial with ~20 females, n=5 trials/group. Significantly different groups are indicated by different letters (one-way ANOVA, Holm-Šídák’s multiple comparisons test, p<0.0001). (C) Averaged weights of 5 females of the indicated genotype not fed or blood fed, n=14 groups of 5 females per group. Data are plotted as violin plots with median and 1st/3rd quartiles and showing all data points. Significantly different groups are indicated by different letters (one-way ANOVA, Tukey’s multiple comparisons test, p<0.0001). (D, G) Photographs of ovaries (left, scale bars: 20 µm) and spermathecae with filled sperm (right) from wild type and Δdeedum females 6 days (D) or 12 days (G) post blood-meal with eggs retained. (E, H) Number of melanized eggs laid by (top) and larvae hatched from (bottom) single wild type and Δdeedum mutant females 6 days (E) and 12 days (H) post blood-meal, depicting moderate and extended egg retention, respectively. Females laying no melanized eggs are depicted by open circles. Lines connect melanized eggs laid by and larvae hatched from the same individual. Larger circles and bold lines represent medians. Numbers at right show hatching rate (mean ± S.E.M) from each egg retention group, n=48–50 females/ group. (F, I) Distribution of melanized eggs laid (left) and larvae hatched (right) after egg retention in wild type and Δdeedum mutant females 6 days (F) or 12 days (I) post-blood-meal. 0 values are binned separately for each group. All other bins are [1,10], [11,20] … [101,110], [111,120] where “[,]” denote closed/inclusive intervals. (F, I) The groups between each genotype for melanized eggs laid and larvae hatched respectively were compared at each of the time points to determine significant difference (Mann-Whitney tests, *** p<0.001; **** p<0.0001). Distributions in (F) are analyzed from data in (E) and distributions in (I) are analyzed from data in (H). (J) Summary of tweedledee and tweedledum function in drought resilience of female Aedes aegypti mosquitoes.
Figure 6—figure supplement 1
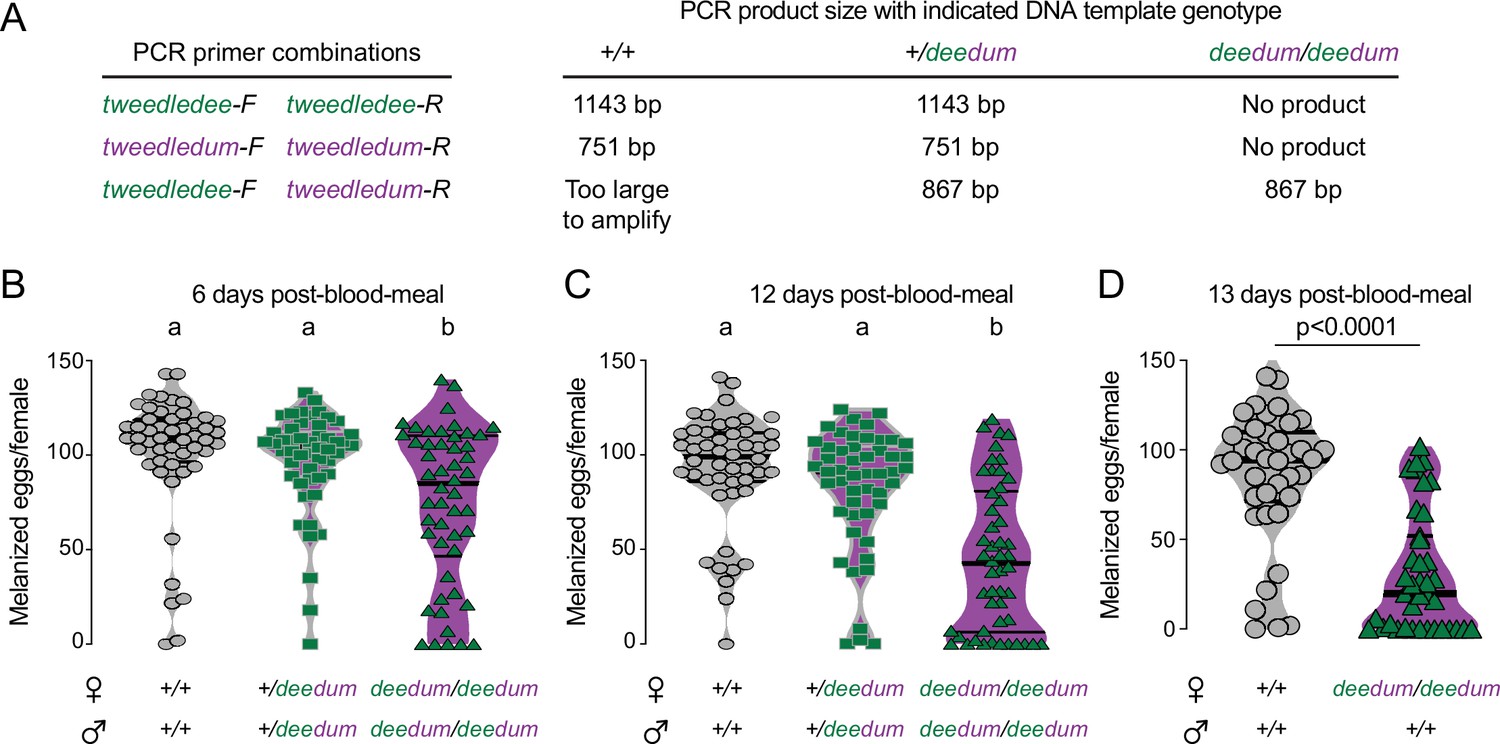
Δdeedum double mutant genotyping strategy and additional egg-laying data.
(A) Genotyping strategy for Δdeedum double mutants. Primer sequences are at https://doi.org/10.5281/zenodo.5945524. See Figure 6—figure supplement 1—source data 1 . (B–D) Melanized eggs laid by females of the indicated genotype 6 (B), 12 (C), or 13 (D) days post-blood-meal. The genotype of the males to which they were mated is indicated below the female genotypes. Data are plotted as violin plots with median and 1st/3rd quartiles and showing all data points. Each point represents the melanized eggs laid by a single female (B: n=50/genotype; C: n=48–50/genotype; D: n=38–39/genotype). In B,C, data labeled with different letters are significantly different (Kruskal-Wallis, Dunn’s multiple comparisons test, p<0.05). In D significance established by Mann-Whitney test, p<0.0001.
-
Figure 6—figure supplement 1—source data 1
Genotyping strategy for Δdeedum double mutants.
- https://cdn.elifesciences.org/articles/80489/elife-80489-fig6-figsupp1-data1-v2.xlsx
Figure 6—figure supplement 2
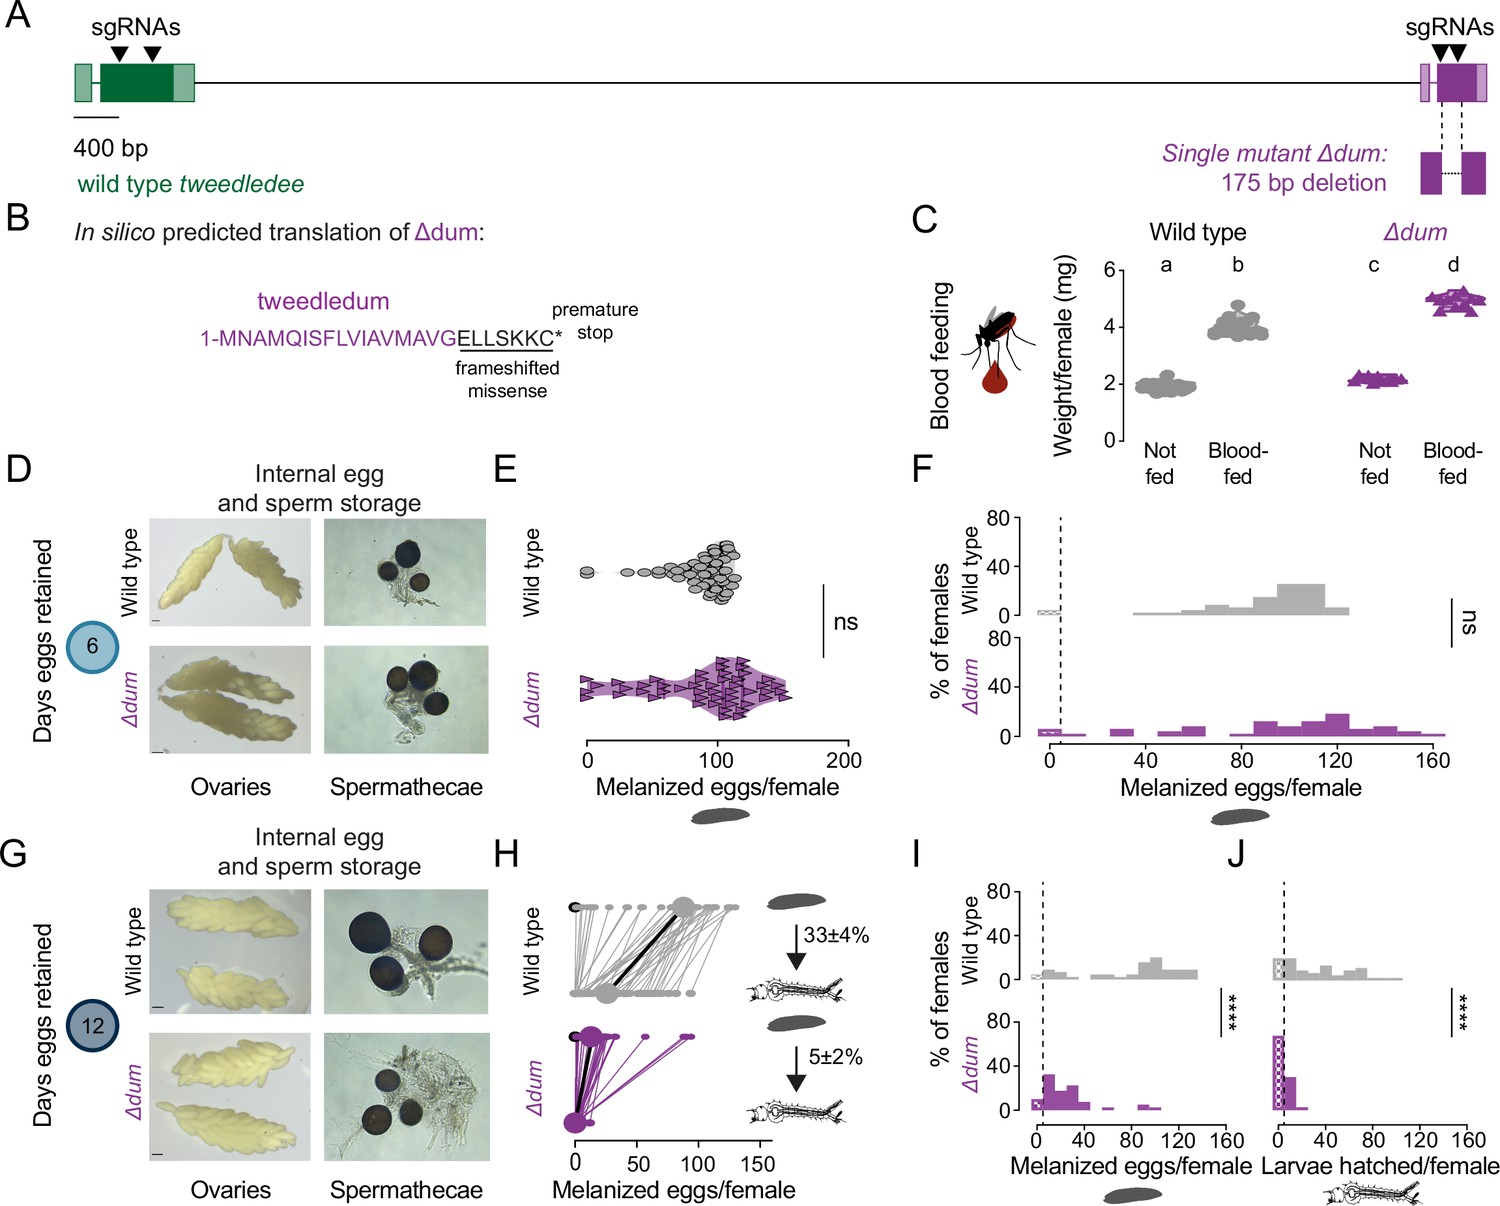
tweedledum mutants show defects in reproductive resilience during drought.
(A) Schematic of Δdum mutant that deletes tweedledum, but not tweedledee. (B) In silico predicted translation of Δdum. (C) Averaged weights of 5 females of the indicated genotype not fed or blood fed, n=11–16 groups of 5 females per group. Data are plotted as violin plots with median and 1st/3rd quartiles and showing all data points. Significantly different groups are indicated by different letters (one-way ANOVA, Tukey’s multiple comparisons test, p<0.05). (D, G) Photographs of ovaries (left, scale bars: 10 µm) and spermathecae with filled sperm (right) from wild type and Δdum females 6 days (D) or 12 days (G) post blood-meal with eggs retained. (E) Melanzied eggs laid by females of the indicated genotype 6 days post-blood-meal. Data are plotted as violin plots with median and 1st/3rd quartiles and showing all data points. Each point represents the melanized eggs laid by a single female (n=47–49/genotype). ns, not significant (Mann-Whitney test). (F, I, J) Distribution of melanized eggs laid by (F, I) or larvae hatched from (J) wild type and Δdum mutant females 6 days (F) and 12 days (I, J) post-blood-meal. 0 values are binned separately for each group. All other bins are [1,10], [11,20] … [141,150], [151,160] where “[,]” denote closed/inclusive intervals. (F, I, J) The groups between each genotype for melanized eggs laid and larvae hatched respectively were compared at each of the time points to determine significant difference (Mann-Whitney tests, **** p<0.0001). Distributions in (F) are analyzed from data in (E) and distributions in (I, J) are analyzed from data in (H). (H) Number of melanized eggs laid by (top) and larvae hatched from (bottom) single wild type and Δdum mutant females 12 days post blood-meal, depicting extended egg retention. Females laying no melanized eggs are depicted by open circles. Lines connect melanized eggs laid by and larvae hatched from the same individual. Larger circles and bold lines represent medians. Numbers at right show hatching rate (mean ± S.E.M) from each egg retention group, n=40–45 females/ group.
Additional files
Download links
A two-part list of links to download the article, or parts of the article, in various formats.
Downloads (link to download the article as PDF)
Open citations (links to open the citations from this article in various online reference manager services)
Cite this article (links to download the citations from this article in formats compatible with various reference manager tools)
Two novel, tightly linked, and rapidly evolving genes underlie Aedes aegypti mosquito reproductive resilience during drought
eLife 12:e80489.
https://doi.org/10.7554/eLife.80489


