Mother cells control daughter cell proliferation in intestinal organoids to minimize proliferation fluctuations
- AMOLF, Science Park, Netherlands
- Department of Molecular Pathology, Oncode Institute, Netherlands Cancer Institute, Netherlands
Figures
Figure 1 with 2 supplements
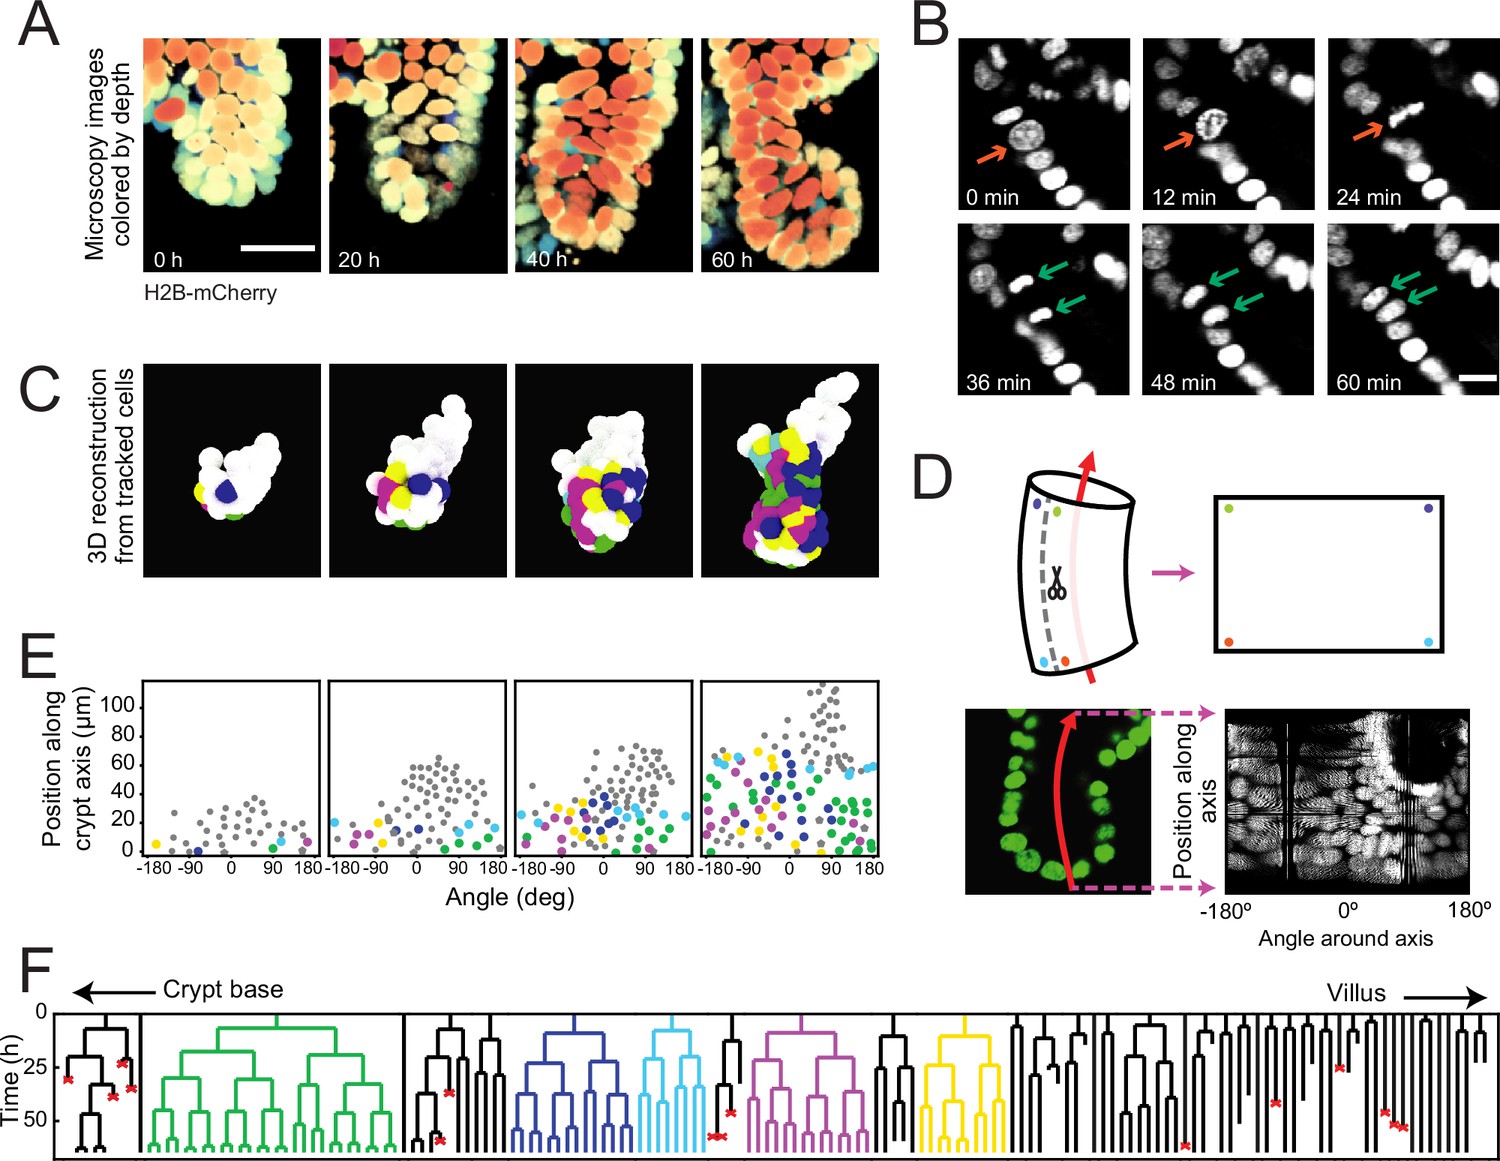
Time-lapse imaging and single-cell tracking of intestinal organoid crypts.
(A) Three-dimensional (3D) reconstruction of an organoid expressing an H2B-mCherry reporter to visualize individual nuclei. Shown here is the crypt region, with nuclei colored by their depth along the optical axis. Scale bar is 25 μm. (B) Snapshots of a cell division event in a crypt. Cell divisions are distinguished by the apical migration of the nucleus followed by chromosome condensation (red arrows). After mitosis, the nuclei of the two newly born cells are displaced basally (green arrows). Scale bar is 10 μm. (C) 3D reconstruction of a crypt growing in time using the positions of tracked nuclei. Colors represent cells that belong to the same lineage. (D) Illustration of crypt unwrapping. After the crypt-villus axis is annotated (red arrow), tracked cell positions are projected onto the surface of a bent cylinder. The cylinder is then unfolded, and its surface is mapped onto a two-dimensional plane defined by the distance along the axis and the angle around the axis. (E) Unwrapped representation of the crypt in (C), where colors represent the same lineages. (F) Lineage trees of cells within the crypt in (C) and colored accordingly. Cells in the initial time point are ordered according to their distance to the crypt base. Red crosses indicate cell deaths, and incomplete lines indicate cells that could not be accurately traced further due to insufficient fluorescence intensity or movement outside of the field of view.
Figure 1—figure supplement 1

Lineage trees of all tracked cells.
Lineage trees of cells tracked in nine different crypts. Cells in the initial time point are ordered according to their distance to the crypt base. Red crosses indicate cell deaths, and incomplete lines indicate cells that could not be accurately traced further due to insufficient fluorescence intensity or movement outside of the field of view.
Figure 1—video 1
Tracking cell position and lineage.
(Left) Three-dimensional (3D) reconstruction of an organoid expressing an H2B-mCherry reporter to visualize individual nuclei. Shown here is the crypt region, with nuclei colored by their depth along the optical axis. (Right) 3D reconstruction of a crypt growing in time using the positions of tracked nuclei. Colors represent cells that belong to the same lineage.
Figure 2 with 1 supplement
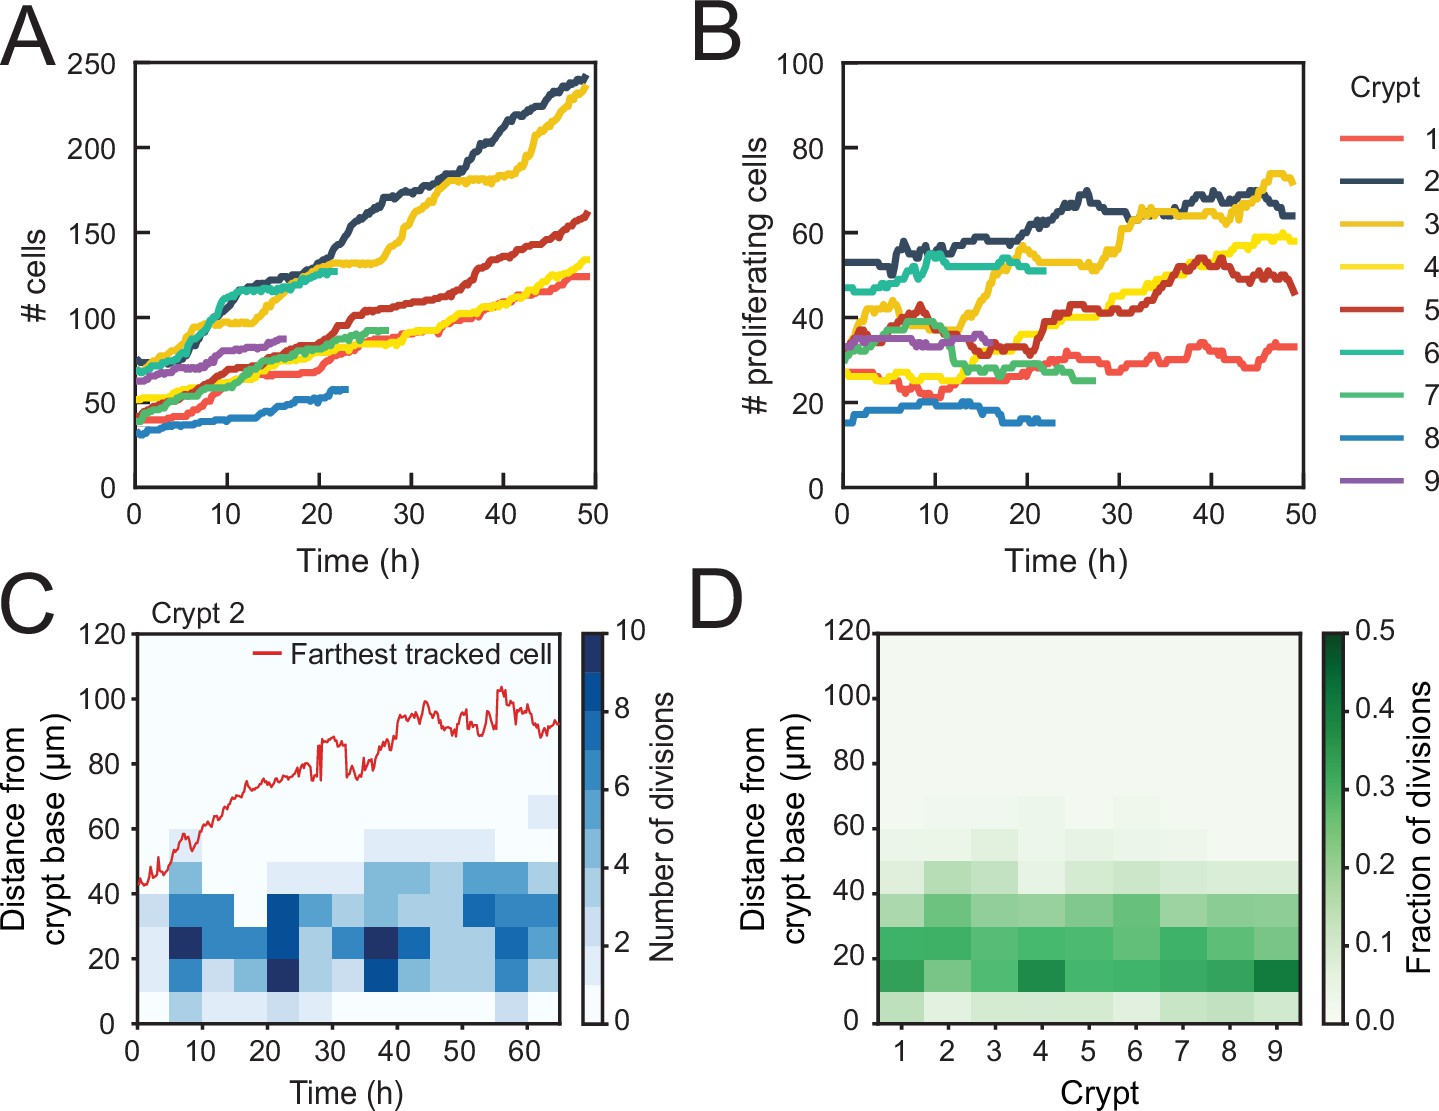
Control of cell divisions in intestinal organoids.
(A) Total number of cells born and (B) number of proliferating cells as a function of time for all cell lineages followed in nine tracked crypts. Cells that died were classified as non-proliferating. Note the different scales along the y-axis. Whereas total cell number increases, the number of proliferating cells remains approximately constant. The strongest increase in number of proliferating cells (~twofold) was seen in crypts 3 and 4. (C) Number of divisions that occurred at different positions along the crypt axis as a function of time in a single-tracked crypt. Red line corresponds to the position of the farthest tracked cell from the crypt base at every time point. Divisions occur in a compartment close to the crypt base, whose size remains constant over time. Apical displacement of the nuclei during mitosis results in few divisions occurring at less than 10 μm from the crypt base. (D) Fraction of divisions that occurred at different positions along the crypt axis for all tracked crypts, averaged over the full-time course. The size of the proliferative region is similar between crypts, despite differences in the total number of divisions.
Figure 2—figure supplement 1
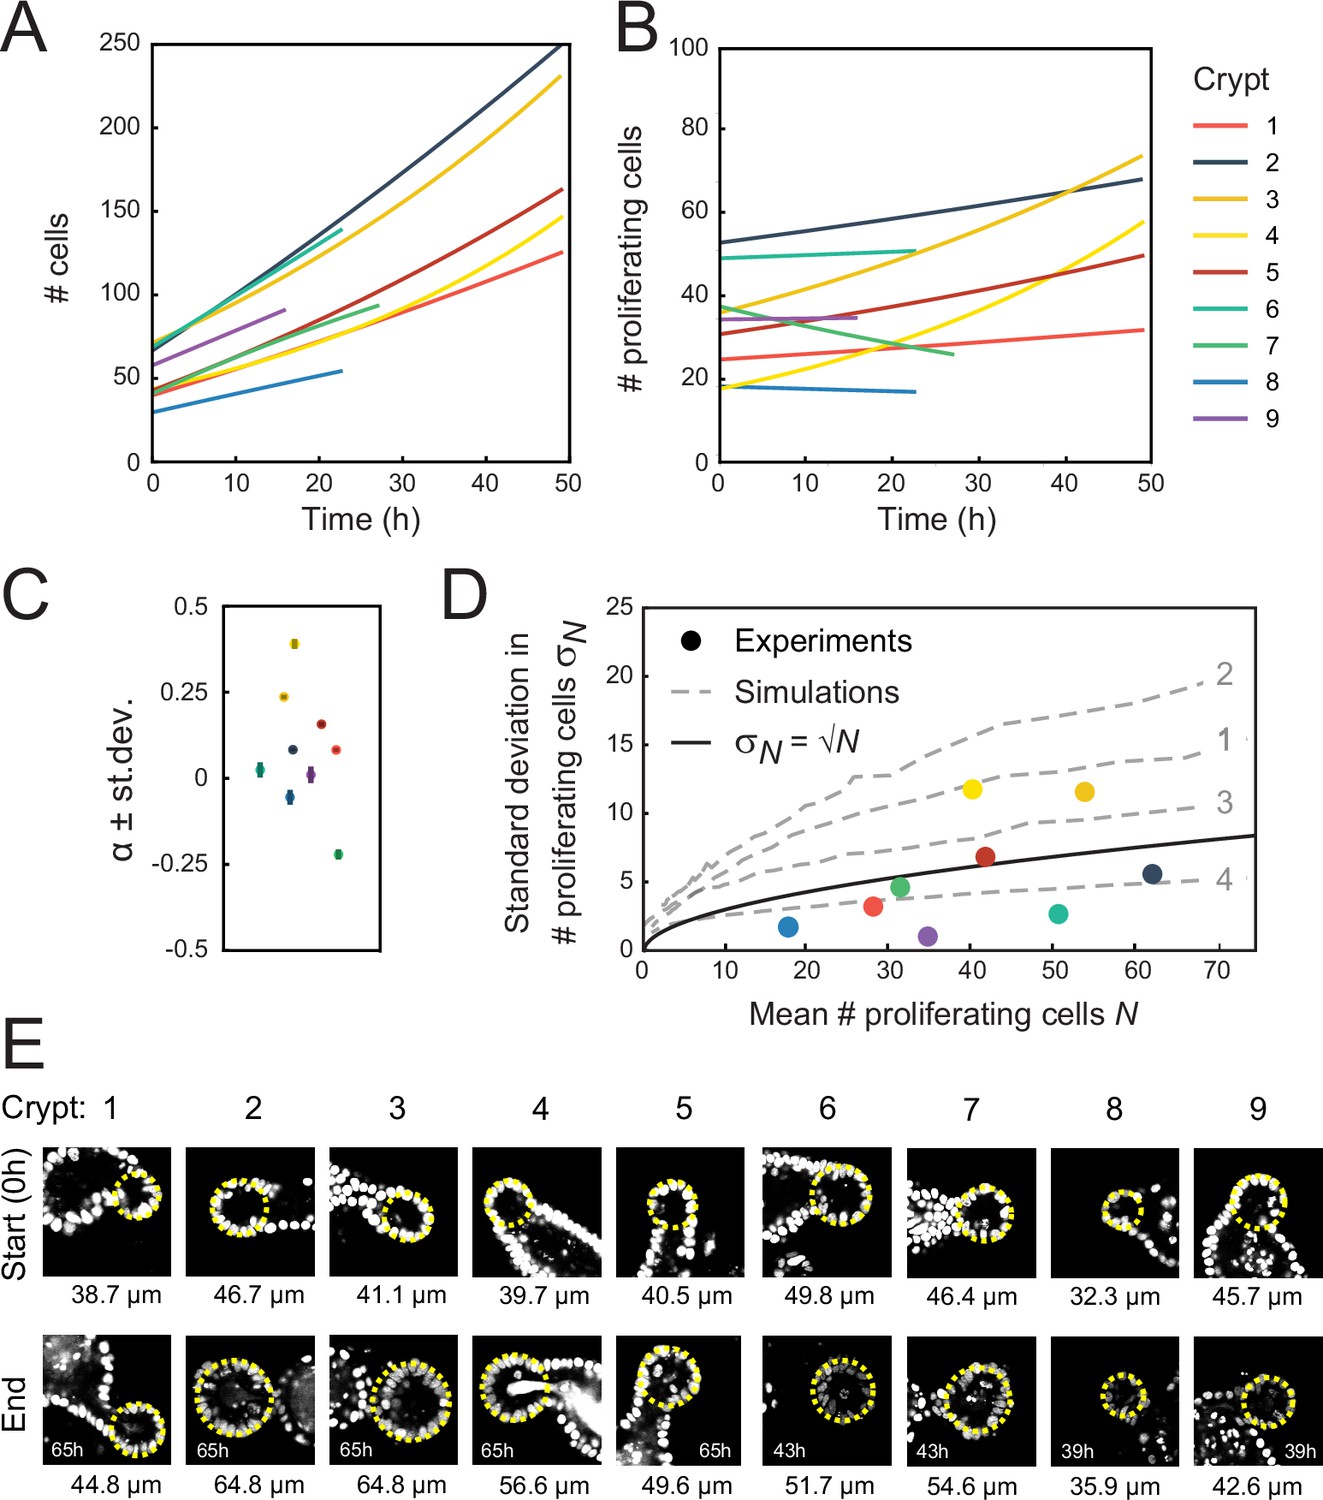
Crypt growth and heterogeneity.
(A, B) Fits of a simple cell proliferation model (Materials and methods) to the experimental data in Figure 2A and B. Each fit to the total number of cells (A) and number of proliferating cells (B) yields a single-fitted value of the exponential growth rate α. (C) Fitted values of α, with the color of each marker corresponding to the crypts in (A, B). Two crypts exhibited significant growth (crypts 3 and 4, α≥0.25), while one crypt shows decay in proliferating cell number (crypt 7, α=−0.25). For most of the remaining crypts, α deviated significantly from zero, but otherwise the fitted growth was low. For this reason, the reported average growth rate in the main text excluded crypts 3, 4, and 7. Including crypt 7 yields α=0.0±0.1. Error bars are the standard deviation in the fit of α. (D) Standard deviation of the number of proliferating cells, , versus the average, , for each crypt, with color indicating crypts as in (A, B). Black line shows the relationship expected for a Poisson birth-death process, . For crypts that exhibited growth (crypts 3 and 4), was larger than a Poisson process, while other crypts showed fluctuations close to or below what was expected for a Poisson process, implying that fluctuations were limited by some form of homeostatic control. Gray dashed lines show the same analysis for simulations of the ‘Compartment’ model (Figure 4D), with individual lines corresponding to different scenarios 1–4 (indicated in gray) in Figure 4E and F. For the suboptimal scenarios 1–3, fluctuations are larger than Poissonian, while the optimal scenario 4 reproduced the low fluctuations observed experimentally. (E) Fluorescence images of analyzed crypts 1–9 at the start and end of the experiment. Duration of the experiment is indicated in each ‘end’ panel. Diameter of the crypt at the start and end of the experiment is calculated by overlaying a circle (yellow line) over the z-slice at the center of the crypt. Overall, crypts display heterogeneity both in initial crypt size and growth of crypt diameter.
Figure 3 with 2 supplements
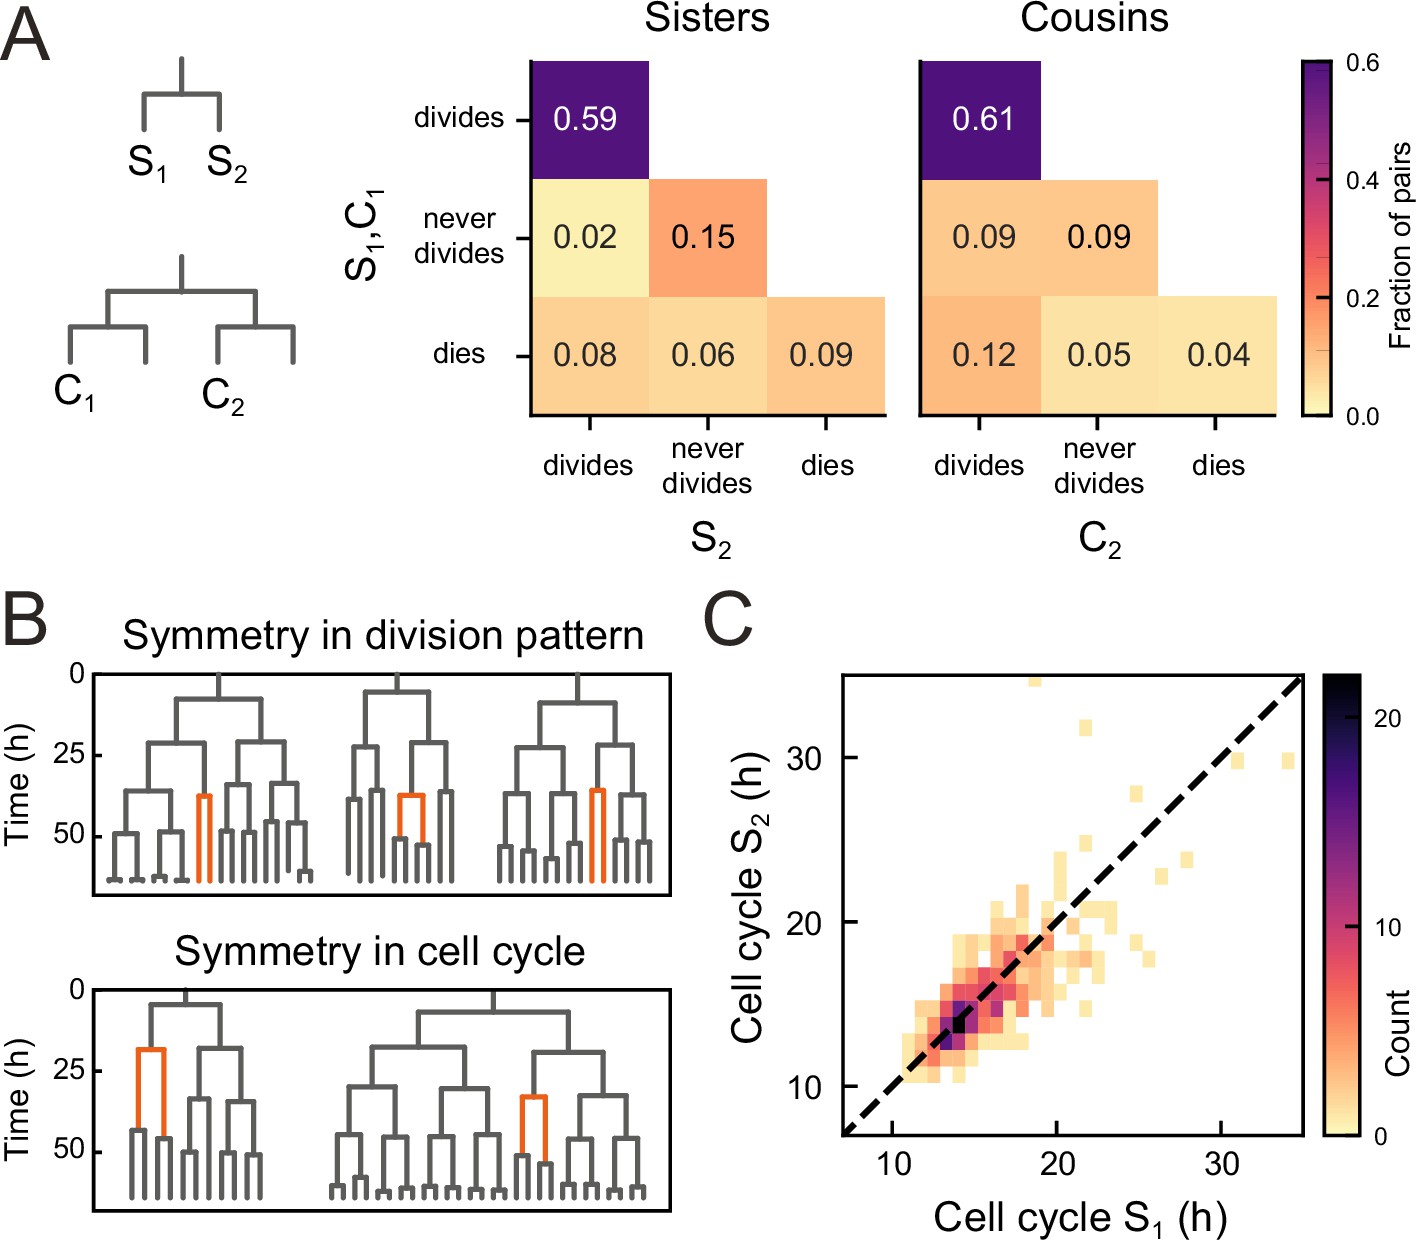
Symmetry of lineage dynamics between sister cells.
(A) Correlations in division patterns between sister (S1,S2) and cousin cells (C1,C2) (n=1004 and 1304 sister and cousin cell pairs). Most sister pairs show symmetrical outcomes, with most pairs consisting of sisters that either both divide or both cease dividing. Cell death occurs at low frequency and impacts sister cells asymmetrically. Symmetrical outcomes are still dominant for cousins, but the fraction of pairs that exhibited asymmetric proliferative outcomes (C1 never divides, C2 divides) was significantly increased in cousins compared to sisters (p=2.4∙10−7, Pearson’s Chi Square test). (B) Representative examples of measured lineages highlighting pairs of sister cells (orange) that differ in lineage dynamics from their more distant relatives (black), either in terms of proliferative behavior (top) or cell cycle duration (bottom). (C) Duration of sister cell cycles plotted against each other for pairs in which both sisters divided. Cell cycle duration is strongly correlated between sisters (R=0.80).
Figure 3—figure supplement 1
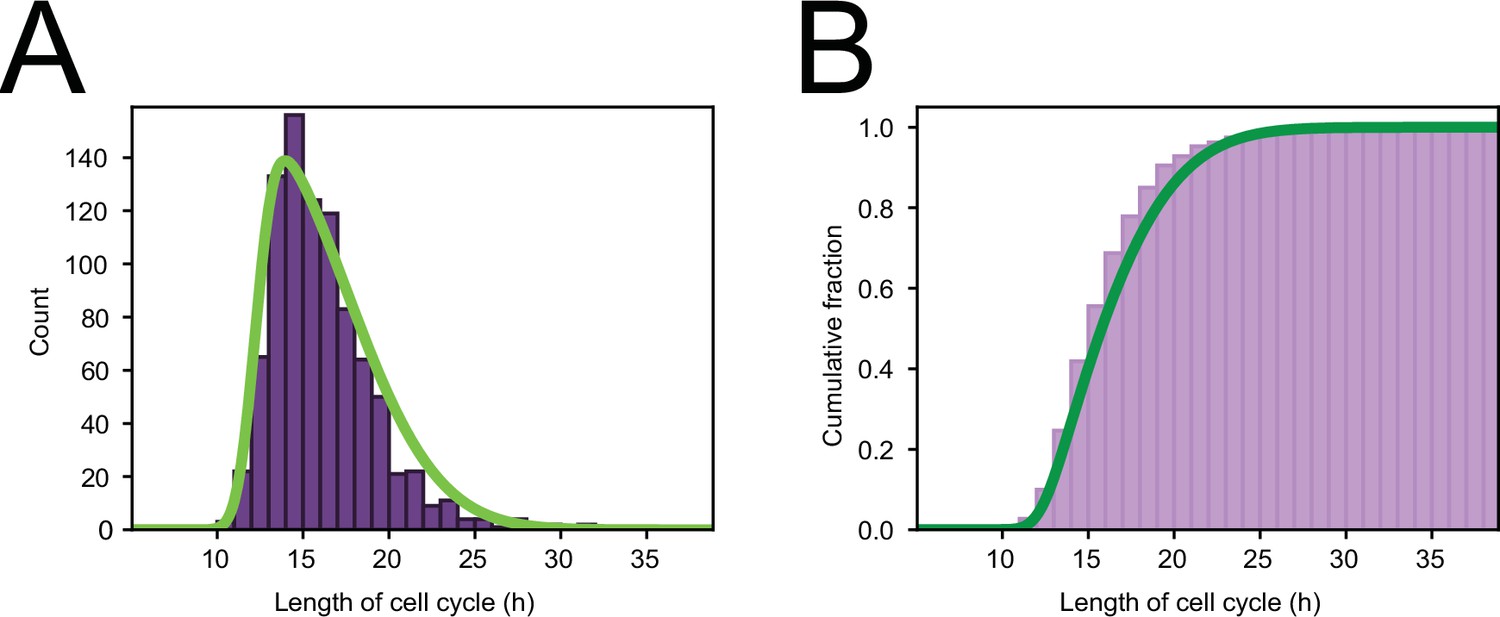
Cell cycle distribution.
(A) Histogram of cell cycle times of all tracked dividing cells. Green line represents a skew normal distribution fitted to the data, with parameters: shape = 6.1, location = 12.2 hr, and scale = 5.2 hr. (B) Cumulative version of the histogram of panel (A).
Figure 3—figure supplement 2
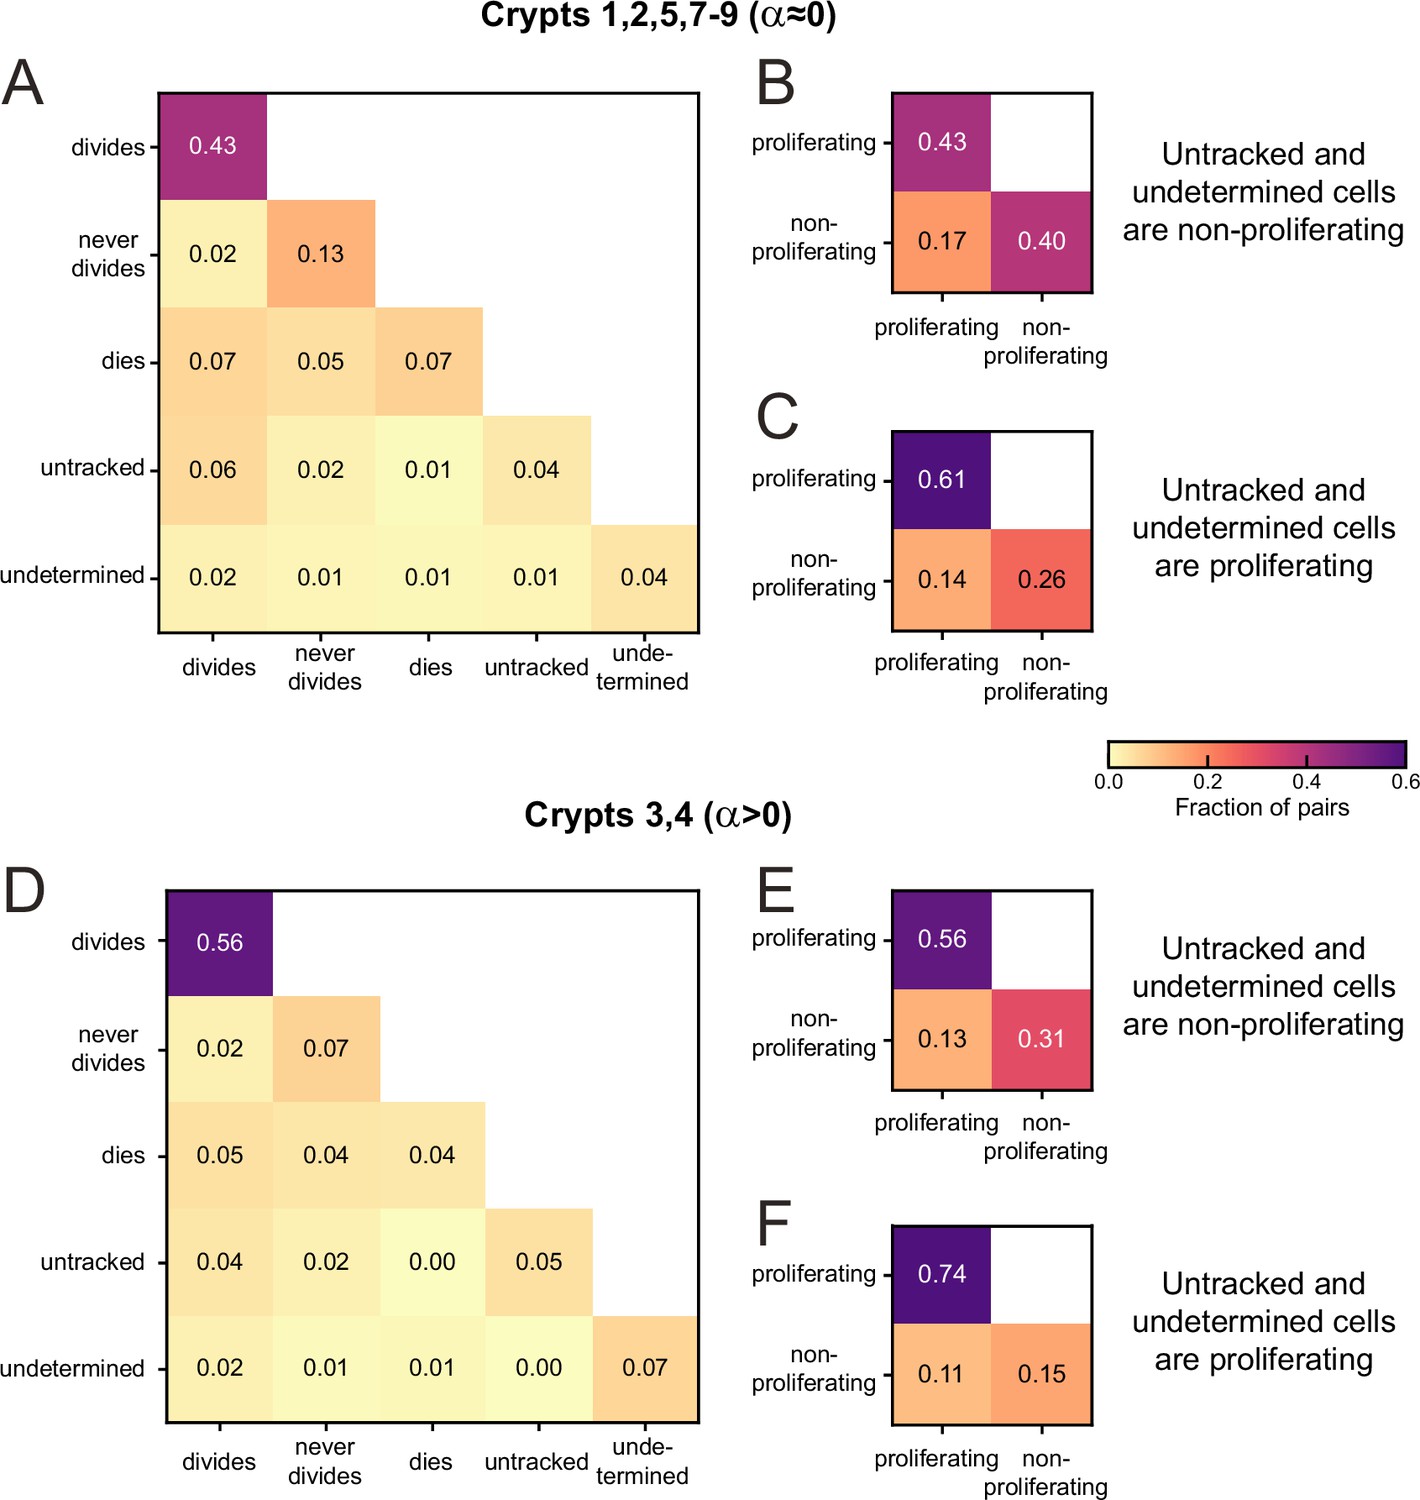
Sister pair division patterns and proliferation control.
(A) Correlations in division patterns between sister pairs (S1,S2), for all cells born at least 15 hr prior to the end of the experiment in crypts that exhibited low growth rate in Figure 2—figure supplement 1B and C (crypts 1, 2, 5, 7–9). Sister pair fractions are also included for cells that were lost from cell tracking (untracked) or cells that could be tracked but where the experiment ended before a division could be observed or excluded (undetermined). (B) Fraction of sister pairs with proliferating and/or non-proliferating cells, under the assumption that untracked and undetermined cells are non-proliferating. This assumption matches our observation that untracked cells are located almost exclusively in the villus, where cells are less likely to proliferate, and that undetermined cells older than 15 hr are most likely non-proliferating according to Figure 3—figure supplement 1. Cells that died were classified as non-proliferating, as in Figure 2A and B. Under this assumption, the fraction of symmetrically proliferating (43%) and non-proliferating sisters (40%) is approximately equal, consistent with constant number of proliferating cells and low growth rate in Figure 2A and B and Figure 2—figure supplement 1B and C. (C) Fraction of sister pairs with proliferating and/or non-proliferating cells, under the assumption that all untracked and undetermined cells proliferate. Under this assumption, which is not supported by our experiments, the fraction of symmetrically proliferating (61%) and non-proliferating sisters (26%) is still relatively close to balanced, implying that the balance in proliferation observed in (B) is likely not impacted strongly if a small fraction of untracked or undetermined cells would have been proliferating. (D) Same as (A) but for crypts that exhibited an increase in number of proliferating cells ( crypts 3, 4). (E, F) same as (B, C) but for crypts 3 and 4. Symmetrically proliferating sisters (56%) outnumber non-proliferating sisters (31%) even under the assumption that all untracked and undetermined sisters are non-proliferating, consistent with the growth in proliferating cells observed in these crypts.
Figure 4 with 2 supplements
Cell number fluctuations in stem cell models.
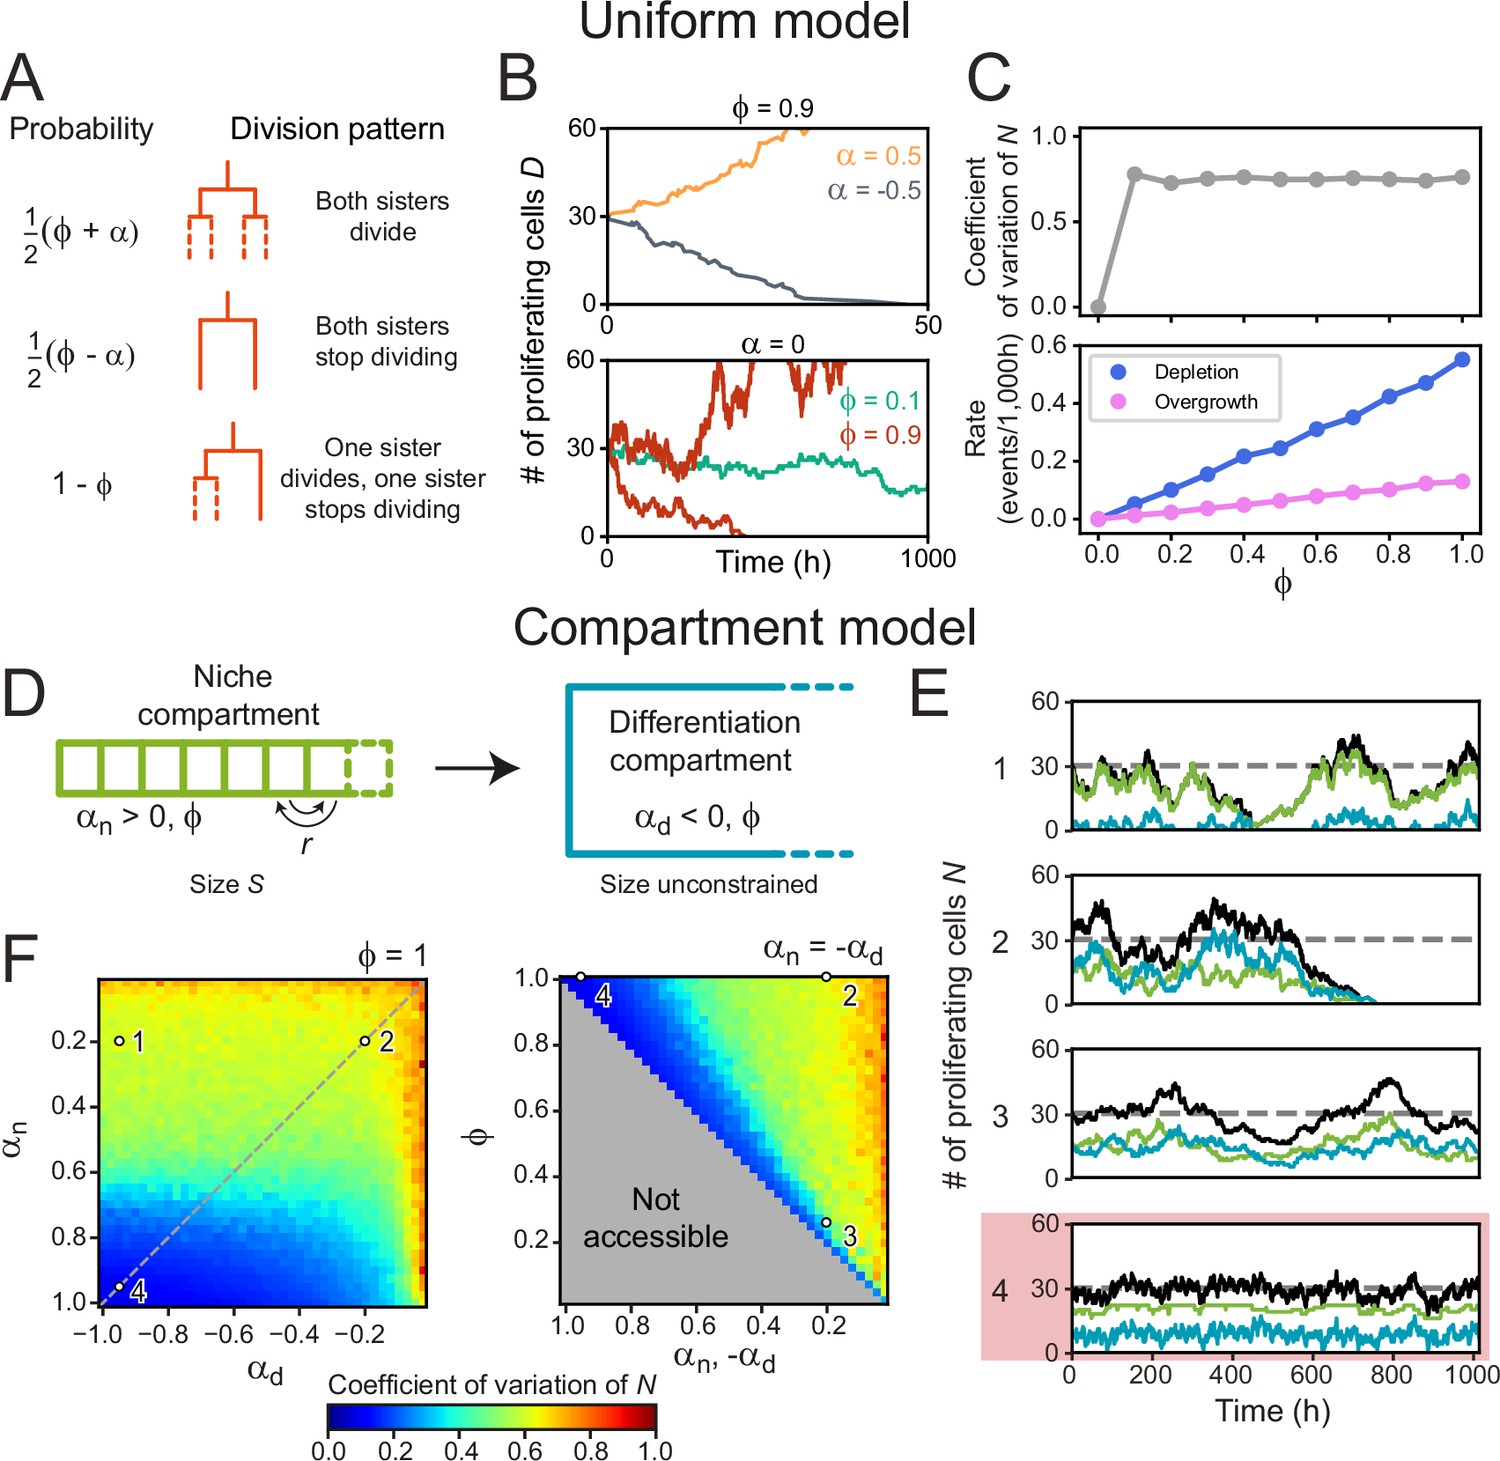
(A) ‘Uniform’ stem cell model. The probability of each division pattern depends on , the average increase in the number of proliferating cells per division, and, , the fraction of divisions with symmetric outcome, while the total cell number is unconstrained. (B) Number of proliferating cells, as function of time for different values of (top) and (bottom). For,, remains constant on average, yet in this case, fluctuations can cause stochastic depletion or overgrowth of proliferating cells, as shown for (bottom). (C) Coefficient of variation (standard deviation divided by mean) of as a function of (top panel) and the probability of depletion (, blue) or overgrowth ( 150, pink) events (bottom panel), for the ‘Uniform’ model with . Frequency of overgrowth depends strongly on the threshold value used. Fluctuations are minimal for , i.e., only asymmetric divisions. (D) ‘Compartment’ model. Cells divide according to (A), but now the tissue is divided in a niche compartment , with , and a differentiation compartment , where . Both compartments have the same . In the niche compartment, the total number of cells cannot exceed , so that upon cell division the distalmost cell (dashed square) moves into the differentiation compartment. Cells in the niche compartment switch positions at rate . (E) Number of proliferating cells as a function of time in the niche (green) and differentiation compartment (blue). The total number of proliferating cells (black) fluctuates around the dashed line corresponding to . Each panel’s number refers to the parameter sets shown in (F). The parameter set with lowest fluctuations is outlined in red. (F) Coefficient of variation of . Left panel shows the effects of varying the growth rates of both compartments when all divisions are symmetric (), and right panel of varying the degree of symmetry when both compartments have opposite growth rates ( , dashed line in top panel). The gray region in bottom panel is inaccessible parameter space. Simulations ran with , corresponding to our experimental observations, and rearrangements occurring approximately once per cell cycle. Fluctuations are minimized for and , i.e., only symmetric divisions.
Figure 4—figure supplement 1
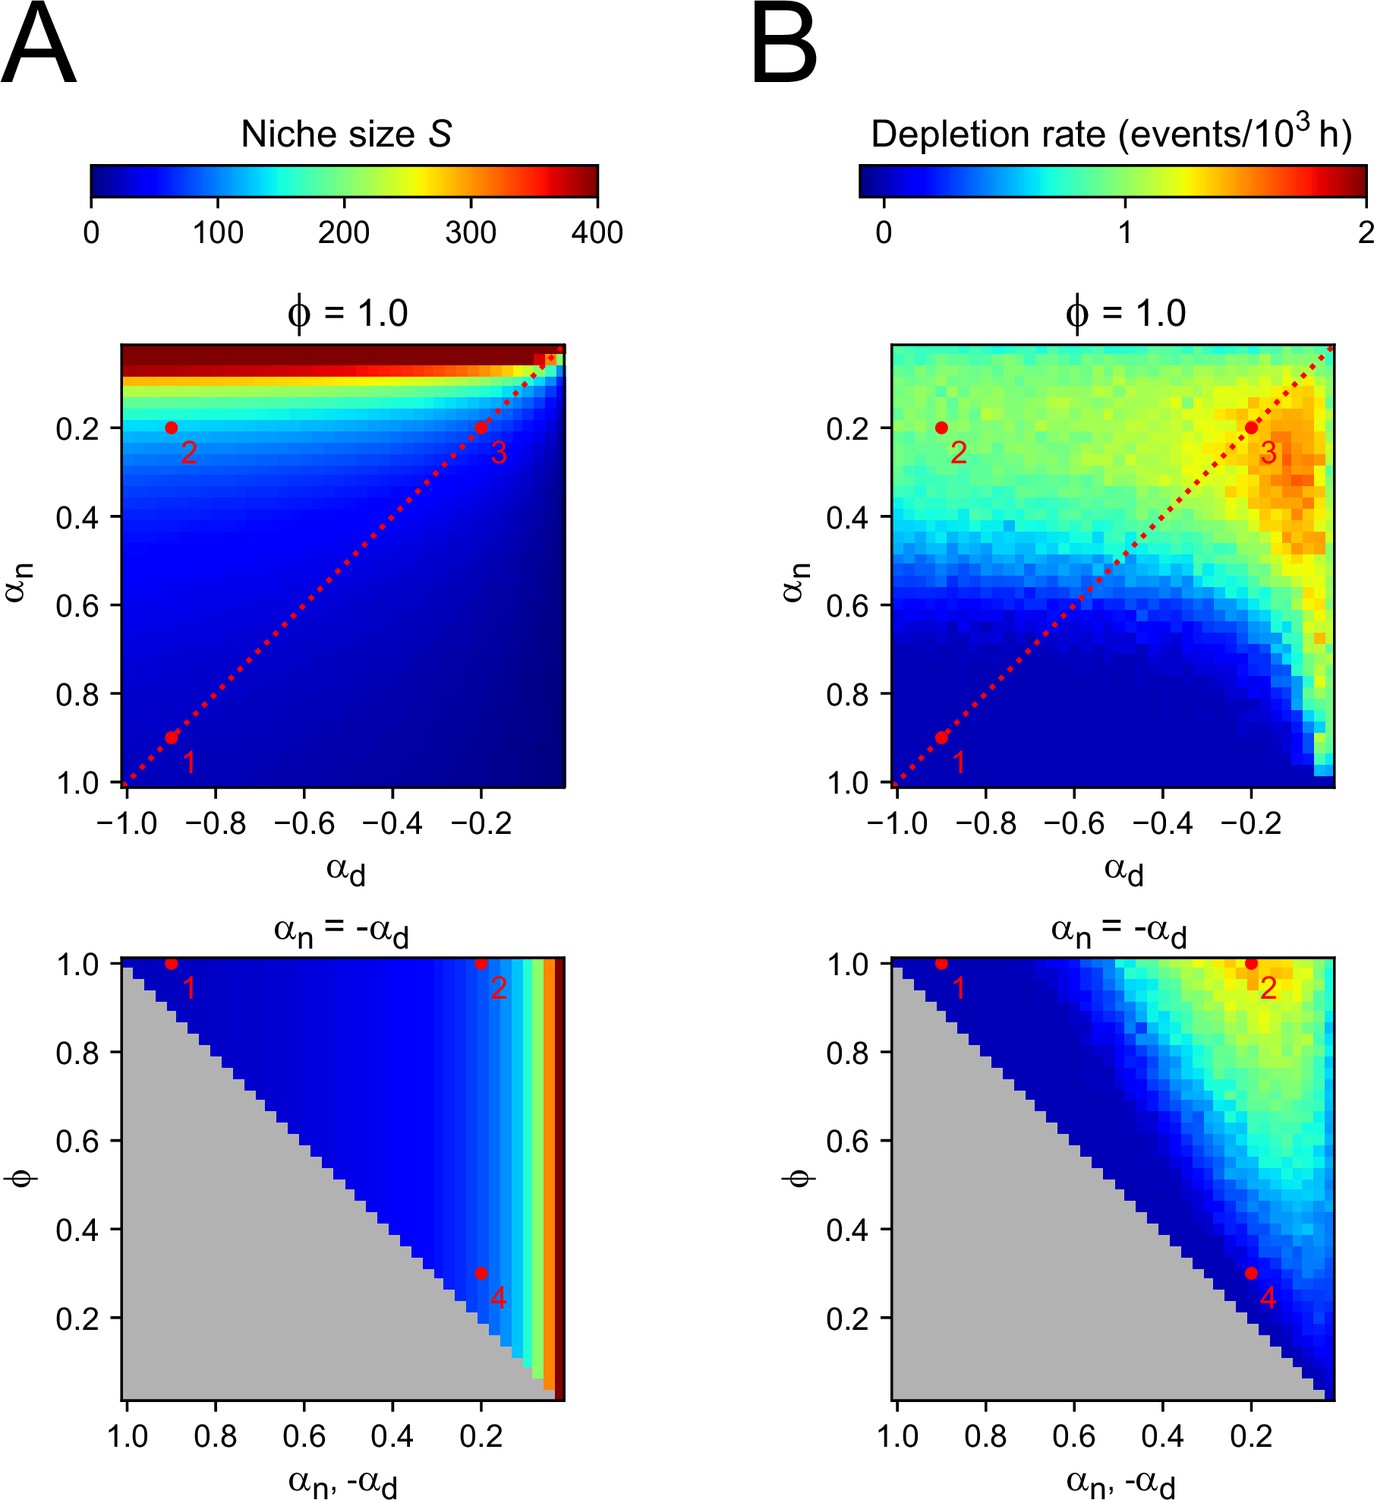
Two-compartment model.
(A) Number of cells in the niche compartment, as function of model parameters in the Compartment model. Top panel shows the effects of varying the bias toward proliferative daughters of the niche and differentiation compartments ( and , respectively) when all divisions are symmetric (), and bottom panel shows the effects of varying the degree of symmetry when these compartments have opposite growth rates ( , dashed line in top panel). The gray region in bottom panel corresponds to inaccessible parameter space. Numbers correspond to the parameter sets highlighted in Figure 4 in the main text. (B) Rate at which proliferating cells were depleted. Every time a simulation ended due to depletion, i.e., all remaining cells are non-proliferating, a new simulation was started until a total simulation time of 106 hr was reached. Thus, the rate refers to the number of times simulations had to be restarted for each value of the parameters divided by the total simulation time. Spontaneous overgrowth was only observed in cases where and are both close to 0, in which case the rate was low (~10−5 hr–1).
Figure 4—figure supplement 2
Dependence of lineage dynamics on cell rearrangements.
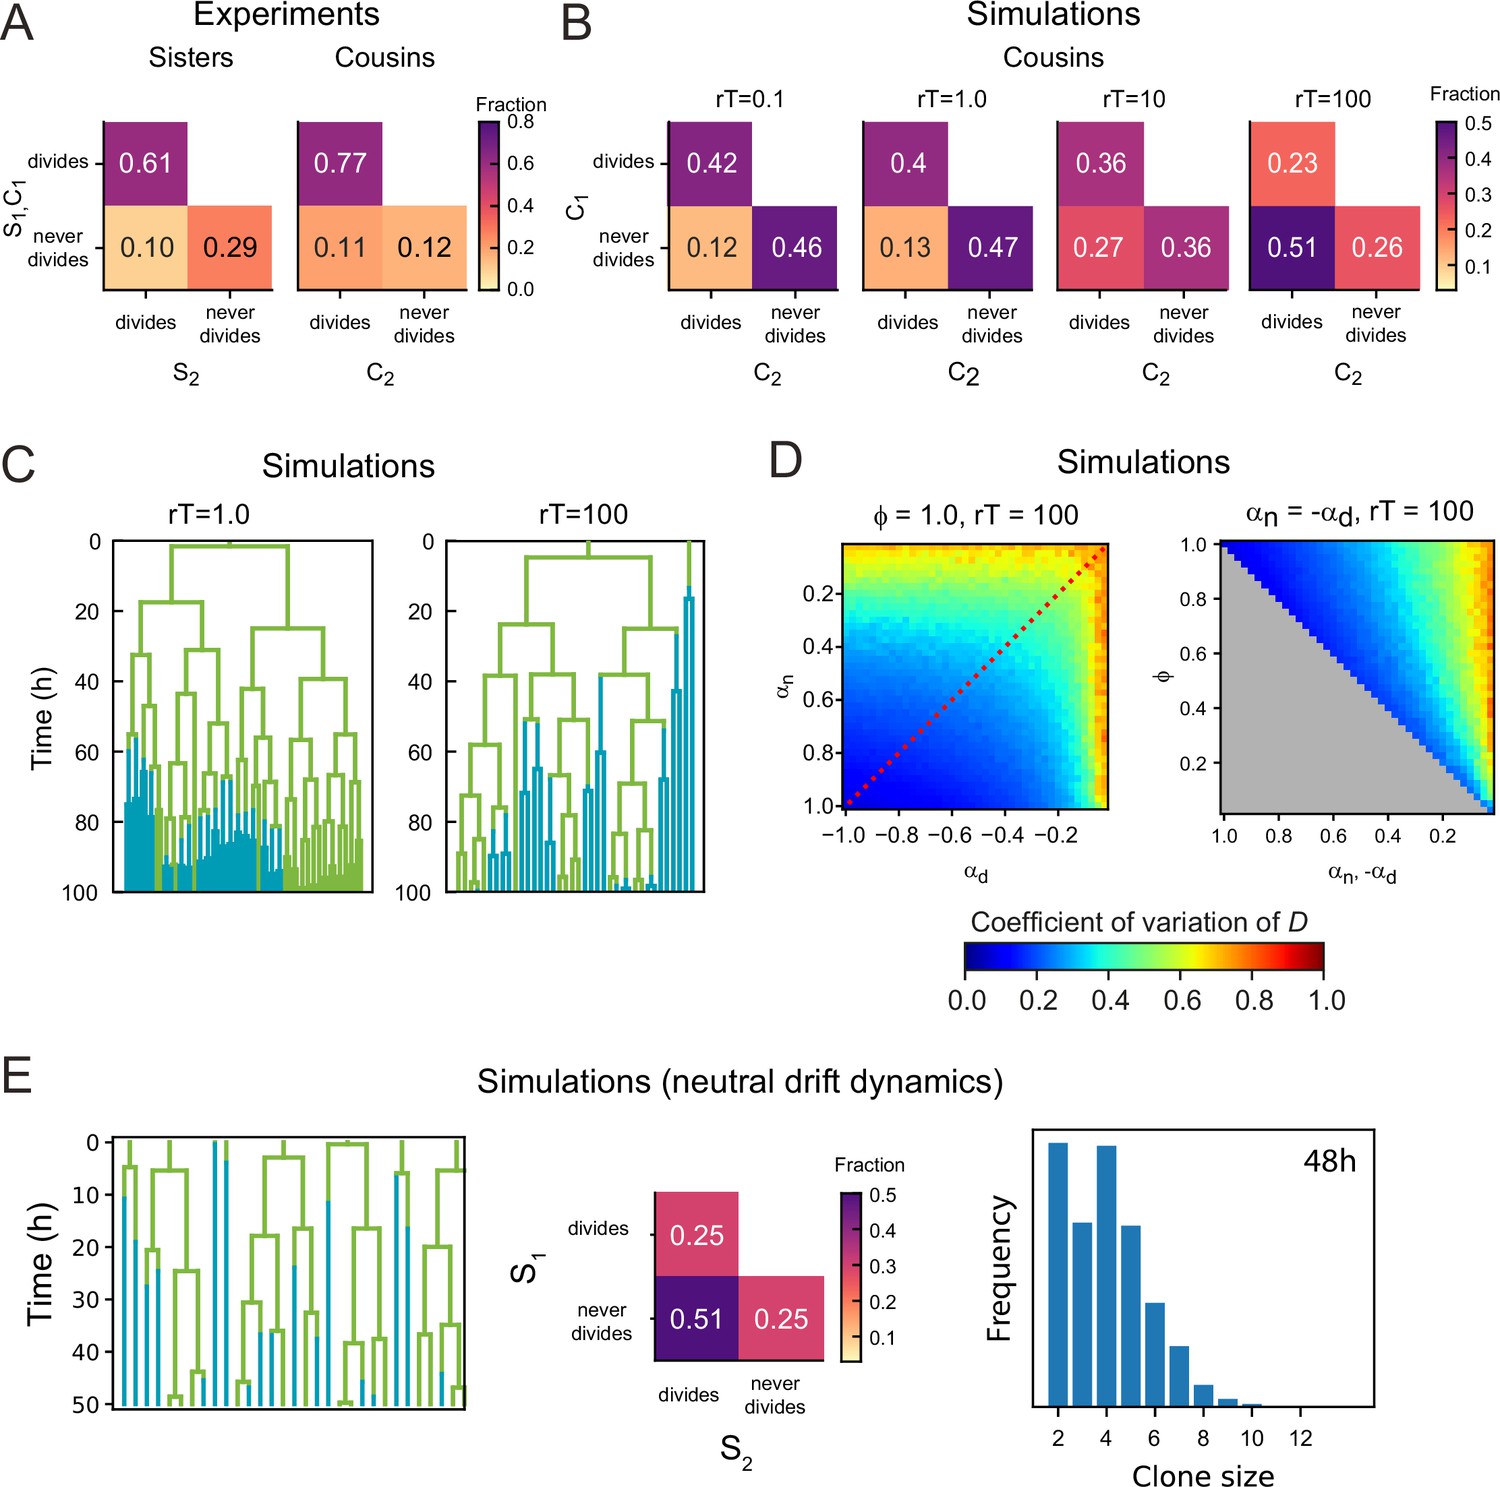
(A) Experimentally observed correlations in division patterns between sister pairs (S1,S2, n=499) and cousin cells pairs (C1,C2, n=560), for cell pairs where neither cell died. (B) Correlations in division pattern between cousin cells (C1,C2) for simulations of the two-compartment model, for increasing cell rearrangement rate . Here, the product , where is the average cell cycle duration, indicates the approximate number of rearrangements experienced per cell cycle. For a ‘well-stirred’ proliferative compartment, , asymmetric lineage outcome is more prevalent than symmetric outcome for cousin cells. However, for infrequent cell rearrangements, , asymmetric lineage outcome for cousin cells is less prevalent than symmetric outcome, with a frequency that resembles that seen experimentally in (A). Data is averaged over 50 independent simulations, with , , and the average number of proliferating cells . (C) Example lineage trees obtained from simulations for different . Line color indicates whether the cell was in the proliferative (green) or non-proliferative compartment (blue). For , closely related cells remain largely together in space, causing ejections from the proliferative compartment to be correlated within lineages. As a consequence, not only sisters, but also cousins and more distantly related cells keep proliferating or cease proliferation together. For , this correlation within lineage trees is lost. (D) Coefficient of variation of the total number of proliferating cells for simulations with a ‘well-stirred’ proliferative compartment,= r100. Left panel shows the effects of varying the growth rates of both compartments when all divisions are symmetric and right panel of varying the degree of symmetry when both compartments have opposite growth rates. Overall, the coefficient of variation shows a similar dependence on parameters as seen for the simulations with infrequent cell rearrangements, , shown in Figure 4 in the main text. (E) Simulations of a neutral drift dynamics model for . This model is similar to the ‘well-stirred’ two-compartment model for the case where all cells are proliferative in the niche compartment (, ), and no cells are proliferative in the differentiation compartment (, ). However, the main difference is that in the neutral drift model, cells switch from proliferative to non-proliferative immediately upon exiting the niche compartment. This results in half of all divisions being asymmetric, as every cell has an independent chance of 50% to exit the niche and thus halt proliferation.
Figure 5 with 2 supplements

Impact of Paneth cell distance on proliferation.
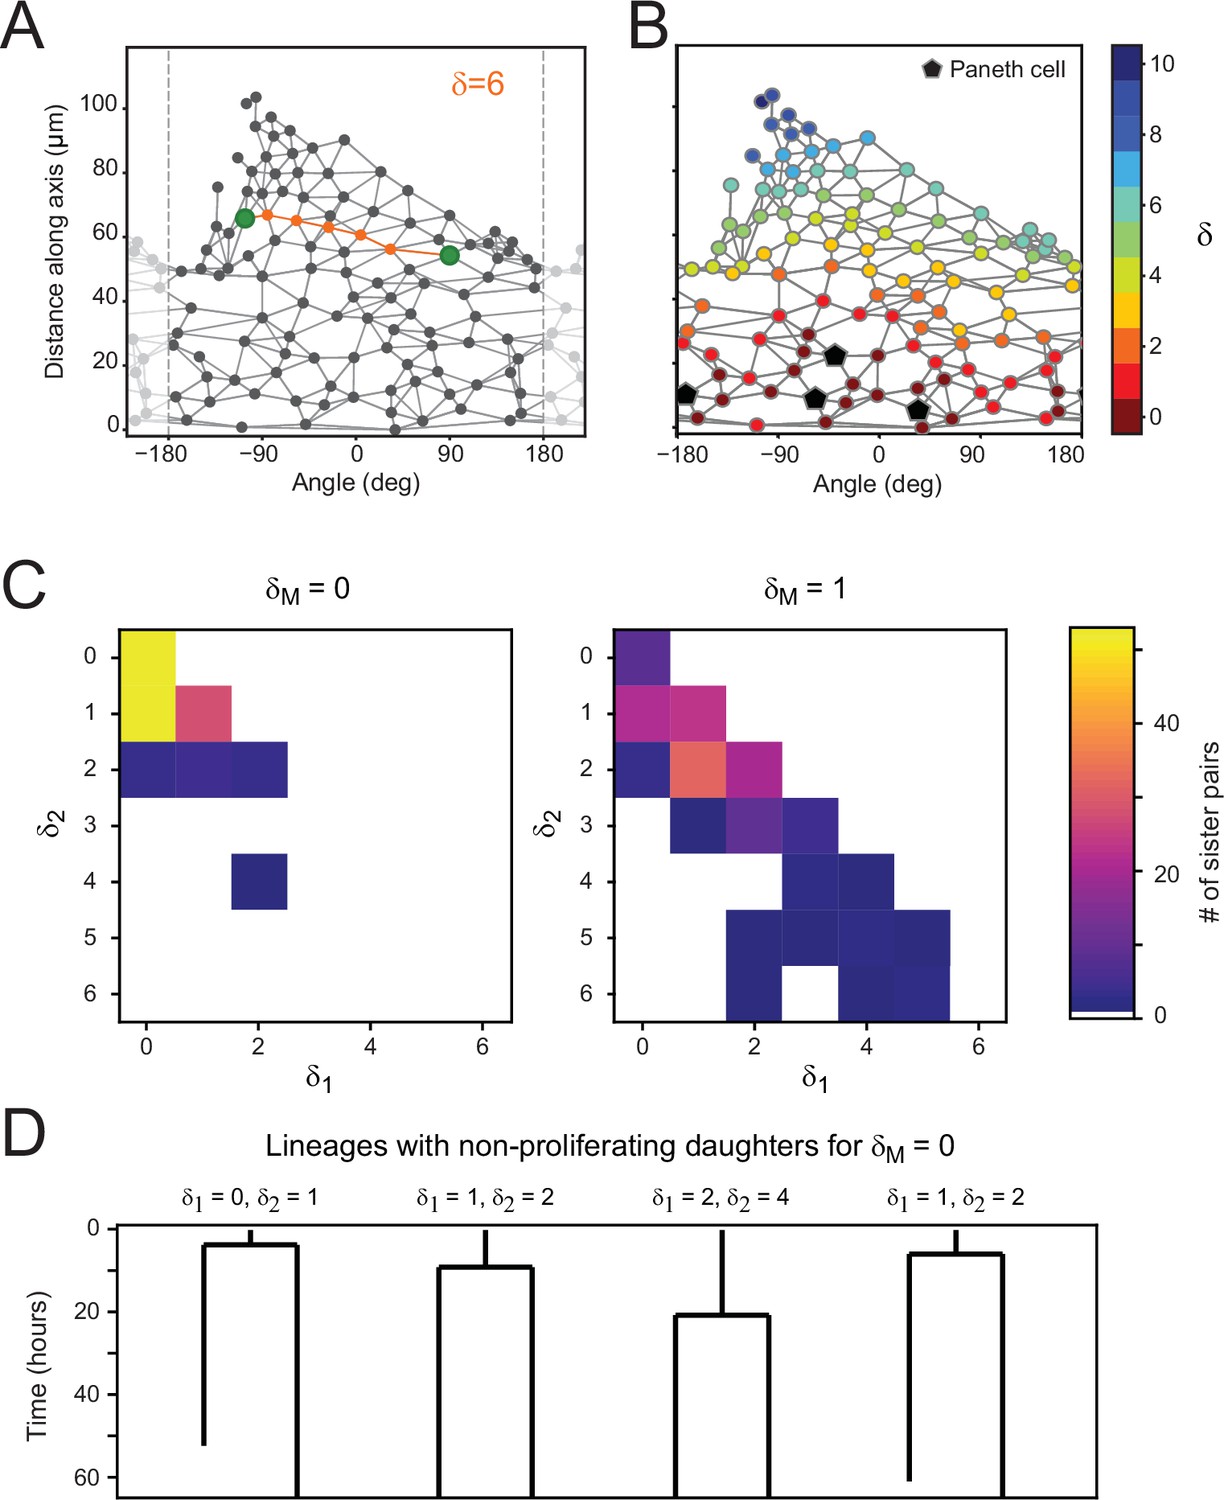
(A) Dependence of proliferation on contact with Paneth cells. We examined cases where a mother cell (M) that touched a Paneth cell (P) divided into sister cells, S1 and S2, that either retained or lost Paneth cell contact. Here, the link distances and represent the number of cells between each sister and its closest Paneth cell. (B) Probability that both cells divide (blue), neither cell divides (orange) nor only a single cell divides (green) for all sister pairs S1 and S2 of which the mother touched a Paneth cell ( = 0). Sister pairs exhibited full symmetry in proliferative behavior, even when distance to the Paneth cell differed between sisters ( ). (C) Same as (B) but for a mother cell positioned one cell away from the Paneth cell ( = 1). More daughter cells cease proliferation. While the fraction of pairs where only one sister divides increases, most sisters exhibit symmetric behavior. (D) Probability of each division pattern as a function of Paneth cell distance of the mother cell. (E) Proliferative bias α and degree of symmetry Φ as a function of Paneth cell distance. The observed values of α define a proliferative niche (green, ) and non-proliferative differentiation (blue, ) compartment, with the former corresponding approximately to the first two ‘rings’ of cells surrounding the Paneth cell. (F) Number of proliferating cells as a function of Paneth cell number. Time courses for individual crypts were divided into 5-hr intervals (markers), for which average cell numbers were calculated. Apart from crypt 4, Paneth cell number correlated well with number of proliferating cells, even when Paneth cell number increased in time due to divisions. Dashed line is a linear fit to the data.
Figure 5—figure supplement 1
Proliferation dynamics as a function of Paneth cell distance.
(A) After crypt unwrapping and determination of neighbors, the link distance between two cells (green markers) is defined as the number of edges that constitutes the shortest path connecting the two cells (indicated in orange), resulting in this case in a neighbor distance of . (B) Link distance of each cell to its closest Paneth cell, shown for a single time point. (C) Distribution of Paneth cell distances and of sister pairs generates from a mother cell either directly touching a Paneth cell ( = 0) or one cell removed from a Paneth cell ( = 1). (D) Examples of cell lineages for rare sister pairs that ceased proliferation, even though their mother was touching a Paneth cell ( = 0). For each sister pair, the distances and after division are given.
Figure 5—video 1
Crypt unwrapping and Paneth cell distance.
(Left) Unwrapped representation of the crypt in Figure 1, where colors represent the same lineages. (Right) Link distance δ of each cell to its closest Paneth cell. Pentagons indicate Paneth cells.
Figure 6
Clone size distributions reveal symmetry of proliferative behavior.
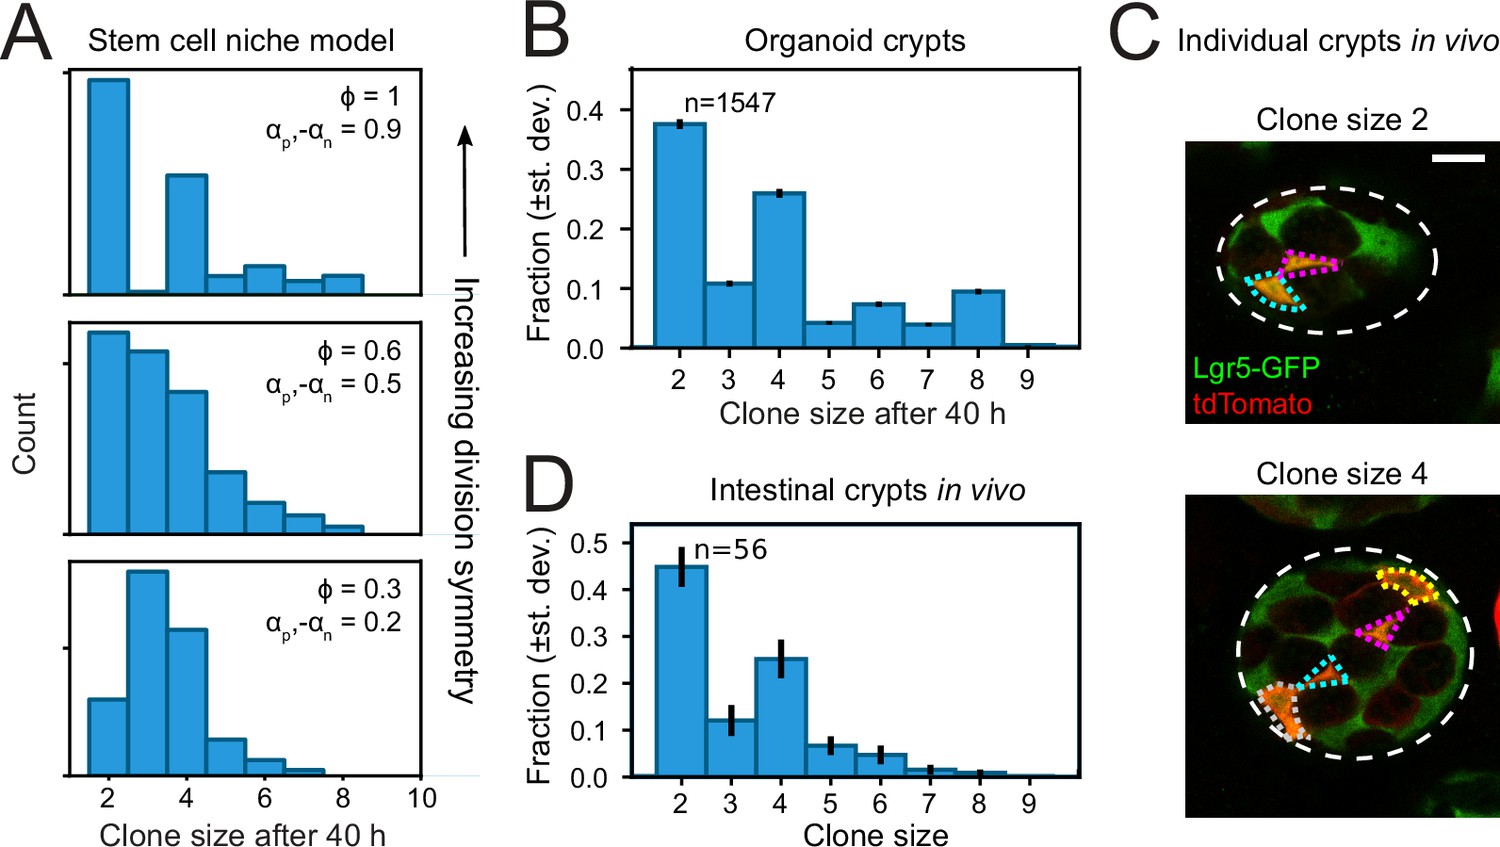
(A) Clone size distributions calculated for the Compartment model, for different degrees of division symmetry Φ. Top panel corresponds to parameters that minimize fluctuations in number of proliferating cells. For high division symmetry, Φ, even clone sizes are enriched compared to odd clone sizes. (B) Clone size distributions calculated for the lineage data obtained in organoids, for a sliding window of 40 hr. Even clone sizes are enriched, consistent with the observed dominance of divisions with symmetric proliferative outcome. Error bars indicate standard deviation calculated using a bootstrapping approach (Materials and methods). (C) Examples of individual crypts found in vivo, displaying clone size 2 (top) and 4 (bottom). Crypts are viewed from the bottom, with individual cells belonging to a tdTomato+ clone (red) outlined. Scale bar is 10 µm. (D) Clone size distributions measured in vivo 60 hr after induction of Cre-mediated recombination in small intestinal crypts of Lgr5EGFP-ires-CreERT2;R26LSL-tdTomato mice (n=160 crypts). Even clone sizes 2 and 4 are enriched compared to odd clone sizes 3 and 5. Error bars indicate standard deviations calculated using a bootstrapping approach.
Tables
Key resources table
| Reagent type (species) or resource | Designation | Source or reference | Identifiers | Additional information |
|---|---|---|---|---|
| Biological sample (Mus musculus) | H2B-mCherry (intestinal organoids) | Other | - | Gift from Hubrecht Institute, Clevers group |
| Antibody | anti-lysozyme (polyclonal rabbit) | Dako | RRID:AB_2341230; Cat# A0099 | IF(1:800) |
| Antibody | anti-rabbit IgG H&L (Alexa Fluor 405) (polyclonal donkey) | Abcam | RRID:AB_2715515; Cat# ab175649 | IF(1:1000) |
| Chemical compound, drug | Advanced DMEM/F-12 medium | Life Technologies | Cat# 12634010 | - |
| Other | Wheat Germ Agglutinin (WGA), CF488 A Conjugate | Biotium | Cat# 29022 | 5 μg/ml |
| Other | RedDot1 Far-Red Nuclear Stain | Biotium | Cat# 40060 | 1:200 |
Additional files
Download links
A two-part list of links to download the article, or parts of the article, in various formats.
Downloads (link to download the article as PDF)
Open citations (links to open the citations from this article in various online reference manager services)
Cite this article (links to download the citations from this article in formats compatible with various reference manager tools)
Mother cells control daughter cell proliferation in intestinal organoids to minimize proliferation fluctuations
eLife 11:e80682.
https://doi.org/10.7554/eLife.80682


