Meningeal lymphatic drainage promotes T cell responses against Toxoplasma gondii but is dispensable for parasite control in the brain
- Center for Brain Immunology and Glia, Department of Neuroscience, University of Virginia, United States
Figures
Figure 1 with 3 supplements
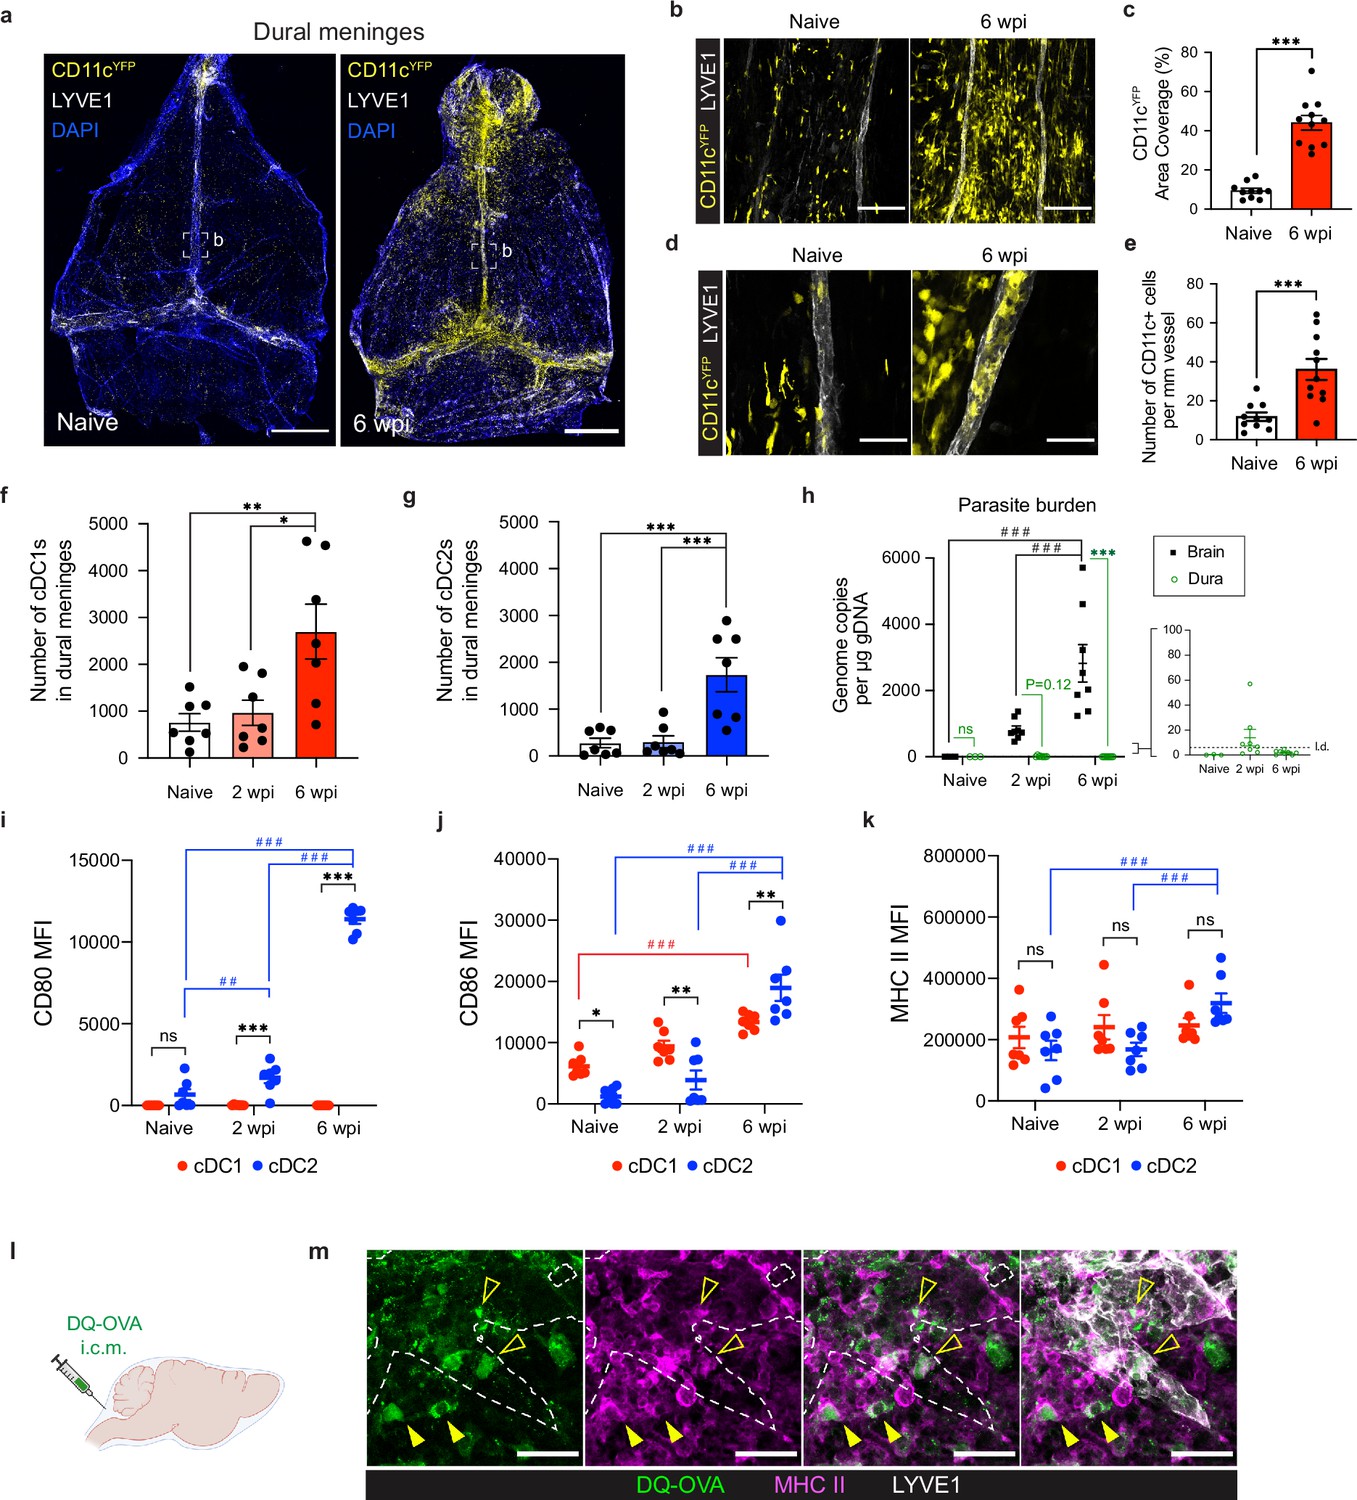
Conventional dendritic cells accumulate in the dural meninges during chronic brain infection and sample CSF-derived protein.
Mice were infected with 10 cysts of the ME49 strain of T. gondii intraperitoneally (i.p.) and analyzed at 6 weeks post-infection. (a) Confocal microscopy was used to image whole-mount dural meninges dissected from the skullcaps of naïve or chronically infected CD11cYFP reporter mice. Images are representative of three independent experiments. Scale bar, 2000 μm. (b) Representative images of CD11c+ cells (yellow) in the region surrounding the dural sinuses. Scale bar, 150 μm. (c) Quantification of area coverage by CD11c+ cells in the region surrounding the dural sinuses. Data compiled from three experiments (n = 10-11 mice per group). (d-e) Representative images (d) and quantification (e) of CD11c+ cells (yellow) present within LYVE1+ meningeal lymphatic vessels (white). Data compiled from three experiments (n = 10-11 mice per group). Scale bar, 50 μm. (f) Quantification by spectral flow cytometry of total cDC1 number (CD45+Lin-CD11chiMHC IIhiCD64-CD26+XCR1+SIRPα-) in the dural meninges of naïve, acutely infected, or chronically infected C57BL/6 mice. Data compiled from two experiments (n = 7 mice per group). (g) Quantification by spectral flow cytometry of total cDC2 number (CD45+Lin-CD11chiMHC IIhiCD64-CD26+XCR1-SIRPα+) in the dural meninges of naive, acutely infected, or chronically infected C57BL/6 mice. Data compiled from two experiments (n = 7 mice per group). (h) Quantification of T. gondii gDNA in brain and dural meninges by real-time PCR. Data compiled from two experiments (n = 3-8 mice per group). (i–k) Quantification of the geometric mean fluorescence intensity (MFI) of CD80 (i), CD86 (j), and MHC class II (k) expressed by cDC1s and cDC2s in the dural meninges. Data compiled from two experiments (n = 7 mice per group). (l) Schematic diagram illustrating intra-cisterna magna (i.c.m.) injection of DQ-OVA into the CSF. (m) Representative images of MHC class II-expressing antigen-presenting cells (magenta) co-labeling with fluorescent DQ-OVA cleavage products (green) in the vicinity of (closed arrows) or present within (open arrows) meningeal lymphatic vessels (LYVE1+, white). Three independent experiments were performed. Scale bar, 50 μm. Data are represented as mean values ± s.e.m. For c and e, statistical significance was measured using randomized block ANOVA (two-way), with p<0.001 (***). For (f and g) statistical significance was measured using a one-way ANOVA with post-hoc Tukey multiple comparison testing, with p<0.05 (*), p<0.01 (**), and p<0.001 (***). For (h–k) statistical significance was measured using a two-way ANOVA, with Tukey’s multiple comparison test to assess differences across timepoints [p<0.01 (##) and p<0.001 (###)] and Sidak’s multiple comparison test to assess differences between tissues (h) or cell type (i–k) [ns = not significant, p<0.05 (*), p<0.01 (**), and p<0.001 (***)].
Figure 1—figure supplement 1
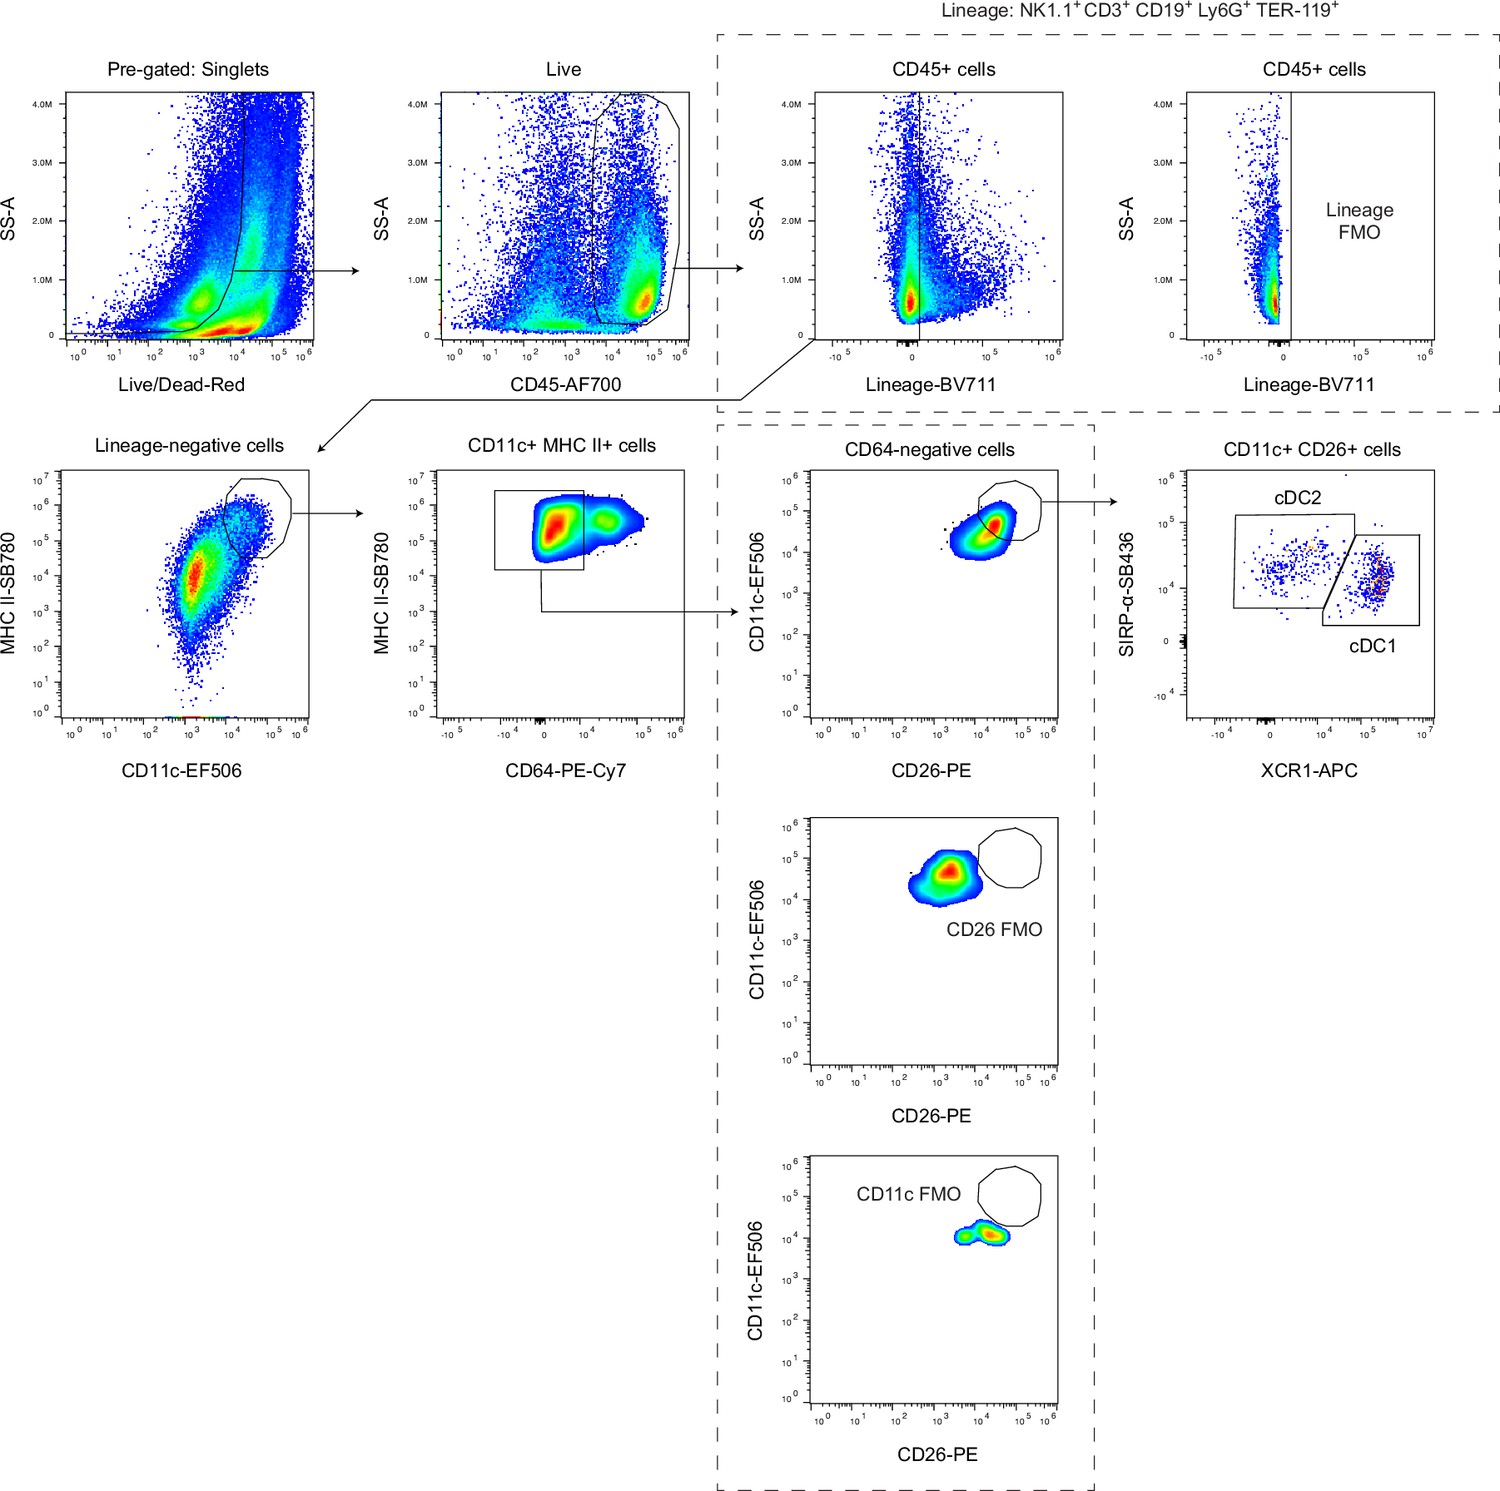
Gating strategy for conventional dendritic cells in the dural meninges.
Gating strategy for identification of cDC1s (CD45+Lin-CD11chiMHC IIhiCD64-CD26+XCR1+SIRPα-) and cDC2s (CD45+Lin-CD11chiMHC IIhiCD64-CD26+XCR1-SIRPα+) in single-cell suspensions of enzymatically digested dural meninges.
Figure 1—figure supplement 2
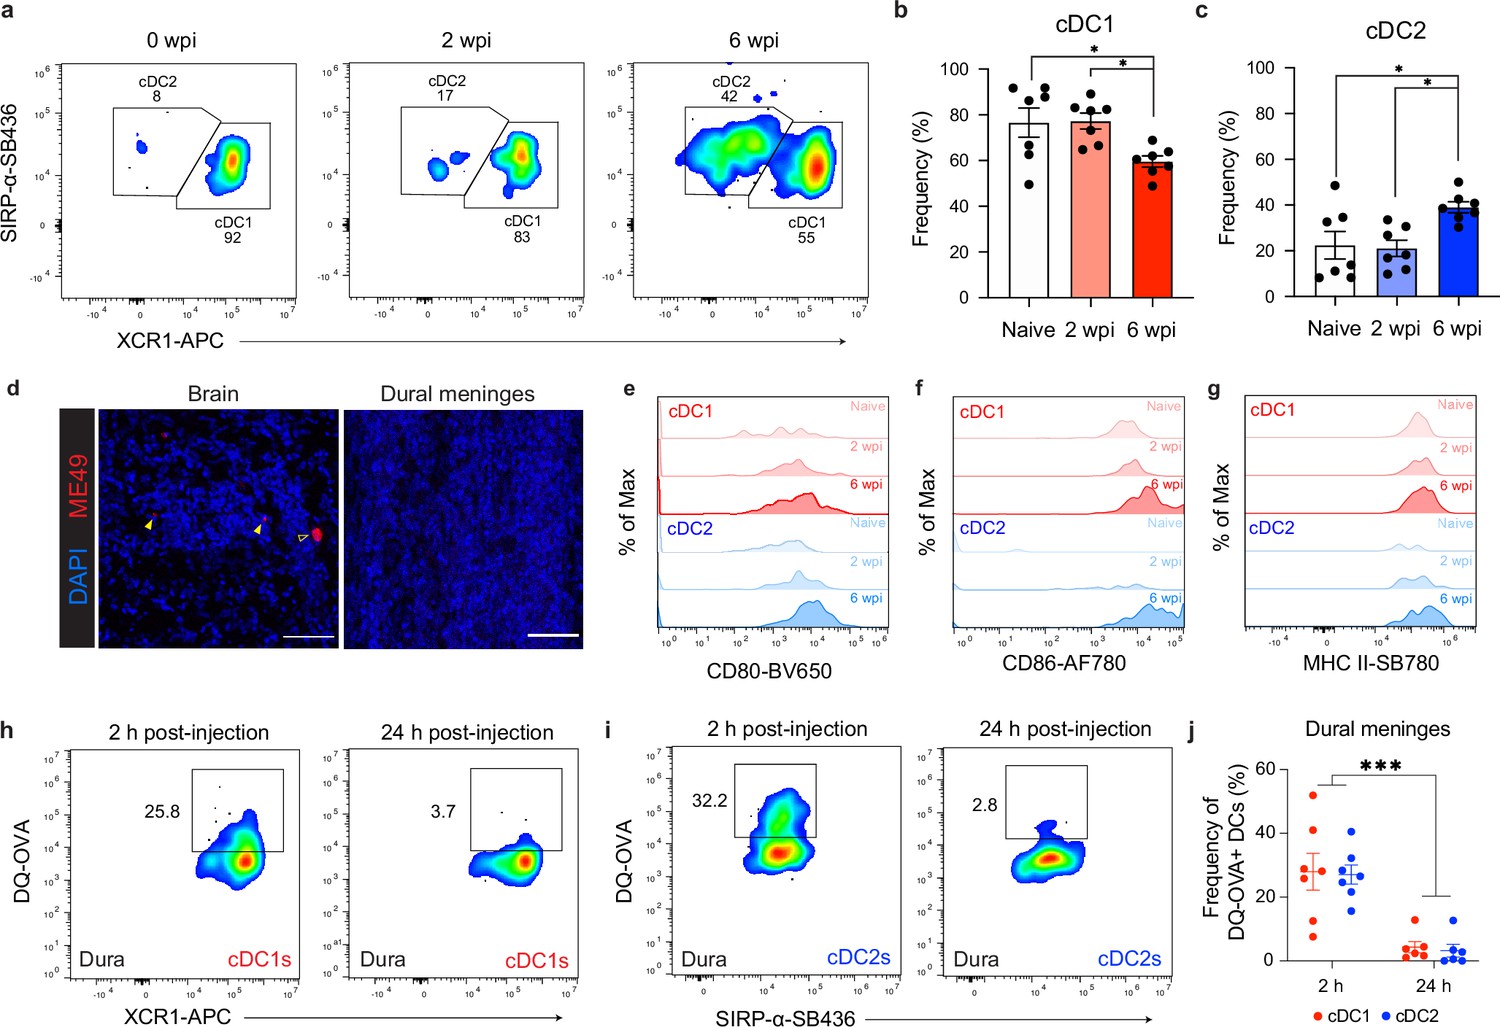
Comparison of cDC1 and cDC2 populations in the dural meninges during chronic brain infection.
(a–c) Representative dot plots (a) and quantification (b–c) of the frequency of cDC1s and cDC2s in the dural meninges of naïve, acutely infected, or chronically infected mice. Data compiled from two experiments (n = 7 mice per group). (d) Representative images of brain sections and whole mount dural meninges, harvested from the same chronically infected mouse, stained with a polyclonal rabbit α-ME49 antibody (red) and counter-stained with DAPI (blue). Open arrow indicates T. gondii cyst and closed arrows indicate T. gondii tachyzoites. Scale bar, 50 μm. (e–g) Representative flow histograms showing CD80 (e), CD86 (f), and MHC II (g) expression by cDC1s and cDC2s in the dural meninges of naive, acutely infected, or chronically infected mice. (h–j) Representative dot plots showing fluorescent emission of proteolytically cleaved DQ-OVA in cDC1s (h) and cDC2s (i) of the dural meninges either 2 hr or 24 hr after i.c.m. injection into chronically infected mice, with quantification (j) of two pooled experiments (n = 6-7 mice per group). For (b and c) statistical analysis was performed using a one-way ANOVA, with post-hoc Tukey multiple comparison testing [p<0.05 (*)]. For (j) statistical analysis was performed using two-way ANOVA, with Tukey’s multiple comparison testing to assess differences across timepoints [p<0.001 (***)]. Data are represented as mean values ± s.e.m.
Figure 1—figure supplement 3
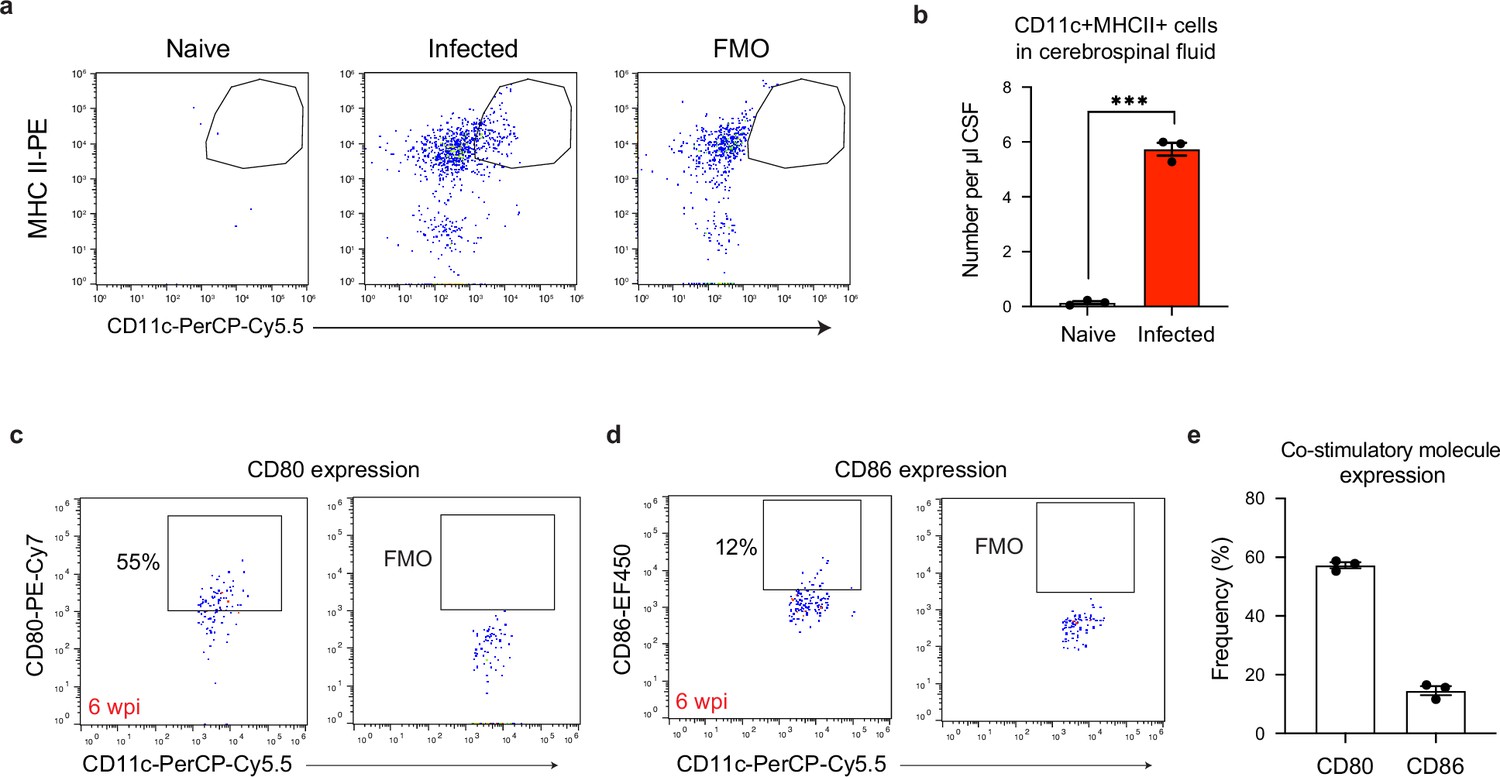
A population of CD11chiMHC IIhi antigen-presenting cells emerges in the cerebrospinal fluid of chronically infected mice.
Cerebrospinal fluid (CSF) was isolated and pooled from 4 to 5 naive or chronically infected C57BL/6 mice at 6 wpi. Surface staining was performed to identify CD11chiMHC IIhi antigen-presenting cells by flow cytometry. (a) Representative dot plots of CD11chiMHC IIhi cells pre-gated on singlets/live/CD45+/TCRβ-/NK1.1-/CD19-. (b) Quantification of CD11chiMHC IIhi antigen-presenting cell number per μl of CSF in naïve and chronically infected mice. Data are compiled from three experiments (n = 3 pooled samples per group) and are represented as mean values ± s.e.m. Each data point represents the concentration of cells found in the pooled CSF of 4–5 mice. Statistical significance was measured using a two-tailed unpaired student’s t-test, with p<0.001 (***). (c–e) Representative dot plots showing CD80 (c) and CD86 (d) expression on CD11chiMHC IIhi antigen-presenting cells, with quantification (e) from three pooled experiments (n = 3 pooled samples per group). Data are represented as mean values ± s.e.m.
Figure 2 with 4 supplements
Expansion of T cells in the deep cervical lymph nodes occurs primarily during the chronic stage of infection and tracks with parasite burden in the brain.
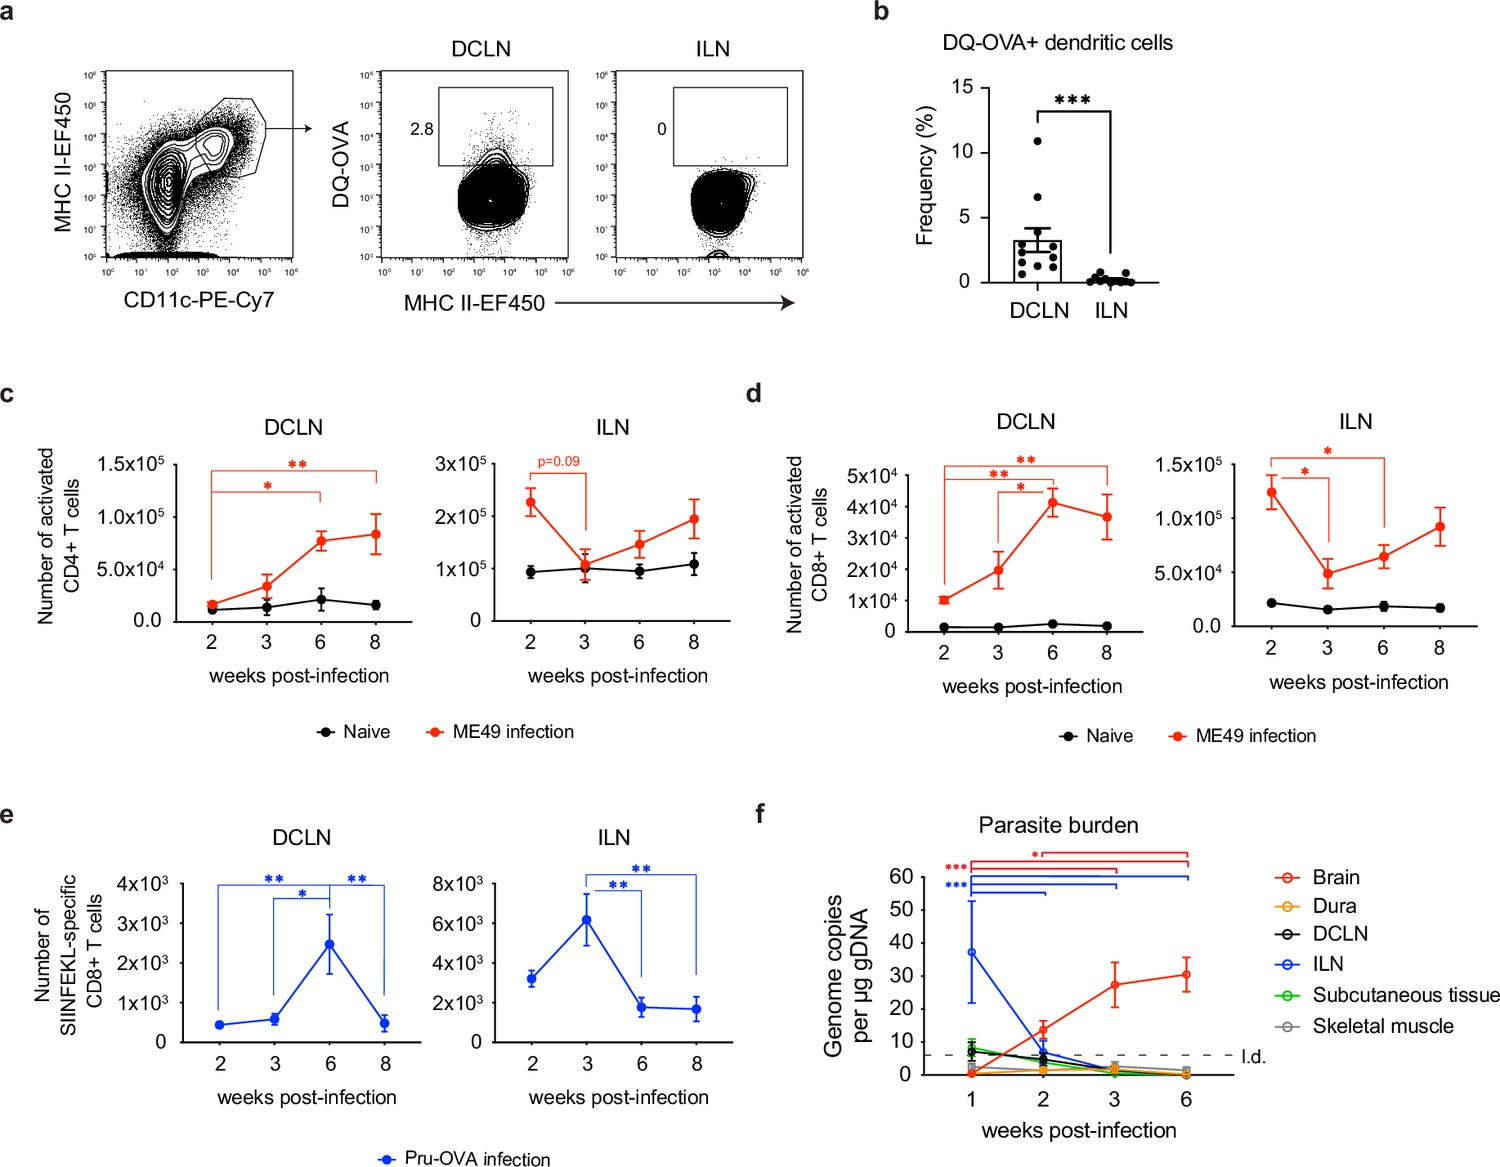
(a-b) DQ-OVA was injected into the CSF of chronically infected mice by i.c.m. injection and fluorescent emission of proteolytically cleaved DQ-OVA was measured in CD11chiMHC IIhi antigen-presenting cells of the deep cervical lymph nodes (DCLNs) and inguinal lymph nodes (ILNs) by flow cytometry. (a) Representative contour plots of DQ-OVA+ antigen-presenting cells in the DCLNs or ILNs at 6 wpi. CD11chiMHC IIhi cells were pre-gated on singlets/live/TCRβ-/NK1.1-/CD19-. (b) Quantification of frequency of DQ-OVA+ antigen-presenting cells in the DCLNs or ILNs at 6 wpi. Data are compiled from three experiments (n = 11 mice per group) and are represented as mean values ± s.e.m. Statistical significance was measured using randomized block ANOVA (two-way), with p<0.001 (***). (c–d) C57BL/6 mice were infected i.p. with 10 cysts of the ME49 strain of T. gondii and total number of activated CD4+ T cells (c) or activated CD8+ T cells (d) in the DCLNs or ILNs was quantified at multiple time points over the course of acute and chronic infection (red dots). The steady-state number of activated CD4+ and CD8+ T cells in the different lymph node compartments was measured in naïve mice at corresponding time points (black dots). Activated T cells displayed a CD44hiCD62Llo phenotype. Data are compiled from three experiments and are represented as mean values ± s.e.m. (n = 6-14 mice per group per timepoint). (e–f) C57BL/6 mice were infected i.p. with 1,000 tachyzoites of the Pru-OVA strain of T. gondii. (e) Total number of SIINFEKL-specific CD8+ T cells in the DCLNs or ILNs was quantified at multiple time points over the course of acute and chronic infection using tetramer reagent. Data are compiled from two experiments and are represented as mean values ± s.e.m. (n = 7 mice per timepoint). (f) Quantification of T. gondii gDNA in brain (red), dural meninges (orange), deep cervical lymph nodes (black), inguinal lymph nodes (blue), subcutaneous adipose tissue isolated from the flank (green), and quadriceps femoris skeletal muscle tissue (gray) by real-time PCR. Data are compiled from two experiments and are represented as mean values ± s.e.m. (n = 5-6 mice per tissue per timepoint). For (c–e), statistical significance of differences across time points in infected mice was measured using one-way ANOVA with post-hoc Tukey multiple comparison testing. p<0.05 (*) and p<0.01 (**). For (f) statistical analysis was performed using a two-way ANOVA with Tukey’s multiple comparison test to assess differences across timepoints. Statistically significant differences are indicated, with p<0.05 (*) and p<0.001 (***).
-
Figure 2—source data 1
CD4+ T cell activation in the DCLNs and ILNs over the course T. gondii infection.
- https://cdn.elifesciences.org/articles/80775/elife-80775-fig2-data1-v2.xlsx
-
Figure 2—source data 2
CD8+ T cell activation in the DCLNs and ILNs over the course of T. gondii infection.
- https://cdn.elifesciences.org/articles/80775/elife-80775-fig2-data2-v2.xlsx
-
Figure 2—source data 3
SIINFEKL-specific CD8+ T cell responses in the DCLNs and ILNs over the course of T. gondii infection.
- https://cdn.elifesciences.org/articles/80775/elife-80775-fig2-data3-v2.xlsx
-
Figure 2—source data 4
Parasite burden in the brain and peripheral tissues over the course of T. gondii infection.
- https://cdn.elifesciences.org/articles/80775/elife-80775-fig2-data4-v2.xlsx
Figure 2—figure supplement 1
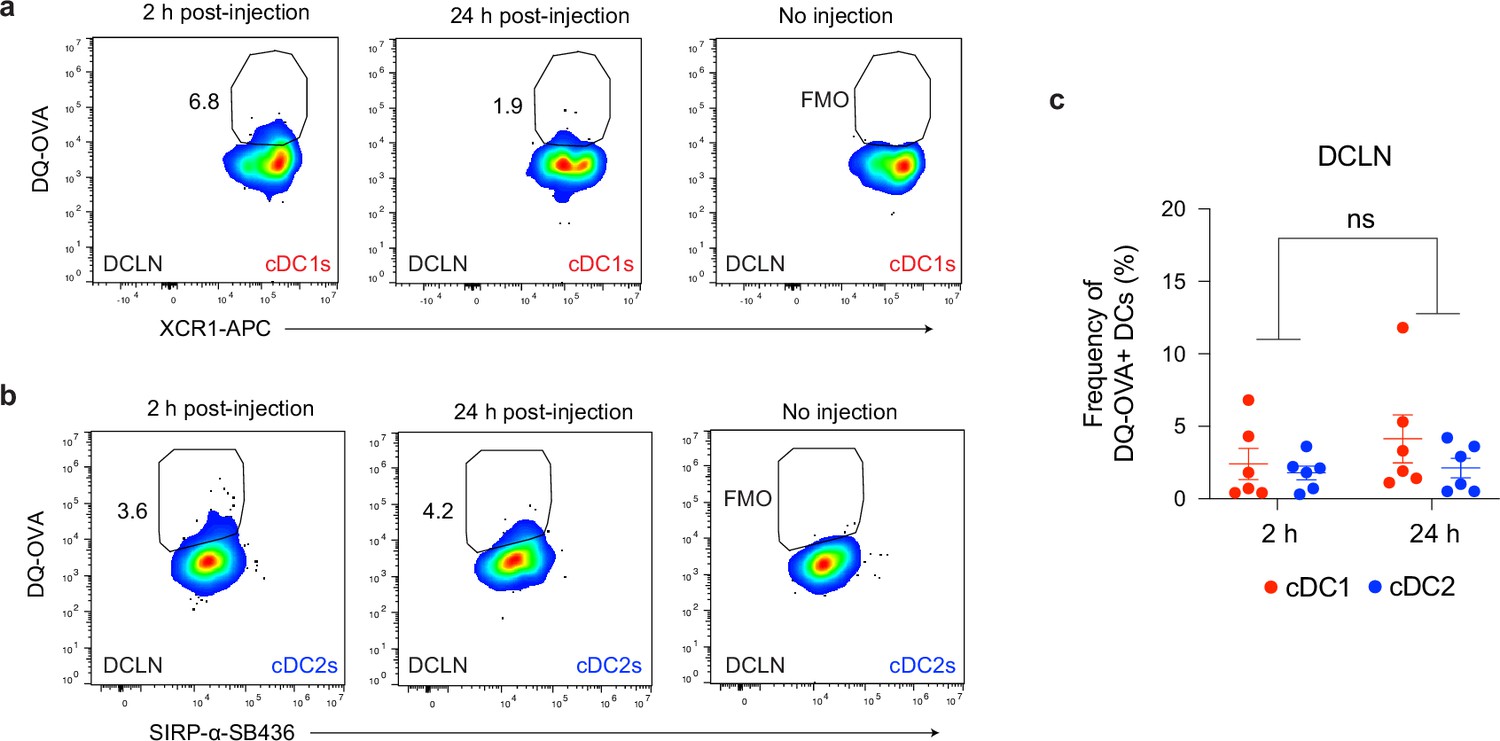
Uptake of cerebrospinal fluid-borne protein by cDC1s and cDC2s of the deep cervical lymph nodes during chronic brain infection.
(a–c) Representative dot plots showing fluorescent emission of proteolytically cleaved DQ-OVA in cDC1s (a) and cDC2s (b) of the deep cervical lymph nodes either 2 hr or 24 hr after i.c.m. injection into chronically infected mice, with quantification (c) of two pooled experiments (n = 6 mice per group). Statistical analysis was performed using two-way ANOVA, with Tukey’s multiple comparison testing to assess differences across timepoints (ns = not significant). Data are represented as mean values ± s.e.m.
Figure 2—figure supplement 2
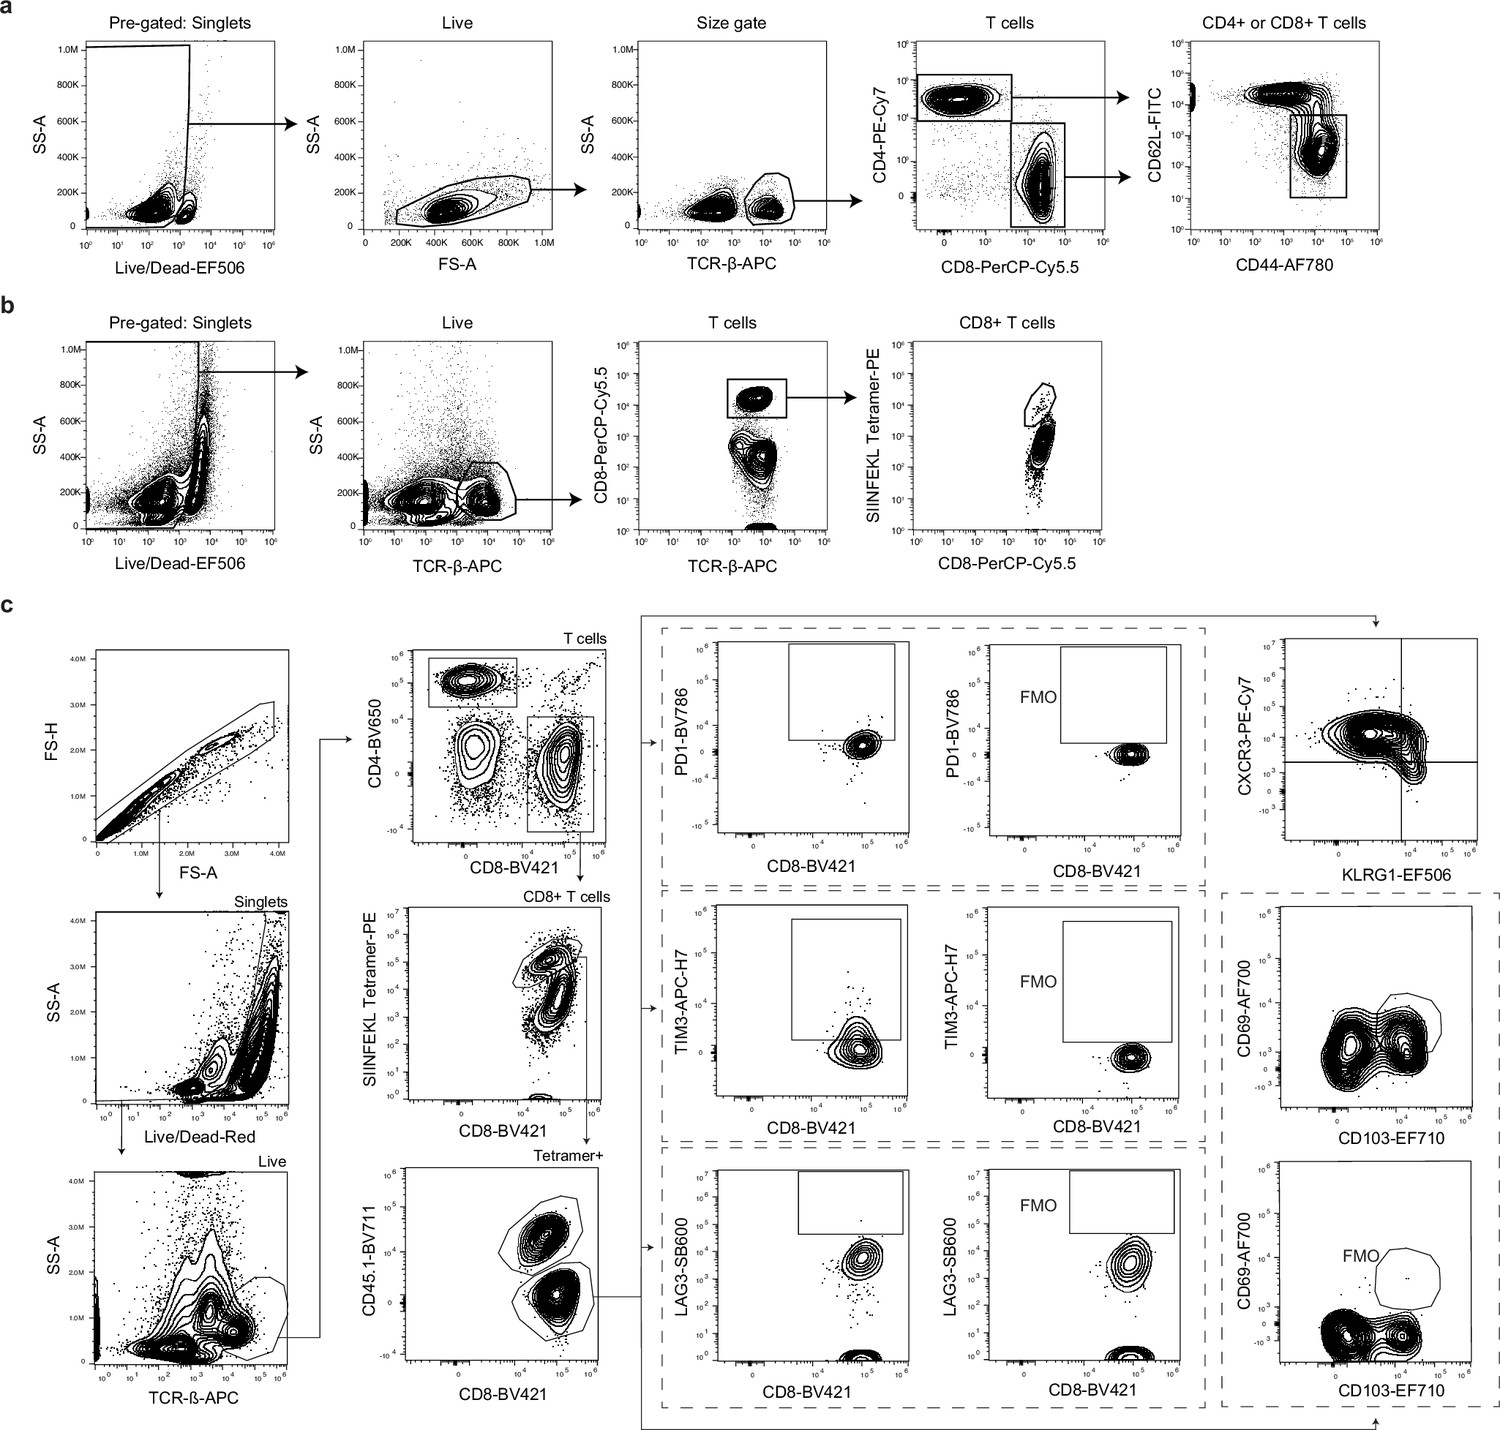
Gating strategy for CD4+ and CD8+ T cell responses following infection with ME49 or Pru-OVA.
(a) Gating strategy for identification of CD44hiCD62Llo (activated) CD4+ or CD8+ T cells in lymph nodes of mice infected with ME49. Pre-gated on singlets. (b) Gating strategy for identification of SIINFEKL-specific CD8+ T cells in lymph nodes of mice infected with Pru-OVA. Pre-gated on singlets. (c) Gating strategy for measuring expression of co-inhibitory molecules (PD-1, TIM-3, and LAG-3) and to assess the effector or memory-like status of CD45.1+ and CD45.1- SIINFEKL-specific CD8+ T cells.
Figure 2—figure supplement 3
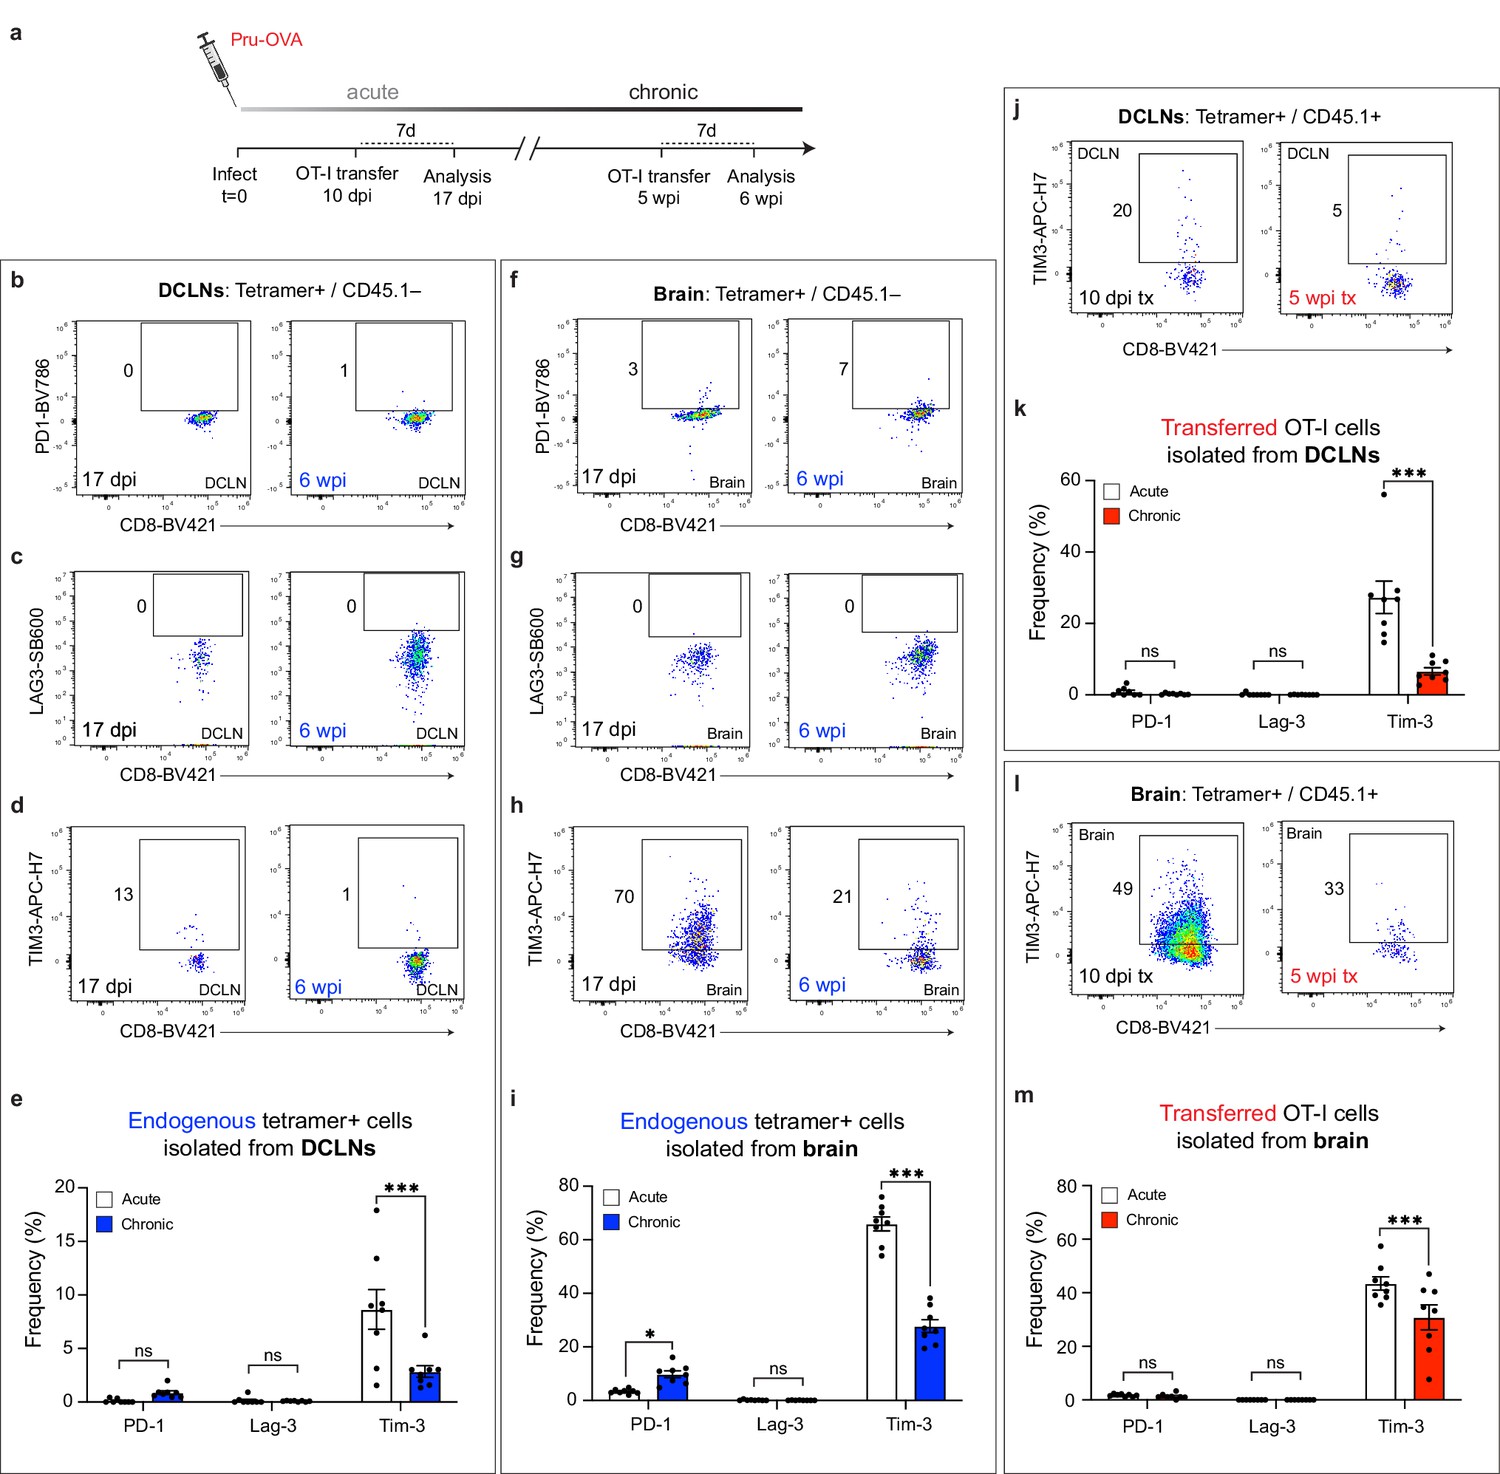
Co-inhibitory molecule expression of endogenous and transferred SIINFEKL-specific CD8+ T cells during acute and chronic infection.
C57BL/6 mice were infected with the OVA-secreting Pru strain of T. gondii (Pru-OVA). OT-I cells (CD45.1 congenic) were transferred intravenously during either acute or chronic infection, and tissues were analyzed seven days post-transfer. Endogenous (CD45.1-) and transferred (CD45.1+) SIINFEKL-specific CD8+ T cell populations were examined at both time points. (a) Shematic showing experimental design. (b–e) Representative dot plots showing PD-1 (b), LAG-3 (c), and TIM-3 (d) expression on endogenous (CD45.1-) SIINFEKL-specific CD8+ T cells in the deep cervical lymph nodes at acute and chronic time points, with quantification (e) of two pooled experiments (n = 8 mice per group). (f–i) Representative dot plots showing PD-1 (f), LAG-3 (g), and TIM-3 (h) expression on endogenous (CD45.1-) SIINFEKL-specific CD8+ T cells in the brain at acute and chronic time points, with quantification (i) of two pooled experiments (n = 8 mice per group). (j–k) Representative dot plots showing TIM-3 expression (j) on transferred (CD45.1+) OT-I cells in the deep cervical lymph nodes at acute and chronic time points, with quantification (k) of two pooled experiments (n = 8 mice per group). (l-m) Representative dot plots showing TIM-3 expression (l) on transferred (CD45.1+) OT-I cells in the brain at acute and chronic time points, with quantification (m) of two pooled experiments (n = 8 mice per group). For (e, i, k, and m) statistical analysis was performed using a two-way ANOVA, with Sidak’s multiple comparison test to assess for differences between time points. ns = not significant, p<0.05 (*) and p<0.001 (***). Data are represented as mean values ± s.e.m.
Figure 2—figure supplement 4
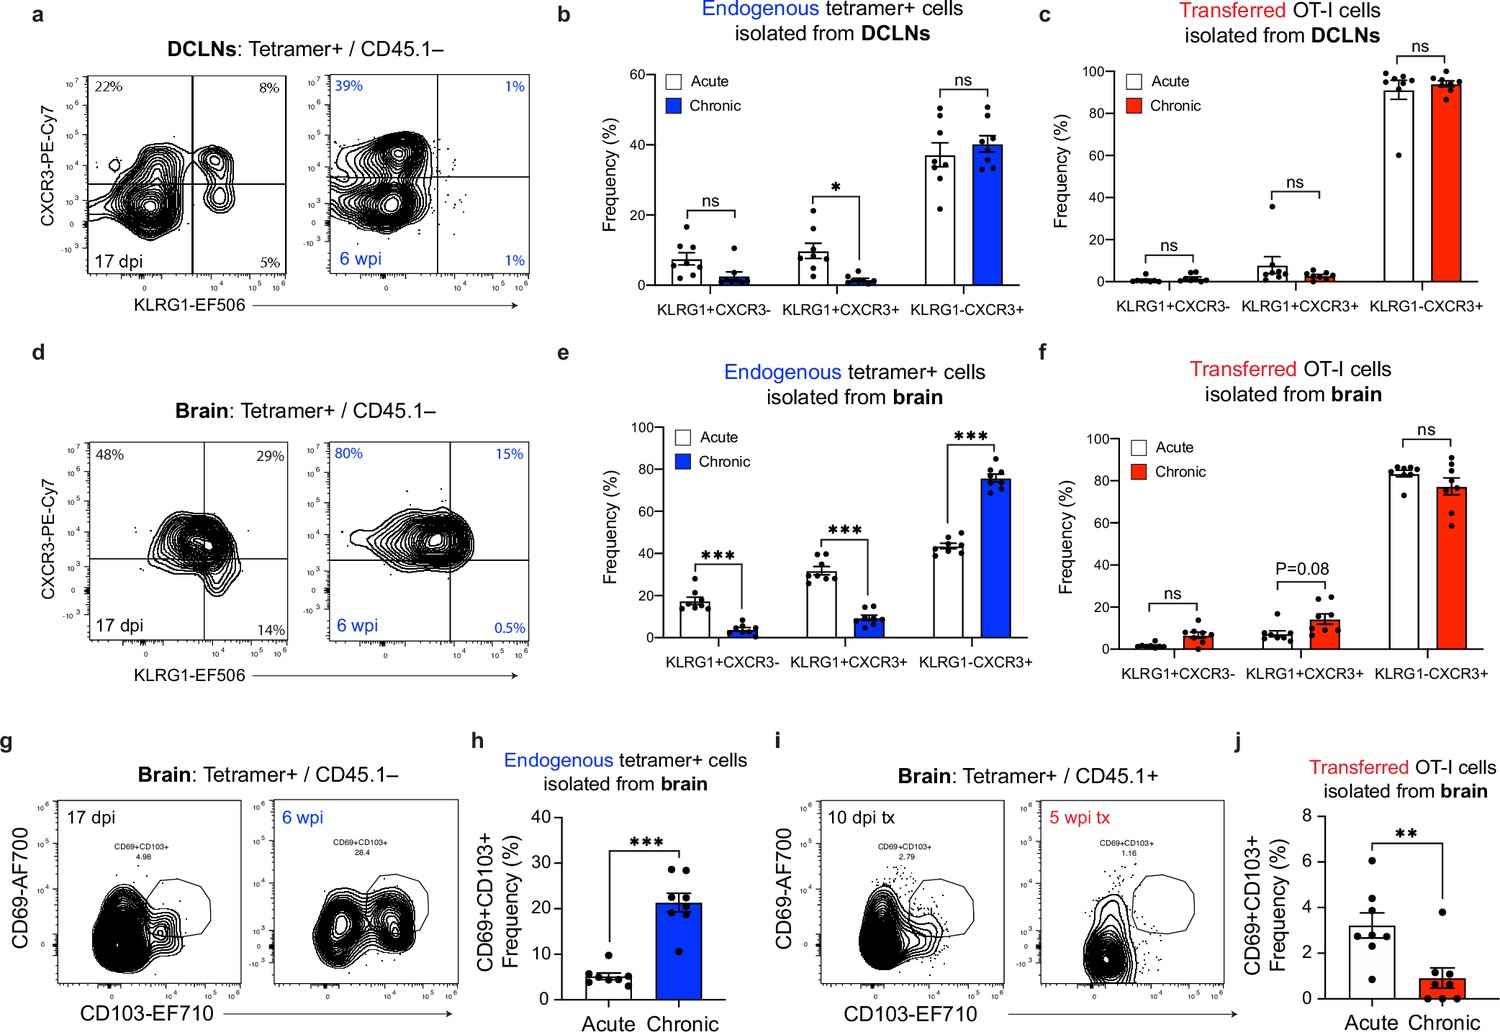
Effector or memory-like status of endogenous and transferred SIINFEKL-specific CD8+ T cells during acute and chronic infection.
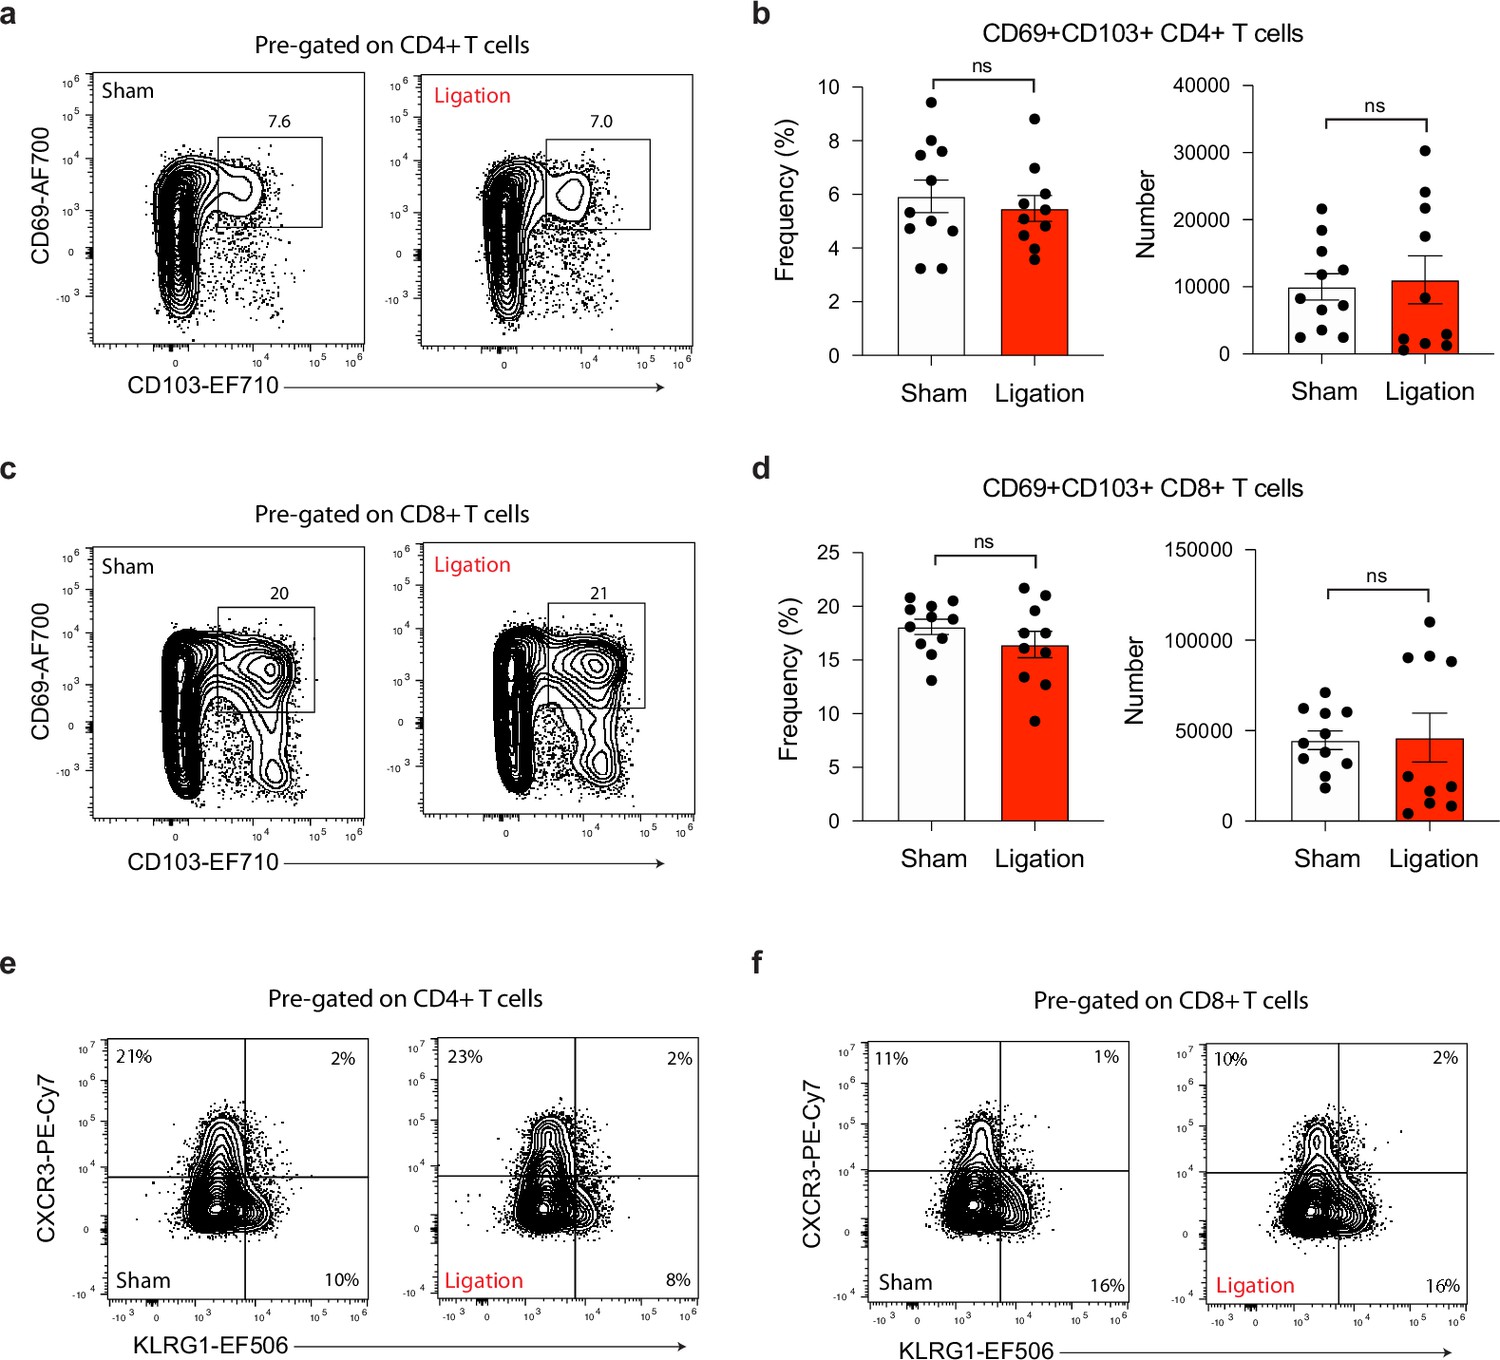
(a-b) Representative contour plots (a) showing effector (CXCR3-KLRG1+), intermediate (CXCR3+KLRG1+), and memory-like (CXCR3+KLRG1-) subsets of endogenous (CD45.1-) SIINFEKL-specific CD8+ T cells in the deep cervical lymph nodes at acute and chronic time points, with quantification (b) of two pooled experiments (n = 8 mice per group). (c) Quantification of frequency of effector (CXCR3-KLRG1+), intermediate (CXCR3+KLRG1+), and memory-like (CXCR3+KLRG1-) subsets of transferred (CD45.1+) OT-I cells isolated from the deep cervical lymph nodes at acute and chronic time points (two experiments pooled, n = 8 mice per group). (d-e) Representative contour plots (d) showing effector (CXCR3-KLRG1+), intermediate (CXCR3+KLRG1+), and memory-like (CXCR3+KLRG1-) subsets of endogenous (CD45.1-) SIINFEKL-specific CD8+ T cells in the brain at acute and chronic time points, with quantification (e) of two pooled experiments (n = 8 mice per group). (f) Quantification of frequency of effector (CXCR3-KLRG1+), intermediate (CXCR3+KLRG1+), and memory-like (CXCR3+KLRG1-) subsets of transferred (CD45.1+) OT-I cells isolated from the brain at acute and chronic time points (two experiments pooled, n = 8 mice per group). (g–h) Representative contour plots (g) showing the Trm-like (CD69+CD103+) subset of endogenous (CD45.1-) SIINFEKL-specific CD8+ T cells in the brain at acute and chronic time points, with quantification (h) of two pooled experiments (n = 8 mice per group). (i–j) Representative contour plots (i) showing the Trm-like (CD69+CD103+) subset of transferred (CD45.1+) OT-I cells isolated from the brain at acute and chronic time points, with quantification (j) of two pooled experiments (n = 8 mice per group). For (b, c, e, and f) statistical analysis was performed using a two-way ANOVA, with Sidak’s multiple comparison test to assess for differences between time points and ns = not significant, p<0.05 (*), and p<0.001 (***). For (h and j) statistical significance was measured using randomized block ANOVA (two-way), with p<0.01 (**) and p<0.001 (***). Data are represented as mean values ± s.e.m.
Figure 3 with 1 supplement
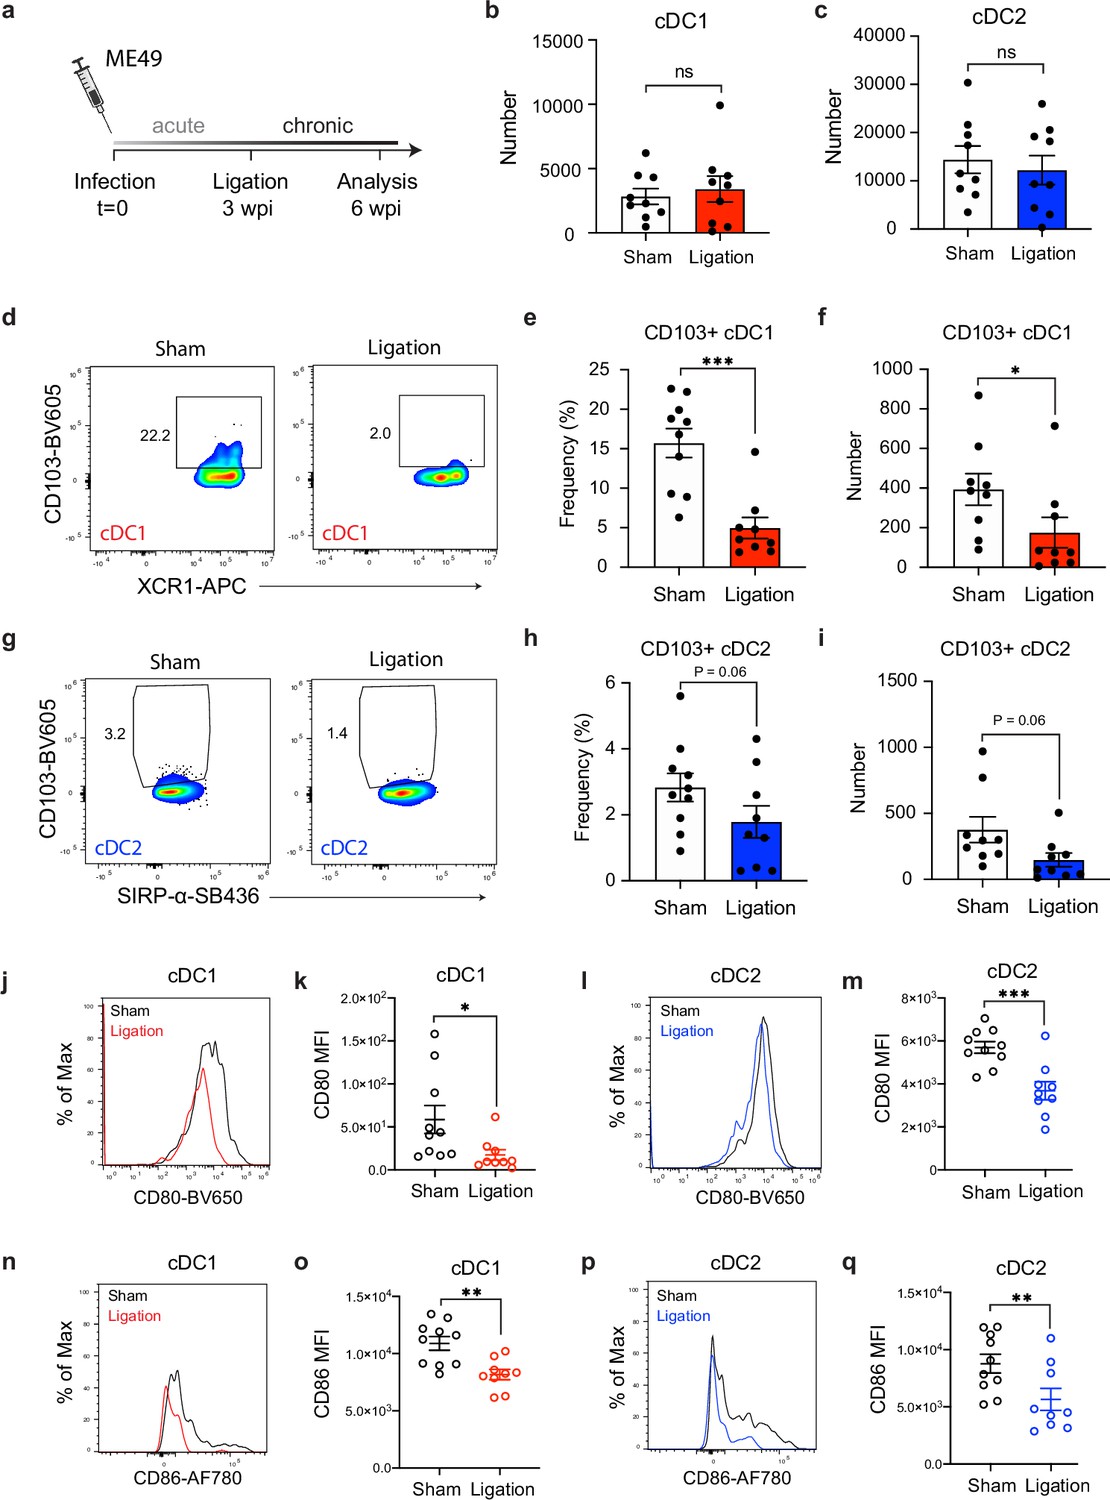
Restricting meningeal lymphatic drainage disrupts dendritic cell activation in the deep cervical lymph nodes.
Chronically infected C57BL/6 mice were subjected to surgical ligation of collecting vessels afferent to the DCLNs or sham surgery. (a) Experimental design for ligation studies in C57BL/6 mice. (b–c) Quantification by spectral flow cytometry of total cDC1 (b) and cDC2 (c) number observed in the DCLNs three weeks after ligation or sham surgery. Data are compiled from two experiments (n = 9 mice per group). (d-f) Representative dot plots (d) showing frequency of CD103+ cDC1s in the DCLNs three weeks after ligation or sham surgery, with quantification of frequency (e) and number (f) compiled from two independent experiments (n = 9-10 mice per group). (g–i) Representative dot plots (g) showing frequency of CD103+ cDC2s in the DCLNs three weeks after ligation or sham surgery, with quantification of frequency (h) and number (i) compiled from two independent experiments (n = 9-10 mice per group). (j–k), Representative flow histograms showing expression of CD80 by cDC1s in the DCLNs 3 weeks after ligation or sham surgery (j) and quantification of the geometric mean fluorescence intensity (k). Data compiled from two experiments (n = 9-10 mice per group). l-m, Representative flow histograms showing expression of CD80 by cDC2s in the DCLNs 3 weeks after ligation or sham surgery (l) and quantification of the geometric mean fluorescence intensity (m). Data compiled from two experiments (n = 9-10 mice per group). (n–o) Representative flow histograms showing expression of CD86 by cDC1s in the DCLNs 3 weeks after ligation or sham surgery (n) and quantification of the geometric mean fluorescence intensity (o). Data compiled from two experiments (n = 9-10 mice per group). (p–q) Representative flow histograms showing expression of CD86 by cDC2s in the DCLNs 3 weeks after ligation or sham surgery (p) and quantification of the geometric mean fluorescence intensity (q). Data compiled from two experiments (n = 9-10 mice per group). Data are represented as mean values ± s.e.m. and statistical significance was measured using randomized block ANOVA (two-way), with ns = not significant, p<0.05 (*), p<0.01 (**), and p<0.001 (***).
Figure 3—figure supplement 1
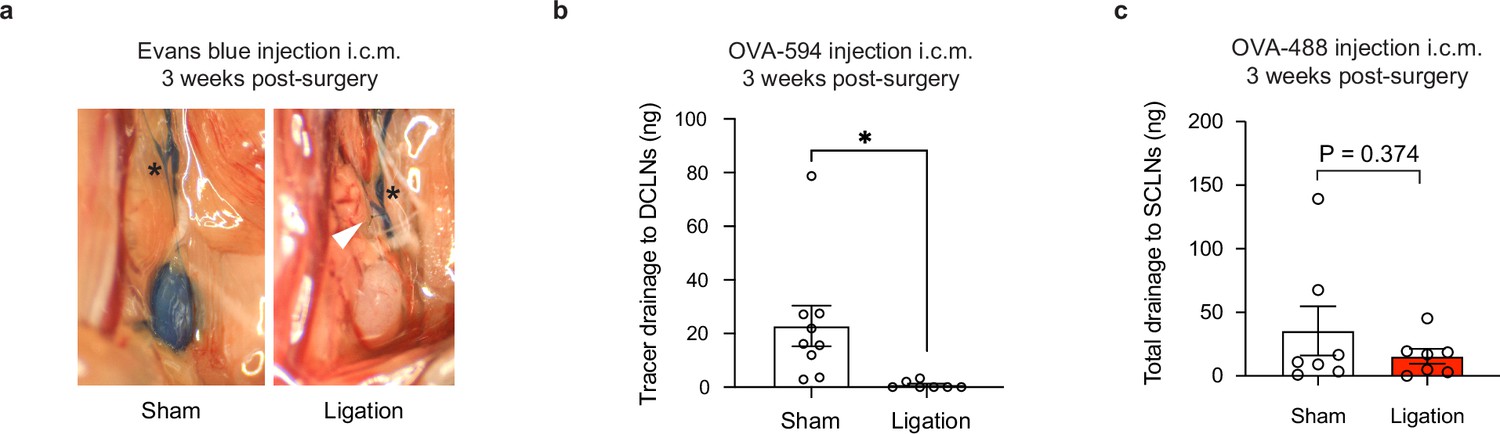
Tracer studies confirm disruption of meningeal lymphatic drainage to the deep cervical lymph nodes by ligation surgery.
Chronically infected C57BL/6 mice were subjected to surgical ligation of collecting vessels afferent to the DCLNs or sham surgery. (a) Representative image of Evans blue dye drainage to the DCLNs 1 hr after i.c.m. injection of ligated or sham-operated mice. Suture placement is indicated by a white arrow (right). CSF-derived dye flows through collecting lymphatic vessels of ligated and sham-operated mice (asterisks) but only reaches the DCLNs of sham-operated mice (left). Two independent experiments were performed. (b) Quantification of OVA-AF594 protein tracer accumulation in lysates of DCLNs of ligated or sham-operated mice 2 hr after i.c.m. injection by fluorescence spectroscopy. Data are compiled from two experiments (n = 7-9 mice per group). (c) Quantification of OVA-AF488 protein tracer accumulation in lysates of superficial cervical lymph nodes (SCLN) of ligated or sham-operated mice 2 hr after i.c.m. injection by fluorescence spectroscopy. Data are compiled from two experiments (n = 7 mice per group). Statistical significance was measured using randomized block ANOVA (two-way), with p<0.05 (*). Data are represented as mean values ± s.e.m.
Figure 4 with 2 supplements

Restricting meningeal lymphatic drainage disrupts T cell activation, proliferation, and cytokine production in the deep cervical lymph nodes.
Chronically infected C57BL/6 mice were subjected to surgical ligation of collecting vessels afferent to the DCLNs or sham surgery. (a–b) Quantification by flow cytometry of the number of CD69-expressing CD4+ T cells (a) or CD8+ T cells (b) in the DCLNs 3 weeks after ligation or sham surgery. Data are compiled from four experiments (n = 18-22 mice per group). (c–d) Representative dot plots (c) and total number (d) of CD69-expressing SIINFEKL-specific CD8+ T cells in the DCLNs 3 weeks after ligation or sham surgery of mice infected with Pru-OVA. Data are compiled from four experiments (n = 18 mice per group). (e–f) Representative contour plots (e) and average frequency (f) of Ki67-expressing CD4+ T cells in the DCLNs 3 weeks after ligation or sham surgery. Data are compiled from two experiments (n = 10-11 mice per group). (g–h) Representative contour plots (g) and average frequency (h) of Ki67-expressing CD8+ T cells in the DCLNs 3 weeks after ligation or sham surgery. Data are compiled from two experiments (n = 9-11 mice per group). (i–q) Intracellular staining of IFN-γ and TNF-α was performed on cells isolated from the DCLNs of ligated or sham-operated mice 24 hr after ex vivo restimulation with soluble tachyzoite antigen (STAg) or media alone (no STAg). Representative contour plots show expression of IFN-γ by CD4+ T cells following STAg restimulation (i) or in the presence of media alone (j), with quantification of the frequency of IFN-γ+ CD4+ T cells following STAg restimulation (k) (four experiments, n = 17-20 mice per group). Representative contour plots show expression of IFN-γ by CD8+ T cells following STAg restimulation (l) or in the presence of media alone (m), with quantification of the frequency of IFN-γ+ CD8+ T cells following STAg restimulation (n) (three experiments, n = 13-15 mice per group). Representative contour plots show expression of TNF-α by CD4+ T cells following STAg restimulation (o) or in the presence of media alone (p), with quantification of the frequency of TNF-α+ CD4+ T cells following STAg restimulation (q) (four experiments, n = 17-20 mice per group). Statistical significance was measured using randomized block ANOVA (two-way), with p<0.05 (*), p<0.01 (**), and p<0.001 (***). Data are represented as mean values ± s.e.m.
Figure 4—figure supplement 1
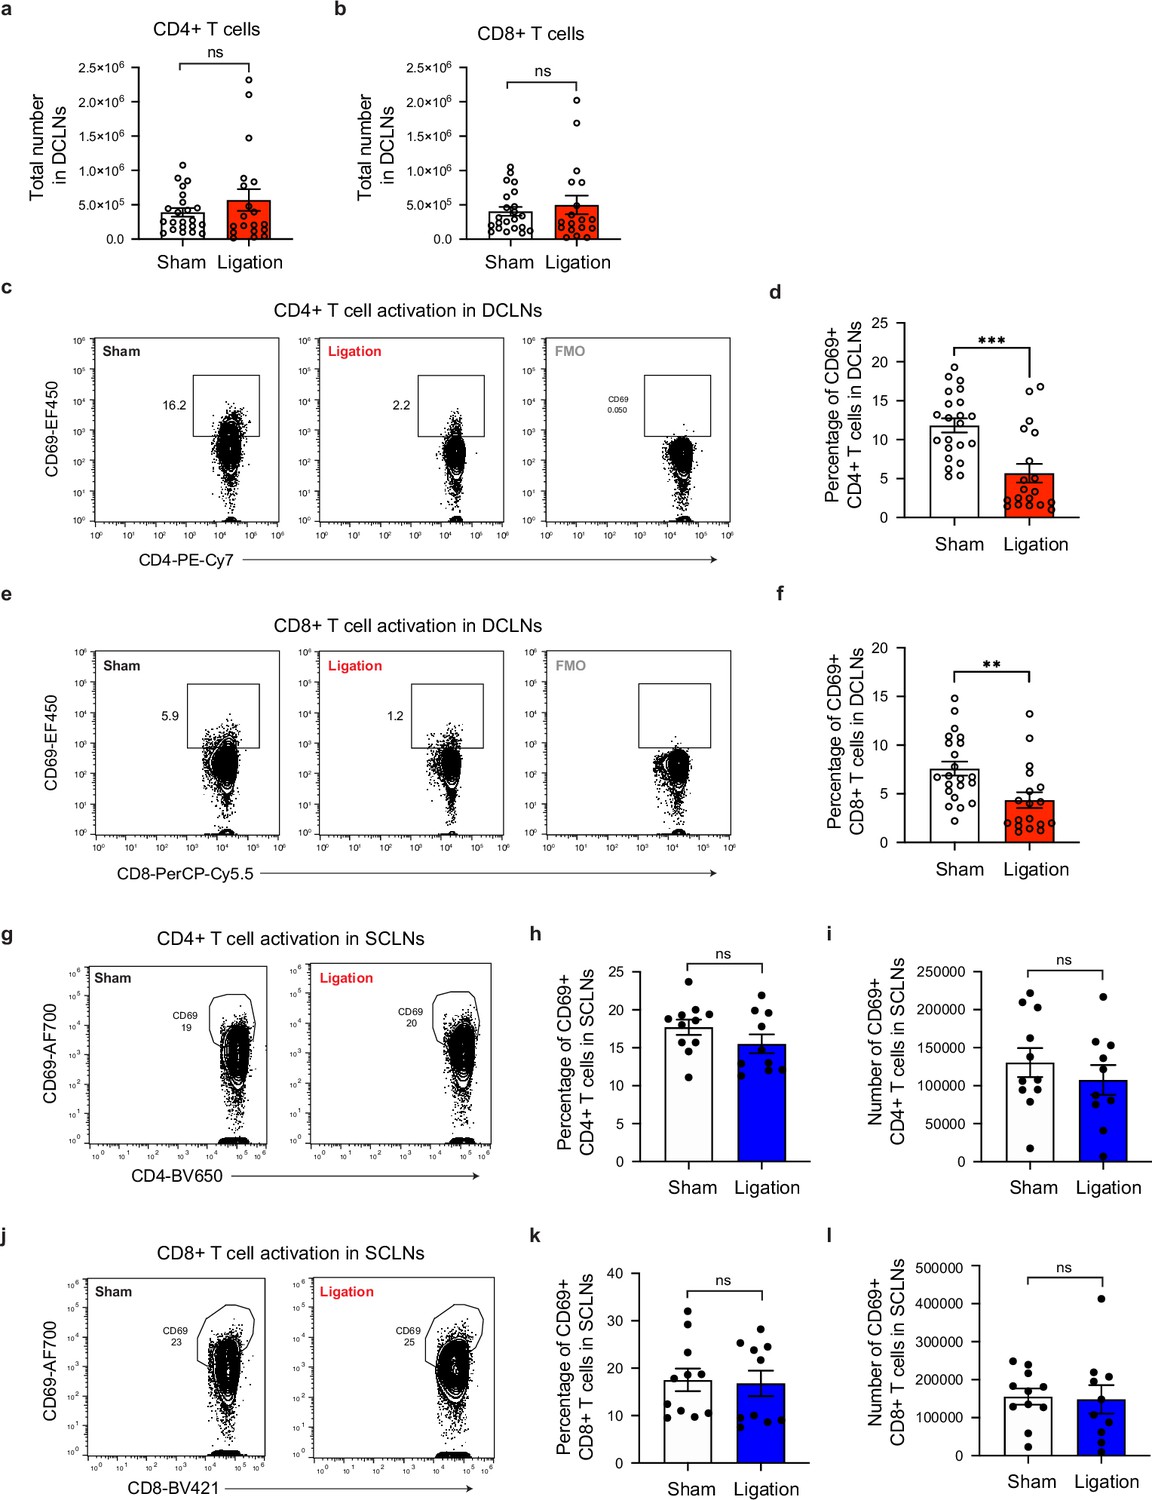
Restricting meningeal lymphatic drainage impairs T cell activation in the deep cervical lymph nodes without affecting T cell activation in the superficial cervical lymph nodes.
Chronically infected C57BL/6 mice were subjected to surgical ligation of collecting vessels afferent to the DCLNs or sham surgery. (a–b) Quantification by flow cytometry of total CD4+ (a) and CD8+ (b) T cell number in the DCLNs 3 weeks after ligation or sham surgery. Data compiled from four experiments (n = 18-22 mice per group). (c–d), Representative contour plots (c) and average frequency (d) of CD69-expressing CD4+ T cells in the DCLNs of ligated or sham-operated mice (four experiments, n = 19-22 mice per group). (e–f) Representative contour plots (e) and average frequency (f) of CD69-expressing CD8+ T cells in the DCLNs of ligated or sham-operated mice (four experiments, n = 18-22 mice per group). (g–i) Representative contour plots (g), average frequency (h), and total number (i) of CD69-expressing CD4+ T cells in the superficial cervical lymph nodes (SCLNs) 3 weeks after ligation or sham surgery. Data are compiled from two experiments (n = 10-11 mice per group). (j–l) Representative contour plots (j), average frequency (k), and total number (l) of CD69-expressing CD8+ T cells in the SCLNs 3 weeks after ligation or sham surgery. Data are compiled from two experiments (n = 10-11 mice per group). Statistical significance was measured using randomized block ANOVA (two-way), with ns = not significant, p<0.01 (**), and p<0.001 (***). Data are represented as mean values ± s.e.m.
Figure 4—figure supplement 2
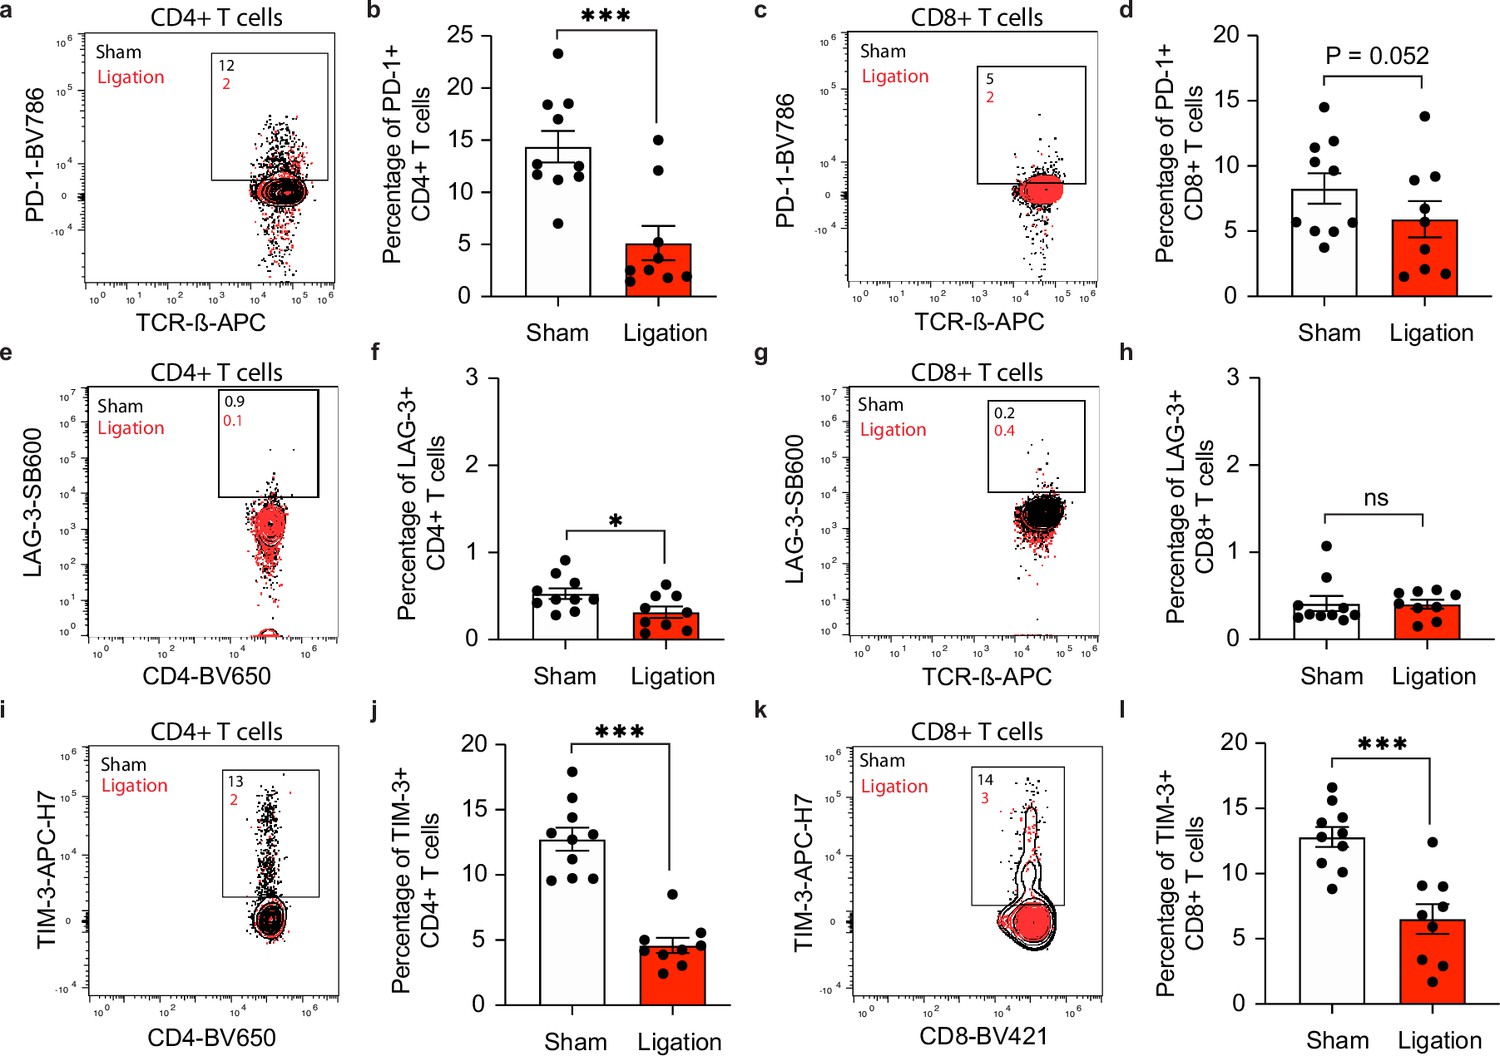
Restricting meningeal lymphatic drainage disrupts co-inhibitory molecule upregulation on T cells in the deep cervical lymph nodes.
Chronically infected C57BL/6 mice were subjected to surgical ligation of collecting vessels afferent to the DCLNs or sham surgery. (a–b) Representative contour plots (a) and average frequency (b) of PD-1-expressing CD4+ T cells in the DCLNs 3 weeks after ligation or sham surgery. (c–d) Representative contour plots (c) and average frequency (d) of PD-1-expressing CD8+ T cells in the DCLNs 3 weeks after ligation or sham surgery. (e–f) Representative contour plots (e) and average frequency (f) of LAG-3-expressing CD4+ T cells in the DCLNs 3 weeks after ligation or sham surgery. (g–h) Representative contour plots (g) and average frequency (h) of LAG-3-expressing CD8+ T cells in the DCLNs 3 weeks after ligation or sham surgery. (i–j) Representative contour plots (i) and average frequency (j) of TIM-3-expressing CD4+ T cells in the DCLNs 3 weeks after ligation or sham surgery. (k–l) Representative contour plots (k) and average frequency (l) of TIM-3-expressing CD8+ T cells in the DCLNs 3 weeks after ligation or sham surgery. Data are compiled from two experiments (n = 9-10 mice per group). Statistical significance was measured using randomized block ANOVA (two-way), with ns = not significant, p<0.05 (*) and p<0.001 (***). Data are represented as mean values ± s.e.m.
Figure 5 with 4 supplements
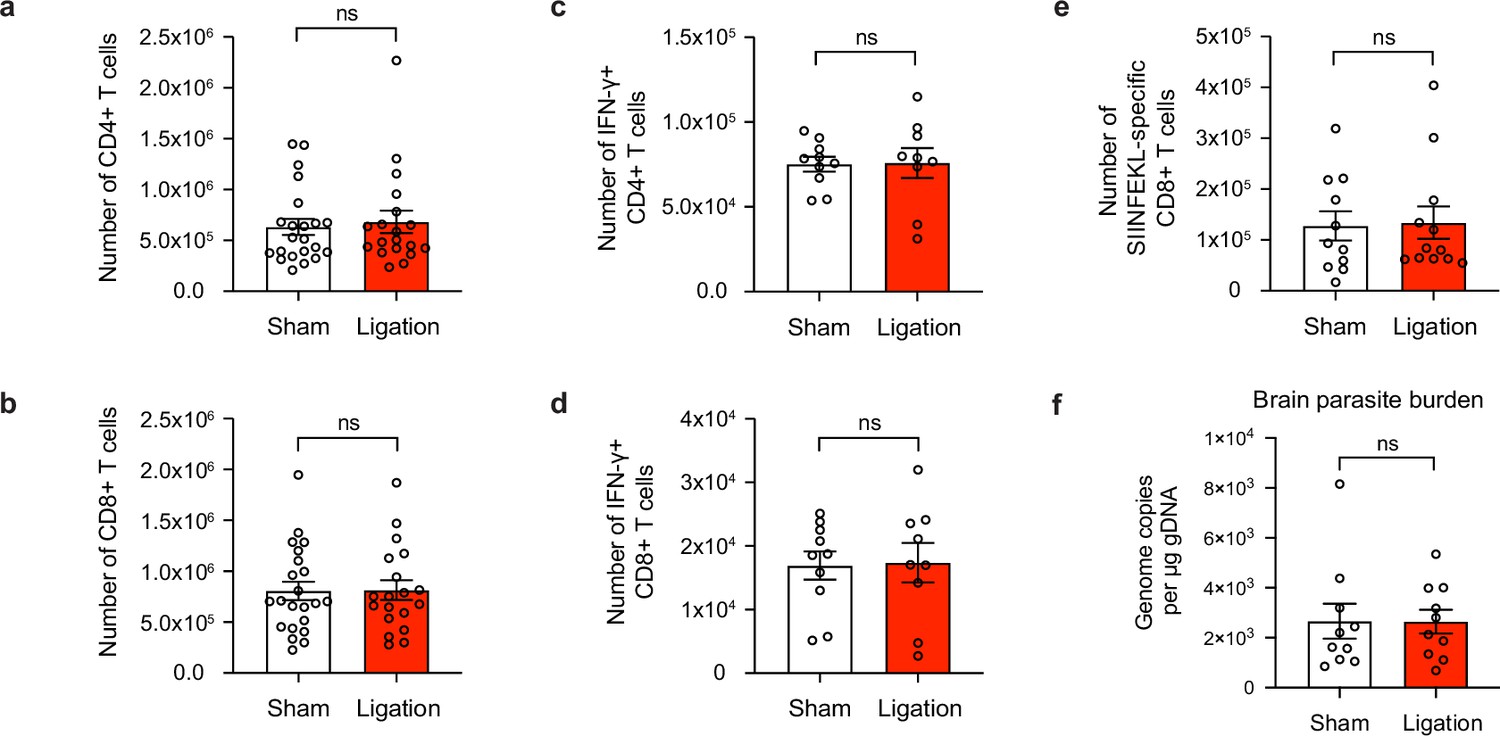
Meningeal lymphatic drainage is dispensable for host-protective T cell responses in the brain.
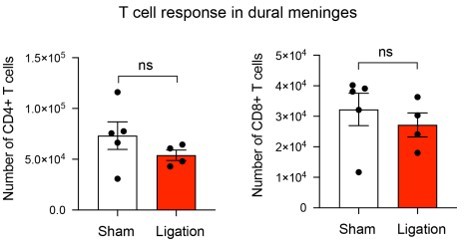
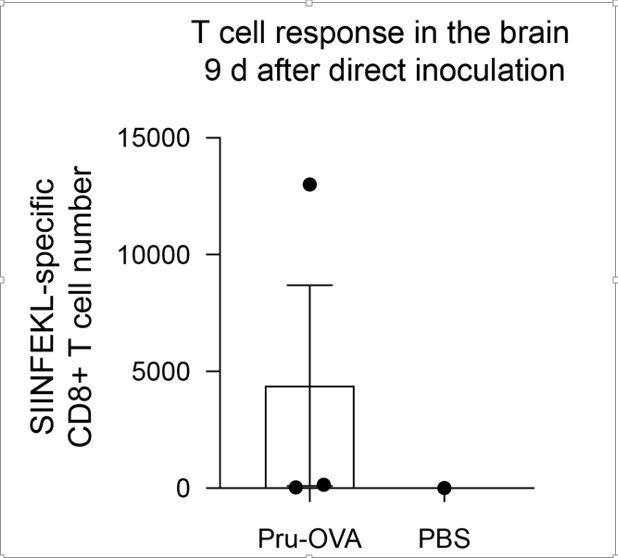
Chronically infected C57BL/6 mice were subjected to surgical ligation of collecting vessels afferent to the DCLNs or sham surgery. (a–b), Quantification by flow cytometry of the number of infiltrating CD4+ T cells (a) and CD8+ T cells (b) in the brain tissue of ligated or sham-operated mice. Data are compiled from four experiments (n = 19-22 mice per group). (c–d), Intracellular staining of IFN-γ was performed on mononuclear cells isolated from brains of ligated or sham-operated mice 24 hr after ex vivo restimulation with soluble tachyzoite antigen (STAg). Total number of CD4+ T cells (c) and CD8+ T cells (d) expressing IFN-γ after STAg restimulation are shown. Data are compiled from two experiments (n = 9-10 mice per group). (e), Quantification by flow cytometry of the number of SIINFEKL-specific CD8+ T cells in the brain tissue of ligated or sham-operated mice chronically infected with Pru-OVA. Data are compiled from three experiments (n = 11-12 mice per group). (f), Quantification of T. gondii gDNA in the brain tissue of ligated or sham-operated mice by real-time PCR. Data are compiled from two experiments (n = 10 mice per group). Statistical significance was measured using randomized block ANOVA (two-way), with ns = not significant. Data are represented as mean values ± s.e.m.
Figure 5—figure supplement 1
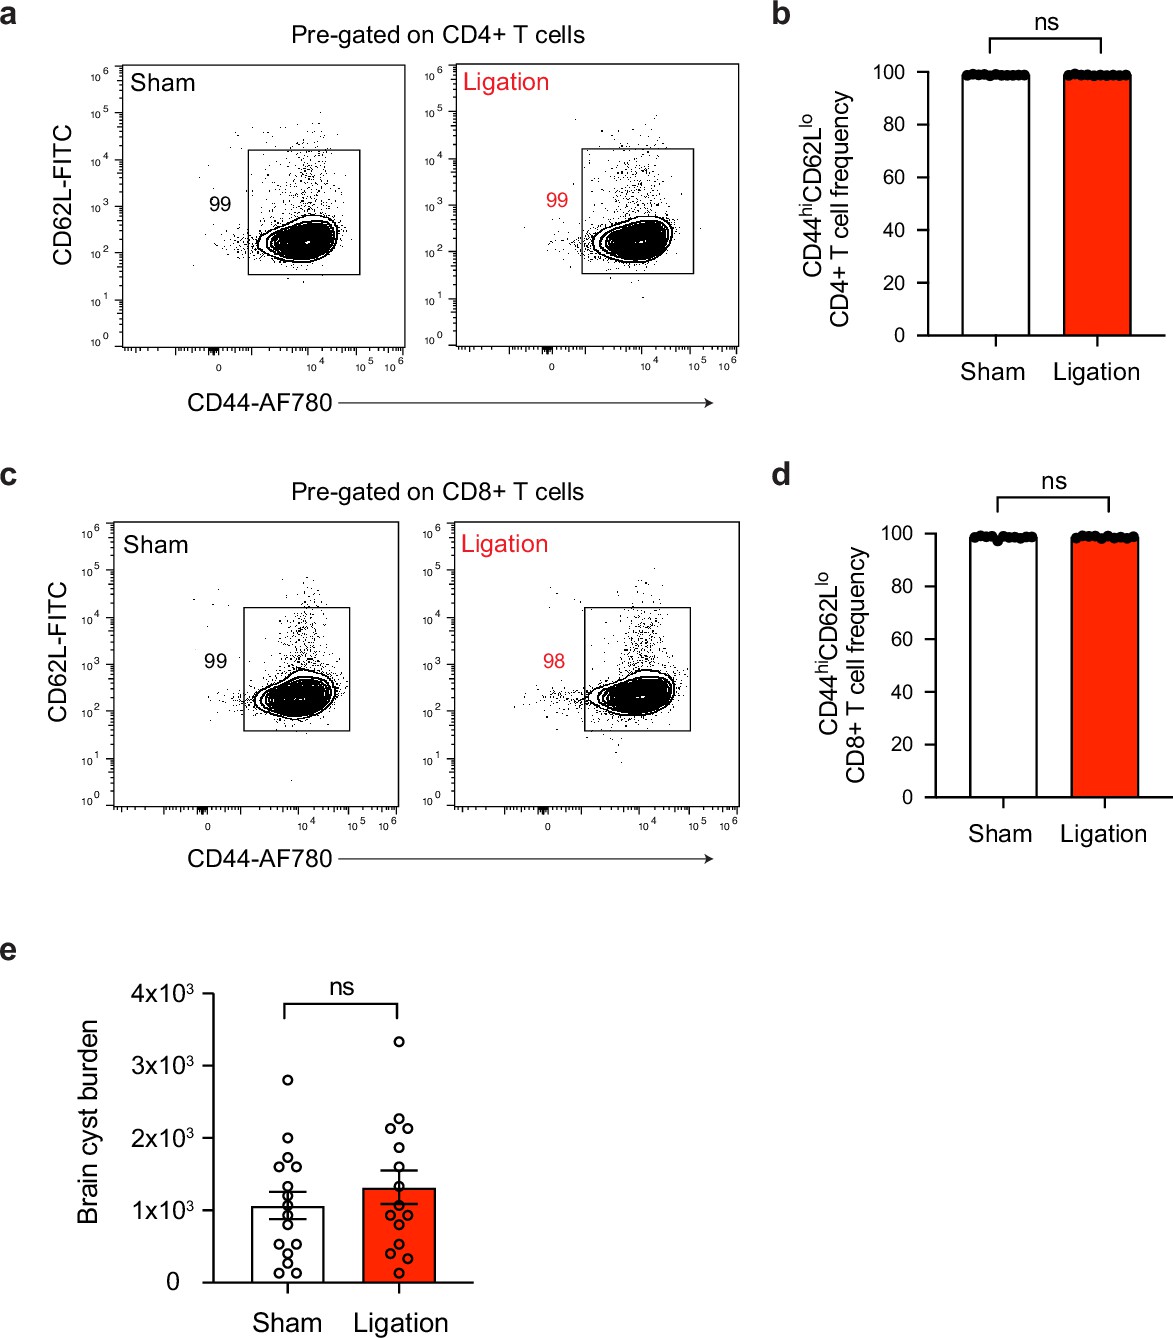
T cell activation and cyst burden are unaffected in the brain after ligation.
Chronically infected C57BL/6 mice were subjected to surgical ligation of collecting vessels afferent to the DCLNs or sham surgery. (a–b) Representative contour plots (a) and average frequency (b) of CD44hiCD62Llo CD4+ T cells in the brain tissue of ligated or sham-operated mice (two experiments pooled, n = 10-11 mice per group). (c–d) Representative contour plots (c) and average frequency (d) of CD44hiCD62Llo CD8+ T cells in the brain tissue of ligated or sham-operated mice (two experiments pooled, n = 10-11 mice per group). (e) Quantification of parasite burden by enumeration of tissue cysts in brain homogenate of ligated or sham-operated mice. Data are compiled from three experiments (n = 15-16 mice per group). Statistical significance was measured using randomized block ANOVA (two-way), with ns = not significant. Data are represented as mean values ± s.e.m.
Figure 5—figure supplement 2
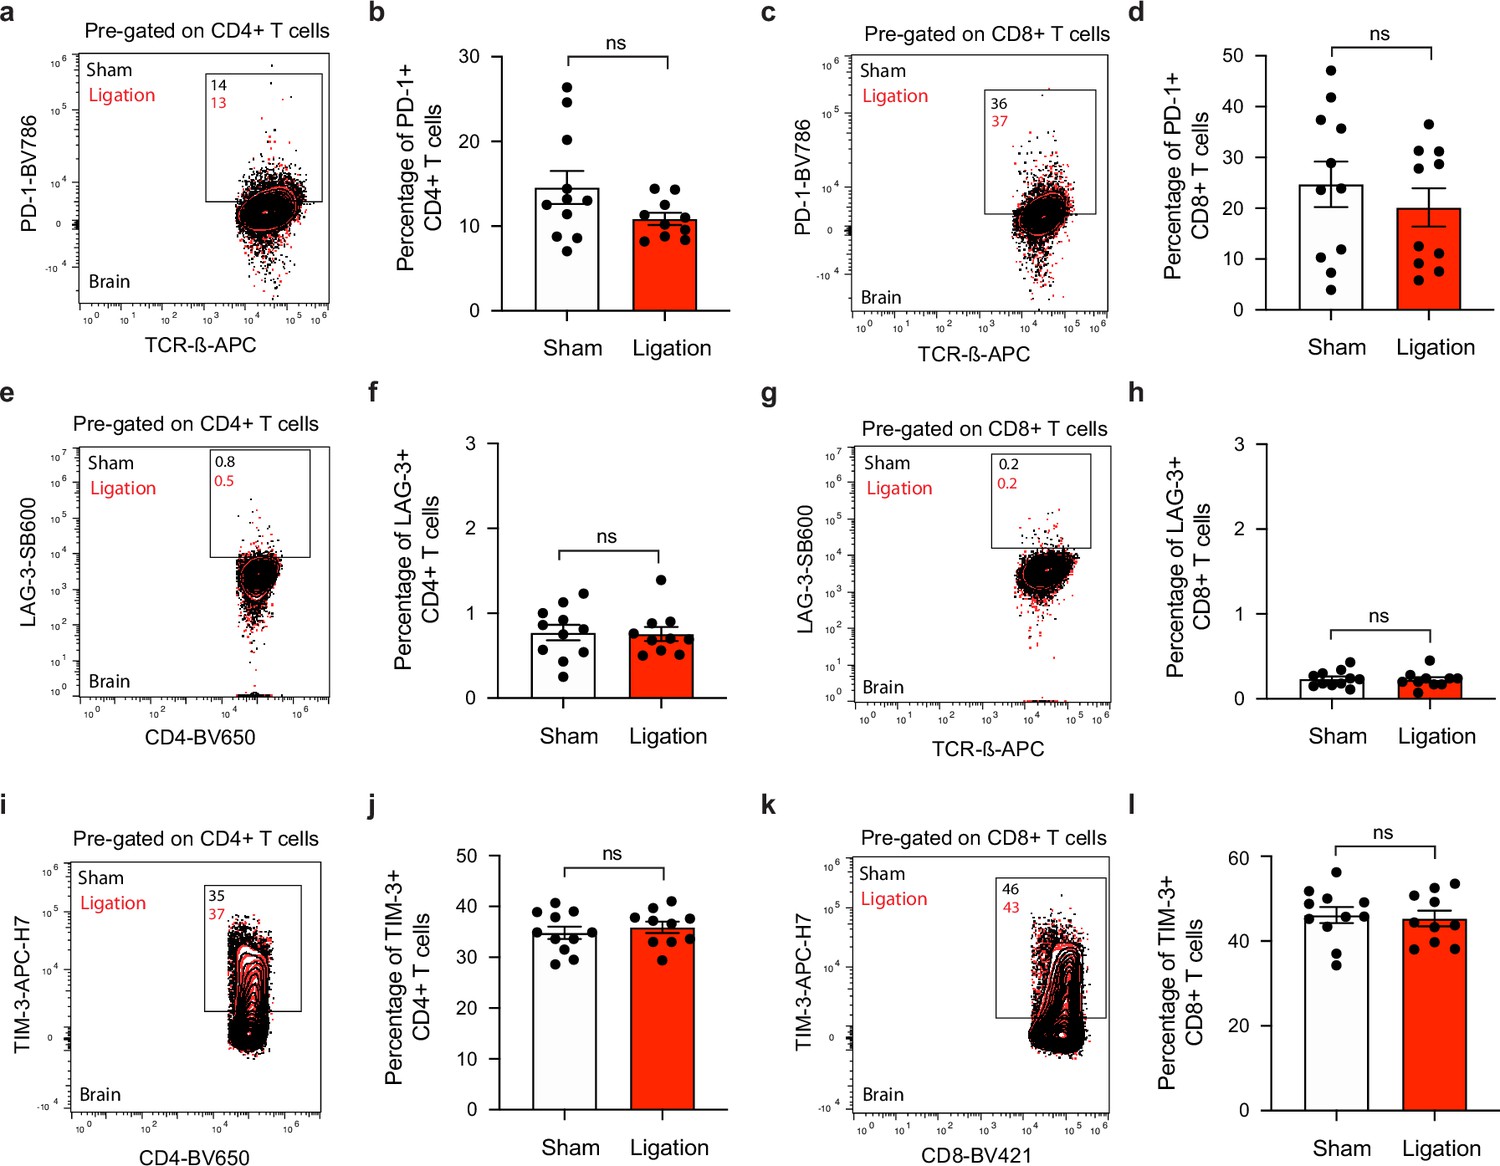
T cells express similar levels of co-inhibitory molecules in the brain after ligation.
Chronically infected C57BL/6 mice were subjected to surgical ligation of collecting vessels afferent to the DCLNs or sham surgery. (a–b) Representative contour plots (a) and average frequency (b) of PD-1-expressing CD4+ T cells in the brain 3 weeks after ligation or sham surgery. (c–d) Representative contour plots (c) and average frequency (d) of PD-1-expressing CD8+ T cells in the brain 3 weeks after ligation or sham surgery. (e–f) Representative contour plots (e) and average frequency (f) of LAG-3-expressing CD4+ T cells in the brain 3 weeks after ligation or sham surgery. (g–h) Representative contour plots (g) and average frequency (h) of LAG-3-expressing CD8+ T cells in the brain 3 weeks after ligation or sham surgery. (i–j) Representative contour plots (i) and average frequency (j) of TIM-3-expressing CD4+ T cells in the brain 3 weeks after ligation or sham surgery. (k–l) Representative contour plots (k) and average frequency (l) of TIM-3-expressing CD8+ T cells in the brain 3 weeks after ligation or sham surgery. Data are compiled from two independent experiments (n = 10-11 mice per group). Statistical significance was measured using randomized block ANOVA (two-way), with ns = not significant. Data are represented as mean values ± s.e.m.
Figure 5—figure supplement 3
Ligation does not affect effector or memory-like status of T cells in the brain.
Chronically infected C57BL/6 mice were subjected to surgical ligation of collecting vessels afferent to the DCLNs or sham surgery. (a–b) Representative contour plots (a) and average frequency and number (b) of Trm-like (CD69+CD103+) CD4+ T cells in the brain 3 weeks after ligation or sham operation. Data compiled from two experiments (n = 10-11 mice per group). (c–d) Representative contour plots (c) and average frequency and number (d) of Trm-like (CD69+CD103+) CD8+ T cells in the brain 3 weeks after ligation or sham operation. Data compiled from two experiments (n = 10-11 mice per group). (e–f) Representative contour plots showing effector (CXCR3-KLRG1+), intermediate (CXCR3+KLRG1+), and memory-like (CXCR3+KLRG1-) subsets of CD4+ T cells (e) and CD8+ T cells (f) in the brain 3 weeks after ligation or sham surgery. Data compiled from two experiments (n = 10-11 mice per group). Statistical significance was measured using randomized block ANOVA (two-way), with ns = not significant. Data are represented as mean values ± s.e.m.
Figure 5—figure supplement 4
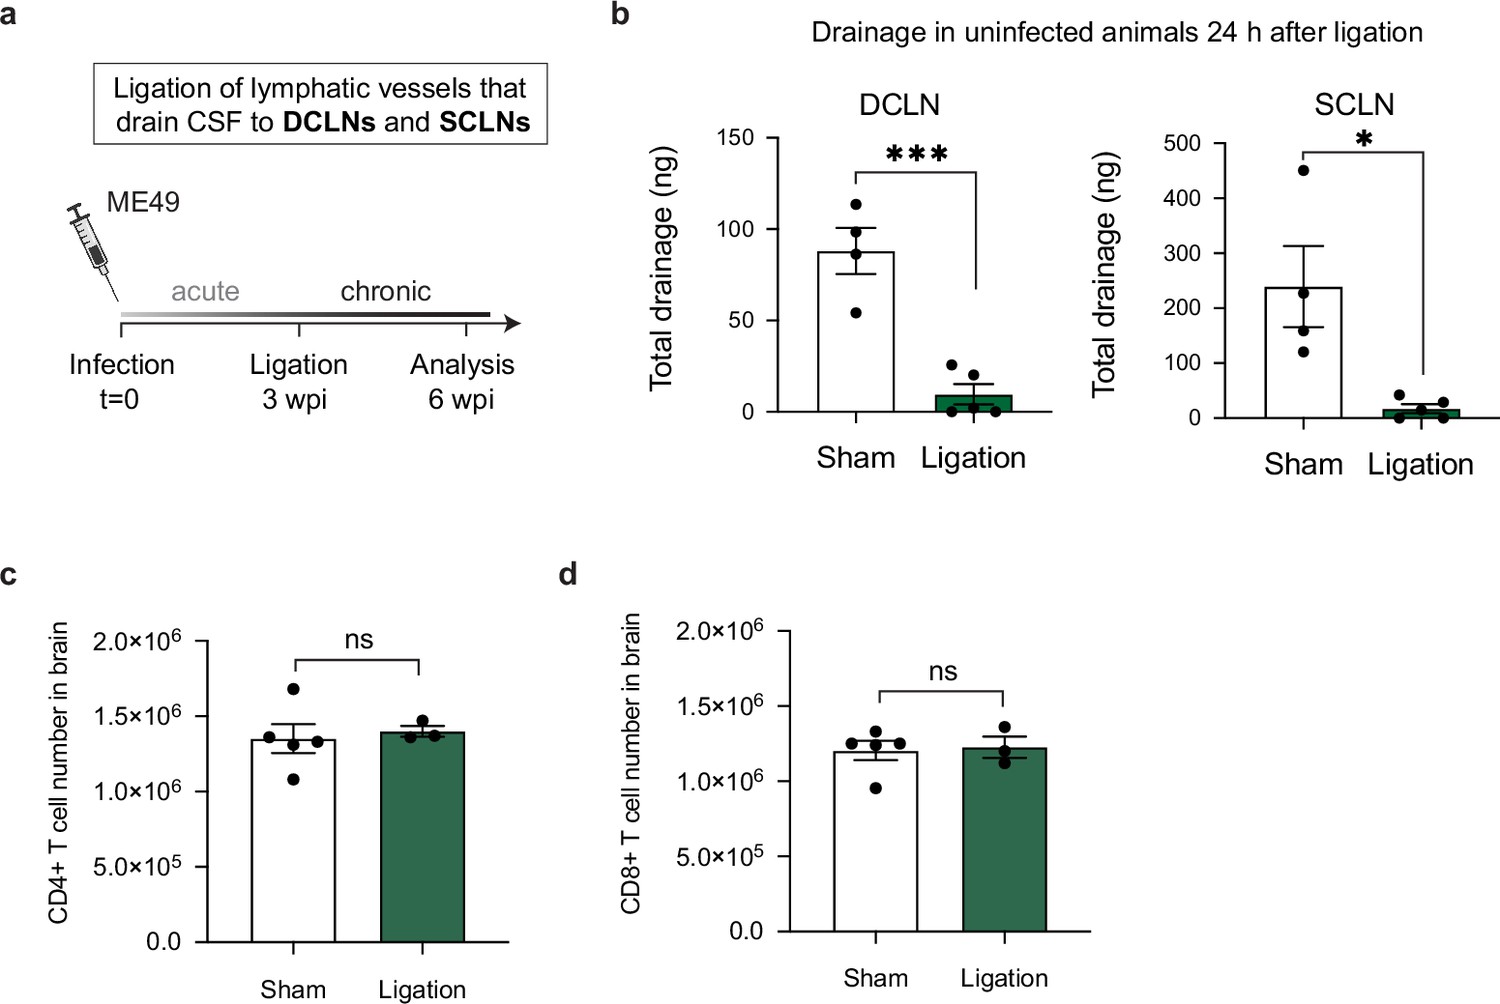
Restricting meningeal lymphatic drainage to the DCLNs and SCLNs does not affect the magnitude of the T cell response in the brain.
Chronically infected C57BL/6 mice were subjected to surgical ligation of collecting vessels that drain cerebrospinal fluid to the deep cervical lymph nodes (DCLNs) and to the superficial cervical lymph nodes (SCLNs). (a), Experimental design for ligation studies in C57BL/6 mice. (b) Quantification of OVA-AF594 protein tracer accumulation in lysates of DCLNs and SCLNs of ligated or sham-operated mice 2 hr after i.c.m. injection by fluorescence spectroscopy (n = 4-5 mice per group). (c–d) Quantification by flow cytometry of the total number of CD4+ T cells (c) and CD8+ T cells (d) in the brain 3 weeks after ligation or sham operation (n = 3-5 mice per group). Statistical significance was measured using a two-tailed unpaired student’s t-test, with ns = not significant, p<0.05 (*) and p<0.001 (***). Data are represented as mean values ± s.e.m.
Figure 6 with 1 supplement
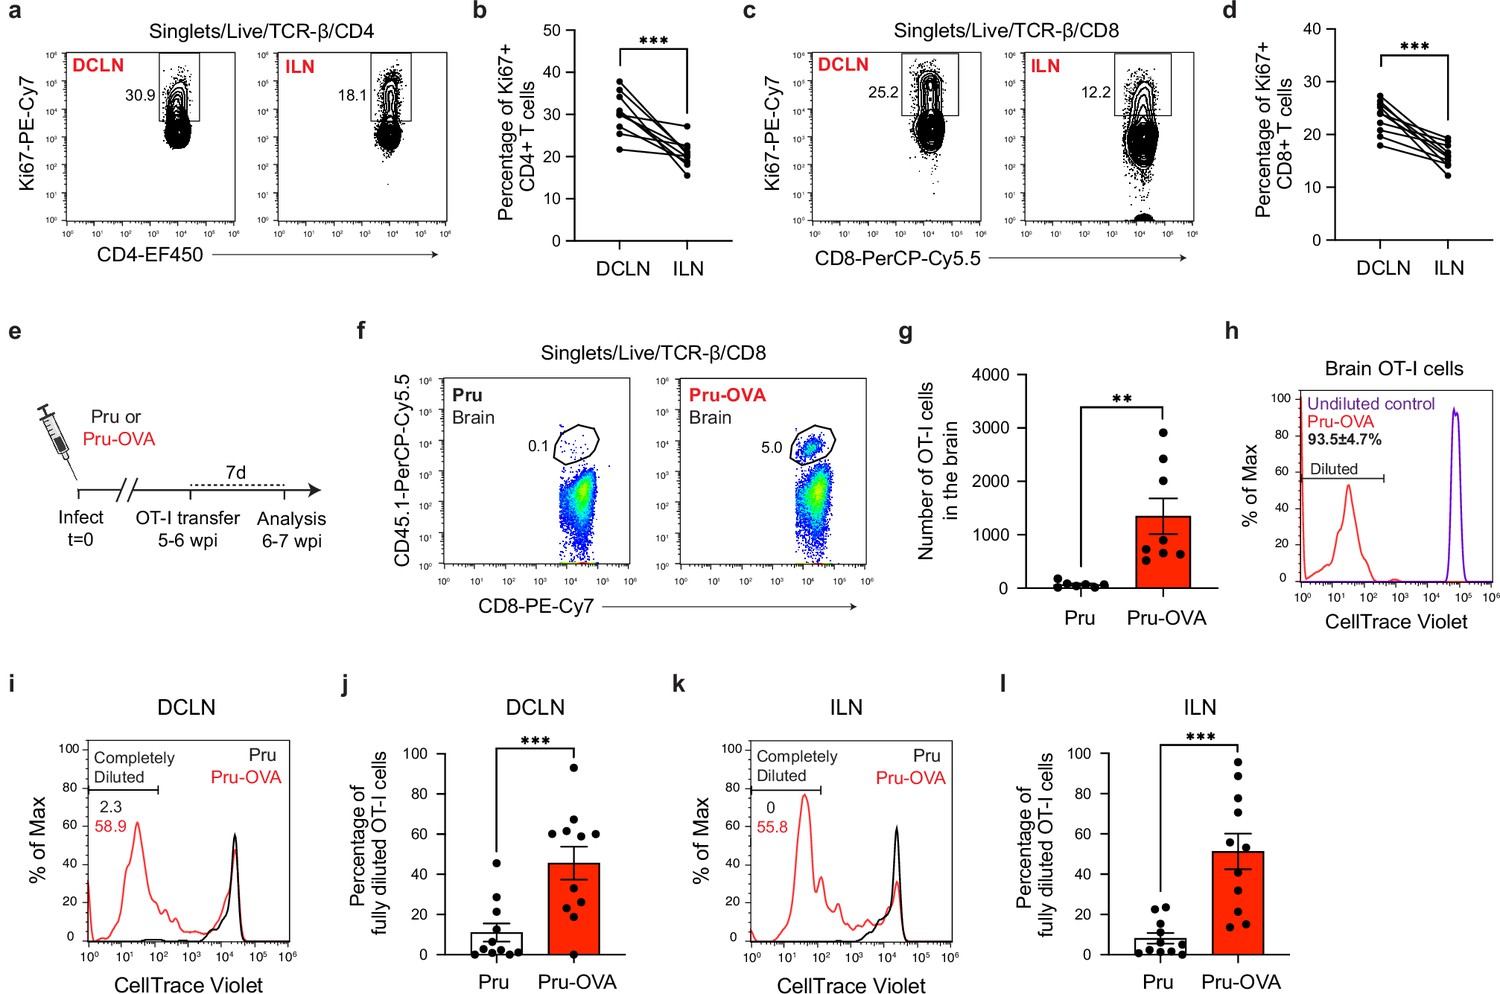
Antigen-dependent proliferation of T cells occurs in CNS- and non-CNS-draining lymph nodes during chronic infection with T. gondii.
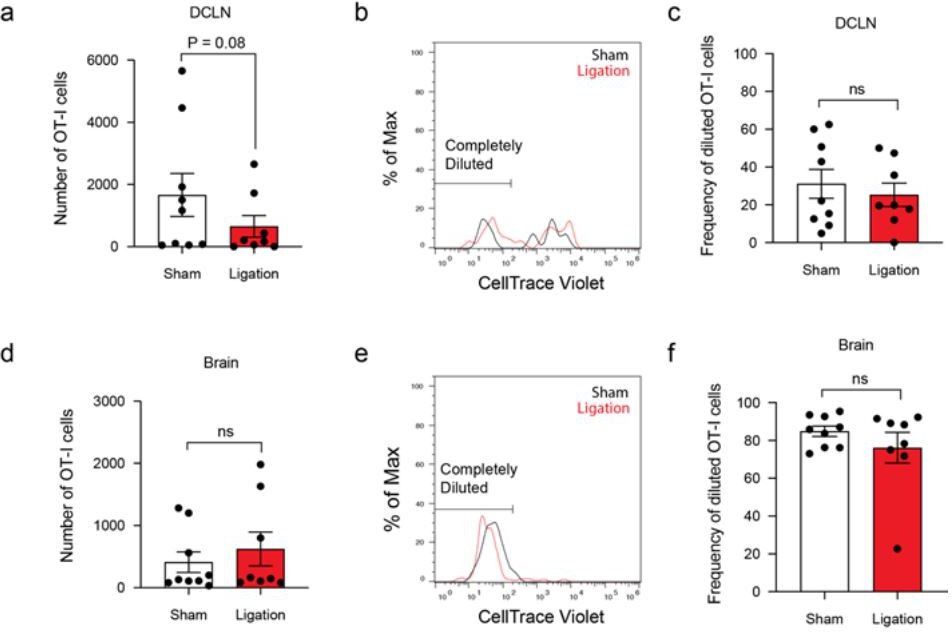
T cell proliferation was measured at 6 wpi in the deep cervical lymph nodes (DCLNs) and a representative group of non-CNS-draining lymph nodes, the inguinal lymph nodes (ILNs). (a–d), Representative contour plots (a, c) and average frequency (b, d) of Ki67-expressing CD4+ or CD8+ T cells in the different lymph node compartments of C57BL/6 mice chronically infected with the ME49 strain of T. gondii. Data are compiled from two experiments (n = 10 mice per group) and statistical significance was measured using a two-tailed paired t-test, with p<0.001 (***). (e–l), C57BL/6 mice were infected with the OVA-secreting Pru strain of T. gondii (Pru-OVA) or the control parental Pru (Pru) strain of T. gondii. 5 to 6 weeks later, OT-I cells (CD45.1 congenic) labeled with CellTrace Violet were transferred intravenously, and tissues were analyzed 7 days post-transfer. (e), Experimental design for OT-I transfer studies. (f–g), Representative dot plots (f) and total number (g) of OT-I cells infiltrating the brain tissue of mice infected with Pru-OVA or parental Pru. Data are compiled from two experiments (n = 7-8 mice per group). (h), Representative flow histogram showing CellTrace Violet dye dilution among brain-infiltrating OT-I cells of mice chronically infected with Pru-OVA or parental Pru. The average frequency (mean value ± s.e.m.) of fully diluted cells was calculated from two pooled experiments (n = 8 mice). (i–j), Representative flow histogram (i) and average frequency (j) of fully diluted OT-I cells in the DCLNs of mice chronically infected with Pru-OVA or parental Pru. Data are compiled from three experiments (n = 11 mice per group). (k–l), Representative flow histogram (k) and average frequency (l) of fully diluted OT-I cells in the ILNs of mice chronically infected with Pru-OVA or parental Pru. Data are compiled from three experiments (n = 11 mice per group). For all experiments data are represented as mean values ± s.e.m. and for g, j, and l statistical significance was measured using randomized block ANOVA (two-way), with p<0.01 (**) and p<0.001 (***).
Figure 6—figure supplement 1
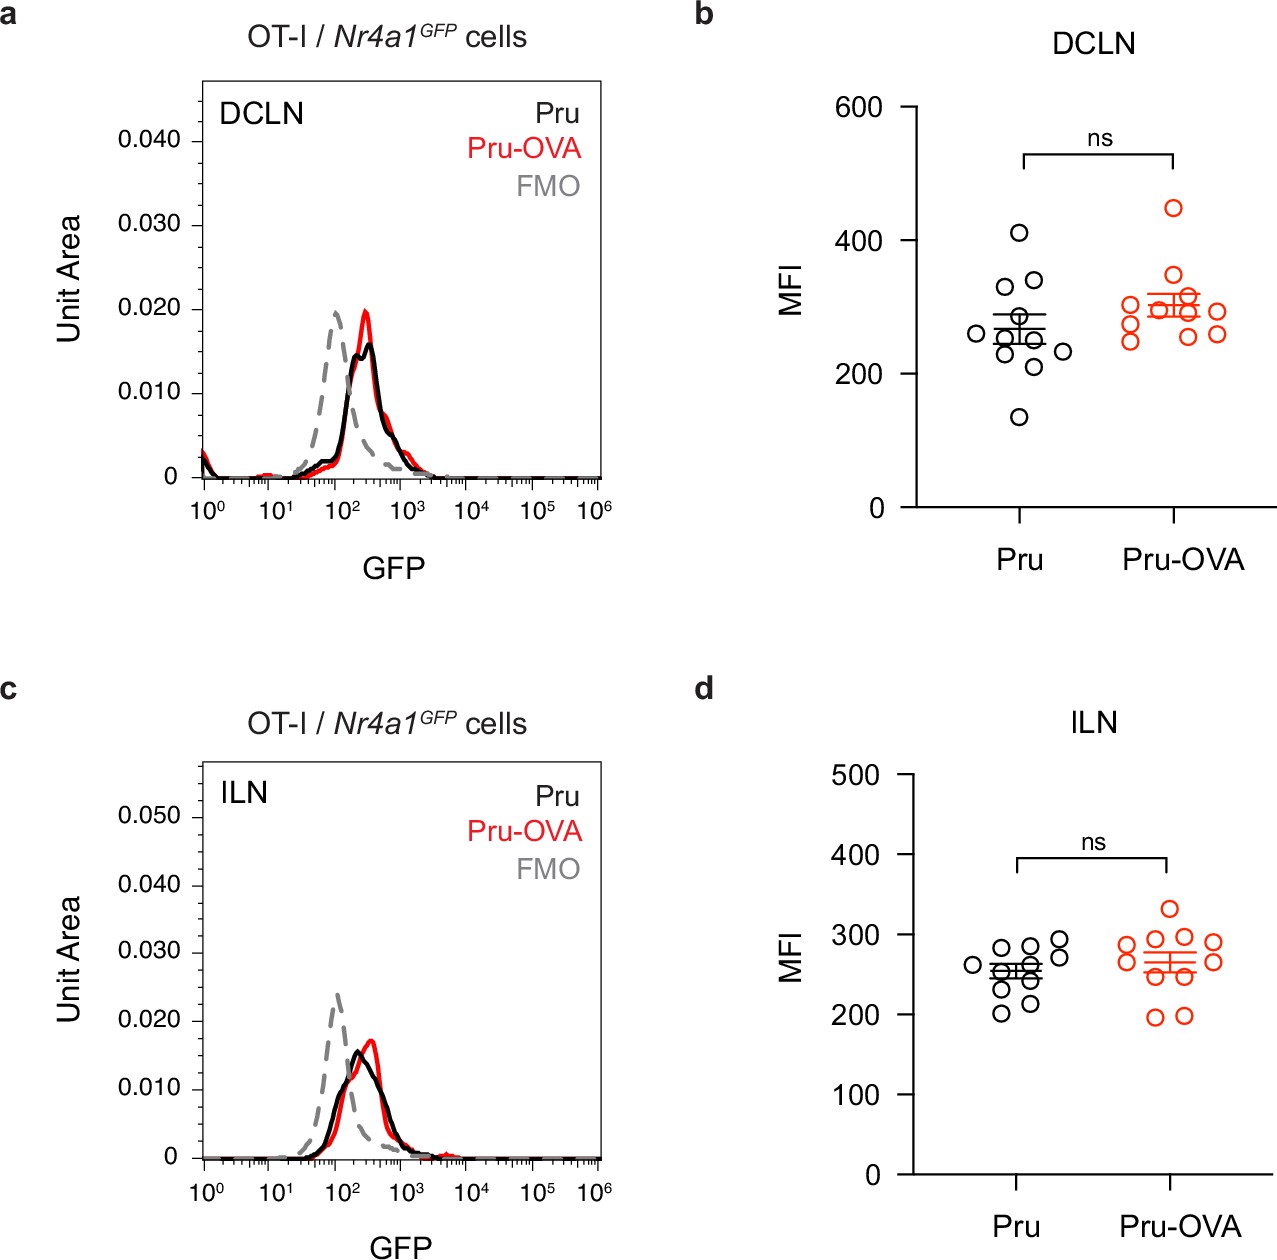
Assessing Nur77 reporter expression in mice chronically infected with Pru-OVA or parental Pru.
Nur77 reporter expression was measured 7 days after adoptive transfer of OT-I/Nr4a1GFP cells (CD45.1 congenic) to C57BL/6 mice chronically infected with Pru-OVA or parental Pru. (a–b), Representative flow histogram (a) and average geometric mean fluorescence intensity (MFI) (b) showing Nur77 reporter expression in the deep cervical lymph nodes (DCLN). (c–d), Representative flow histogram (c) and average MFI (d) showing Nur77 reporter expression in the inguinal lymph nodes (ILN). Data are compiled from three experiments and represented as mean values ± s.e.m. (n = 11 mice per group). Statistical significance was measured using randomized block ANOVA (two-way), with ns = not significant.
Author response image 1
Author response image 2
Author response image 3

Author response image 4
Tables
Appendix 1—key resources table
| Reagent type (species) or resource | Designation | Source or reference | Identifiers | Additional information |
|---|---|---|---|---|
| Strain, strain background (Mus. musculus) | C57BL/6 J | Jackson Laboratory | Stock #:000664 | |
| Strain, strain background (Mus. musculus) | CBA/J | Jackson Laboratory | Stock #:000656 | |
| Strain, strain background (Mus. musculus) | CD45.1 congenic; B6.SJL-PtprcaPepcb/BoyCrCrl | Charles River Laboratory | Stock #:564 | |
| Strain, strain background (Mus. musculus) | Swiss Webster | Charles River Laboratory | Stock #:024 | |
| Genetic reagent (Mus. musculus) | CD11c-YFP; B6.Cg-Tg(Itgax-Venus)1Mnz/J | Jackson Laboratory | Stock #:008829 | |
| Genetic reagent (Mus. musculus) | OT-I; C57BL/6-Tg(TcraTcrb)1100Mjb/J | Jackson Laboratory | Stock #:003831 | |
| Genetic reagent (Mus. musculus) | Nur77-GFP; C57BL/6-Tg(Nr4a1-EGFP/cre)820Khog/J | Jackson Laboratory | Stock #:016617 | |
| Genetic reagent (Mus. musculus) | OT-I (CD45.1 congenic) mice | This paper | OT-I mice were crossed with CD45.1 mice | |
| Genetic reagent (Mus. musculus) | OT-I/Nur77GFP (CD45.1 congenic) | This paper | OT-I/CD45.1 mice were crossed with Nur77-GFP mice | |
| Genetic reagent (background (Toxoplasma gondii)) | PruΔHPT | DOI: 10.1371/journal.ppat.1010296 | Generously provided by Anita Koshy at the University of Arizona | |
| Genetic reagent (background (Toxoplasma gondii)) | Pru-OVA-TdTomato | DOI: 10.1371/journal.ppat.1010296 | Generously provided by Anita Koshy at the University of Arizona | |
| Antibody | anti-MHC II-Super Bright 436 (rat monoclonal) | eBioscience | Cat. #:62-5321-82 | IHC (1:100) |
| Antibody | anti-LYVE1-EF570 (rat monoclonal) | eBioscience | Cat. #:41-0443-82 | IHC (1:100) |
| Antibody | anti-LYVE1-EF660 (rat monoclonal) | eBioscience | Cat. #:50-0443-82 | IHC (1:100) |
| Antibody | anti-ME49 (rabbit polyclonal) | Other | IHC (1:10,000); generously provided by Fausto Araujo at Palo Alto Medical Foundation | |
| Antibody | Anti-rabbit-AF488 (donkey polyclonal) | Thermo Fisher | Cat. #:A-21206 | IHC (1:500) |
| Antibody | anti-CD45-FITC (rat monoclonal) | eBioscience | Cat. #:11-0451-82 | FC (1:200) |
| Antibody | anti-CD62L-FITC (rat monoclonal) | eBioscience | Cat. #:11-0621-85 | FC (1:200) |
| Antibody | anti-CD80-FITC (hamster monoclonal) | eBioscience | Cat. #:11-0801-82 | FC (1:200) |
| Antibody | anti-MHC class II (I-A/I-E)-PE (rat monoclonal) | eBioscience | Cat. #:12-5321-82 | FC (1:200) |
| Antibody | anti-CD69-PE (hamster monoclonal) | eBioscience | Cat. #:12-0691-82 | FC (1:200) |
| Antibody | anti-CD11c-PerCP-Cy5.5 (hamster monoclonal) | eBioscience | Cat. #:45-0114-82 | FC (1:200) |
| Antibody | anti-CD4-PerCP-Cy5.5 (rat monoclonal) | eBioscience | Cat. #:45-0042-82 | FC (1:200) |
| Antibody | anti-CD45-PerCP-Cy5.5 (rat monoclonal) | eBioscience | Cat. #:45-0451-82 | FC (1:200) |
| Antibody | anti-CD11b-PerCP-Cy5.5 (rat monoclonal) | eBioscience | Cat. #:45-0112-82 | FC (1:200) |
| Antibody | anti-CD8α-PerCP-Cy5.5 (rat monoclonal) | eBioscience | Cat. #:45-0081-82 | FC (1:200) |
| Antibody | anti-CD45.1-PerCP-Cy5.5 (mouse monoclonal) | eBioscience | Cat. #:45-0453-82 | FC (1:200) |
| Antibody | anti-CD80-PE-Cy7 (hamster monoclonal) | eBioscience | Cat. #:25-0801-82 | FC (1:200) |
| Antibody | anti-CD11c-PE-Cy7 (hamster monoclonal) | eBioscience | Cat. #:25-0114-82 | FC (1:200) |
| Antibody | anti-CD4-PE-Cy7 (rat monoclonal) | eBioscience | Cat. #:25-0041-82 | FC (1:200) |
| Antibody | anti-CD8α-PE-Cy7 (rat monoclonal) | eBioscience | Cat. #:25-0081-82 | FC (1:200) |
| Antibody | anti-TCR-β-APC (hamster monoclonal) | eBioscience | Cat. #:17-5961-82 | FC (1:200) |
| Antibody | anti-NK1.1-APC (mouse monoclonal) | eBioscience | Cat. #:17-5941-82 | FC (1:200) |
| Antibody | anti-CD19-APC (rat monoclonal) | eBioscience | Cat. #:17-0193-82 | FC (1:200) |
| Antibody | anti-CD44-AF780 (rat monoclonal) | eBioscience | Cat. #:47-0441-82 | FC (1:200) |
| Antibody | anti-CD11b-AF780 (rat monoclonal) | eBioscience | Cat. #:47-0112-82 | FC (1:200) |
| Antibody | anti-CD86-EF450 (rat monoclonal) | eBioscience | Cat. #:48-0862-82 | FC (1:200) |
| Antibody | anti-MHC class II (I-A/I-E)-EF450 (rat monoclonal) | eBioscience | Cat. #:48-5321-82 | FC (1:200) |
| Antibody | anti-CD69-EF450 (hamster monoclonal) | eBioscience | Cat. #:48-0691-82 | FC (1:200) |
| Antibody | anti-CD4-EF450 (rat monoclonal) | eBioscience | Cat. #:48-0042-82 | FC (1:200) |
| Antibody | anti-TNF-α-AF488 (rat monoclonal) | eBioscience | Cat. #:53-7321-82 | FC (1:200) |
| Antibody | anti-IFN-γ-PerCP-Cy5.5 (rat monoclonal) | eBioscience | Cat. #:45-7311-82 | FC (1:200) |
| Antibody | anti-Ki67-PE-Cy7 (rat monoclonal) | eBioscience | Cat. #:25-5698-82 | FC (1:200) |
| Antibody | anti-CD45-AF700 (rat monoclonal) | BioLegend | Cat. #:103127 | FC (1:200) |
| Antibody | anti-CD11b-BB700 (rat monoclonal) | BD Biosciences | Cat. #:566417 | FC (1:200) |
| Antibody | anti-CD64-PE-Cy7 (mouse monoclonal) | BioLegend | Cat. #:139314 | FC (1:200) |
| Antibody | anti-CD19-BV711 (rat monoclonal) | BD Biosciences | Cat. #:563157 | FC (1:200) |
| Antibody | anti-CD3e-BV711 (hamster monoclonal) | BD Biosciences | Cat. #:563123 | FC (1:200) |
| Antibody | anti-NK1.1-BV711 (mouse monoclonal) | BioLegend | Cat. #:108745 | FC (1:200) |
| Antibody | anti-Ly6G-BV711 (rat monoclonal) | BioLegend | Cat. #:127643 | FC (1:200) |
| Antibody | anti-TER119-BV711 (rat monoclonal) | BD Biosciences | Cat. #:740686 | FC (1:200) |
| Antibody | anti-CD11c-EF506 (hamster monoclonal) | eBioscience | Cat. #:69-0114-80 | FC (1:200) |
| Antibody | anti-MHC II (I-A/I-E)-SB780 (rat monoclonal) | eBioscience | Cat. #:78-5321-82 | FC (1:200) |
| Antibody | anti-CD26-PE (rat monoclonal) | BioLegend | Cat. #:137803 | FC (1:200) |
| Antibody | anti-XCR1-APC (mouse monoclonal) | BioLegend | Cat. #:148205 | FC (1:200) |
| Antibody | anti-SIRPα-SB436 (rat monoclonal) | eBioscience | Cat. #:62-1721-82 | FC (1:100) |
| Antibody | anti-CD103-BV605 (hamster monoclonal) | BioLegend | Cat. #:121433 | FC (1:200) |
| Antibody | anti-CD80-BV650 (hamster monoclonal) | BD Biosciences | Cat. #:563687 | FC (1:200) |
| Antibody | anti-CD86-APC-EF780 (rat monoclonal) | eBioscience | Cat. #:47-0862-80 | FC (1:200) |
| Antibody | anti-CD4-BV650 (rat monoclonal) | BD Biosciences | Cat. #:563232 | FC (1:200) |
| Antibody | anti-CD8α-BV421 (rat monoclonal) | BD Biosciences | Cat. #:563898 | FC (1:200) |
| Antibody | anti-CD45.1-BV711 (mouse monoclonal) | BioLegend | Cat. #:110739 | FC (1:200) |
| Antibody | anti-PD1-BV786 (hamster monoclonal) | BD Biosciences | Cat. #:744548 | FC (1:200) |
| Antibody | anti-TIM3-APC-H7 (mouse monoclonal) | BD Biosciences | Cat. #:567165 | FC (1:200) |
| Antibody | anti-LAG3-SB600 (rat monoclonal) | eBioscience | Cat. #:63-2231-82 | FC (1:200) |
| Antibody | anti-CXCR3-PE-Cy7 (hamster monoclonal) | BioLegend | Cat. #:126515 | FC (1:200) |
| Antibody | anti-KLRG1-EF506 (hamster monoclonal) | eBioscience | Cat. #:69-5893-80 | FC (1:200) |
| Antibody | anti-CD69-AF700 (hamster monoclonal) | BD Biosciences | Cat. #:561238 | FC (1:200) |
| Antibody | anti-CD103-PerCP-EF710 (hamster monoclonal) | eBioscience | Cat. #:46-1031-80 | FC (1:200) |
Additional files
Download links
A two-part list of links to download the article, or parts of the article, in various formats.
Downloads (link to download the article as PDF)
Open citations (links to open the citations from this article in various online reference manager services)
Cite this article (links to download the citations from this article in formats compatible with various reference manager tools)
Meningeal lymphatic drainage promotes T cell responses against Toxoplasma gondii but is dispensable for parasite control in the brain
eLife 11:e80775.
https://doi.org/10.7554/eLife.80775


