Structure of the HOPS tethering complex, a lysosomal membrane fusion machinery
- Department of Biology/Chemistry, Structural Biology section, Osnabrück University, Germany
- Department of Biology/Chemistry, Biochemistry section, Osnabrück University, Germany
- Department of Plant Physiology and Photo Biology, University of Marburg, Germany
- Department of Chemistry and Pharmacy, Institute of Biochemistry, University of Münster, Germany
- Department of Biology/Chemistry, Molecular Membrane Biology group, Osnabrück University, Germany
- Center of Cellular Nanoanalytic Osnabrück (CellNanOs), Osnabrück University, Germany
Figures
Figure 1 with 4 supplements
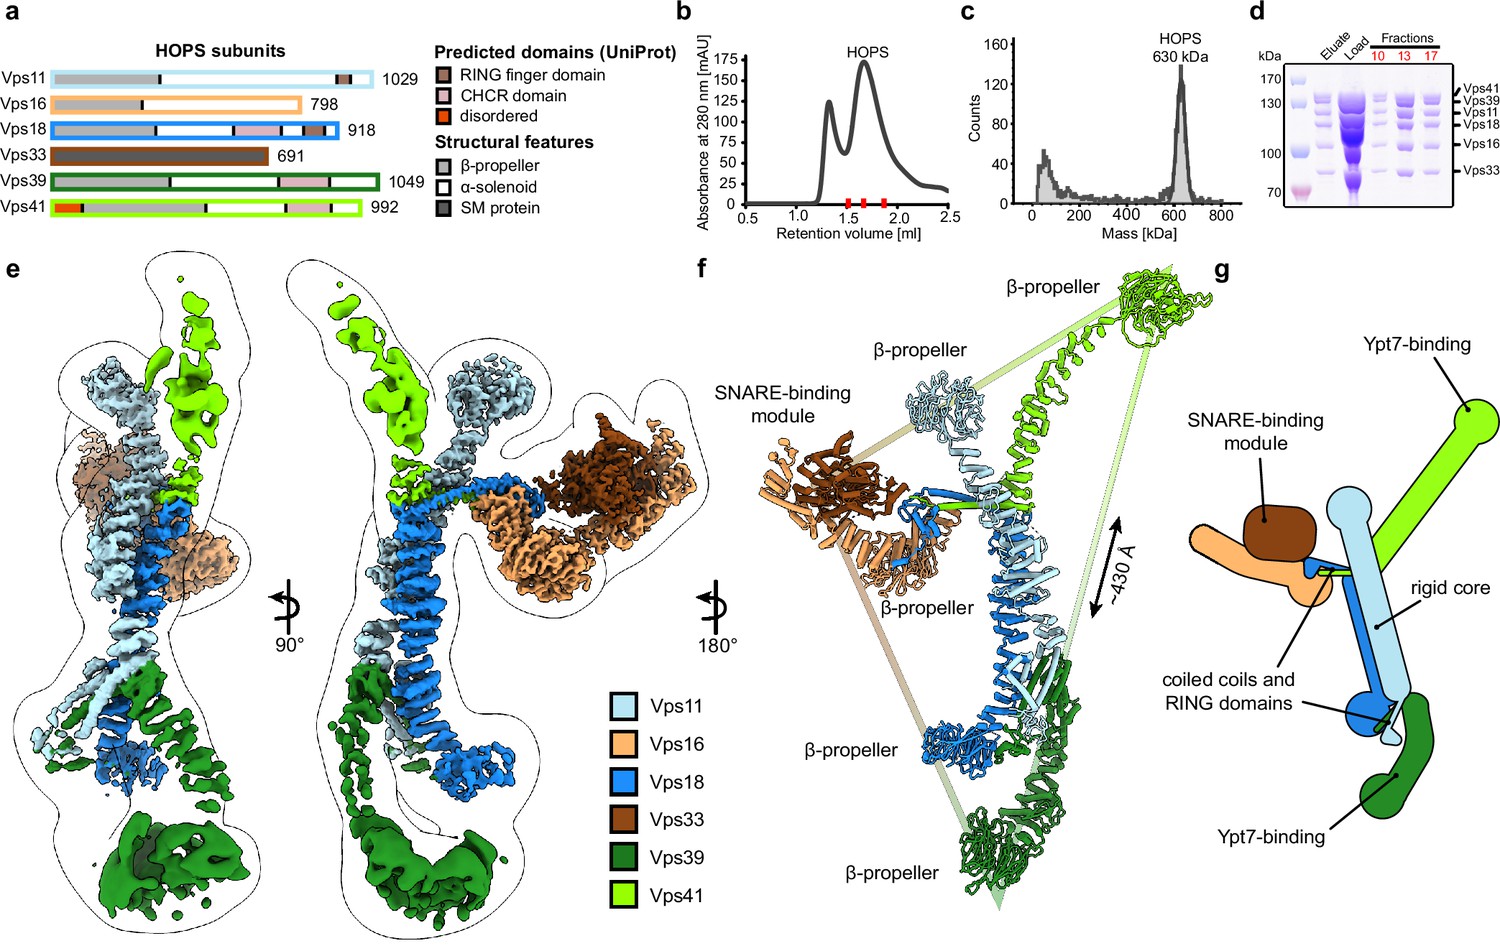
Composition and architecture of the yeast HOPS complex.
(A) Domain architecture and size of HOPS subunits. Predicted domains and structural features are indicated. (B) Size exclusion chromatography (SEC) of the affinity-purified HOPS. Purification was done as described in Materials and methods. (C) Mass photometry analysis. Peak fractions from SEC were analyzed for size. (D) Purified HOPS. Proteins from affinity purification (eluate) and SEC (red dashes in (B)) were analyzed by SDS-PAGE. (E) Overall architecture of the HOPS complex. Composite map from local refinement maps (Figure S1-3) was colored by assigned subunits. One of the consensus maps used for local refinements was low-pass-filtered and is shown as a transparent envelope. (F) Atomic model of the HOPS complex. For the N-terminal fragments of Vps41 and Vps39, which were not resolved to high resolution by local refinements, AlphaFold models are used and manually fitted into the densities of consensus maps (Figure 1—figure supplements 1 and 2). The triangular shape of the complex is highlighted with the approximate distance between the β-propellers of Vps41 and Vps39. (G) Schematic representation of the HOPS complex indicates central features.
-
Figure 1—source data 1
Gels and graphs for Figure 1b, c and d.
- https://cdn.elifesciences.org/articles/80901/elife-80901-fig1-data1-v2.zip
Figure 1—figure supplement 1
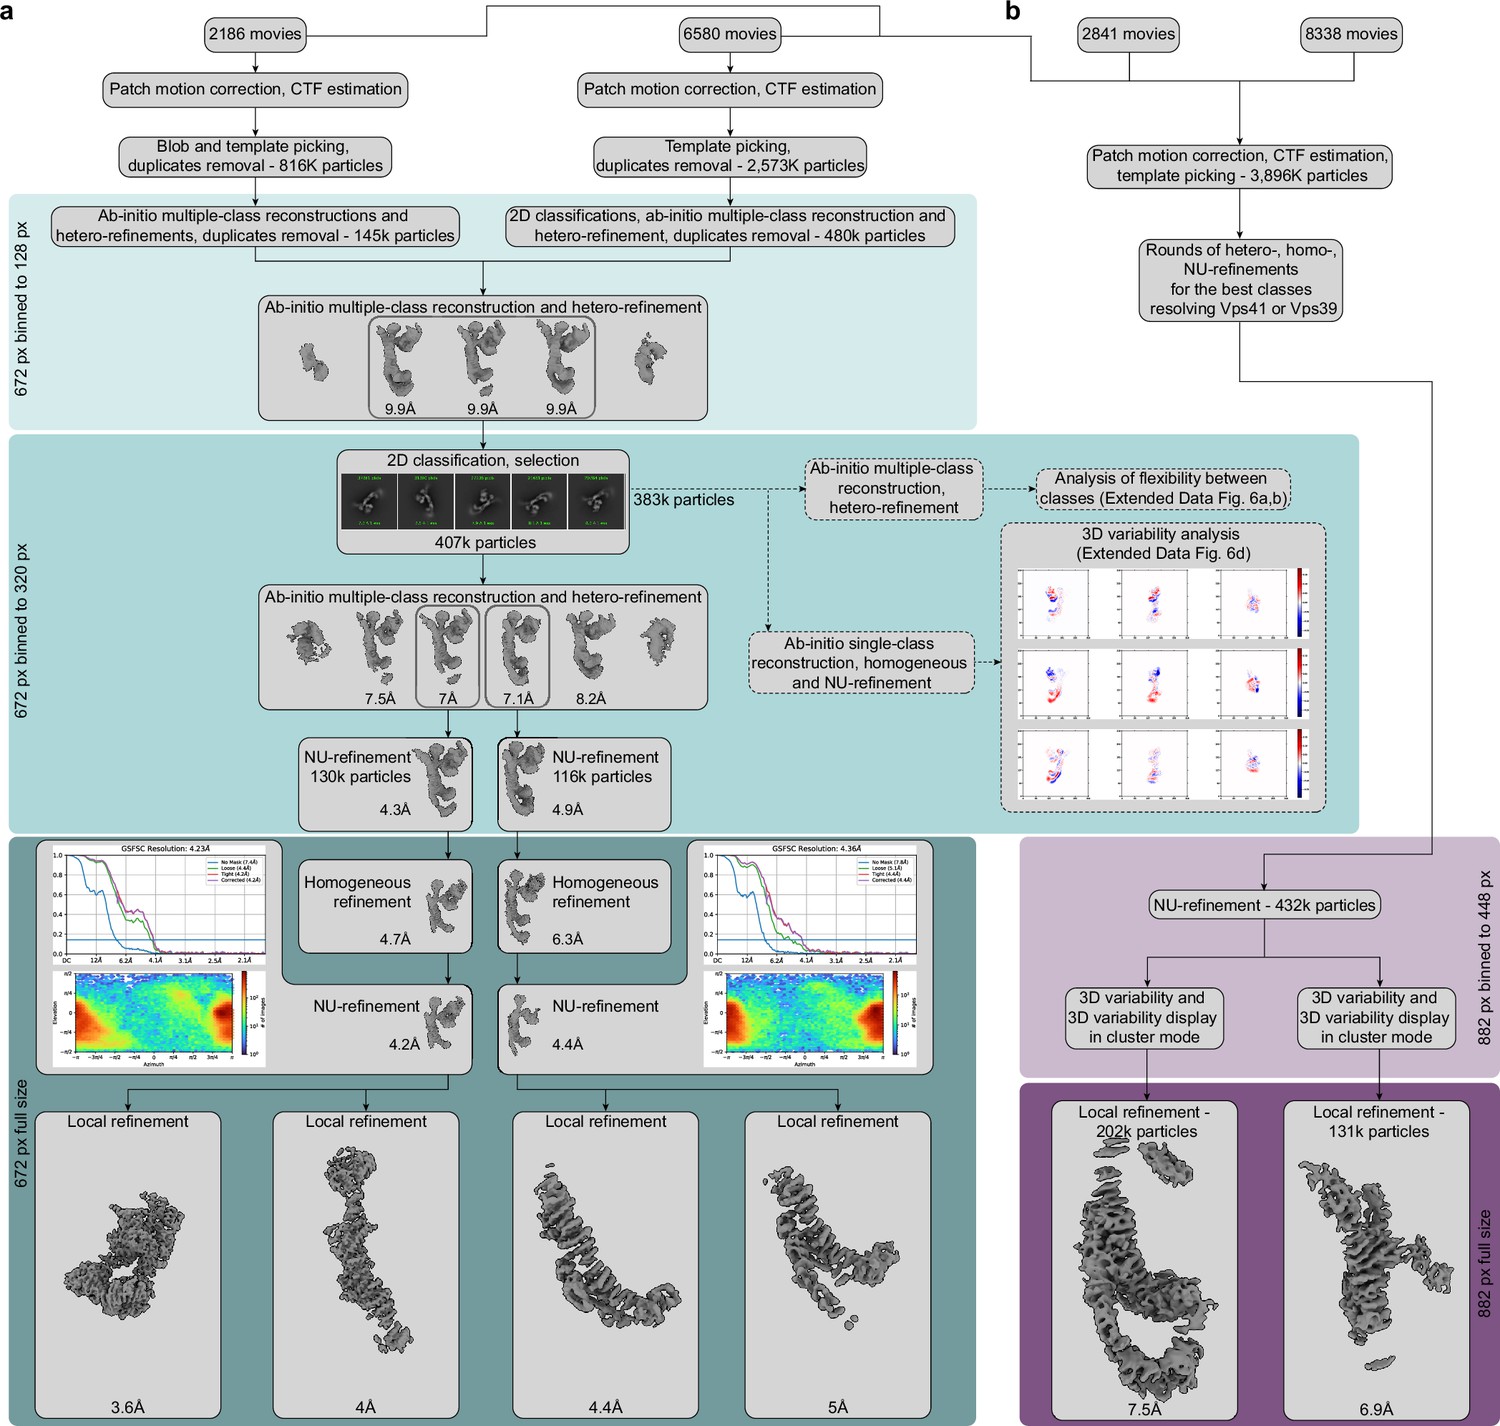
Cryo-EM data processing workflow.
(A) Processing of the core part of the complex. 2186 and 6580 movies from two different data sets were preprocessed in parallel and used for initial particle sorting by 2D and 3D classifications using the box size of 128 pixels with 4.85 Å per pixel. After initial classifications, approximately 625,000 particles were selected and combined for further processing. A round of ab-initio reconstruction followed by hetero-refinement with five classes was performed to separate the best particles for further refinements. About 407,000 particles from three classes, which reached 9.9 Å resolution (Nyquist for the binned data), were extracted using the box size of 320 pixels with 1.94 Å per pixel, and another round of 2D classification was performed. Afterward, a new round of ab-initio reconstruction and hetero-refinement with six classes was conducted. Particles from two classes that reached the best resolutions (7 and 7.1 Å) were further processed separately. The first of the selected two classes was refined by NU-refinement to 4.3 Å resolution, while the second class was refined to 4.9 Å. Subsequently, particles were extracted in full box size (672 pixels with 0.924 Å per pixel) and used for further homogeneous and NU-refinement, which resulted in two consensus maps, better resolving either upper or lower part of HOPS (reached 4.2 and 4.4 Å resolution, respectively). FSC curves generated in cryoSPARC are shown for both consensus maps. Afterward, local refinements were applied to improve each of the consensus maps. Local refinements of the first map resulted in two maps covering the SNARE-binding module (3.6 Å resolution) and the upper part for the core of HOPS (4 Å resolution). Local refinements of the second consensus map provided maps of the bottom of HOPS core better covering either Vps18 (4.4 Å resolution) or Vps39 (5 Å resolution). The subset of particles used for generation of both consensus maps was in parallel probed for flexibility using 3D classification (Figure 2—figure supplement 3A,B) and 3D variability analyses (Figure 2—figure supplement 3D) (dashed arrows; see Materials and methods for details). (B) Processing of the distal parts of HOPS. Movies used for core reconstruction (see (A)) were combined with movies from two additional data sets (2841 and 8338 movies, respectively) and preprocessed. After template picking, about 3.9 million particles were selected and subjected to several rounds of heterogeneous, homogeneous, and NU-refinements to select classes best resolving upper (Vps41) and lower (Vps39) distal parts of HOPS. Afterward, selected particles were used for a round of NU-refinement with a box size of 448 px with 1.82 Å per pixel. The particles from this NU-refinement were then subjected to 3D variability analysis with masks covering either the Vps41 or Vps39 volume. This was followed by 3D variability display in the cluster mode to further select particles. Finally, particles from best clusters were subjected to local refinements at a full box size of 882 pixels with 0.924 Å per pixel resulting in the maps resolving N-terminal regions of Vps39 (7.5 Å resolution) or Vps41 (6.9 Å resolution).
Figure 1—figure supplement 2
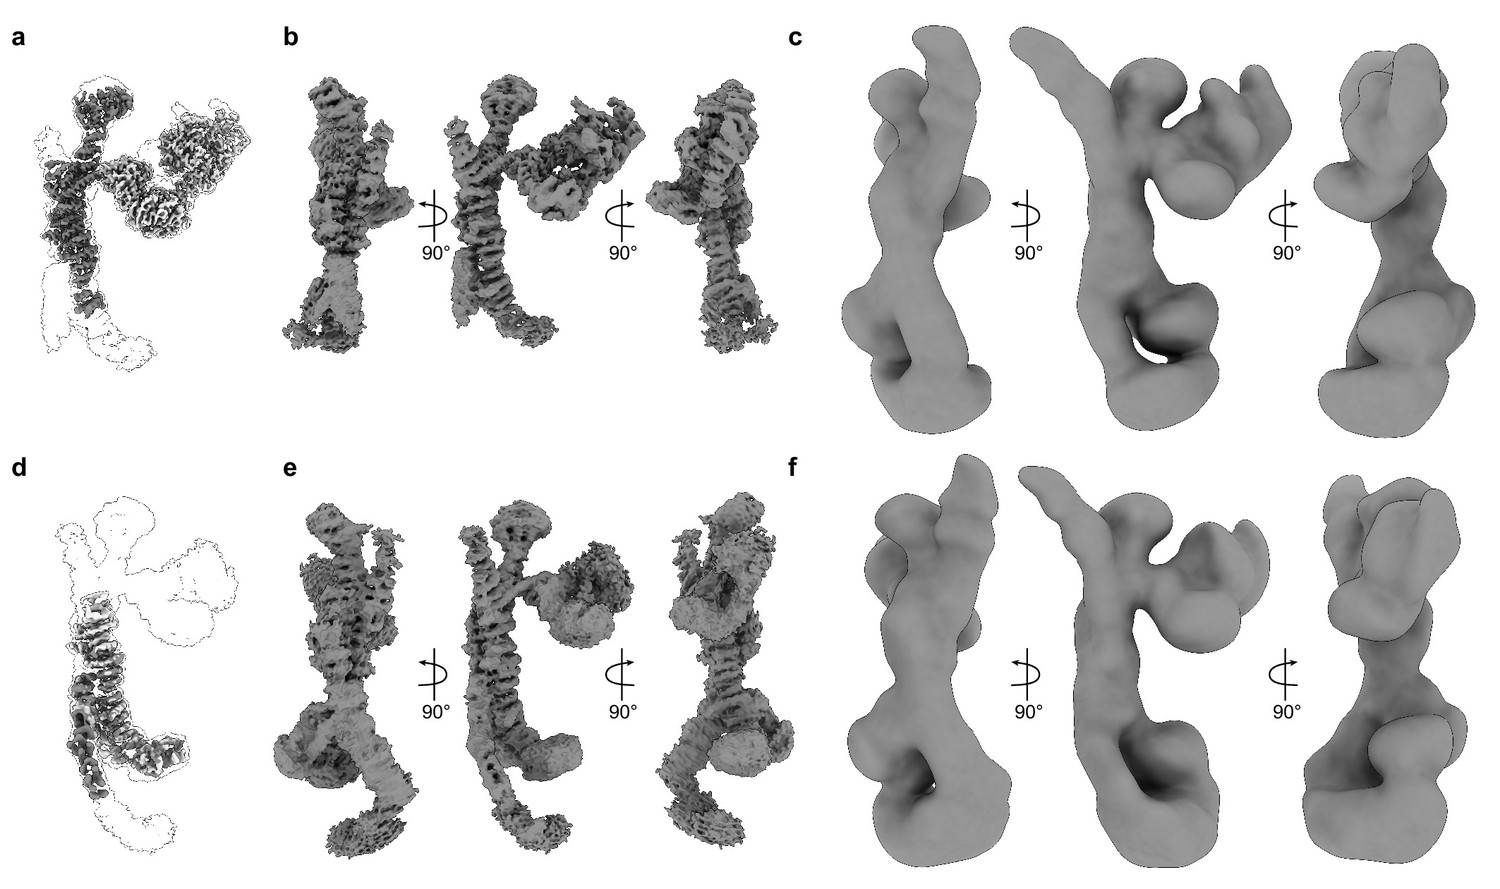
Consensus maps and corresponding local refinement maps.
(A) Consensus cryo-EM map of the upper part of HOPS, shown as a transparent envelope, with two corresponding local refinement maps fitted (colored). (B) The same consensus map, as in (A), shown from different sides. (C) The low-pass-filtered consensus map from (A), used in Figure 1E and viewed at a threshold, which allows to demonstrate the densities of N-terminal regions of Vps39 and Vps41. (D) The consensus map of the lower part of HOPS, shown as a transparent envelope, with two corresponding local refinement maps fitted (colored). (E) The consensus map from (D), shown from different sides. (F) The map from (D), shown as in (C).
Figure 1—figure supplement 3

Cryo-EM analysis of HOPS.
(A) Representative 2D class averages. Scale bar, 100 Å. (B–G) Local-resolution estimation, FSC curves, and angular distribution plots generated in cryoSPARC for each of six local refinement maps (see Figure 1—figure supplements 1 and 2 and Materials and methods). Note, that in (F) and (G), local resolution was not calculated for the peripheral areas of the maps due to mask limitations and is displayed in dark blue.
Figure 1—figure supplement 4
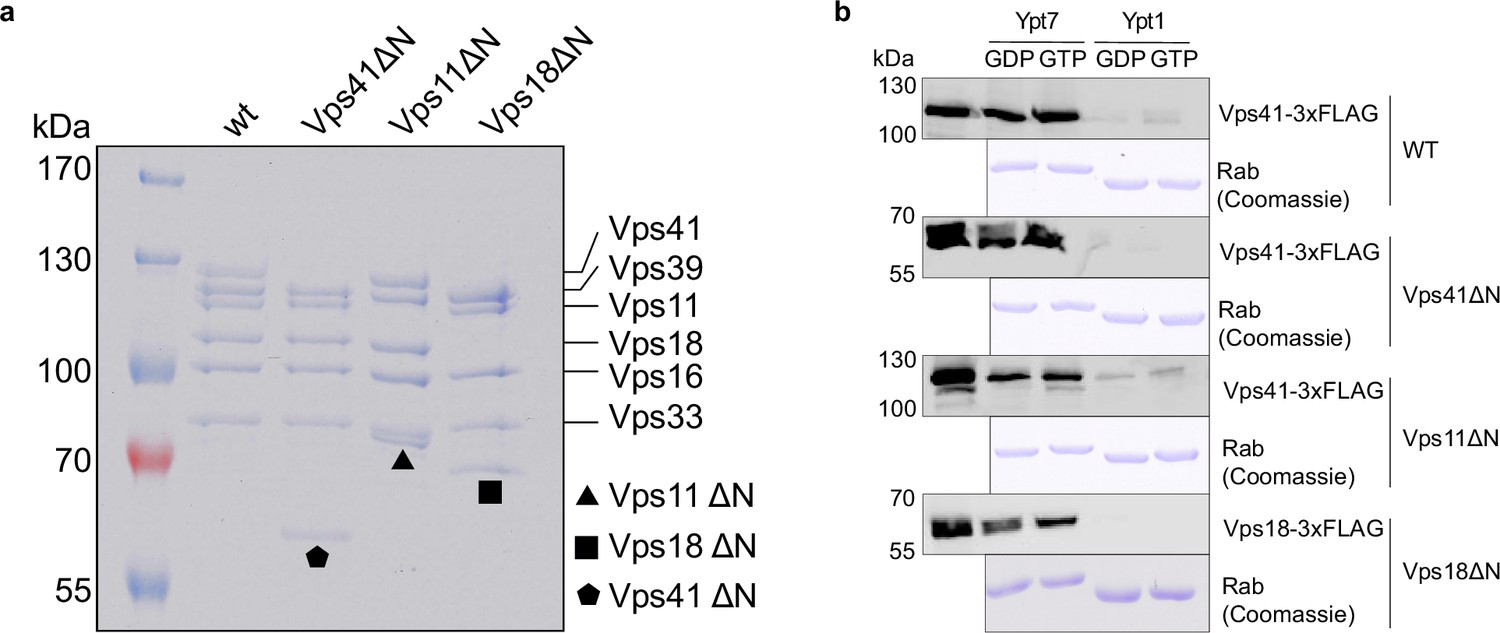
Biochemical analysis of HOPS mutants lacking N-terminal β-propellers.
(A) SDS-PAGE of purified wild-type and mutant complexes. (B) Ypt7-interaction. HOPS wild-type and mutant complexes were added to immobilized GST-Ypt7 or Ypt1 loaded with GTP or GDP. Eluted proteins were analyzed by SDS-PAGE and Western blotting. Coomassie gels of corresponding Rab GTPases are shown below.
-
Figure 1—figure supplement 4—source data 1
Blots and gels corresponding the experiments.
- https://cdn.elifesciences.org/articles/80901/elife-80901-fig1-figsupp4-data1-v2.zip
Figure 2 with 4 supplements
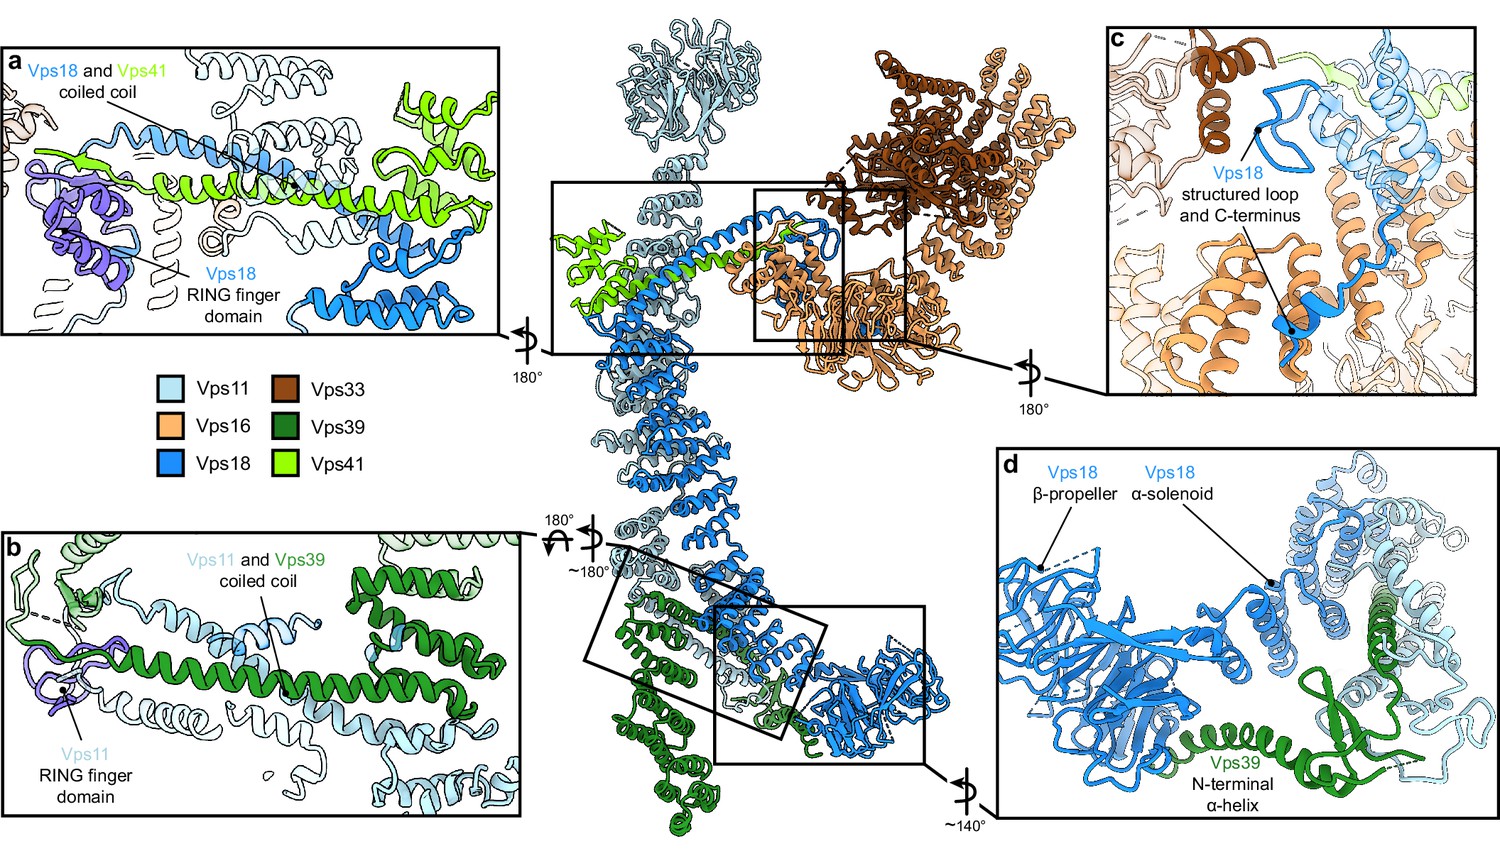
Vps11 and Vps18 C-termini as central interaction hubs for all other subunits.
Atomic model of HOPS with highlighted interaction sites between subunits. (A, B) Coiled-coil motifs followed by the RING finger domains (violet) are the key structural features of HOPS. (A) The Vps18 C-terminal hub. Vps18 and Vps41 interact via the coiled coil and the Vps18 RING finger domain (displayed as non-transparent cartoons). (B) The Vps11 C-terminal hub. Vps11 interacts via its RING finger domain and the coiled coil with Vps39 (displayed as non-transparent cartoons). (C) Connection of the SNARE binding module (Vps33 and Vps16) to the backbone of HOPS via interactions with the structured loop at the RING finger domain and the C-terminus of Vps18 (displayed as non-transparent cartoons). (D) Vps39 connects by its C-terminal helix the β-propeller of Vps18, which provides additional stability in this part of HOPS.
Figure 2—figure supplement 1

Comparison of Vps11 and Vps18 RING finger domains.
(A) Fragments of Vps11 and Vps18 depicting RING finger domains (yellow) following the long helices. Amino acids (orange) participating in folding of the RING finger domains are labeled. (B) Multiple sequence alignment of Vps11 and Vps18 RING finger domains from different model organisms (Drosophila melanogaster, Homo sapiens, Mus musculus, Saccharomyces cerevisiae, and Danio rerio), made using MUSCLE (Edgar, 2004) and visualized in Jalview (Waterhouse et al., 2009), is shown; coloring by conservation. Conserved amino acids from (A) are labeled by red asterisks.
Figure 2—figure supplement 2
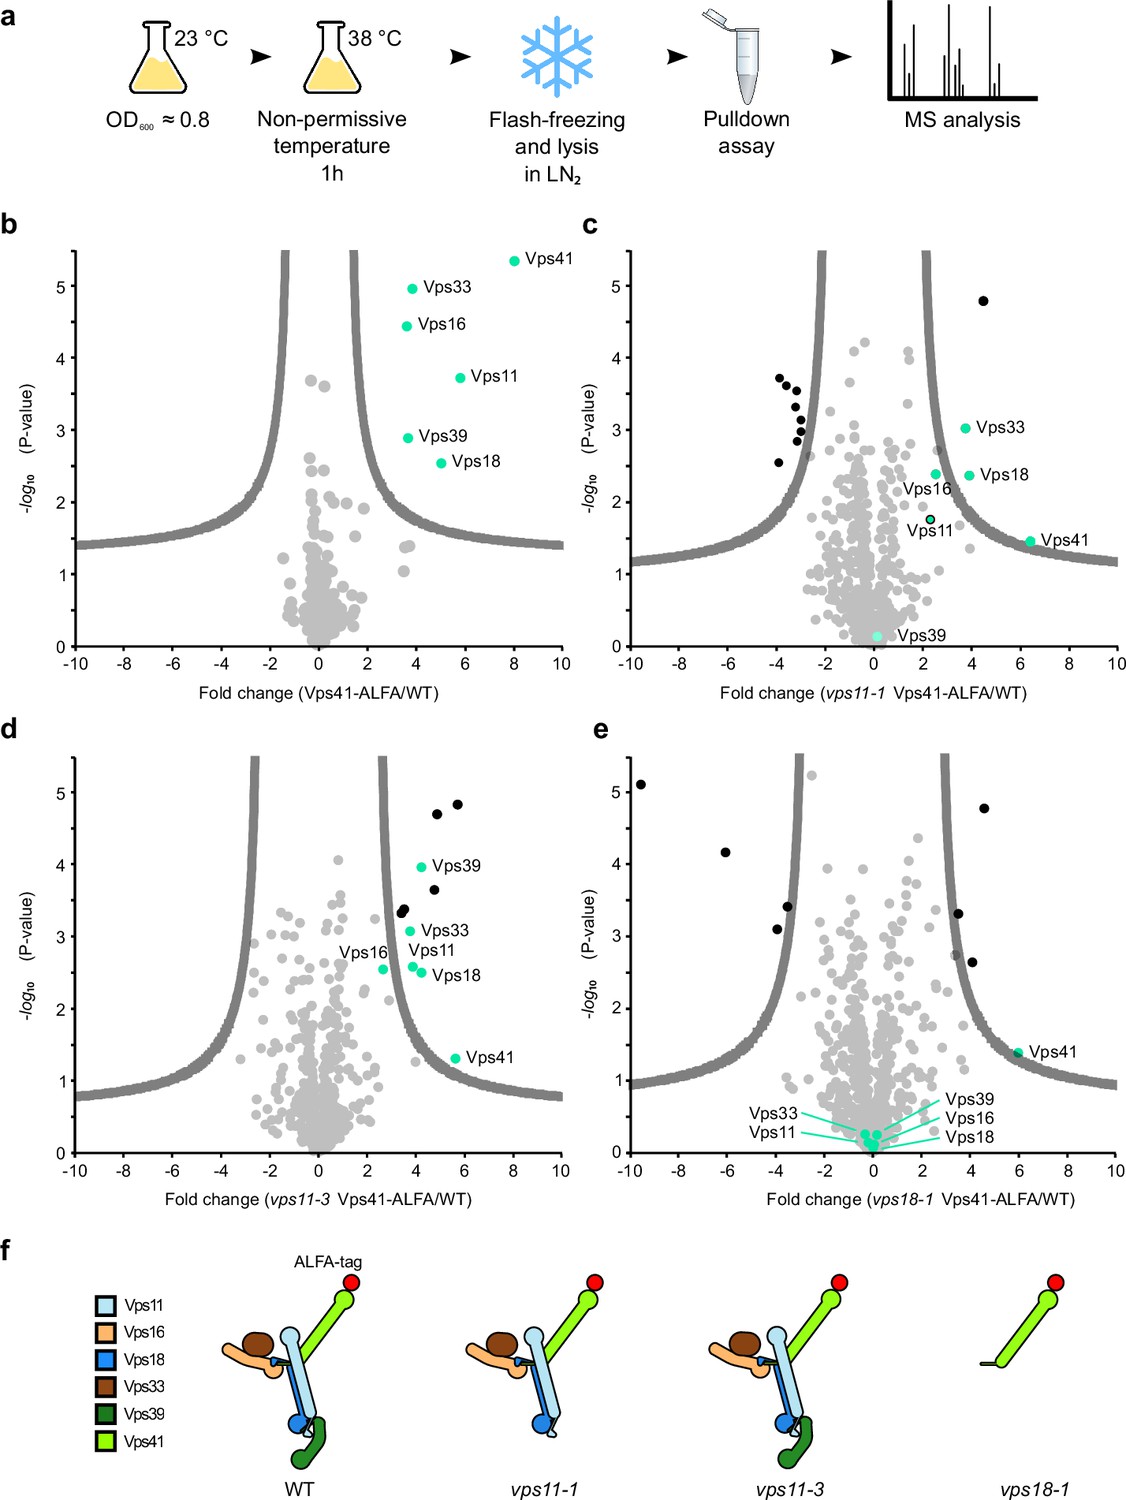
Key role of the RING finger domains of Vps11 and Vps18 in HOPS stability.
(A) Cartoon of cell growth, lysis, ALFA pulldown, and mass spectrometry analysis. See Materials and methods for details. (B–E) Mass spectrometry analysis of Vps41 purified via the ALFA tag from the indicated strains and enriched proteins (green dots). Results of purification from wt (B), vps11-1 (C), vps11-3 (D), and vps18 (E) cells. (F) Schematic representation of the results based on the structural model (as in Figure 1G).
-
Figure 2—figure supplement 2—source data 1
Mass spectrometry raw data.
- https://cdn.elifesciences.org/articles/80901/elife-80901-fig2-figsupp2-data1-v2.zip
Figure 2—figure supplement 3
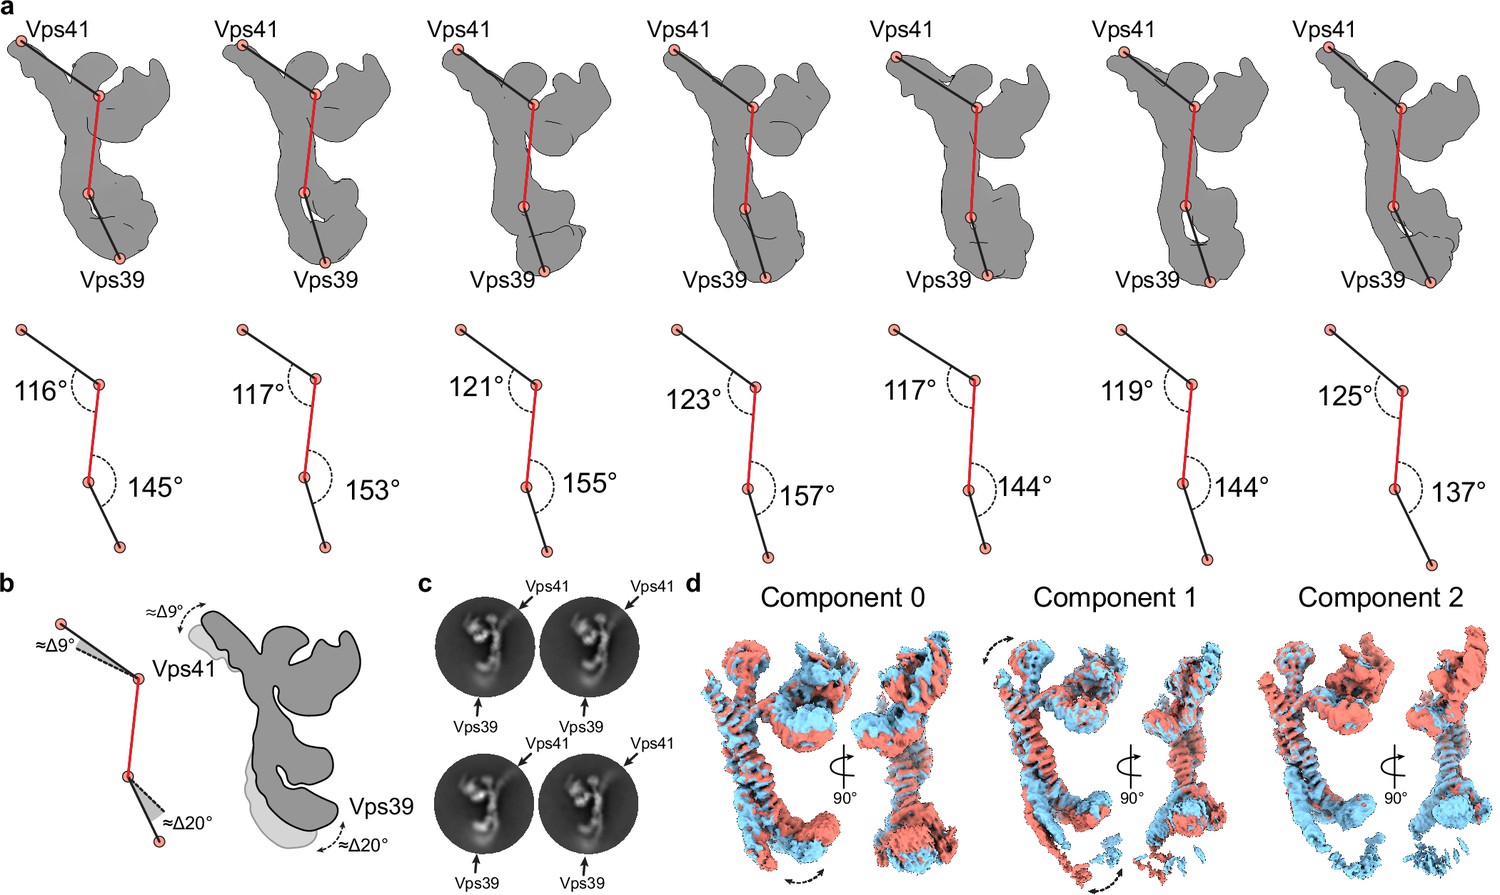
Flexibility analysis of the HOPS complex.
(A) Upper row, maps generated by a hetero-refinement with multiple classes from particles used for local refinements (see Figure 1—figure supplement 1A). All classes demonstrate different positions of densities at the distal ends relative to the rigid core (highlighted by red lines) of the volumes. Lower row, rotation angles calculated between the points indicated on the maps from above. (B) Angular difference calculated from angles in (A) demonstrating limited movements of Vps41 and Vps39, as depicted in the cartoon to the right. (C) Representative 2D class averages show fuzzy densities of Vps41 and Vps39 owing to their flexibility. (D) 3D variability analysis of particles used for local refinements (see Figure 1—figure supplement 1A). 3D density maps at negative (red) and positive (blue) positions along each variability component are shown.
Figure 2—figure supplement 4
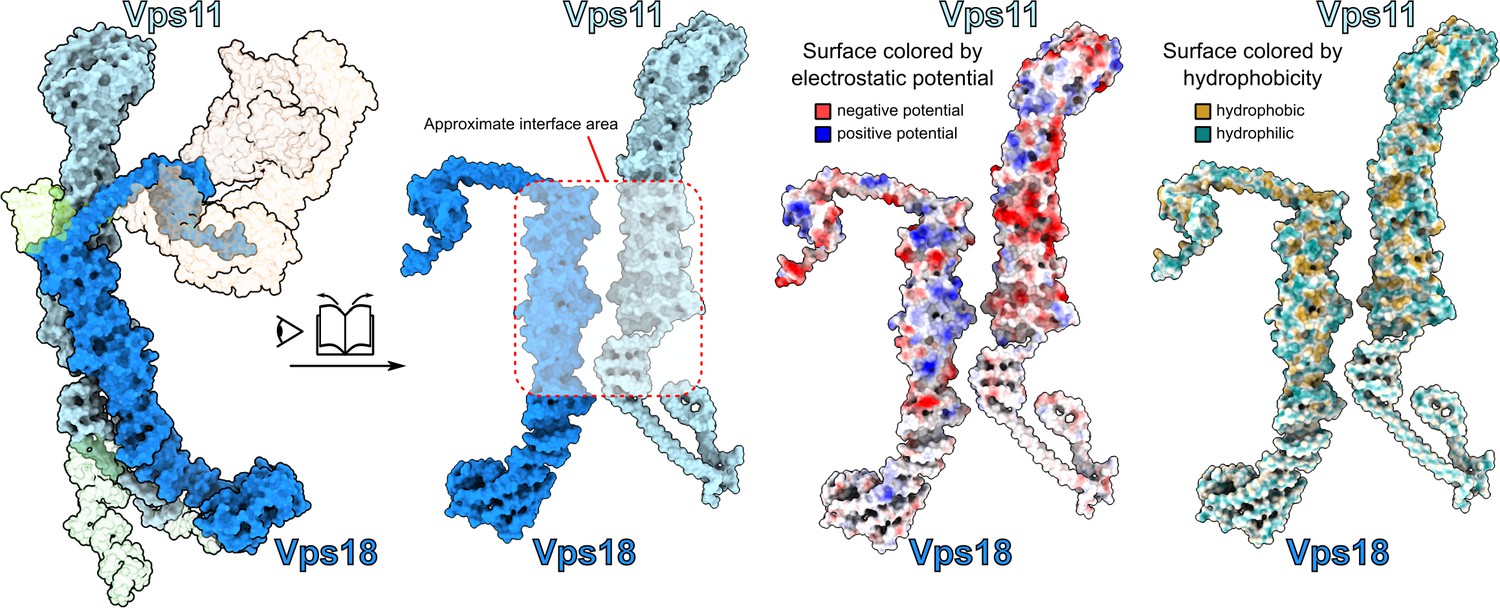
Interactions between core subunits Vps11 and Vps18.
Open-book view at the interface between Vps11 and Vps18 observed from the SNARE-binding module side of the complex. Surfaces colored by electrostatic potential and hydrophobicity are shown demonstrating a high degree of hydrophobic and electrostatic complementarity at the interface between the subunits.
Figure 3 with 1 supplement
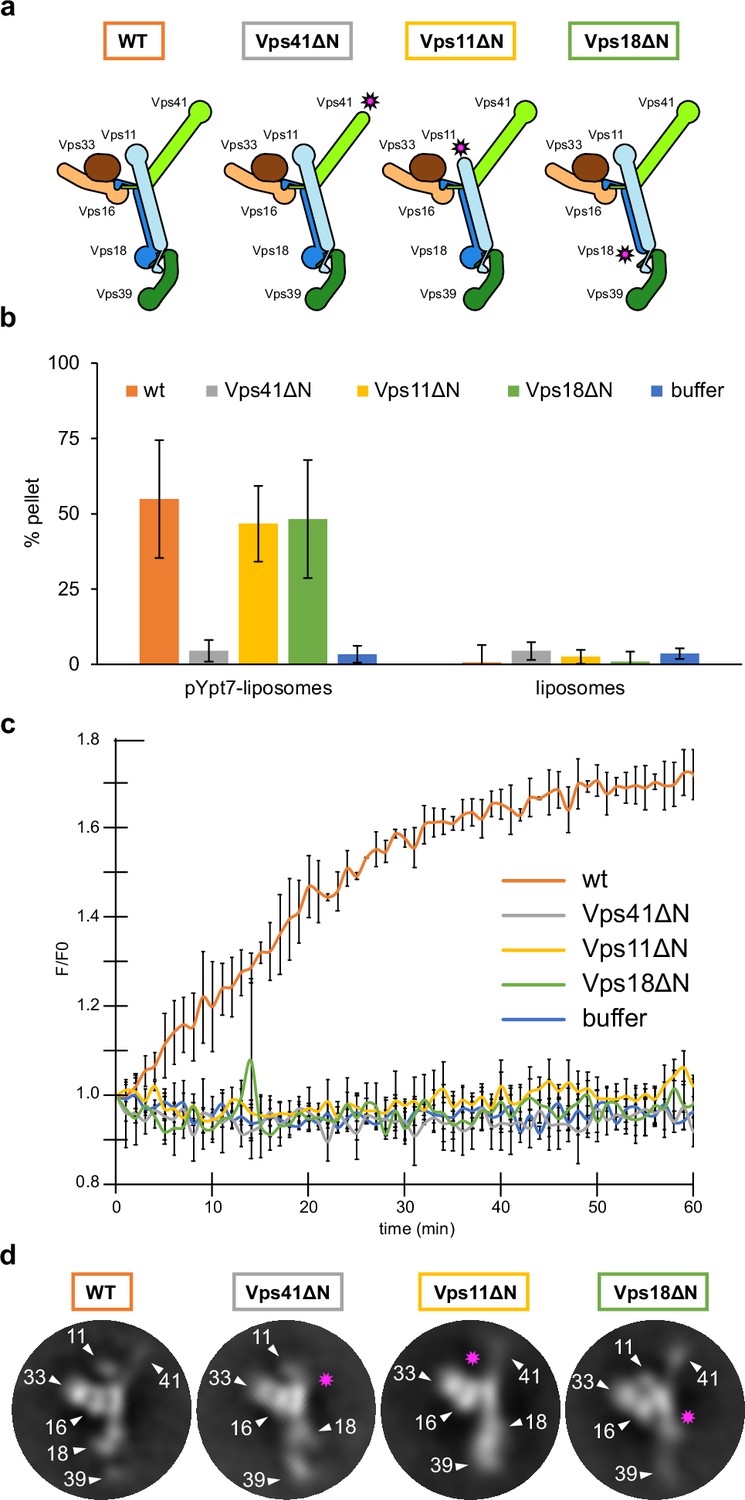
HOPS couples tethering and fusion activities.
(A) Schematic representations of HOPS wild-type (as in Figure 1G) and mutants lacking N-terminal β-propeller domains (indicated by pink asterisks). (B) Tethering assay. Fluorescently labeled liposomes loaded with prenylated Ypt7-GTP or none were incubated with HOPS and mutant complexes. Tethering was determined as described in Materials and methods. Data shown from three biological replicates, bars indicate standard deviation. (C) Fusion assay. Fusion of proteoliposomes carrying vacuolar SNAREs were preincubated with Ypt7-GDI, GTP, and Mon1-Ccz1. For fusion, HOPS wild-type or mutant and the soluble Vam7 SNARE were added (Langemeyer et al., 2020; Langemeyer et al., 2018). Analysis was done as described (Zick and Wickner, 2016). See Materials and methods. Data shown from three biological replicates, bars indicate standard deviation. (D) Representative 2D class averages obtained from negative-stain analyses of wild-type HOPS and mutants. Pink asterisks indicate missing densities in the mutants.
-
Figure 3—source data 1
Raw data for tethering (Figure 3B) and fusion assay (Figure 3C).
- https://cdn.elifesciences.org/articles/80901/elife-80901-fig3-data1-v2.zip
Figure 3—figure supplement 1
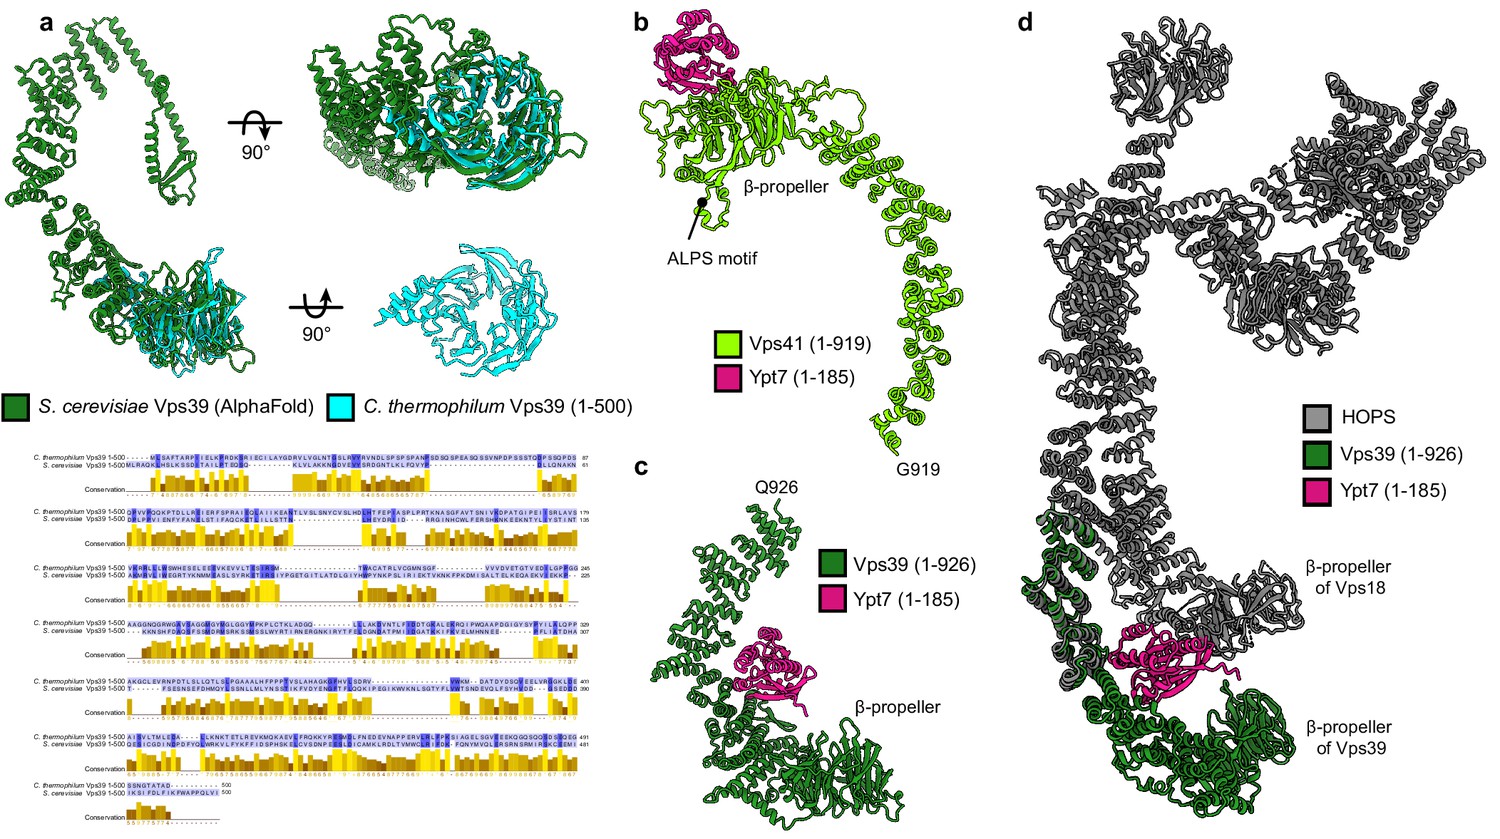
Ypt7 interaction with Vps41 and Vps39.
(A) Structure of the β-propeller of Chaetomium thermophilum Vps39 confirms the structure prediction. Cristal structure of C. thermophilum Vps39 (1–500) construct (cyan) is shown and superimposed on the model of Saccharomyces cerevisiae Vps39 (dark green) generated by AlphaFold. Below, sequence alignment of Vps39 N-terminal fragments from C. thermophilum and S. cerevisiae is displayed. Alignment is made using MUSCLE (Edgar, 2004) and visualized in Jalview (Waterhouse et al., 2009); coloring by conservation. (B) Model of Vps41 (light green, residues 1–919) with Ypt7 (pink, residues 1–185) generated by AlphaFold (multimer mode). According to the model, Ypt7 binds to the β-propeller of Vps41 at the opposite side than the identified membrane-interacting ALPS motif (Cabrera et al., 2010). (C) Model of Vps39 (dark green, residues 1–926) with Ypt7 (pink, residues 1–185) was obtained as in (A). Ypt7 binds to the inside of the α-solenoid of Vps39 according to the model. (D) The model from (B), fitted to the atomic model of HOPS generated in this study (gray, see Figure 2). According to the AlphaFold model, Ypt7 has a contact site not only with Vps39 but also with Vps18 β-propeller.
Figure 4 with 1 supplement
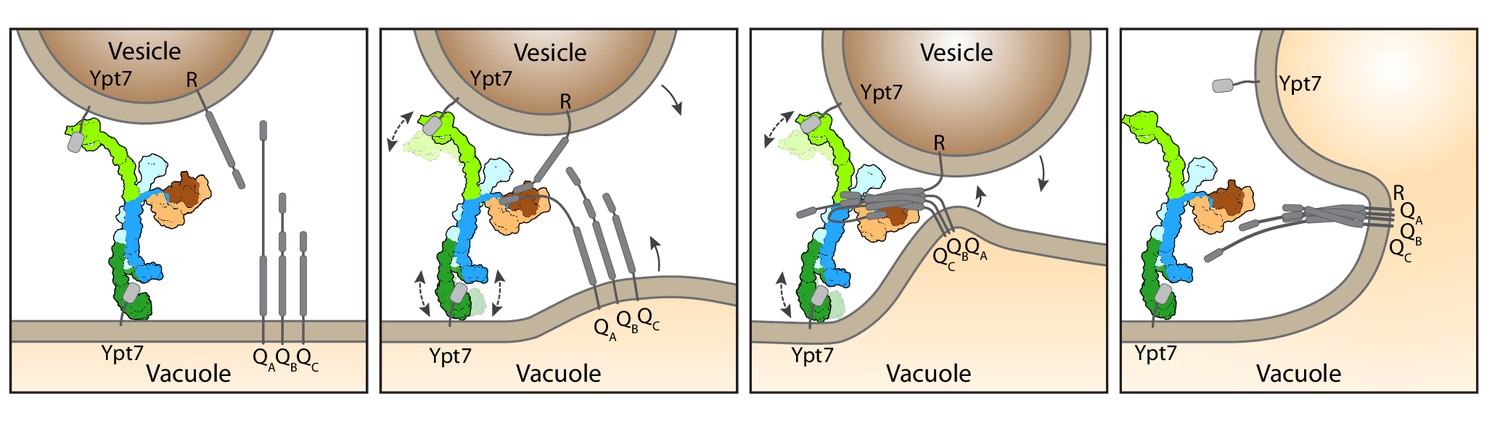
Working model for HOPS-mediated membrane tethering and fusion.
The HOPS complex binds to Ypt7 on the vacuole and vesicles via Vps39 (dark green) and Vps41 (light green). SNARE proteins are recruited to HOPS by their N-terminal domains and the SNARE-binding module (dark and light brown). The stable central core of HOPS keeps the membranes in place, while Vps41 and Vps39 may function as dampers due to their limited flexibility. Consequentially, zippering of SNAREs, which is initiated by binding to Vps33 (dark brown), begins. As the N-terminal domains of SNAREs bind to HOPS, further SNARE zippering may occur with the HOPS backbone acting as a lever (not shown here). This may cause membrane stress and thus catalyzes fusion. HOPS may let go of Ypt7 and SNAREs thereafter. For details see text.
Figure 4—figure supplement 1
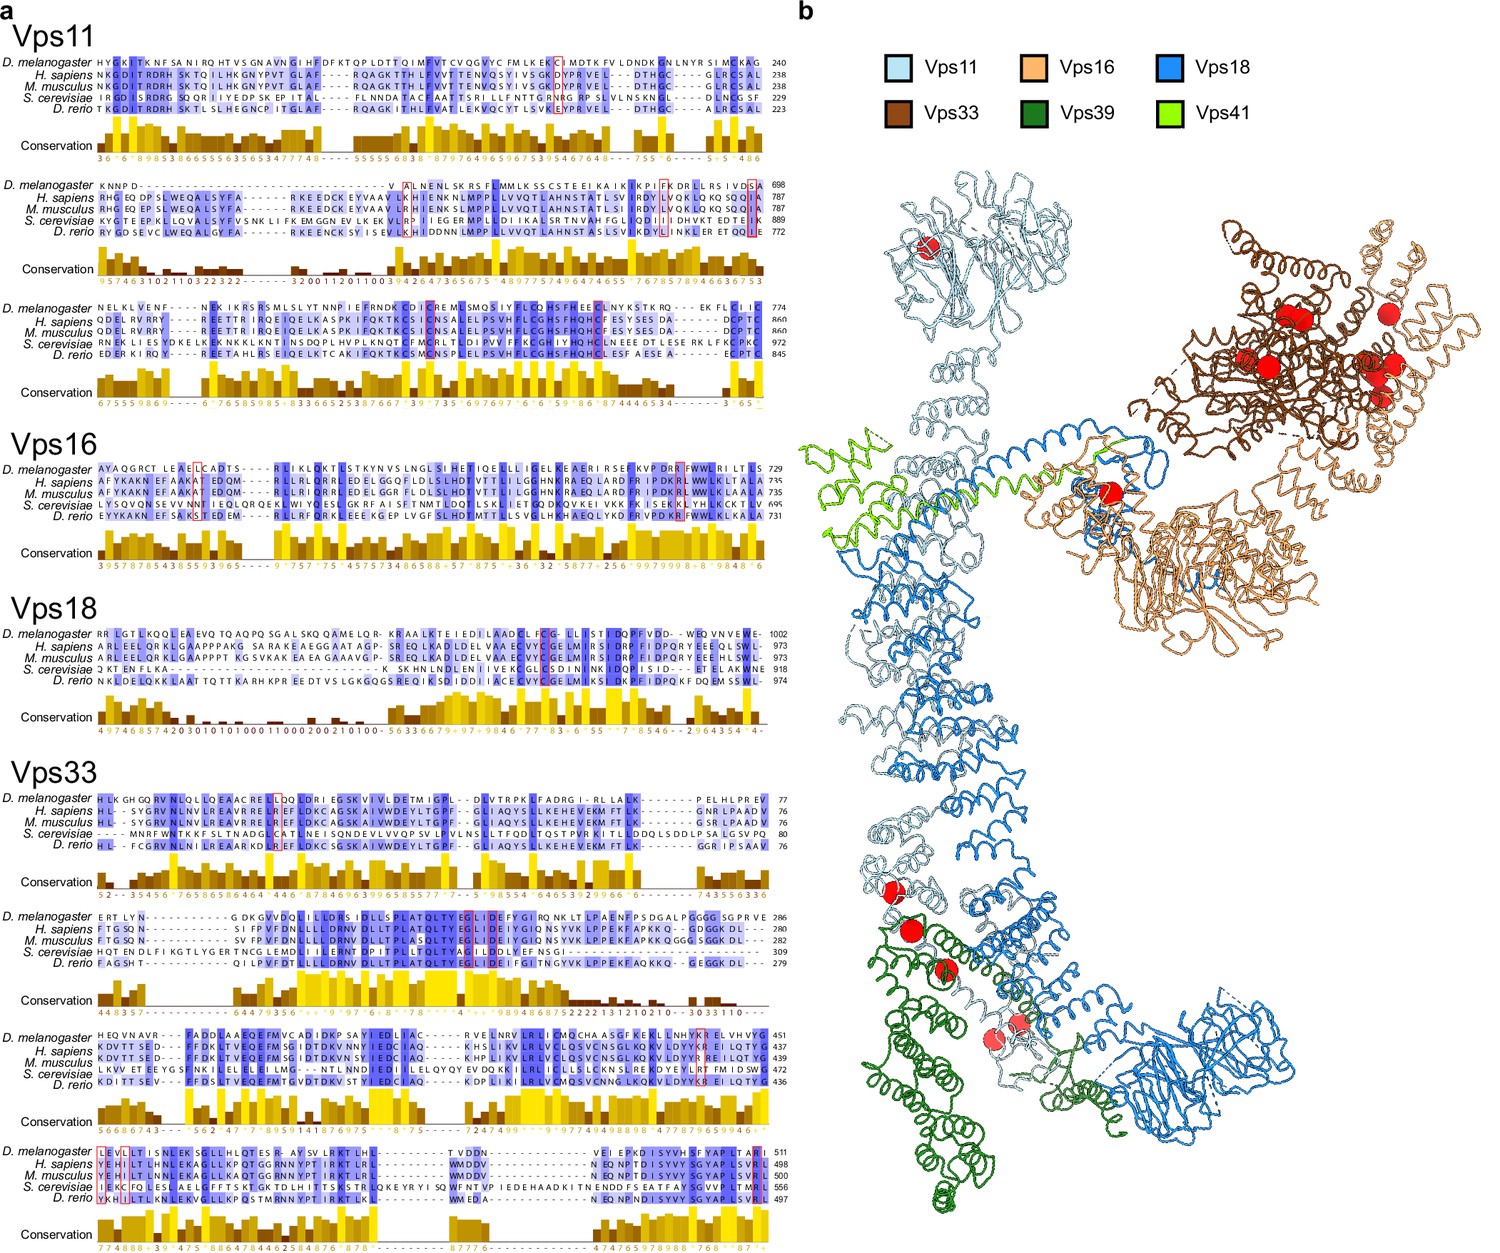
Point mutations affecting HOPS function.
(A) Multiple sequence alignment of HOPS subunit fragments from different model organisms (Drosophila melanogaster, Homo sapiens, Mus musculus, Saccharomyces cerevisiae, and Danio rerio) displaying known point mutations (red frames) (van der Beek et al., 2019; Peterson and Emr, 2001). (B) Mutations from (A) are labeled on the structure of HOPS (see Figure 2) as red spheres. In cases where mutations were described for a different organism, respective homologous residues in yeast were mapped according to the alignment in (A).
Videos
Video 1
Overall architecture of HOPS tethering complex: transition between ribbon and molecular surface representation.
Additional files
-
Supplementary file 1
Yeast strains used in the study.
- https://cdn.elifesciences.org/articles/80901/elife-80901-supp1-v2.docx
-
Supplementary file 2
Cryo-EM data collection, refinement and validation statistics.
- https://cdn.elifesciences.org/articles/80901/elife-80901-supp2-v2.docx
-
Supplementary file 3
Crystallographic data collection and refinement statistics (molecular replacement).
- https://cdn.elifesciences.org/articles/80901/elife-80901-supp3-v2.docx
-
MDAR checklist
- https://cdn.elifesciences.org/articles/80901/elife-80901-mdarchecklist1-v2.docx
Download links
A two-part list of links to download the article, or parts of the article, in various formats.
Downloads (link to download the article as PDF)
Open citations (links to open the citations from this article in various online reference manager services)
Cite this article (links to download the citations from this article in formats compatible with various reference manager tools)
Structure of the HOPS tethering complex, a lysosomal membrane fusion machinery
eLife 11:e80901.
https://doi.org/10.7554/eLife.80901


