Differential requirements for mitochondrial electron transport chain components in the adult murine liver
- Children's Medical Center Research Institute, University of Texas Southwestern Medical Center, United States
- Department of Biochemistry, University of Texas Southwestern Medical Center, United States
- Harold C. Simmons Comprehensive Cancer Center, University of Texas Southwestern Medical Center, United States
- Advanced Imaging Research Center, University of Texas Southwestern Medical Center, United States
- Department of Pediatrics, University of Texas Southwestern Medical Center, United States
- Howard Hughes Medical Institute, University of Texas Southwestern Medical Center, United States
Figures
Figure 1 with 3 supplements
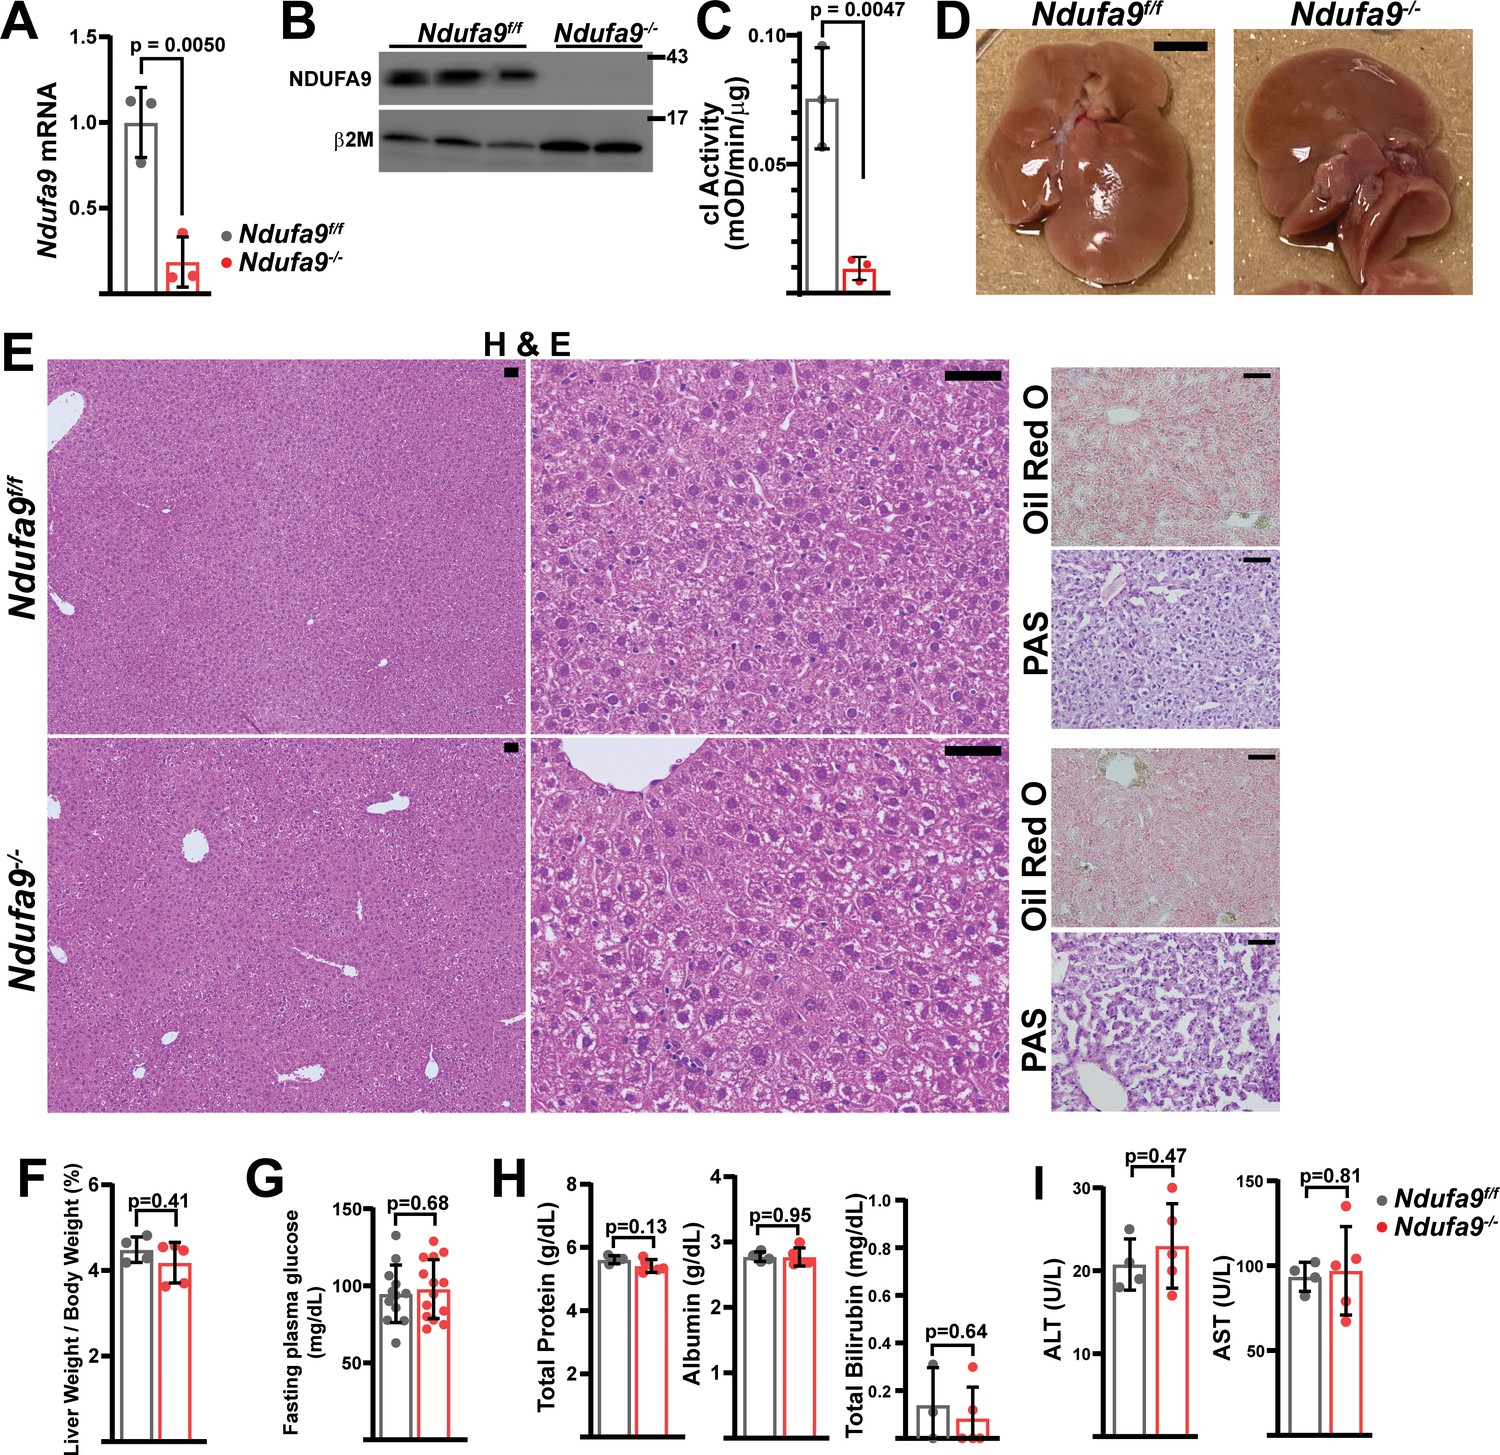
Mitochondrial complex I is dispensable in adult murine hepatocytes.
(A) Ndufa9 mRNA levels (relative to β2-microglobulin; normalized) in isolated hepatocytes of the indicated genotype, assessed by qRT-PCR. n=3 animals per group. The same color scheme is used throughout this figure. (B) Ndufa9 protein levels in isolated hepatocytes of the indicated genotype, assessed by Western blot. β2-microglobulin levels are shown as a loading control. MW markers are indicated in kDa. (C) Complex I activity measurements from livers of the indicated genotype. n=3 animals per group. (D) Representative images of gross liver anatomy in animals of the indicated genotype. Scale bar: 0.5 cm. (E) Representative histology (H&E, Oil Red O, PAS staining) images of liver cross sections from animals of the indicated genotype. Scale bar: 50 μm. (F) Liver weight (normalized to body weight) from mice of the indicated genotype. n=4–5 animals per group. (G) Fasting plasma glucose levels in mice of the indicated genotype. n=12–14 animals per group. (H) Circulating plasma markers (total protein, albumin, and total bilirubin) of liver function in mice of the indicated genotype. n=3–5 animals per group. (I) Plasma markers (ALT and AST) of liver damage in mice of the indicated genotype. n=4–5 mice per group. All data were collected at 4 weeks post AAV-administration. Statistical significance was assessed using two-tailed t-test (A,C,G,H,I) or Mann-Whitney (F,H) tests with adjustments for multiple comparisons. All data represent mean +/-standard deviation from biological replicates. Full gel images are provided in Figure 1—source data 1. Numerical data for individual panels are provided in Supplementary file 3.
-
Figure 1—source data 1
Full gel images for Figure 1.
Full gel images and original image files for western blots in Figure 1.
- https://cdn.elifesciences.org/articles/80919/elife-80919-fig1-data1-v2.zip
Figure 1—figure supplement 1
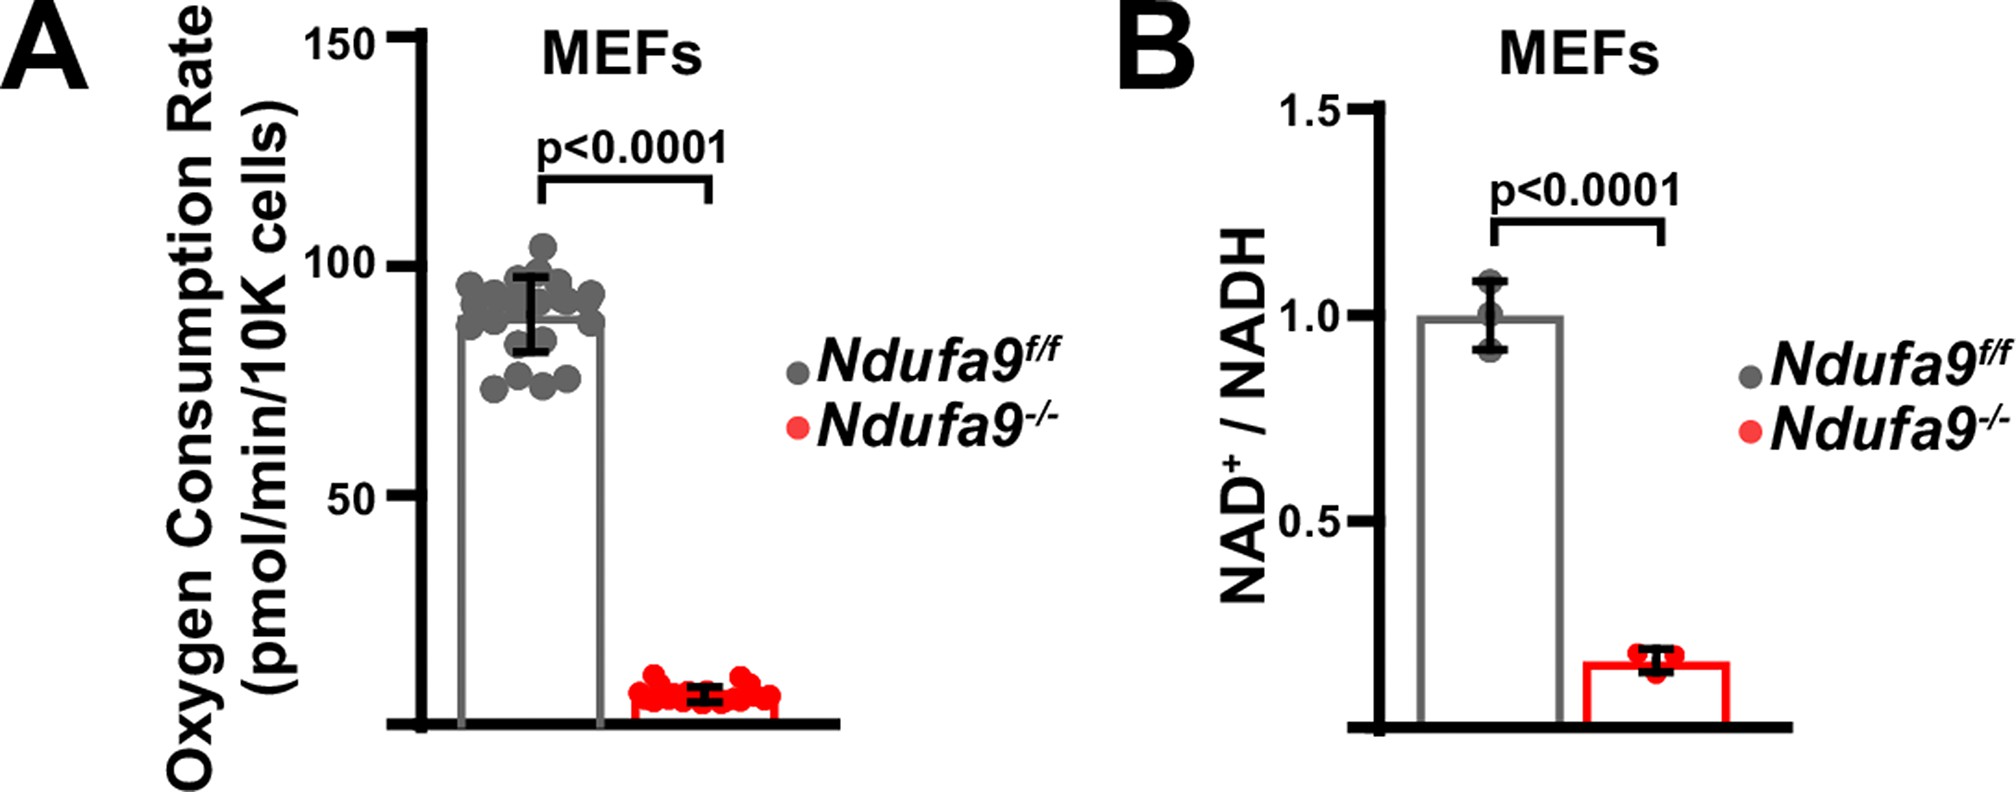
Metabolic flux analysis of Ndufa9f/f and Ndufa9-/- MEFs.
(A) Oxygen consumption rates in Ndufa9f/f and Ndufa9-/- mouse embryonic fibroblasts (MEFs). n=22–24 wells per group. The same color scheme is used throughout this figure. (B) Normalized NAD+ / NADH ratios in MEFs of the indicated genotype. n=3 wells per group. Numerical data for individual panels are provided in Supplementary file 3.
Figure 1—figure supplement 2
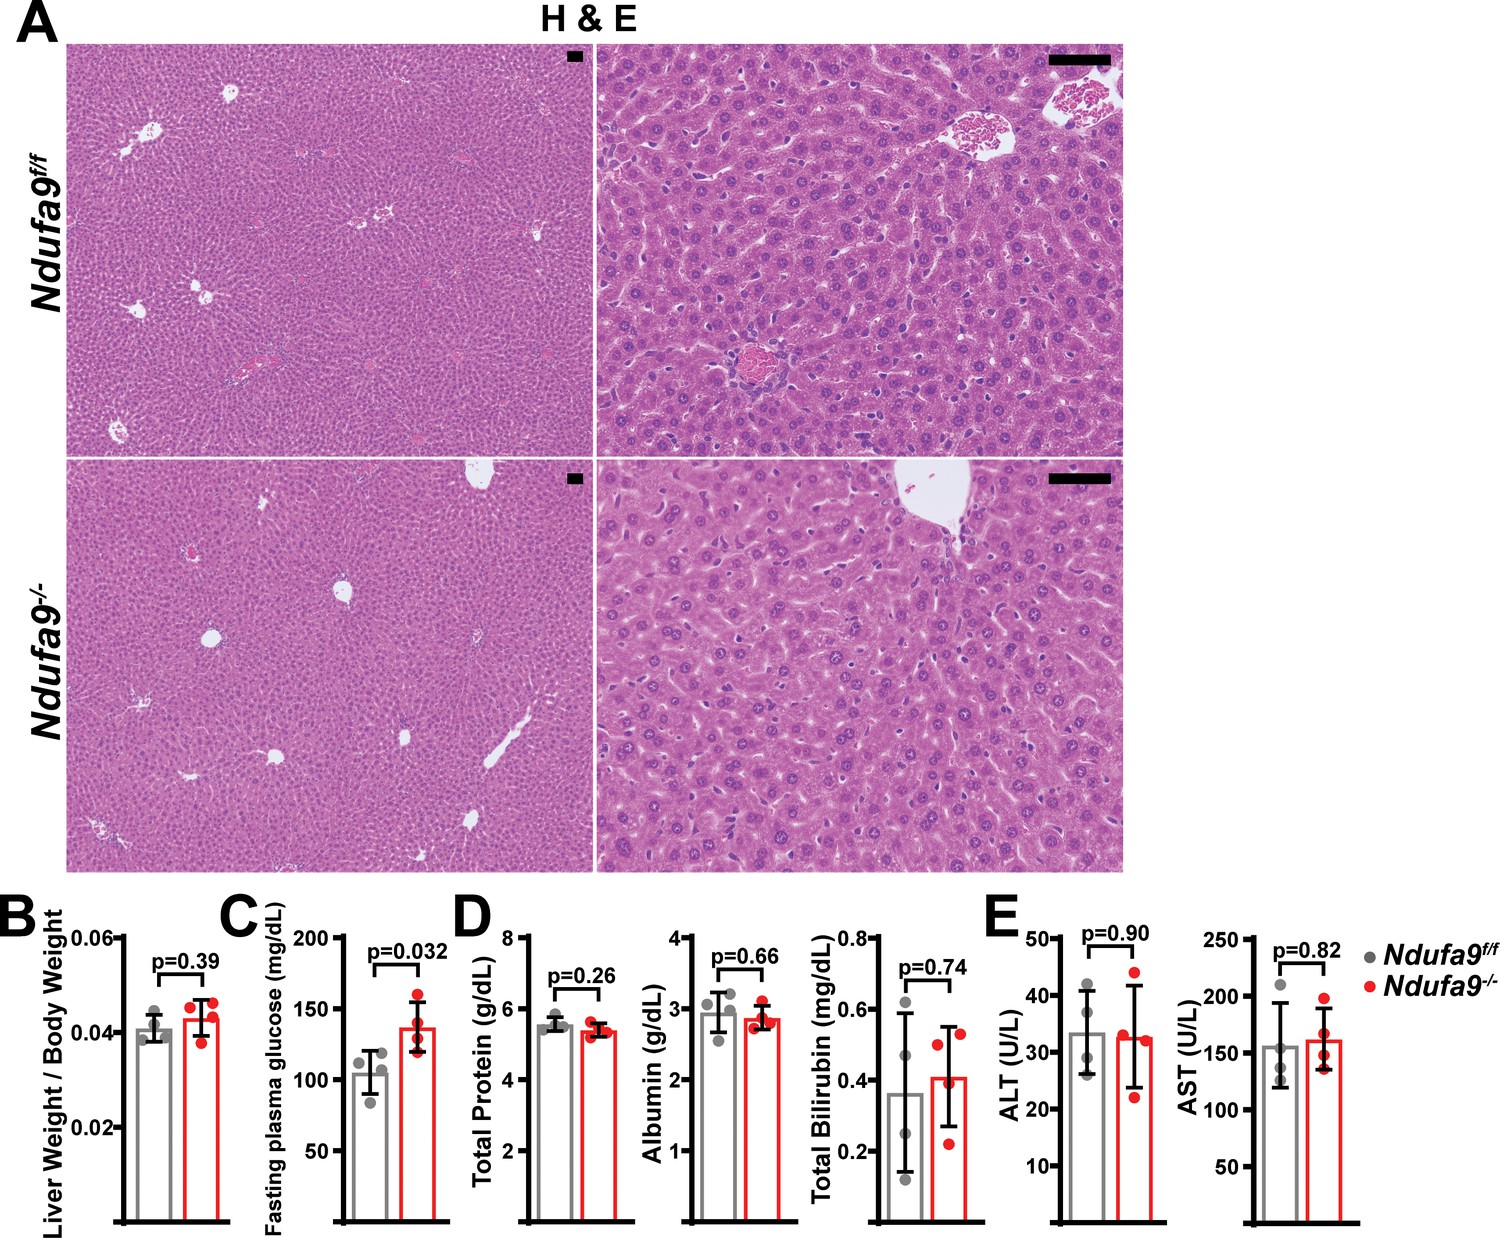
Analysis of Ndufa9-/- livers at 2 weeks post-AAV administration.
(A) Representative histology (H&E, Oil Red O, PAS staining) images of liver cross sections from animals of the indicated genotype at 2 weeks post-AAV administration. Scale bar: 50 μm. (B) Liver weight / body weight ratios in animals of the indicated genotype. n=4 mice per group. The same color scheme is used throughout this figure. (C) Fasting plasma glucose levels in mice of the indicated genotype. n=4 mice per group. (D) Circulating plasma markers (total protein, albumin, and total bilirubin) of liver function in mice of the indicated genotype. n=4 animals per group. (E) Plasma markers (ALT and AST levels) of liver damage in mice of the indicated genotype. n=4 mice per group. Statistical significance was assessed using two-tailed t-test (B,C,D,E). All data in this figure were collected at 2 weeks post AAV-administration. All data represent mean +/-standard deviation from biological replicates, unless noted otherwise. Numerical data for individual panels are provided in Supplementary file 3.
Figure 1—figure supplement 3
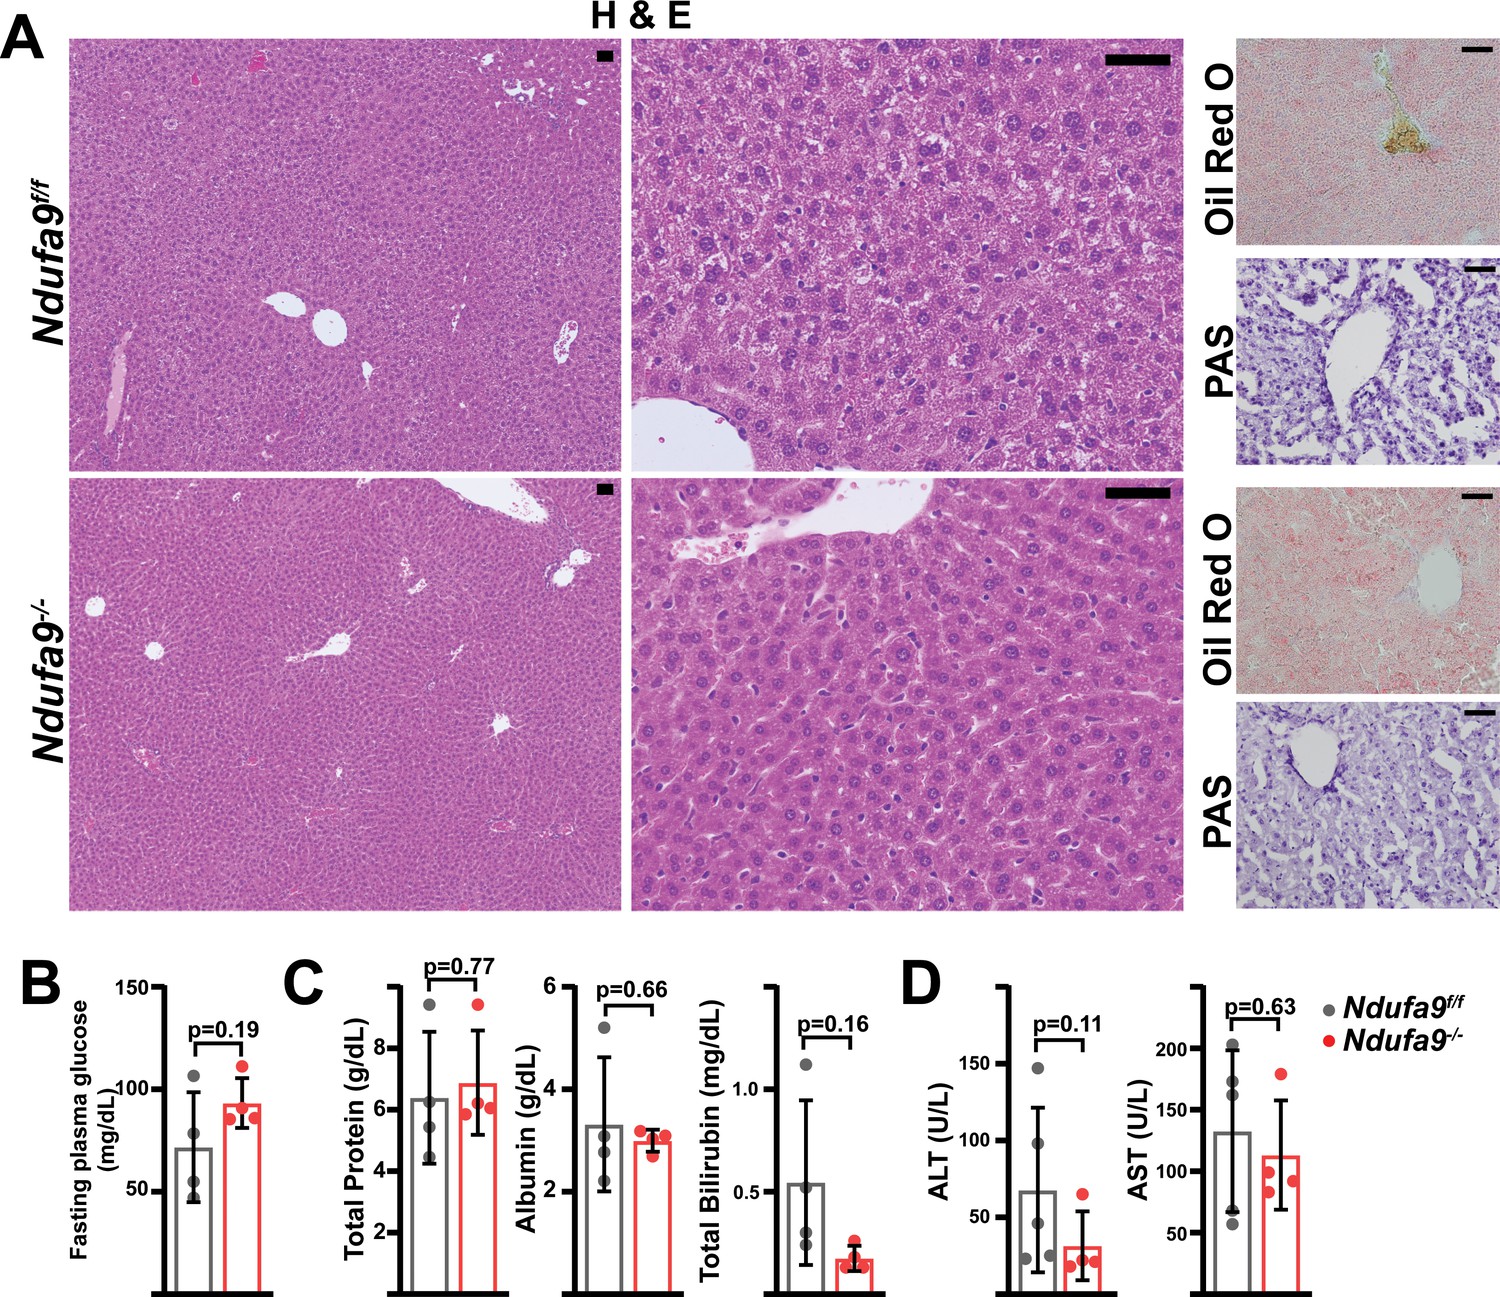
Analysis of Ndufa9-/- livers at 8 weeks post-AAV administration.
(A) Representative histology (H&E, Oil Red O, PAS staining) images of liver cross-sections from animals of the indicated genotype at eight weeks post-AAV administration. Scale bar: 50 μm. (B) Fasting plasma glucose levels in mice of the indicated genotype. n=4 mice per group. The same color scheme is used throughout this figure. (C) Circulating plasma markers (total protein, albumin, and total bilirubin) of liver function in mice of the indicated genotype. n=4 animals per group. (D) Plasma markers (ALT and AST levels) of liver damage in mice of the indicated genotype. n=4 mice per group. All data in this figure were collected at 8 weeks post AAV-administration. Statistical significance was assessed using two-tailed t-test (B,C,D). All data represent mean +/-standard deviation from biological replicates. Numerical data for individual panels are provided in Supplementary file 3.
Figure 2 with 2 supplements

Complex I deficiency in adult liver does not impact redox status.
(A) ATP levels from livers of the indicated genotype. n=3 mice per group. The same color scheme is used throughout this figure. (B) Reduced glutathione to oxidized glutathione ratio (GSH/GSSG) in livers of the indicated genotype, as a proxy of oxidative stress. n=8–9 mice per group. (C) NAD+/NADH and NADPH/NADP+ ratios in livers of the indicated genotype. n=6 mice per group. (D) Normalized cytosolic (pyruvate / lactate) and mitochondrial (acetoacetate / β−hydroxybutyrate) redox ratios in livers of the indicated genotype. n=6 mice per group. (E) Tissue and plasma α−hydroxybutyrate levels in animals of the indicated genotype. n=4–6 mice per group. (F) Unsupervised hierarchical clustering of protein abundances in Ndufa9f/f and Ndufa9-/- livers, depicted as a heatmap of z-scores. (G) Volcano plot of protein abundances changes in Ndufa9-/- vs. Ndufa9f/f livers, based on proteomics analysis. Log2(Fold change) is plotted against the –log10(adjusted p-value) for each protein. Significantly changing proteins (log2(Fold change)>1 or < –1; Adjusted p-val <0.05) are colored black, and mitochondrial proteins are colored red. n=6 mice per group. (H) Volcano plot of abundances for mitochondrial ETC proteins in Ndufa9-/- vs. Ndufa9f/f livers, based on proteomics analysis. (I) Levels of mitochondrial proteins (PC, pyruvate carboxylase, and Tomm20) in livers of the indicated genotype, as assessed by western blot. Actin levels are shown as a loading control. MW markers are indicated in kDa. (J) Relative amounts of Tomm20 and PC in livers of the indicated genotype, relative to actin levels. n=4 animals per group. (K) Mitochondrial genome (mtDNA) to nuclear genome (nDNA) ratios in livers of the indicated genotype. n=8–9 mice per group. (L) Unsupervised hierarchical clustering of liver metabolite abundances in Ndufa9f/f and Ndufa9-/- livers, depicted as a heatmap of z-scores. (M) Volcano plot of metabolite abundance changes in Ndufa9-/- vs. Ndufa9f/f livers, based on metabolomics analysis. Log2(Fold change) is potted against the –log10(adjusted p-value) for each metabolite. Significantly changing metabolites (log2(Fold change)>1 or < –1; Adjusted p-val <0.05) are colored black. TMP, Thiamine monophosphate. n=6 mice per group. (N) Relative abundances of mitochondrial TCA cycle and related metabolites from livers of the indicated genotype. n=6 mice per group. All data were collected at 4 weeks post AAV-administration. Statistical significance was assessed using two-tailed t-test (A,C,D,E,J,K,N) or Mann-Whitney (B) with adjustments for multiple comparisons. All data represent mean +/-standard deviation from biological replicates. Full gel images are provided in Figure 2—source data 1. Numerical data for individual panels are provided in Supplementary file 1 and Supplementary file 3.
-
Figure 2—source data 1
Full gel images for Figure 2.
Full gel images and original image files for western blots in Figure 2.
- https://cdn.elifesciences.org/articles/80919/elife-80919-fig2-data1-v2.zip
Figure 2—figure supplement 1

Analysis of mitochondrial proteomes in complex I deficient livers.
(A) Volcano plot of protein abundances changes in Ndufa9-/- vs. Ndufa9f/f livers, based on proteomics analysis of enriched mitochondria. Mitochondrial proteins (based on MitoCarta 3.0) are shown. Log2(fold change) is plotted against the –log10(adjusted p-value) for each protein. Significantly changing proteins (log2(fold change)>1 or < –1; Adjusted p-val <0.05) are colored black. n=3 mice per group; 4 weeks post-AAV administration. (B) Volcano plot of abundances for mitochondrial ETC proteins in mitochondria purified from Ndufa9-/- vs. Ndufa9f/f livers, based on proteomics analysis. Numerical data for individual panels are provided in Supplementary file 1.
Figure 2—figure supplement 2
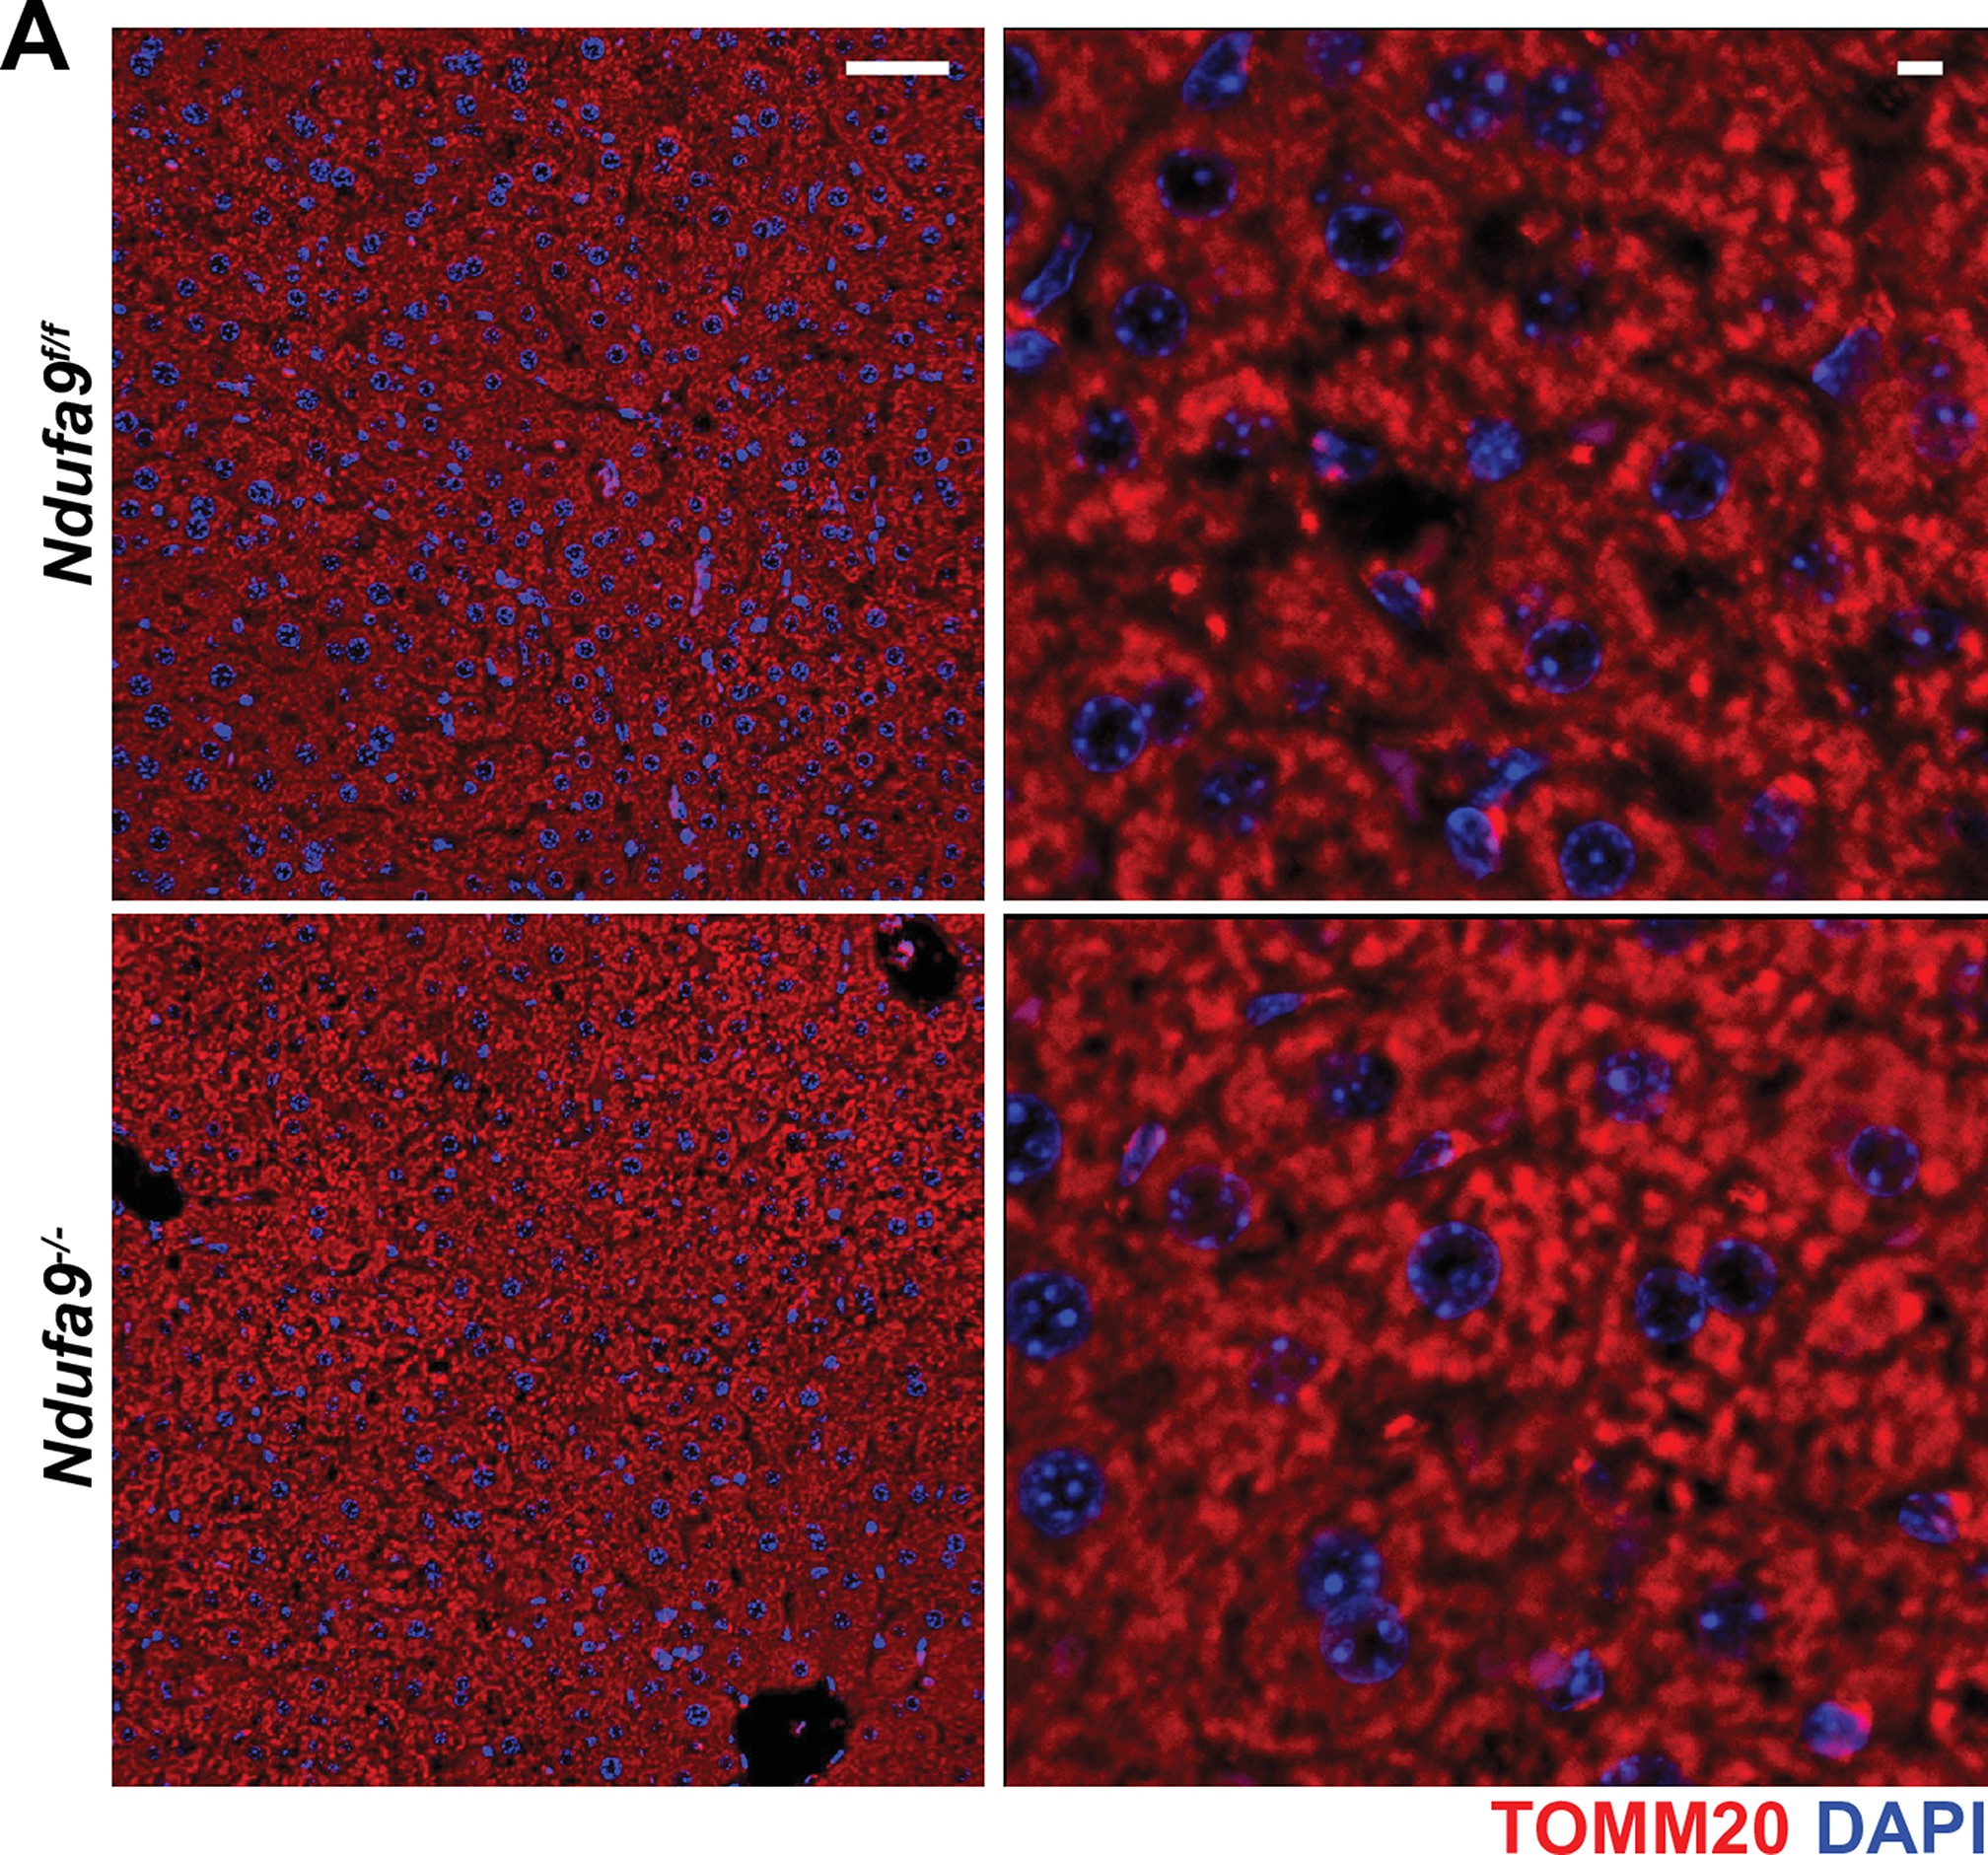
Immunofluorescence of hepatic sections.
Representative immunofluorescent images of liver sections at 20 x (left; scale bar 50 μm) and 63 x (right; scale bar 5 μm) of the indicated genotype. TOMM20 (mitochondrial) staining is indicated in red; nuclear staining (DAPI) is indicated in blue. Data was collected at 4 weeks post-AAV administration.
Figure 3 with 1 supplement

Complex I deficiency in adult liver does not impact glucose utilization or oxygen status.
(A) Schematic of potential fates of glucose and lactate within central carbon metabolism. Carbon atoms are indicated with circles for each compound. G1P, glucose-1-phosphate; 3 PG, 3-phosphoglycerate; 2 PG, 2-phosphoglycerate; PEP, phosphoenolpyruvate; pyr, pyruvate; lac, lactate; acCoA, acetyl-CoA; OAA, oxaloacetate; glu, glutamate; αkg, αketoglutarate. (B) Plasma enrichment of m+6 glucose during steady-state infusions of [U-13C]glucose. n=3 animals per group. The same color scheme is used throughout this figure. (C) Steady-state liver enrichment of m+6 glucose in animals of the indicated genotype. n=3 animals per group. (D) Labeled fractions (1-(m+0)) of the indicated metabolites, relative to liver glucose m+6 enrichment. n=3 animals per group. (E) Schematic of MRI experiments. Anesthetized animals were challenged to breath room air, followed by 100% O2, followed by MR imaging to measure perfusion (in room air), and blood and tissue oxygenation in each condition. (F) Perfusion values (reported as institutional units (I.U.)) based on arterial spin labeling in animals of the indicated genotype. n=3–4 animals per group. (G) Relative (%) changes in hepatic T2* following exposure to 100% O2 in animals of the indicated genotype. n=3–4 animals per group. (H) Representative heatmaps of T1 apparent values (T1app) in livers, overlaid on T1-weighted MR images. (I) Representative distribution of T1app values in an animal of each genotype breathing room air, followed by 100% O2. (J) Average hepatic T1app values in animals of the indicated genotype, breathing room air followed by 100% O2. n=3–4 animals per group. (K) Average regional changes in T1 (ΔT1) in animals of the indicated genotype. n=3–4 animals per group. All data were collected at 4 weeks post AAV-administration. Statistical significance was assessed using two-tailed t-test (C,D,F,G,K) or Mann-Whitney (I) with adjustments for multiple comparisons. All data represent mean +/-standard deviation from biological replicates. Numerical data for individual panels are provided in Supplementary file 1 and Supplementary file 3.
Figure 3—figure supplement 1
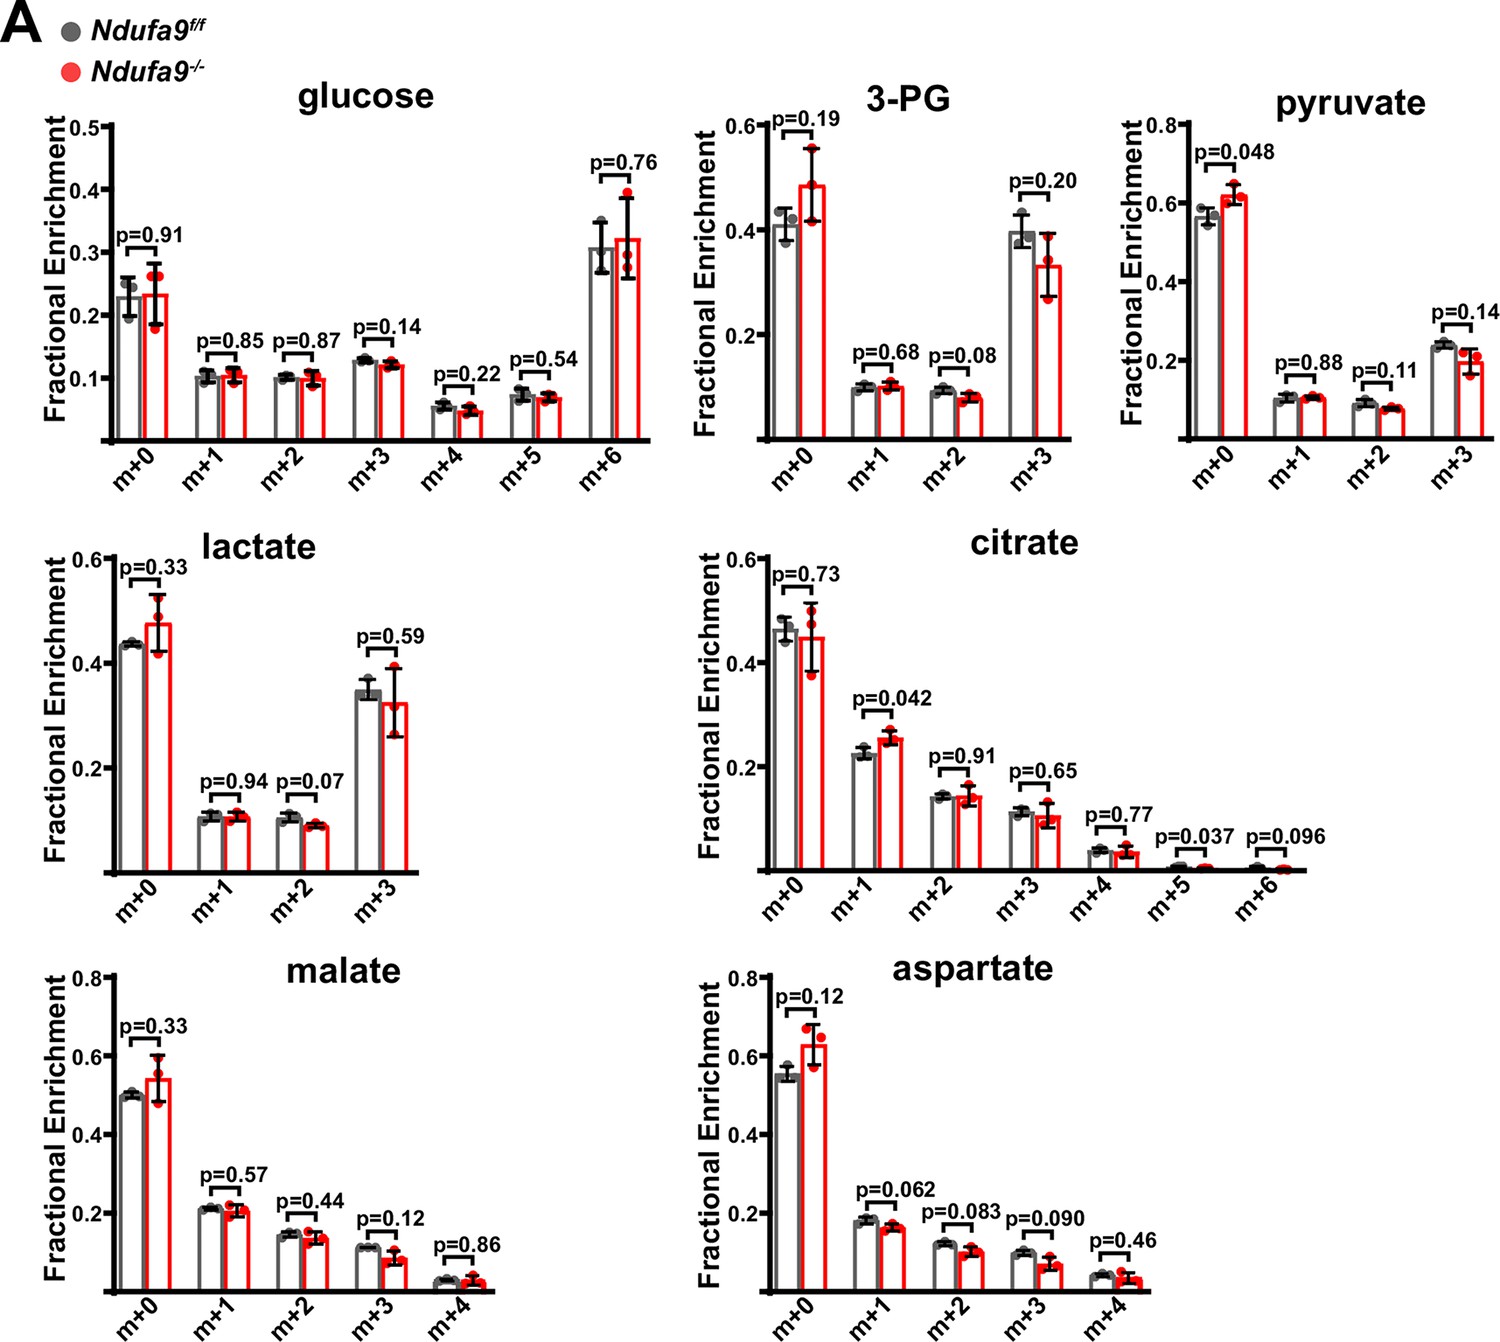
Metabolic analysis of complex I deficient livers.
(A) Mass isotopomer distributions in liver tissue from [U-13C]glucose infusions in animals of the indicated genotype. n=3 animals per group; 4 weeks post-AAV administration. Statistical significance was assessed using t-tests (A) with adjustments for multiple comparisons. All data represent mean +/-standard deviation from biological replicates. Numerical data for individual panels are provided in Supplementary file 1.
Figure 4 with 1 supplement
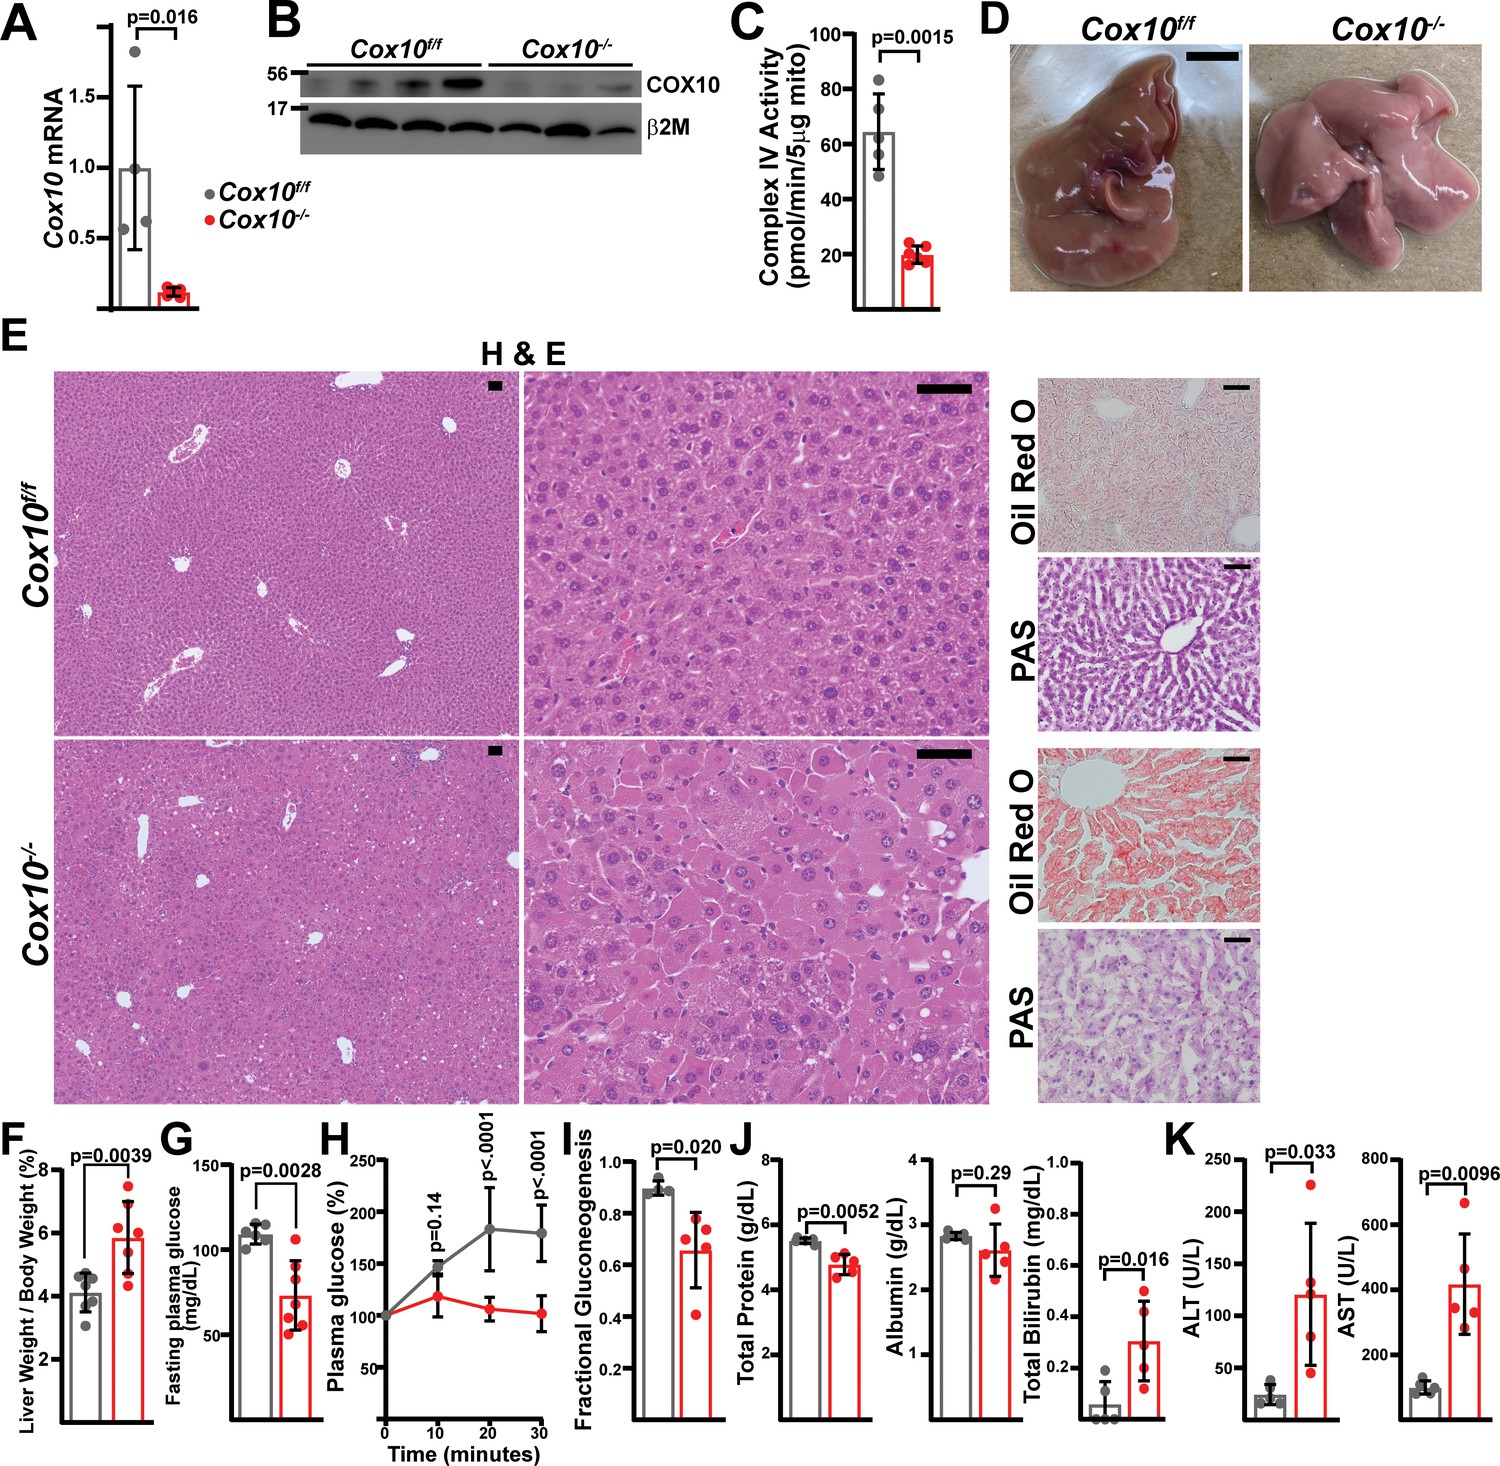
Complex IV deficiency in adult hepatocytes induces liver dysfunction.
(A) Cox10 mRNA levels (relative to β2-microglobulin; normalized) in livers of the indicated genotype, assessed by qRT-PCR at 4 weeks post-AAV administration. n=4–5 animals per group. The same color scheme is used throughout this figure. (B) Cox10 protein levels in livers of the indicated genotype, assessed by Western blot at 4 weeks post AAV-administration. β2-microglobulin levels are shown as a loading control. MW markers are indicated in kDa. (C) Complex IV activity (pmol O2 consumed / min) in isolated mitochondria supplemented with ascorbate/TMPD substrates from livers of the indicated genotype, assessed at 4 weeks post AAV-administration. n=5–6 animals per group. (D) Representative images of gross liver anatomy in animals of the indicated genotype at 8 weeks post AAV-administration. Scale bar: 0.5 cm. (E) Representative histology (H&E, Oil Red O, PAS staining) images of liver cross sections from animals of the indicated genotype at 8 weeks post-AAV administration. Scale bar: 50 μm. (F) Liver weight (normalized to body weight) from mice of the indicated genotype at 8 weeks post-AAV administration. n=7 animals per group. (G) Fasting plasma glucose levels in mice of the indicated genotype at 8 weeks post-AAV administration. n=6–7 animals per group. (H) Relative changes in plasma glucose following a lactate/pyruvate tolerance test in mice of the indicated genotype at 8 weeks post-AAV administration. n=4–5 mice per group. (I) Fractional gluconeogenesis (plasma) in animals of the indicated genotype, measured via pyruvate/lactate tolerance test at 8 weeks post-AAV administration. n=4–5 animals per group. (J) Circulating plasma markers (total protein, albumin, and total bilirubin) of liver function in mice of the indicated genotype at 8 weeks post-AAV administration. n=5 animals per group. (K) Plasma markers (ALT and AST) of liver damage in mice of the indicated genotype at 8 weeks post-AAV administration. n=5 mice per group. Statistical significance was assessed using two-way ANOVA (H), t-test (C,F,G,I,J,K) or Mann-Whitney (A,K) tests with adjustments for multiple comparisons. All data represent mean +/-standard deviation from biological replicates. Full gel images are provided in Figure 4—source data 1. Numerical data for individual panels are provided in Supplementary file 3.
-
Figure 4—source data 1
Full gel images for Figure 4.
Full gel images and original image files for western blots in Figure 4.
- https://cdn.elifesciences.org/articles/80919/elife-80919-fig4-data1-v2.zip
Figure 4—figure supplement 1
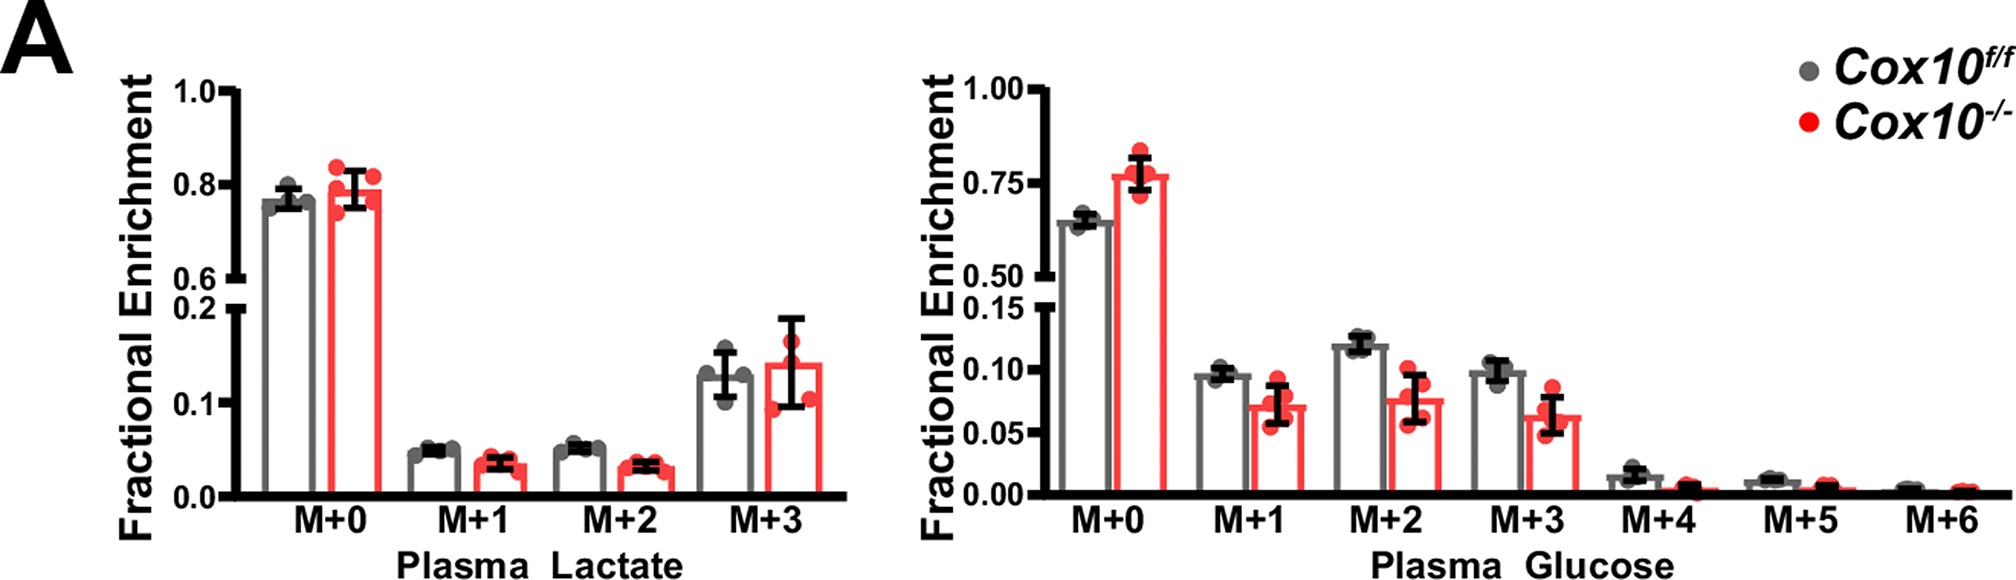
Lactate/pyruvate tolerance test in complex IV deficient livers.
(A) Mass isotopomer distributions related to lactate/pyruvate tolerance test (Figure 4H, I), for plasma lactate and glucose. n=4–5 mice per group; 8 weeks post-AAV administration. Numerical data for individual panels are provided in Supplementary file 2.
Figure 5 with 8 supplements
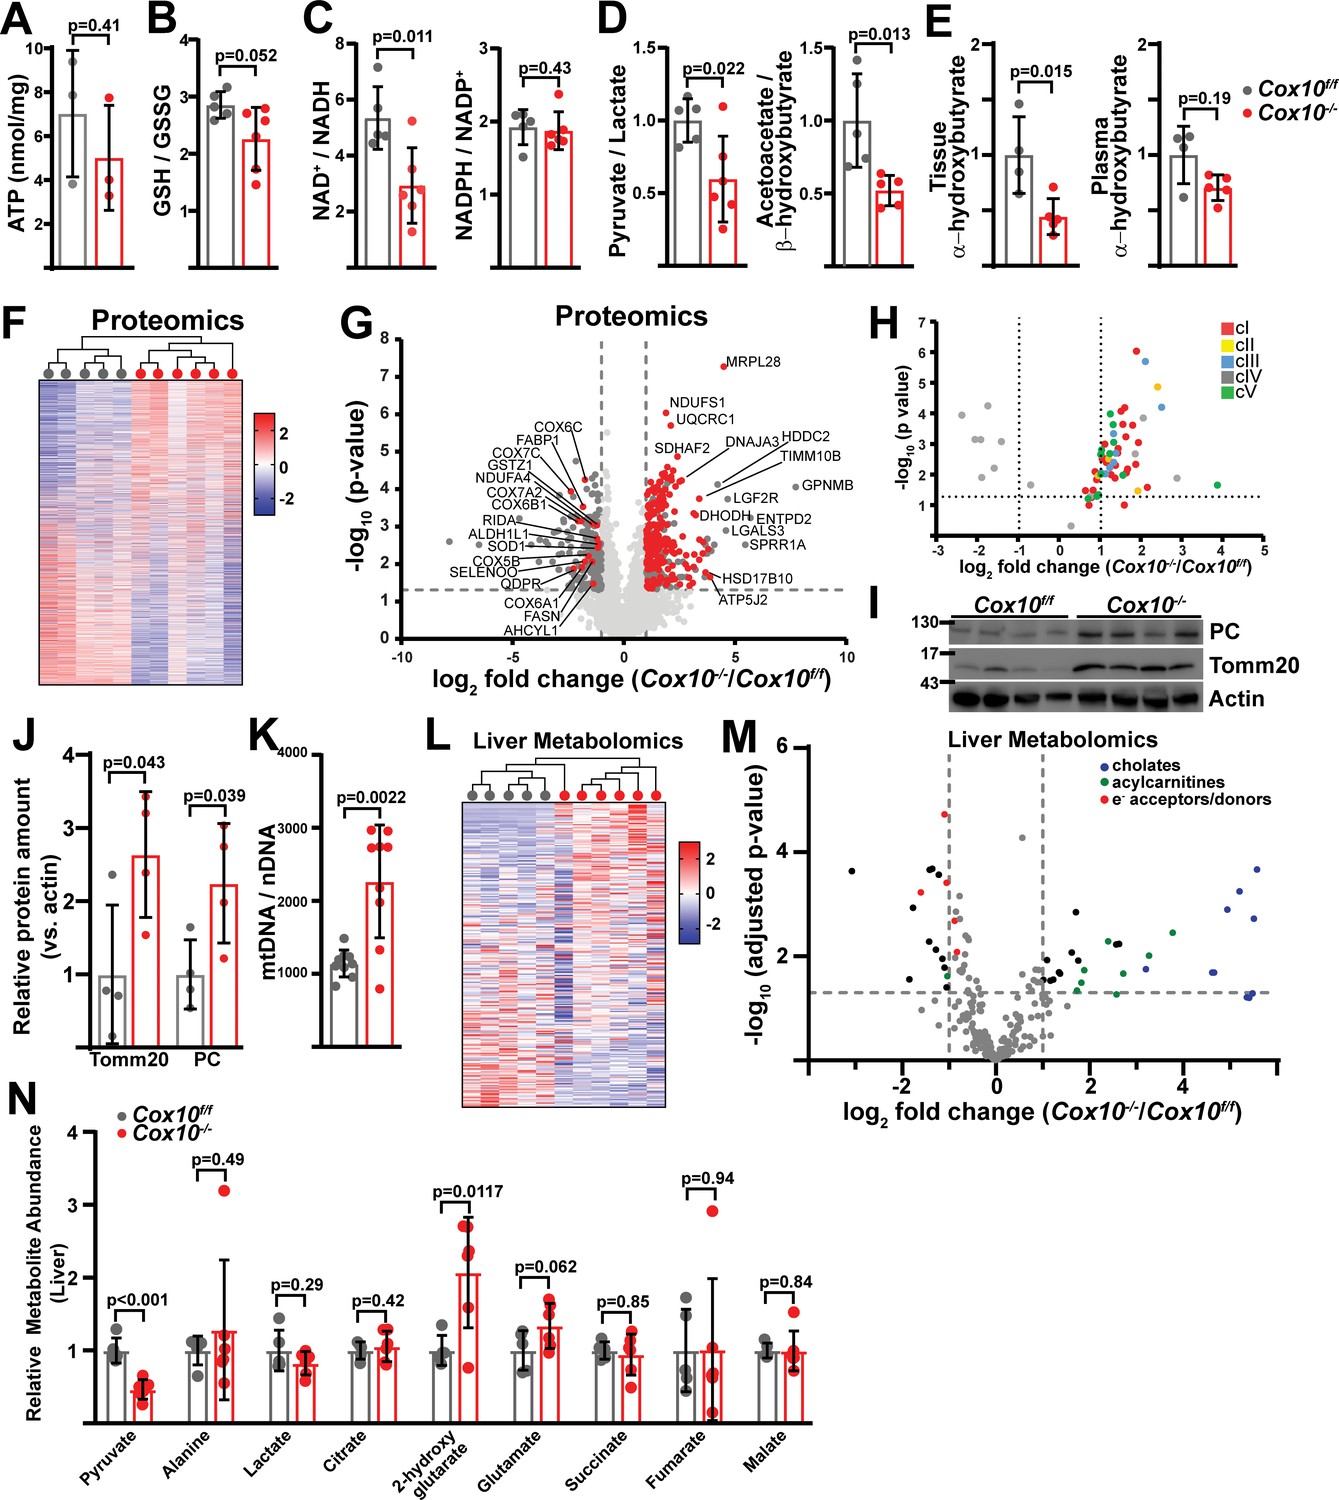
Complex IV deficiency alters metabolism and cellular redox status in adult liver.
(A) ATP levels in livers of the indicated genotype. n=3 animals per group. The same color scheme is used throughout this figure. (B) Reduced glutathione to oxidized glutathione ratio (GSH:GSSG) in livers of the indicated genotype, as a proxy of oxidative stress. n=5–6 mice per group. (C) NAD+/NADH and NADPH/NADP+ ratios in livers of the indicated genotype. n=5–6 mice per group. (D) Normalized cytosolic (pyruvate / lactate) and mitochondrial (acetoacetate / β−hydroxybutyrate) redox ratios in livers of the indicated genotype. n=5–6 mice per group. (E) Normalized tissue and plasma α−hydroxybutyrate levels in animals of the indicated genotype. n=4–5 mice per group. (F) Unsupervised hierarchical clustering of protein abundances in Cox10f/f and Cox10-/- livers, depicted as a heatmap of z-scores. (G) Volcano plot of protein abundances changes in Cox10-/- vs. Cox10f/f livers, based on proteomics analysis. Log2(Fold change) is plotted against the –log10(adjusted p-value) for each protein. Significantly changing proteins (log2(Fold change)>1 or < –1; Adjusted p-val <0.05) are colored dark gray; of these, mitochondria-localized proteins are colored red. n=5–6 mice per group. (H) Volcano plot of abundances for mitochondrial ETC proteins in Cox10-/- vs. Cox10f/f livers, based on proteomics analysis. (I) Levels of mitochondrial proteins (PC, pyruvate carboxylase, and Tomm20) in livers of the indicated genotype, as assessed by western blot. Actin levels are shown as a loading control. MW markers are indicated in kDa. (J) Relative amounts of Tomm20 and PC in livers of the indicated genotype, relative to actin levels. n=4 animals per group. (K) Mitochondrial genome (mtDNA) to nuclear genome (nDNA) ratios in livers of the indicated genotype. n=9 mice per group. (L) Unsupervised hierarchical clustering of metabolite abundances in Cox10f/f and Cox10-/- livers, depicted as a heatmap of z-scores. (M) Volcano plot of metabolite abundance changes in Cox10-/- vs. Cox10f/f livers, based on metabolomics analysis. Log2(Fold change) is potted against the –log10(adjusted p-value) for each metabolite. Significantly changing metabolites (log2(Fold change)>1 or < –1; Adjusted p-val <0.05) are colored black. n=5–6 mice per group. (N) Relative abundances of mitochondrial TCA cycle and related metabolites from livers of the indicated genotype. n=5–6 mice per group. All data in this figure were collected at 8 weeks post AAV-administration. Statistical significance was assessed using t-test (A,B,C,D,E,J,K,N), or Mann-Whitney (C,E) tests with adjustments for multiple comparisons. All data represent mean +/-standard deviation from biological replicates. Full gel images are provided in Figure 5—source data 1. Numerical data for individual panels are provided in Supplementary file 2 and Supplementary file 3.
-
Figure 5—source data 1
Full gel images for Figure 5.
Full gel images and original image files for western blots in Figure 5.
- https://cdn.elifesciences.org/articles/80919/elife-80919-fig5-data1-v2.zip
Figure 5—figure supplement 1
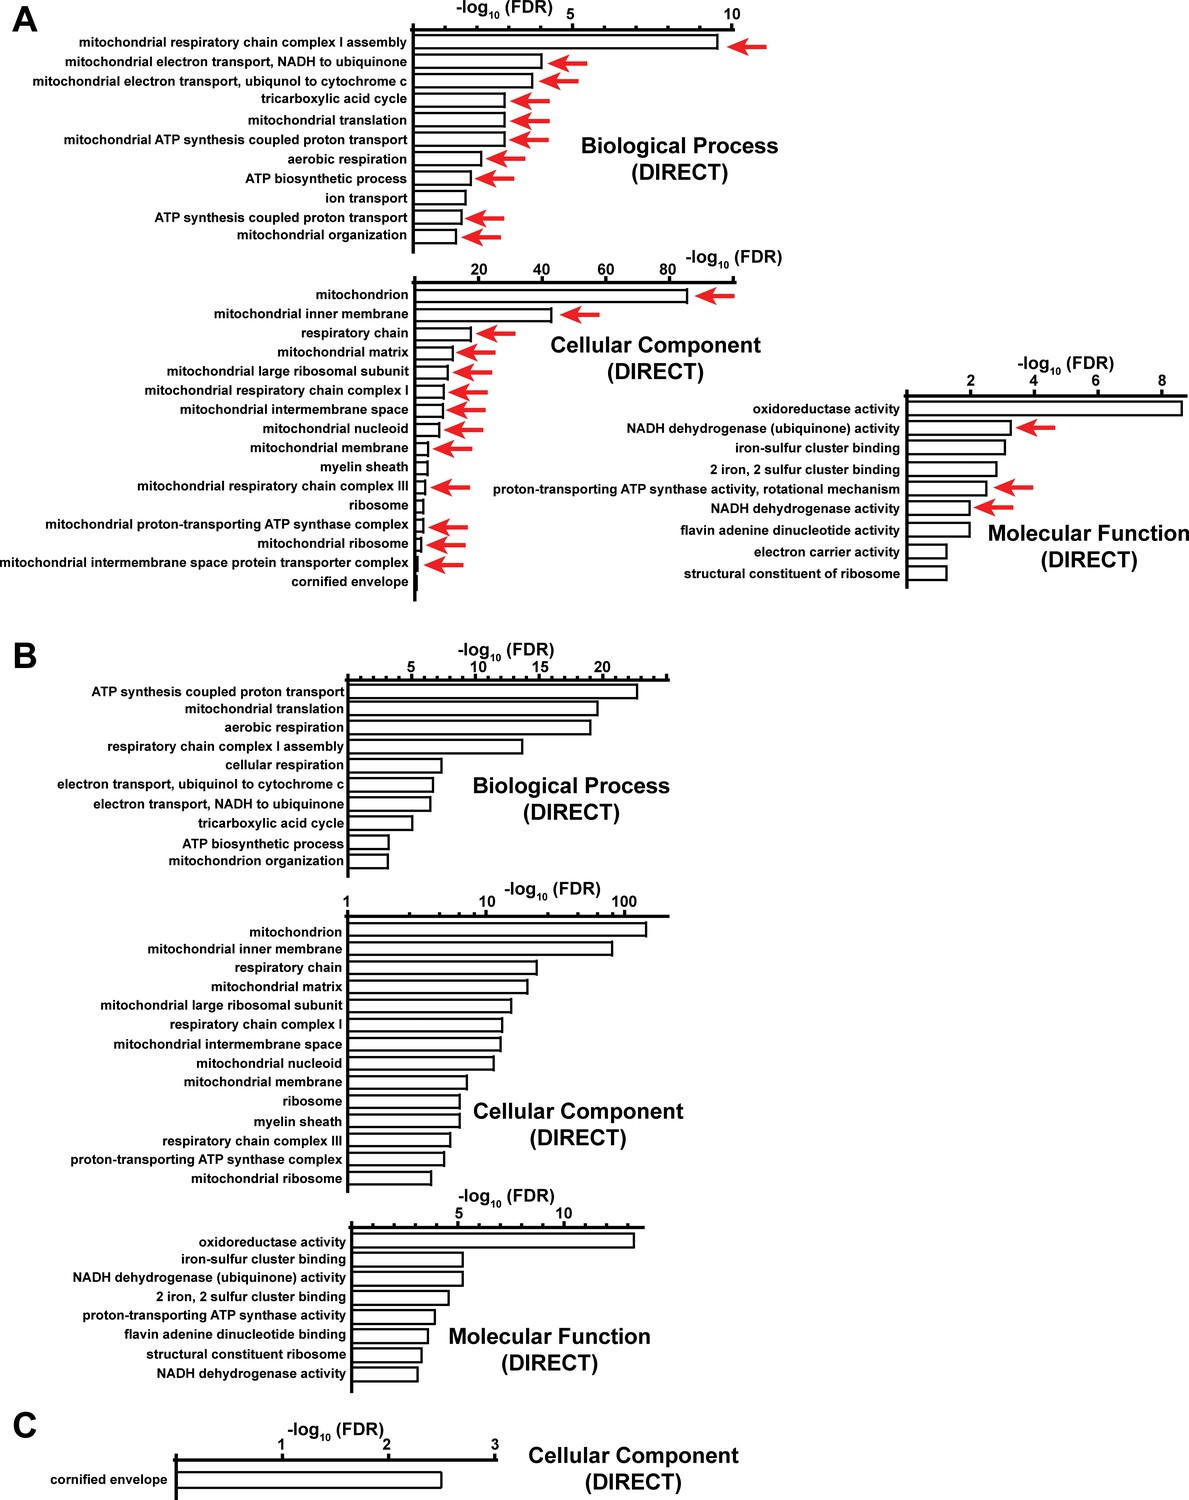
Functional annotation (DAVID) analysis of upregulated proteins in complex IV deficient livers.
(A) Significantly enriched biological pathways (FDR <0.05) from gene ontology analysis of all upregulated proteins (log2(fold change)>1; p-value <0.05) in Cox10-/- livers, based on proteomic analysis at 8 weeks post-AAV administration. Pathways annotated under Biological Processes (Direct), Cellular Components (Direct) and Molecular Function (Direct) are shown. Red arrows highlight pathways related to mitochondrial proteins. (B) Same as (A), but for mitochondrial upregulated proteins. The top enriched pathways are shown from Supplementary file 2. (C) Same as (A), but for non-mitochondrial upregulated proteins. Numerical data for individual panels are provided in Supplementary file 2.
Figure 5—figure supplement 2
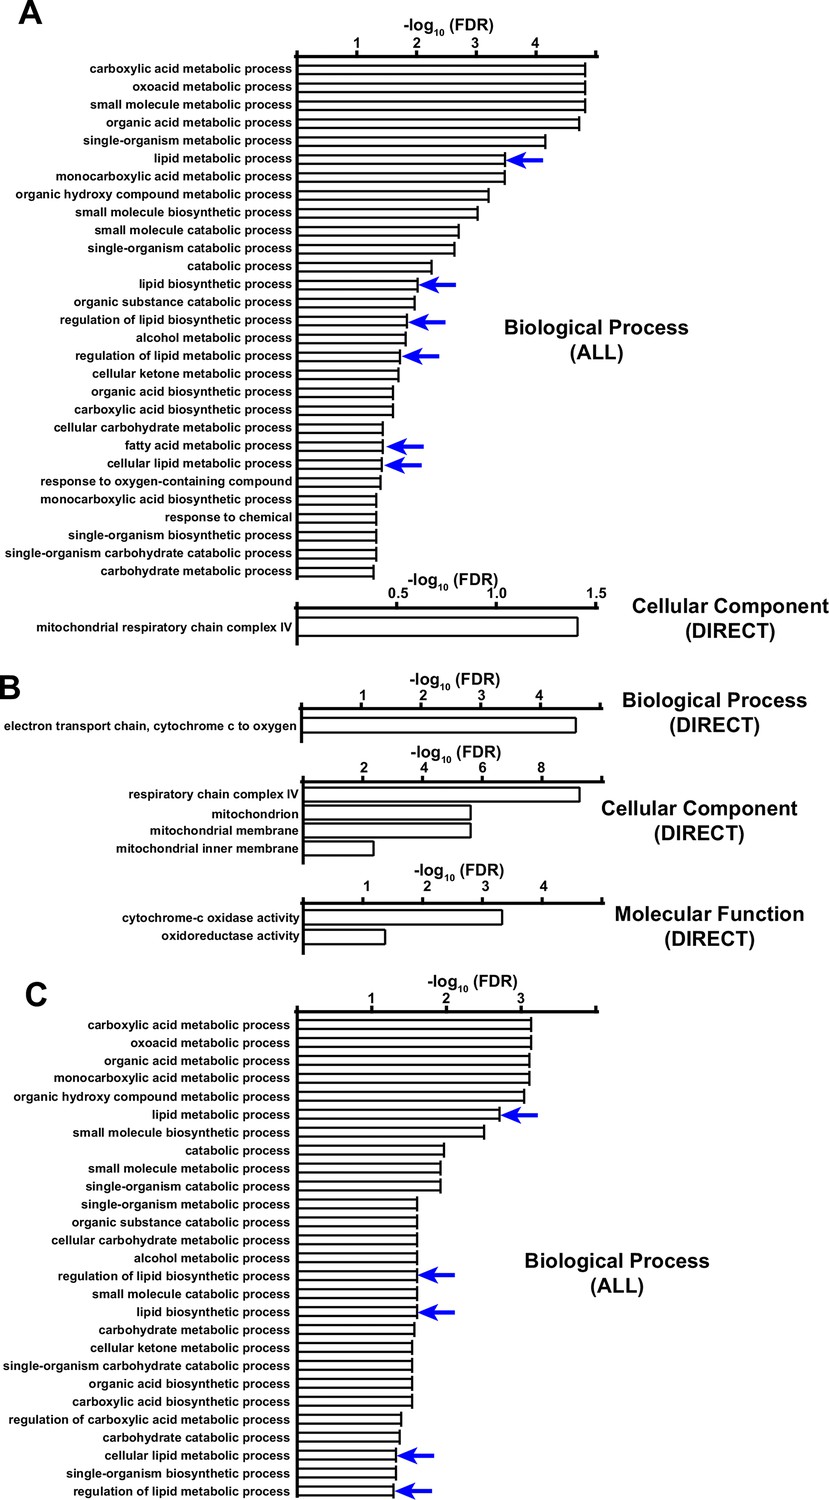
Functional annotation (DAVID) analysis of downregulated proteins in complex IV deficient livers.
(A) Significantly enriched biological pathways (FDR <0.05) from gene ontology analysis of all downregulated proteins (log2(fold change) < –1; p-value <0.05) in Cox10-/- livers, based on proteomic analysis at 8 weeks post-AAV administration. Blue arrows highlight pathways related to lipid/fatty acid metabolism. (B) Same as (A), but for mitochondrial downregulated proteins. (C) Same as (A), but for non-mitochondrial downregulated proteins. Numerical data for individual panels are provided in Supplementary file 2.
Figure 5—figure supplement 3
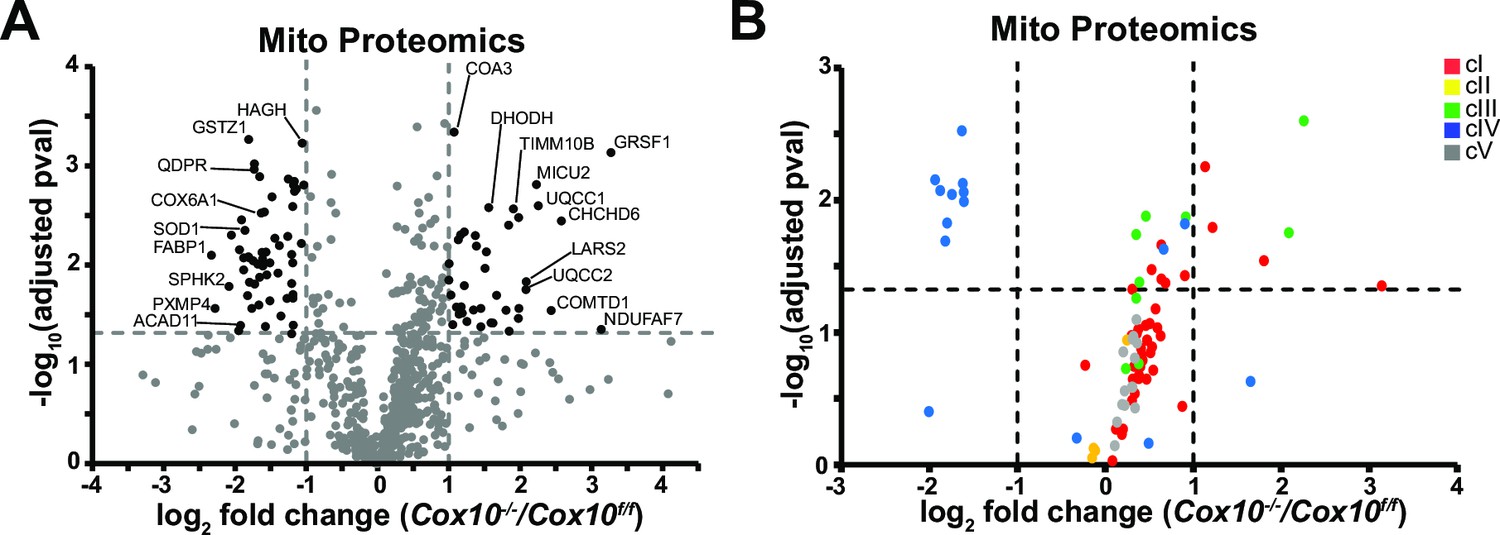
Analysis of mitochondrial proteomes in complex-IV-deficient livers.
(A) Volcano plot of protein abundances changes in Cox10-/- vs. Cox10f/f livers, based on proteomics analysis of enriched mitochondria. Mitochondrial proteins (based on MitoCarta 3.0) are shown. Log2(fold change) is plotted against the –log10(adjusted p-value) for each protein. Significantly changing proteins (log2(fold change)>1 or < –1; Adjusted p-val <0.05) are colored black. n=3 mice per group; 8 weeks post-AAV administration. (B) Volcano plot of abundances for mitochondrial ETC proteins in mitochondria purified from Cox10-/- vs. Cox10f/f livers, based on proteomics analysis. Numerical data for individual panels are provided in Supplementary file 2.
Figure 5—figure supplement 4
Metabolic analysis of complex-IV-deficient livers.
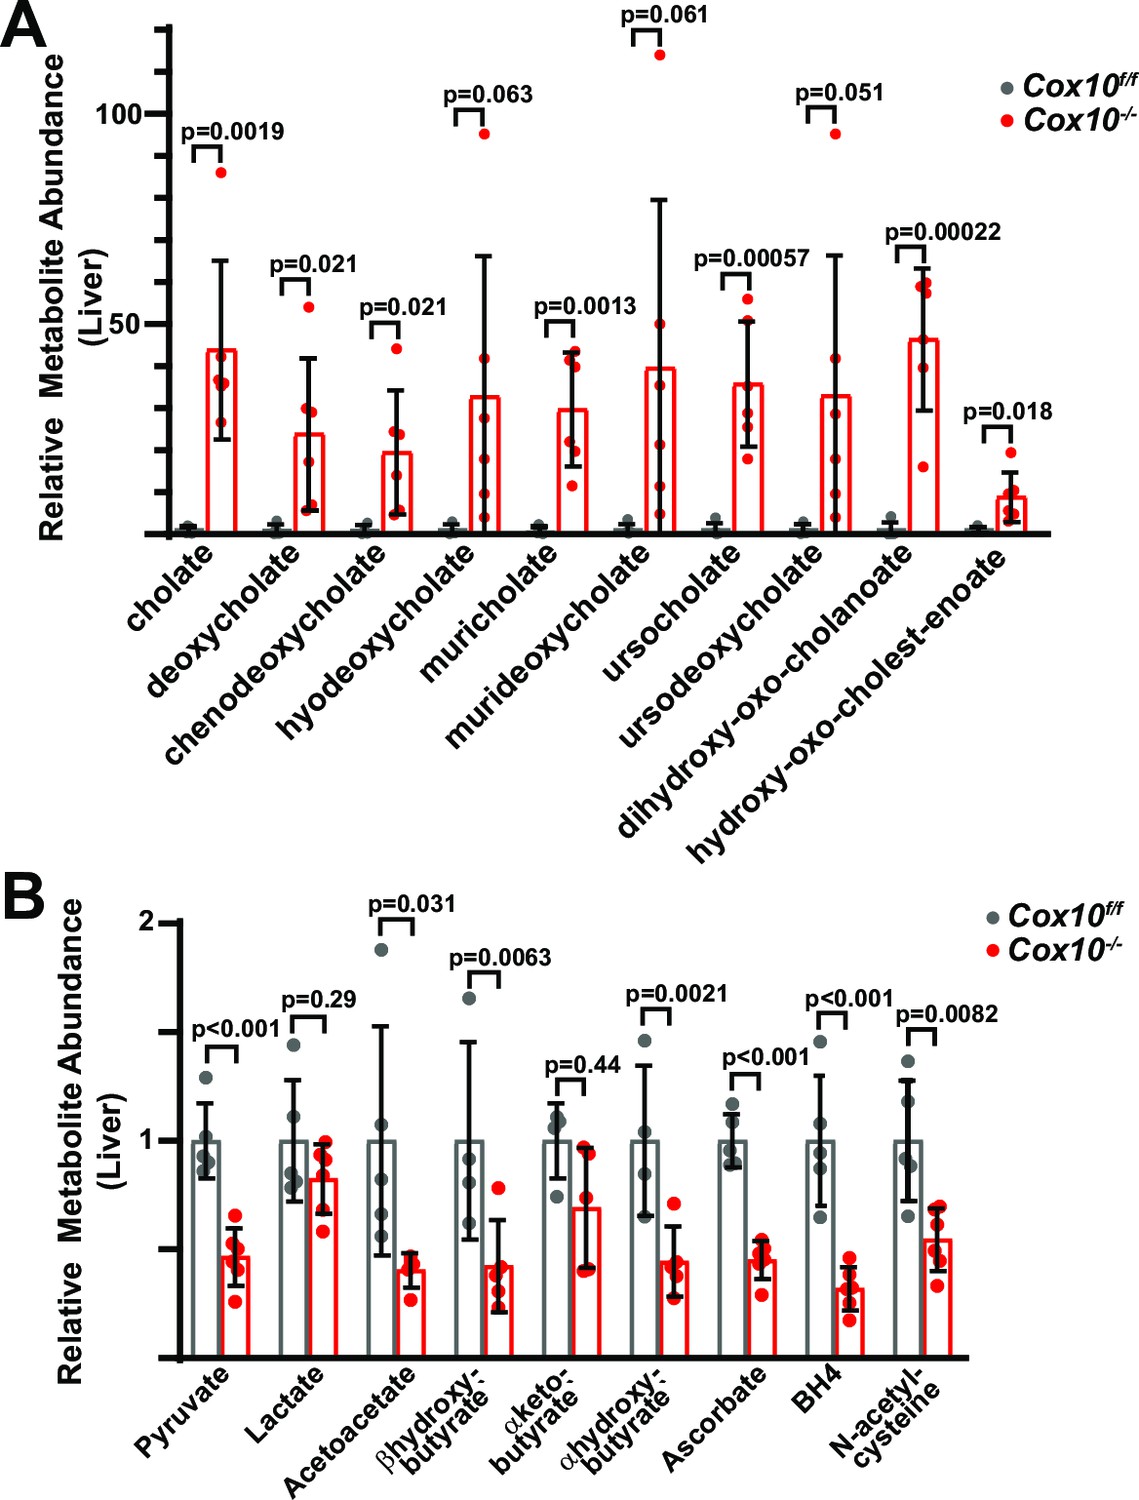
(A) Relative abundance of cholate species in livers of the indicated genotype. n=4–6 mice per group; 8 weeks post-AAV administration. (B) Relative abundance of electron acceptors/donors from livers of the indicated genotype. n=4–6 mice per group; 8 weeks post-AAV administration. BH4, tetrahydrobiopterin. Statistical significance was assessed using t-tests (A,B) with adjustments for multiple comparisons. All data represent mean +/-standard deviation from biological replicates. Numerical data for individual panels are provided in Supplementary file 3.
Figure 5—figure supplement 5
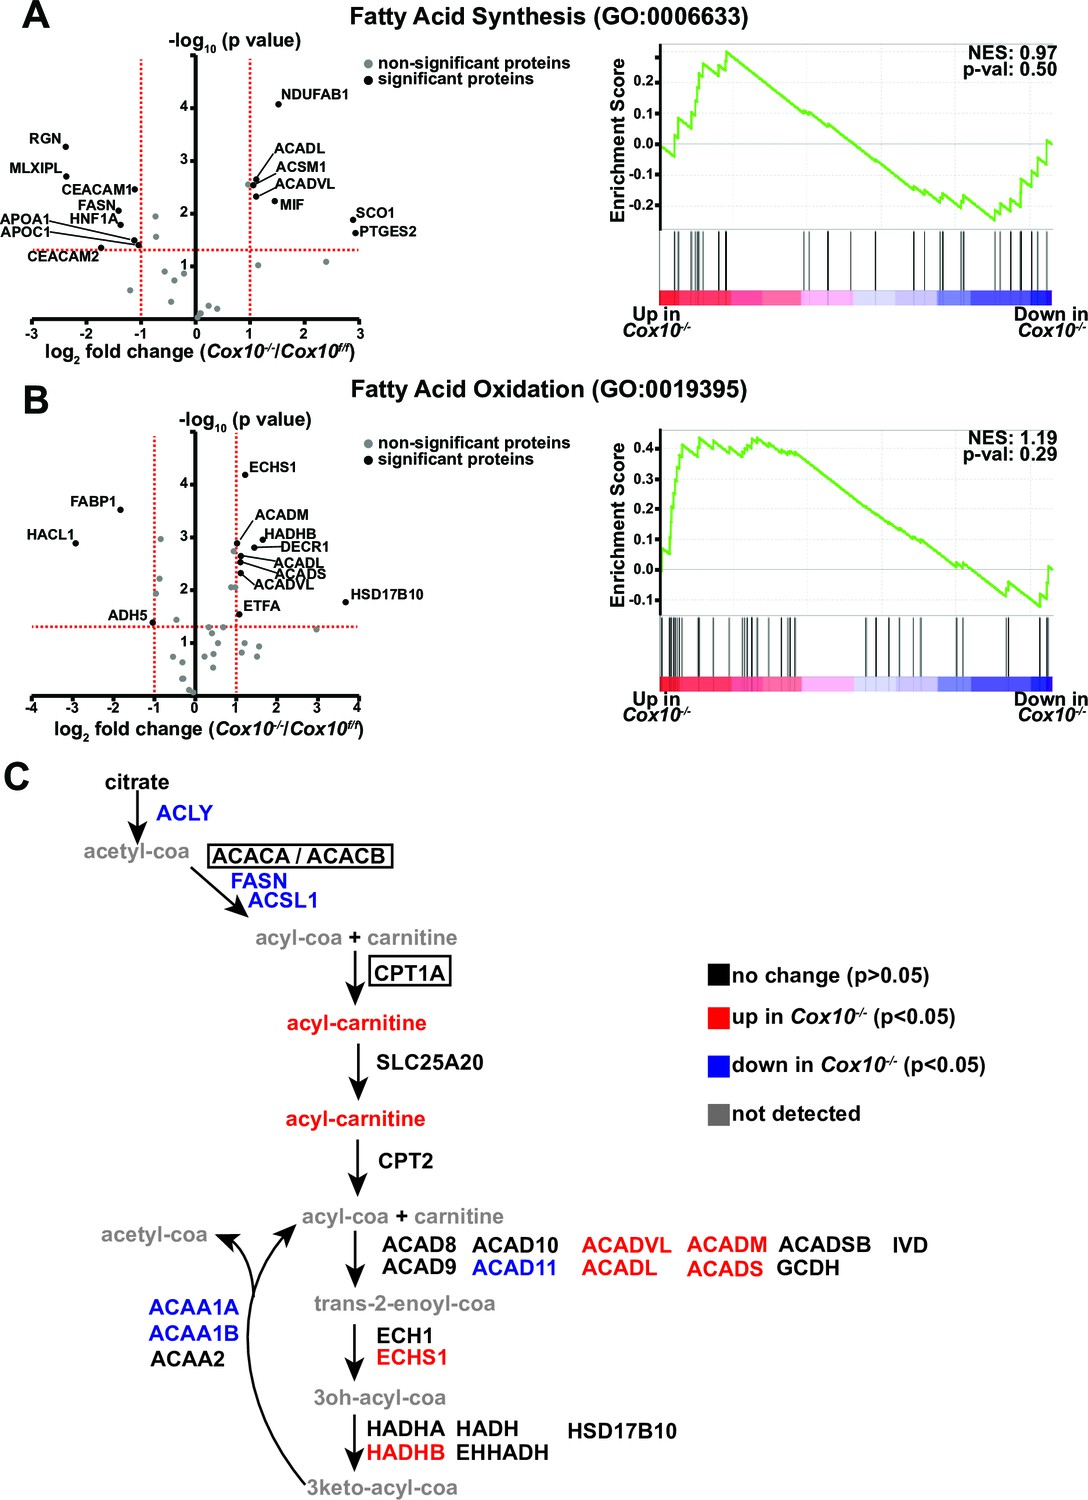
Metabolic / proteomic analysis of fatty-acid-related pathways in complex-IV-deficient livers.
(A) Left, volcano plot of identified proteins from the Fatty Acid Synthesis (GO:0006633) pathway, based on proteomics performed on Cox10-/- vs. Cox10f/f livers at 8 weeks post-AAV administration. Significantly up or downregulated proteins are indicated in black. Right, GSEA of pathway components; the normalized enrichment score (NES) and nominal p-value are indicated. (B) Same as (A), but for the Fatty Acid Oxidation (GO:0019395) pathway. (C) Schematic of fatty acid synthesis and oxidation pathways surrounding acyl-carnitine species. Metabolites are listed in lower case, proteins are listed in upper case. Each protein or metabolite is color coded on whether it was detected and/or significantly changed between Cox10-/- and Cox10f/f livers. For mitochondrial proteins, we classified proteins based on whether they were significantly up or downregulated in either the whole cell lysate or enriched mitochondrial dataset. Rate-limiting enzymes are indicated in boxes. Numerical data for individual panels are provided in Supplementary file 3.
Figure 5—figure supplement 6
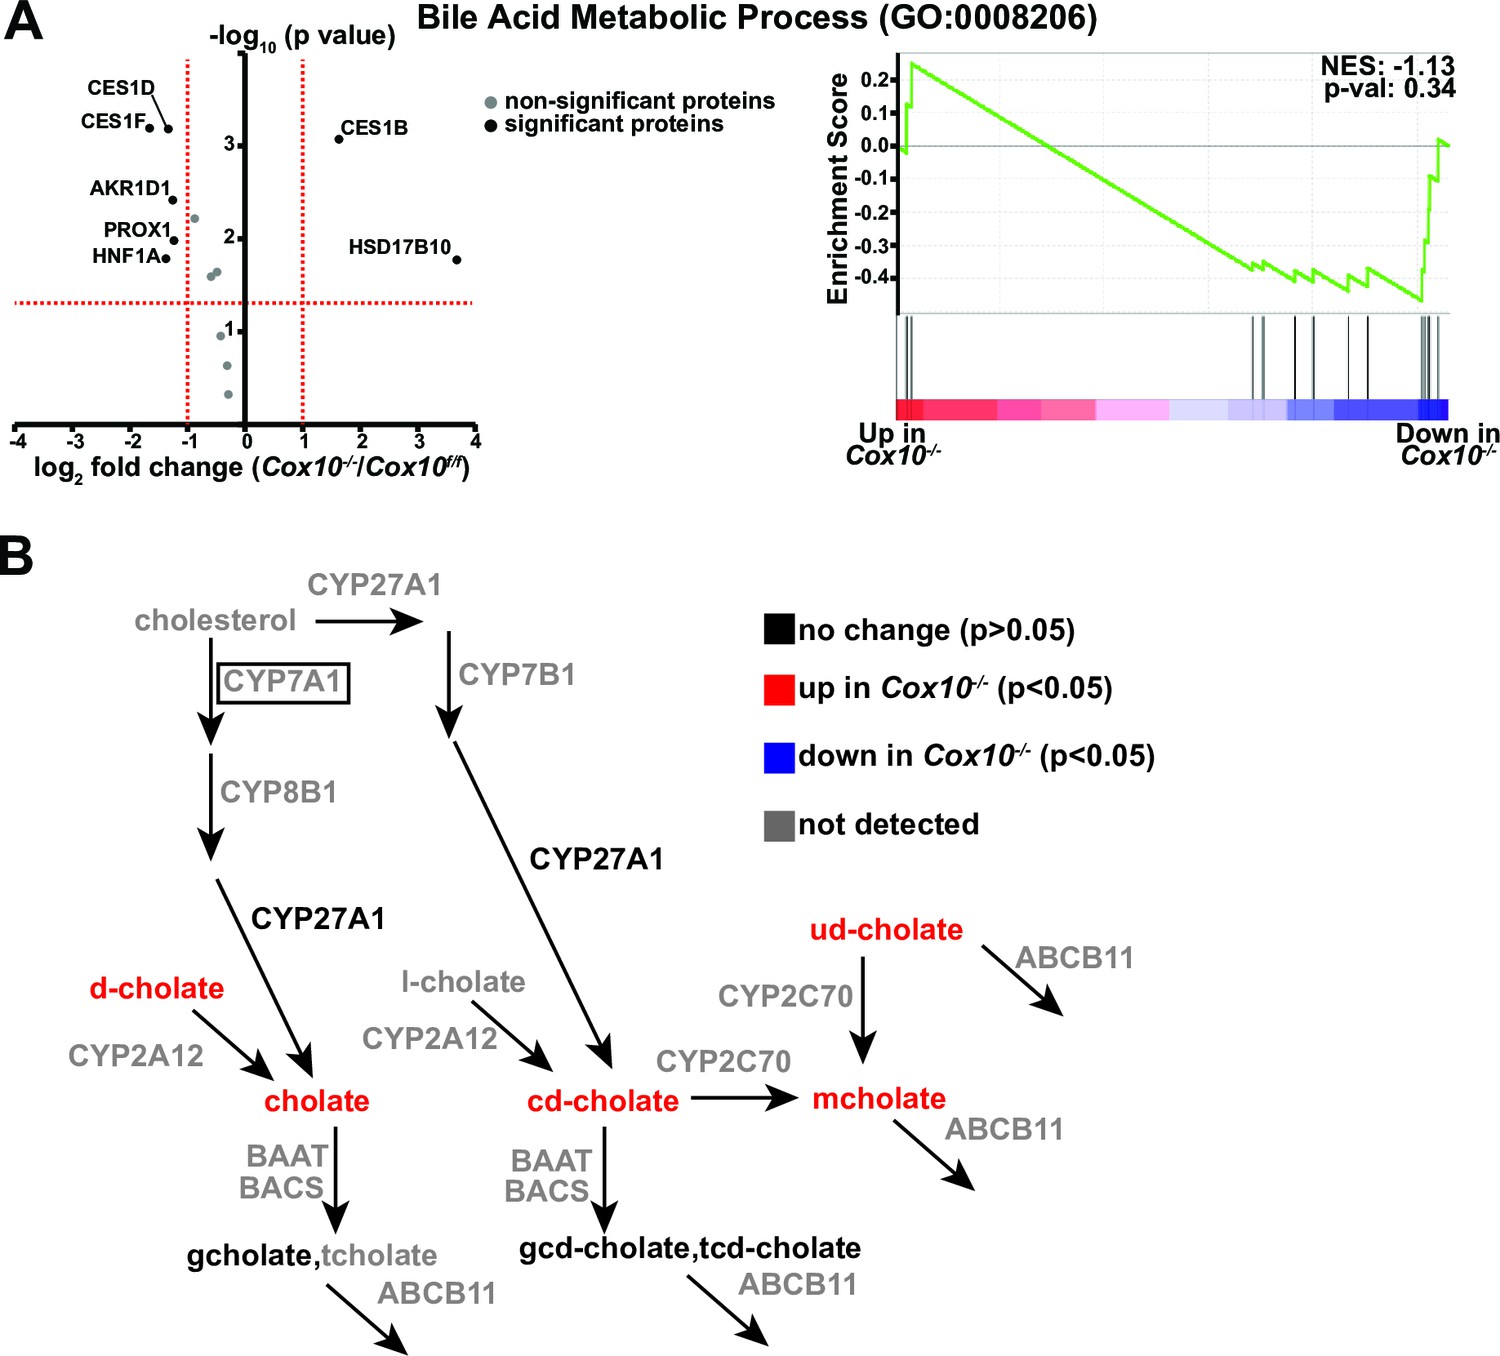
Metabolic / proteomic analysis of bile-acid-related pathways in complex-IV-deficient livers.
(A) Left, volcano plot of identified proteins from the Bile Acid Metabolic Process (GO:0008206) pathway, based on proteomics performed on Cox10-/- vs. Cox10f/f livers at 8 weeks post-AAV administration. Significantly up or downregulated proteins are indicated in black. Right, GSEA of pathway components; the normalized enrichment score (NES) and nominal p-value are indicated. (B) Schematic of bile acid metabolic pathways. Metabolites are listed in lower case, proteins are listed in upper case. Each protein or metabolite is color coded on whether it was detected and/or significantly changed between Cox10-/- and Cox10f/f livers. For mitochondrial proteins, we classified proteins based on whether they were significantly up or downregulated in either the whole cell lysate or enriched mitochondrial dataset. ABCB11 refers to the transporter which exports bile acids from hepatocytes into the biliary duct. Rate-limiting enzymes are indicated in boxes. d-cholate, deoxycholate. l-cholate, lithocholate. ud-cholate, ursodeoxycholate. cd-cholate, chenodeoxycholate. m-cholate, muricholate. g-cholate, glycocholate. t-cholate, taurocholate. gcd-cholate, glycochenodeoxycholate. tcd-cholate, taurochenodeoxycholate. Numerical data for individual panels are provided in Supplementary file 3.
Figure 5—figure supplement 7
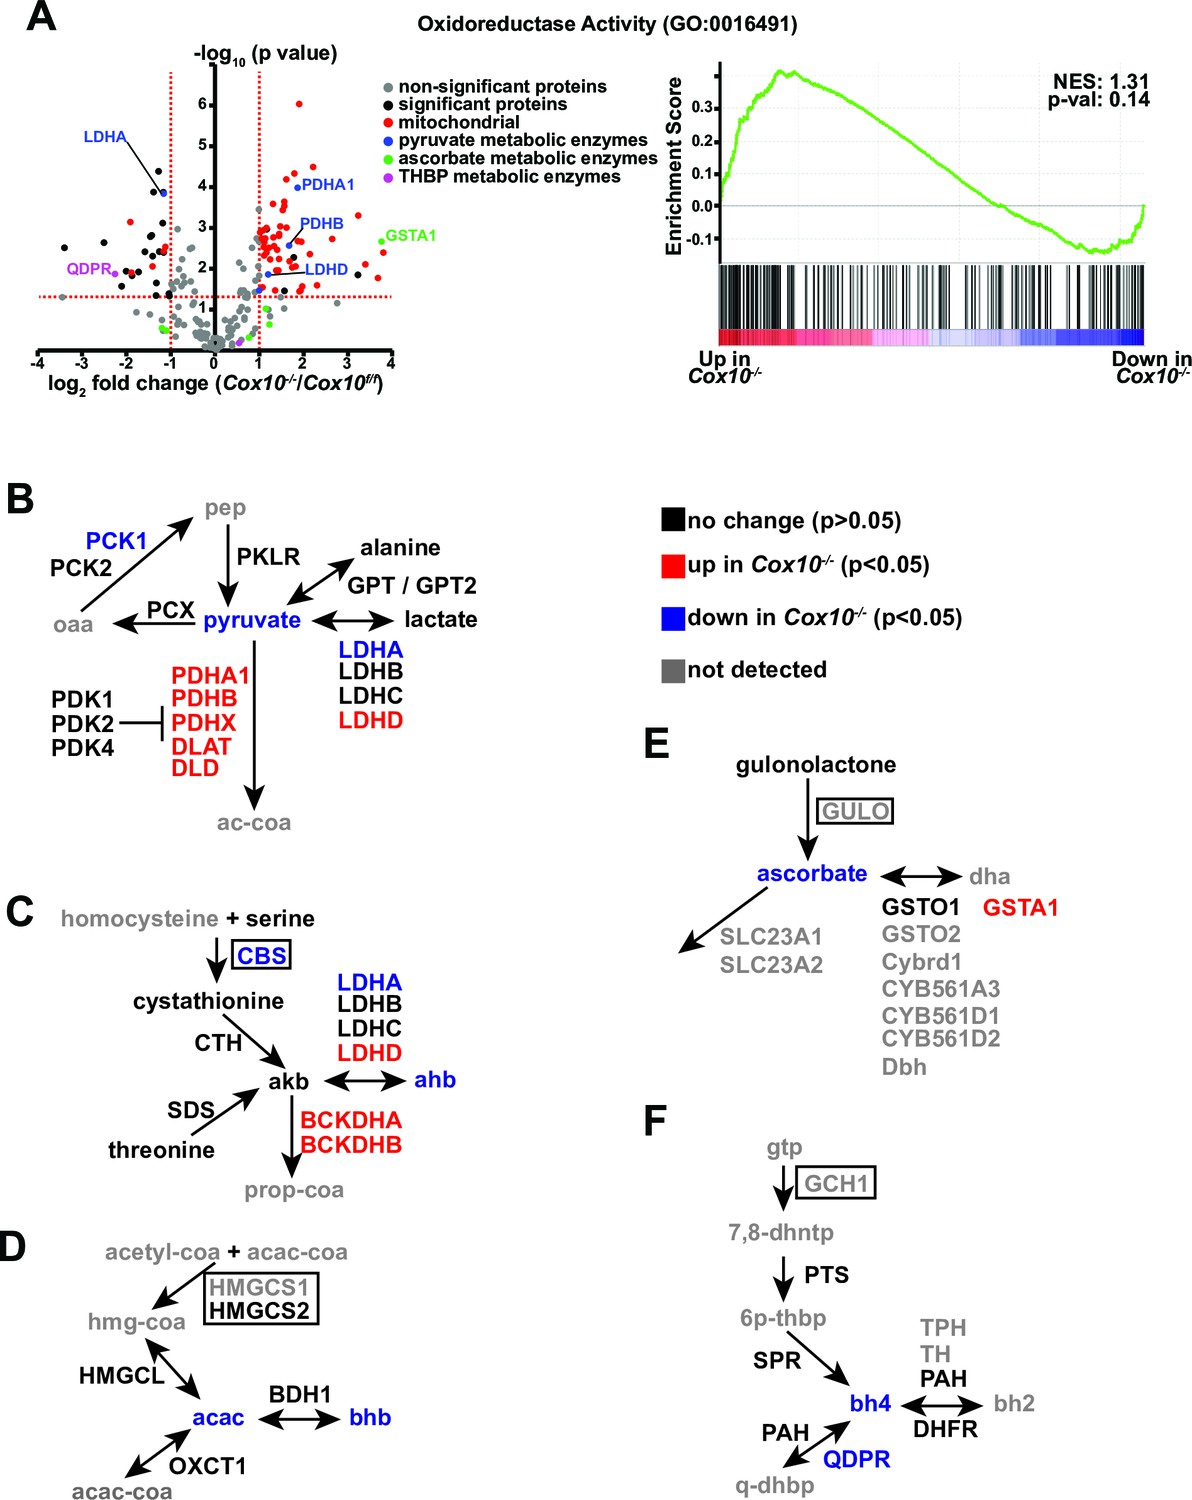
Metabolic / proteomic analysis of oxidoreductase-related pathways in complex-IV-deficient livers.
(A) Left, volcano plot of identified proteins from the Oxidoreductase (GO:0016491) pathway, based on proteomics performed on Cox10-/- vs. Cox10f/f livers at 8 weeks post-AAV administration. Significantly up or downregulated proteins are indicated in black. Right, GSEA of pathway components; the normalized enrichment score (NES) and nominal p-value are indicated. (B) Schematic of pyruvate metabolic pathways. Metabolites are listed in lower case, proteins are listed in upper case. Each protein or metabolite is color coded on whether it was detected and/or significantly changed between Cox10-/- and Cox10f/f livers. For mitochondrial proteins, we classified proteins based on whether they were significantly up or downregulated in either the whole cell lysate or enriched mitochondrial dataset. Rate-limiting enzymes are indicated in boxes. oaa, oxaloacetate. pep, phosphoenolpyruvate. ac-coa, acetyl-CoA. (C) Schematic of transsulfuration pathway producing α-ketobutyrate (akb) and α-hydroxybutyrate (ahb). Same color scheme and notation as (B). prop-coa, propionyl-CoA. (D) Schematic of ketone body metabolic pathway. Same color scheme and notation as (B). acac-coa, acetoacetyl-CoA. acac, acetoacetate. bhb, β-hydroxybutyrate. (E) Schematic of ascorbate metabolism. Same color scheme and notation as (B). dha, dihydroascorbate. (F) Schematic of tetrahydrobiopterin (bh4) synthesis and metabolic pathways. Same color scheme and notation as (B). gtp, guanosine triphosphate. 7,8-dhntp, 7,8-dihydroneopterin triphosphate. 6p-thbp, 6-pyrovoyl-tetrahydrobiopterin. bh2, dihydrobiopterin. q-dhbp, quinonoid dihydrobiopterin. Numerical data for individual panels are provided in Supplementary file 3.
Figure 5—figure supplement 8
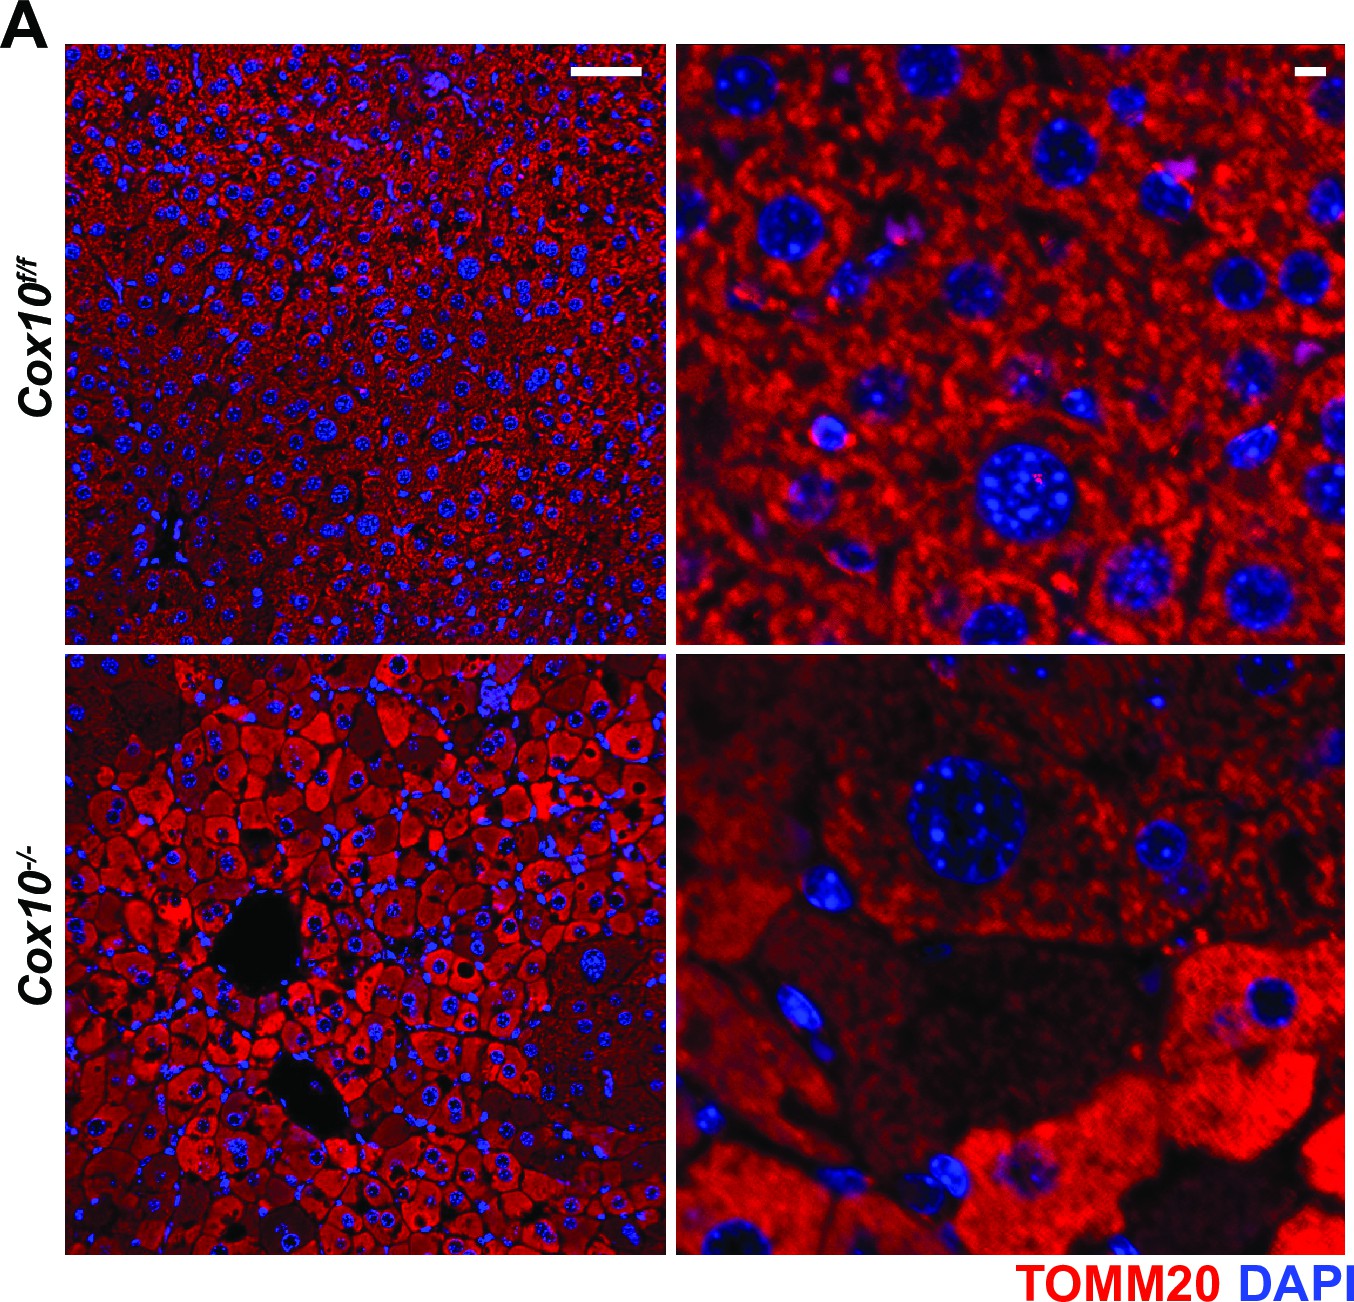
Immunofluorescence of hepatic sections.
Representative immunofluorescent images of liver sections at 20 x (left; scale bar 50 μm) and 63 x (right; scale bar 5 μm) of the indicated genotype. TOMM20 (mitochondrial) staining is indicated in red; nuclear staining (DAPI) is indicated in blue. Data was collected at 8 weeks post-AAV administration.
Figure 6 with 1 supplement

Complex IV deficiency impairs electron transport chain function and oxygen status in the adult liver.
(A) Perfusion values (reported as institutional units (I.U.)) based on arterial spin labeling in animals of the indicated genotype at 4 weeks post-AAV administration. n=3 animals per group. The same color scheme is used throughout this figure. (B) Relative (%) changes in hepatic T2* following exposure to 100% O2 in animals of the indicated genotype at 4 weeks post-AAV administration. n=3 animals per group. (C) Representative heatmaps of T1 apparent values (T1app) in livers, overlaid on T1-weighted MR images. (D) Representative distribution of T1app values in an animal of each genotype breathing room air, followed by 100% O2. (E) Average hepatic T1app values in animals of the indicated genotype, breathing room air followed by 100% O2. n=3 animals per group; 4 weeks post-AAV administration. (F) Average regional changes in T1 (ΔT1) in animals of the indicated genotype. n=3 animals per group; 4 weeks post-AAV administration. (G) Plasma enrichment of m+6 glucose during steady-state infusions of [U-13C]glucose. n=3 animals per group; 4 weeks post-AAV administration. (H) Steady-state liver enrichment of m+6 glucose in animals of the indicated genotype. n=3 animals per group; 4 weeks post-AAV administration. (I) Labeled fractions (1-(m+0)) of the indicated metabolites, relative to liver glucose m+6 enrichment. n=3 animals per group; 4 weeks post-AAV administration. (J) Schematic of potential electron sources for mitochondrial ETC. CoQ, ubiquinone; GPD2, mitochondrial glycerol-3-phosphate dehydrogenase; DHODH, dihydroorotate dehydrogenase. ETF, electron transfer flavoprotein complex. DHAP, dihydroxyacetone phosphate. (K) Relative abundance of electron donors in livers of the indicated genotype at 8 weeks post-AAV administration. n=4–6 mice per group. (L) Relative abundance of acylcarnitine metabolites in livers of the indicated genotype. n=5–6 mice per group at 8 weeks post-AAV administration. (M) Relative β-hydroxybutyrate levels in livers of the indicated genotype at 8 weeks post-AAV administration. n=4–5 mice per group. (N) Relative glutarate levels in livers of the indicated genotype at 8 weeks post-AAV administration. n=5–6 mice per group. Statistical significance was assessed using t-test (A,B,E,F,H,I,K,L,M,N) or Mann-Whitney (D) tests with adjustments for multiple comparisons. All data represent mean +/-standard deviation from biological replicates. Numerical data for individual panels are provided in Supplementary file 2 and Supplementary file 3.
Figure 6—figure supplement 1
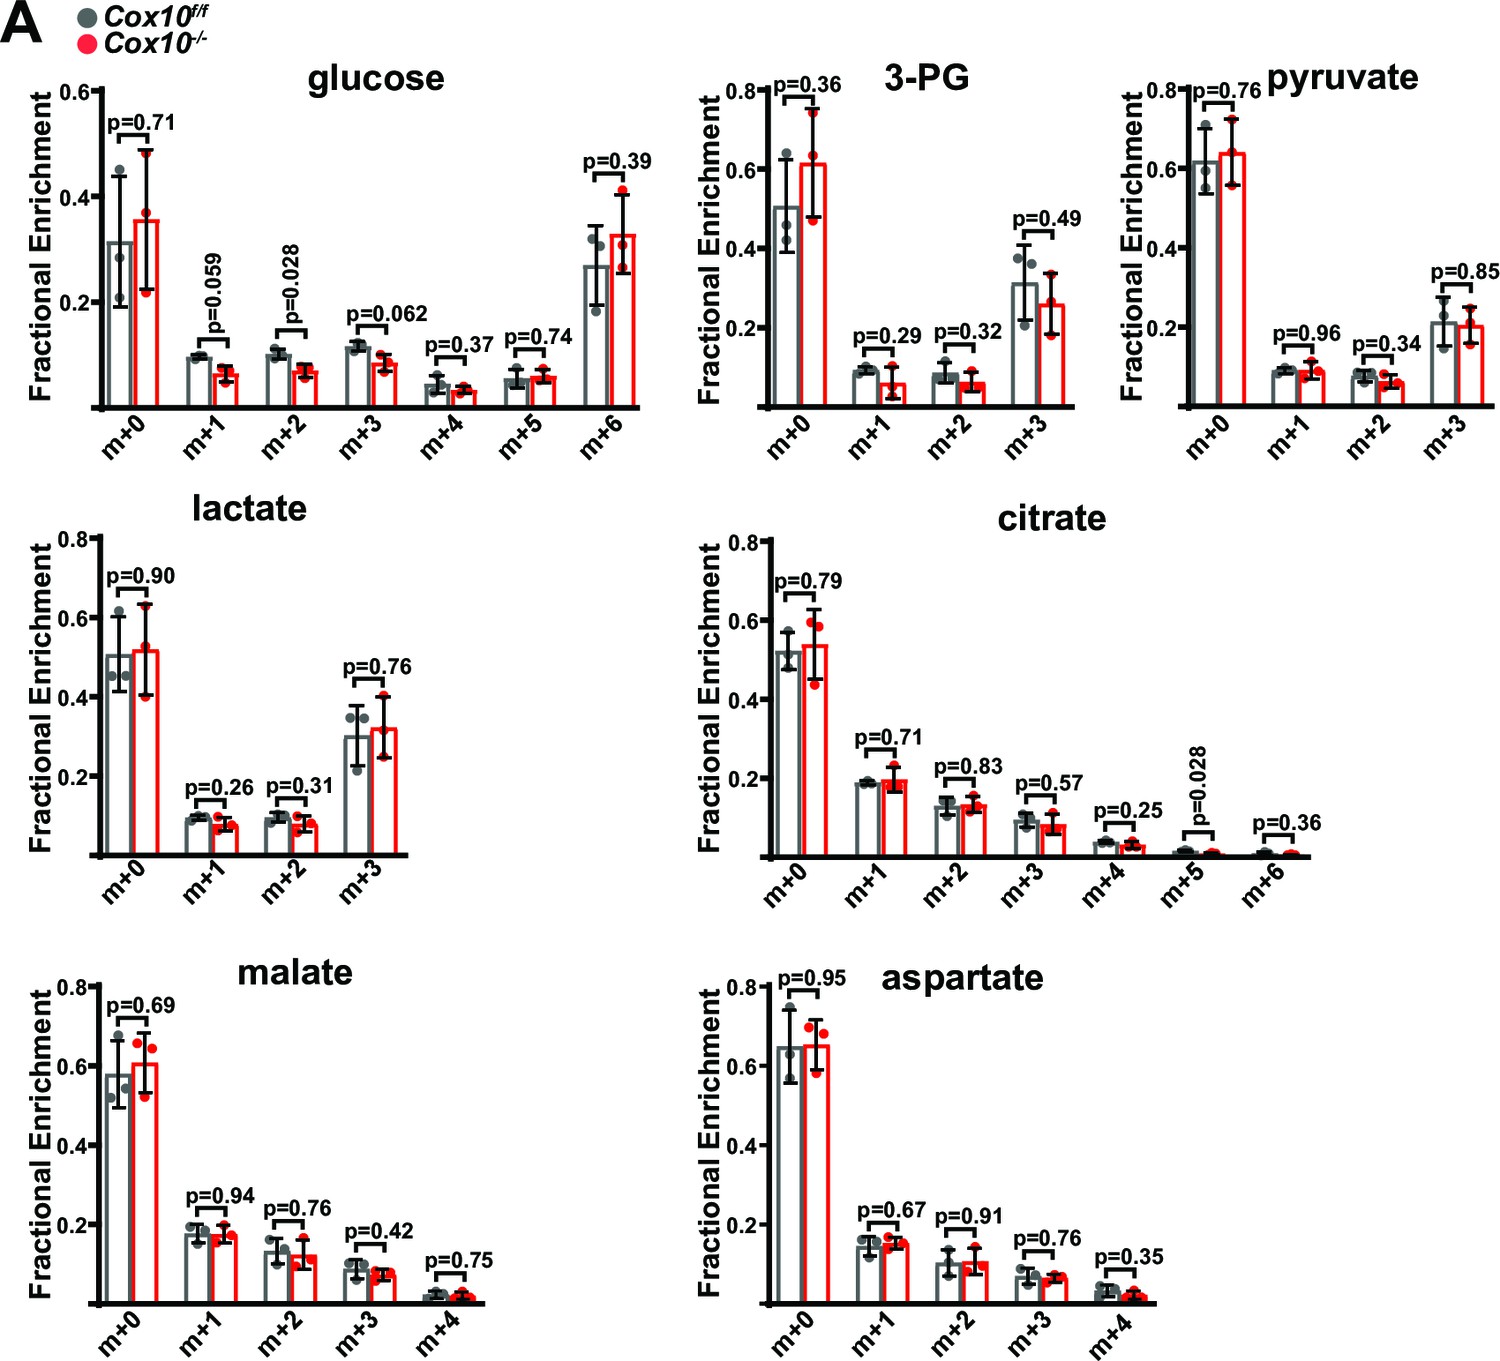
Isotope tracing in complex-IV-deficient livers.
(A) Mass isotopomer distributions in liver tissue from [U-13C]glucose infusions of the indicated genotype. n=3 animals per group; 4 weeks post-AAV administration. Statistical significance was assessed using t-tests (A) with adjustments for multiple comparisons. All data represent mean +/-standard deviation from biological replicates. Numerical data for individual panels are provided in Supplementary file 2.
Author response image 1
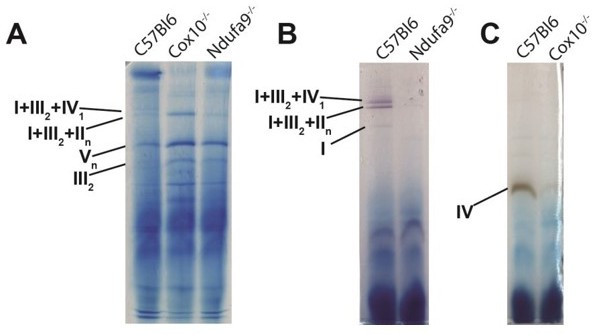
BN-PAGE analysis to analyze ETC complexes and supercomplexes from murine liver lysate.
(A) BN-PAGE, followed by Coomassie staining, of isolated mitochondria extracted with 5g/g digitonin/protein ratio. 50mg of protein per lane were assessed by BN-PAGE, and bands are annotated based on previously published data (PMID 26928661). (B) Same as (A), except bands were visualized by in-gel complex I activity, which exhibits a purplish color. Bands with complex I activity are indicated. (C) Same as (A), excepts bands were visualized by in-gel complex IV activity, which exhibits a brown color. Bands with complex IV activity are indicated.
Author response image 2
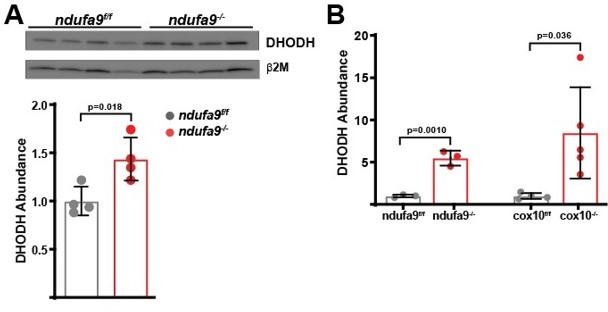
Quantitation of DHODH abundance in ETC-deficient livers.
(A) DHODH abundance was assessed by western blot in ndufa9f/f and ndufa9-/- livers, and was quantitated relative to b2microglobulin (as a loading control). (B) Relative DHODH abundance based on proteomic analysis from ndufa9 and cox10 deficient livers.
Tables
Key resources table
| Reagent type (species) or resource | Designation | Source or reference | Identifiers | Additional information |
|---|---|---|---|---|
| Strain, strain background (Mus musculus, male and female) | Cox10f/f | The Jackson Laboratory | 024697 | |
| Strain, strain background (Mus musculus, male and female) | Ndufa9f/f | |||
| Other | pAAV.TBG.PI.eGFP. WPRE.bGH (AAV-GFP) | Addgene | 105535 | Adeno-associated virus |
| Other | pAAV.TBG.PI.Cre. rBG (AAV-Cre) | Addgene | 107787 | Adeno-associated virus |
| Antibody | Anti-Tom20 (rabbit polyclonal) | Proteintech | 11802 | WB, 1:2000 |
| Antibody | Anti-PC (rabbit polyclonal) | Proteintech | 16588 | WB, 1:1000 |
| Antibody | Anti-βActin (mouse monoclonal) | Proteintech | 66009 | WB, 1:5000 |
| Antibody | Anti-Ndufa9 (mouse monoclonal) | ThermoScientific | 459100 | WB, 1:2000 |
| Antibody | Anti-β2microglobulin (rabbit monoclonal) | ThermoScientific | 701250 | WB,:5000 |
| Antibody | Anti-Cox10 (rabbit polyclonal) | Abcam | ab84053 | WB,:1000 |
| Commercial assay or kit | Complex I Enzyme Activity Microplate Assay Kit (Colorimetric) | Abcam | ab109721 | |
| Commercial assay or kit | ATP Colorimetric/ Fluorometric Assay Kit | Biovision | K354 | |
| Commercial assay or kit | Deproteinizing Sample Preparation Kit | Biovision | K808 | |
| Commercial assay or kit | Luna Universal One- Step RT-qPCR kit | New England Biolabs | E3005S | |
| Commercial assay or kit | DC Protein Assay | Biorad | 5000112 | |
| Chemical compound, drug | [U-13C]glucose | Cambridge Isotopes Laboratories | CLM-1396 | |
| Chemical compound, drug | [U-13C]lactate | Cambridge Isotopes Laboratories | CLM-1579 | |
| Chemical compound, drug | [U-13C]pyruvate | Cambridge Isotopes Laboratories | CLM-2440 |
Additional files
-
Supplementary file 1
Excel spreadsheet containing raw data and statistical analysis of proteomics and metabolomics data for Ndufa9-/- vs. Ndufa9f/f livers at 4 weeks post-AAV administration.
- https://cdn.elifesciences.org/articles/80919/elife-80919-supp1-v2.xlsx
-
Supplementary file 2
Excel spreadsheet containing raw data and statistical analysis of proteomics and metabolomics data for Cox10-/- vs. Cox10f/f livers at 8 weeks post-AAV administration.
- https://cdn.elifesciences.org/articles/80919/elife-80919-supp2-v2.xlsx
-
Supplementary file 3
Excel spreadsheet containing raw data for panels presented in the figures and figure supplements.
- https://cdn.elifesciences.org/articles/80919/elife-80919-supp3-v2.xlsx
-
Transparent reporting form
- https://cdn.elifesciences.org/articles/80919/elife-80919-transrepform1-v2.docx
Download links
A two-part list of links to download the article, or parts of the article, in various formats.
Downloads (link to download the article as PDF)
Open citations (links to open the citations from this article in various online reference manager services)
Cite this article (links to download the citations from this article in formats compatible with various reference manager tools)
Differential requirements for mitochondrial electron transport chain components in the adult murine liver
eLife 11:e80919.
https://doi.org/10.7554/eLife.80919


