Microstructural differences in the osteochondral unit of terrestrial and aquatic mammals
- Department of Clinical Sciences, Faculty of Veterinary Medicine, Utrecht University, Netherlands
- Regenerative Medicine Utrecht, Utrecht University, Netherlands
- Department of Orthopedics, University Medical Centre Utrecht, Netherlands
- Department of Biomedical Engineering, Eindhoven University of Technology, Netherlands
- Department of Mathematical Sciences, University of Adelaide, Australia
- Division of Pathology, Department of Biomolecular Health Sciences, Faculty of Veterinary Medicine, Utrecht University, Netherlands
Figures
Figure 1
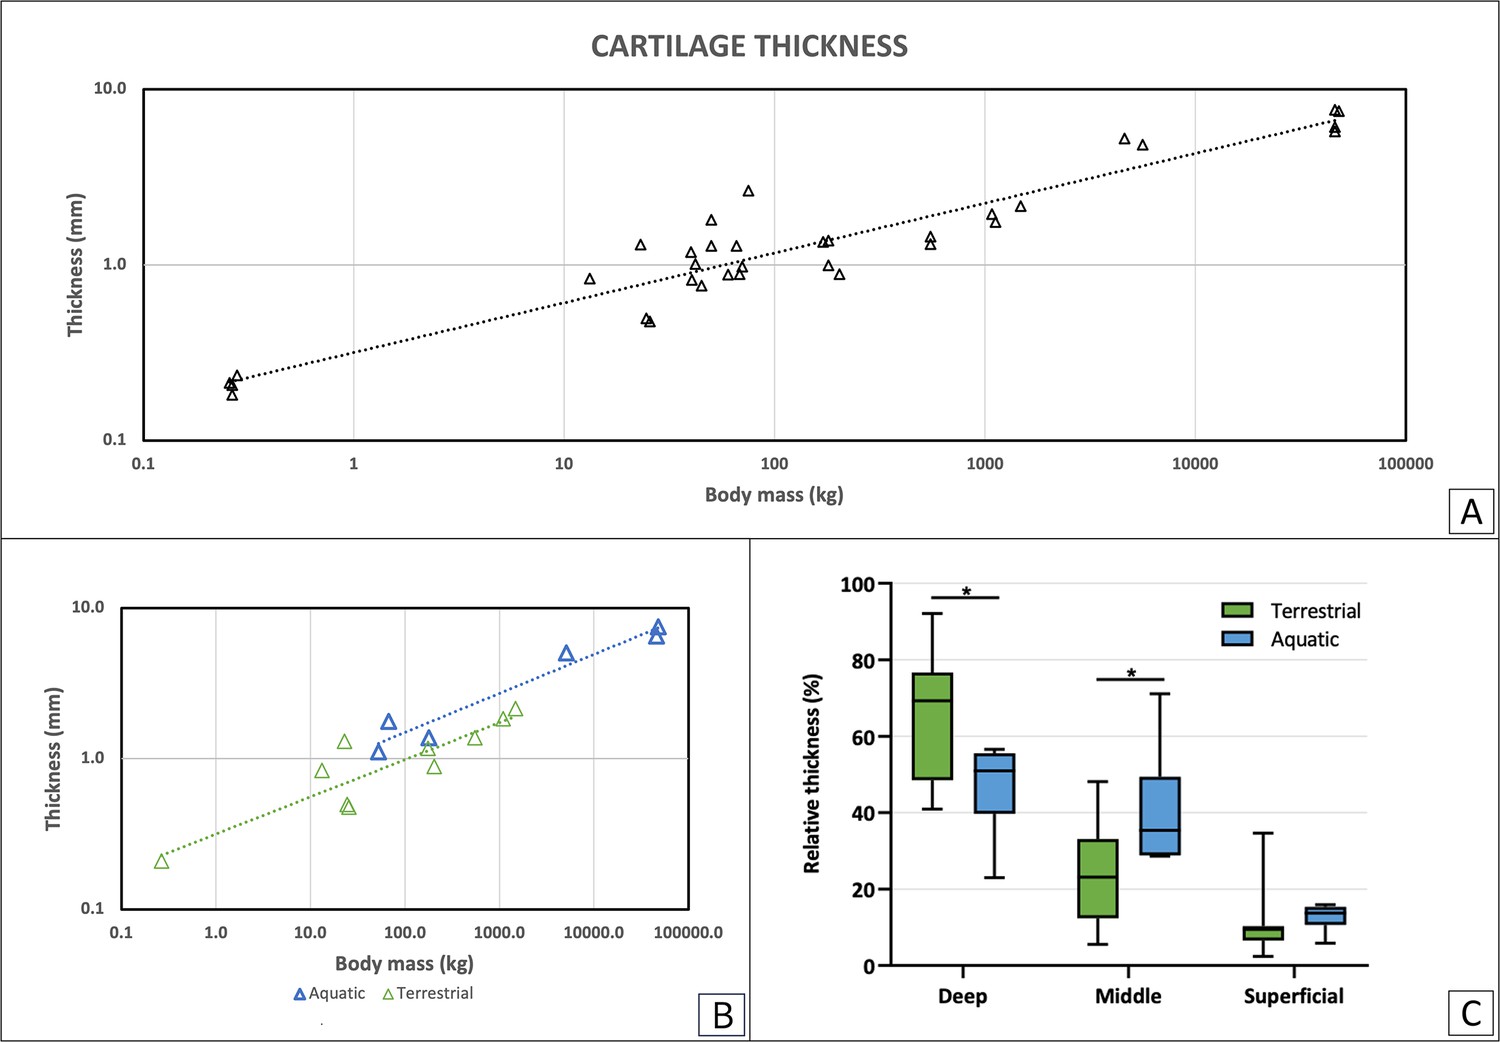
Cartilage thickness as analyzed from histological sections.
(A) Total articular cartilage thickness correlates with body mass with a negative allometric relationship (R2=0.91, a=0.28). (B) Total cartilage thickness in correlation with body mass for terrestrial and aquatic mammals separately. In green are terrestrial mammals (R2=0.80, a=0.26), in blue are aquatic mammals (R2=0.96, a=0.26). (C) Average of relative layer thickness (%) was calculated for each cartilage layer in terrestrial (green) and aquatic (blue) mammals. Comparison shows a significant difference between the two groups in both the deep and middle layers (p<0.01).
-
Figure 1—source data 1
Details of the cartilage samples from the aquatic and terrestrial mammals.
- https://cdn.elifesciences.org/articles/80936/elife-80936-fig1-data1-v2.xlsx
Figure 2
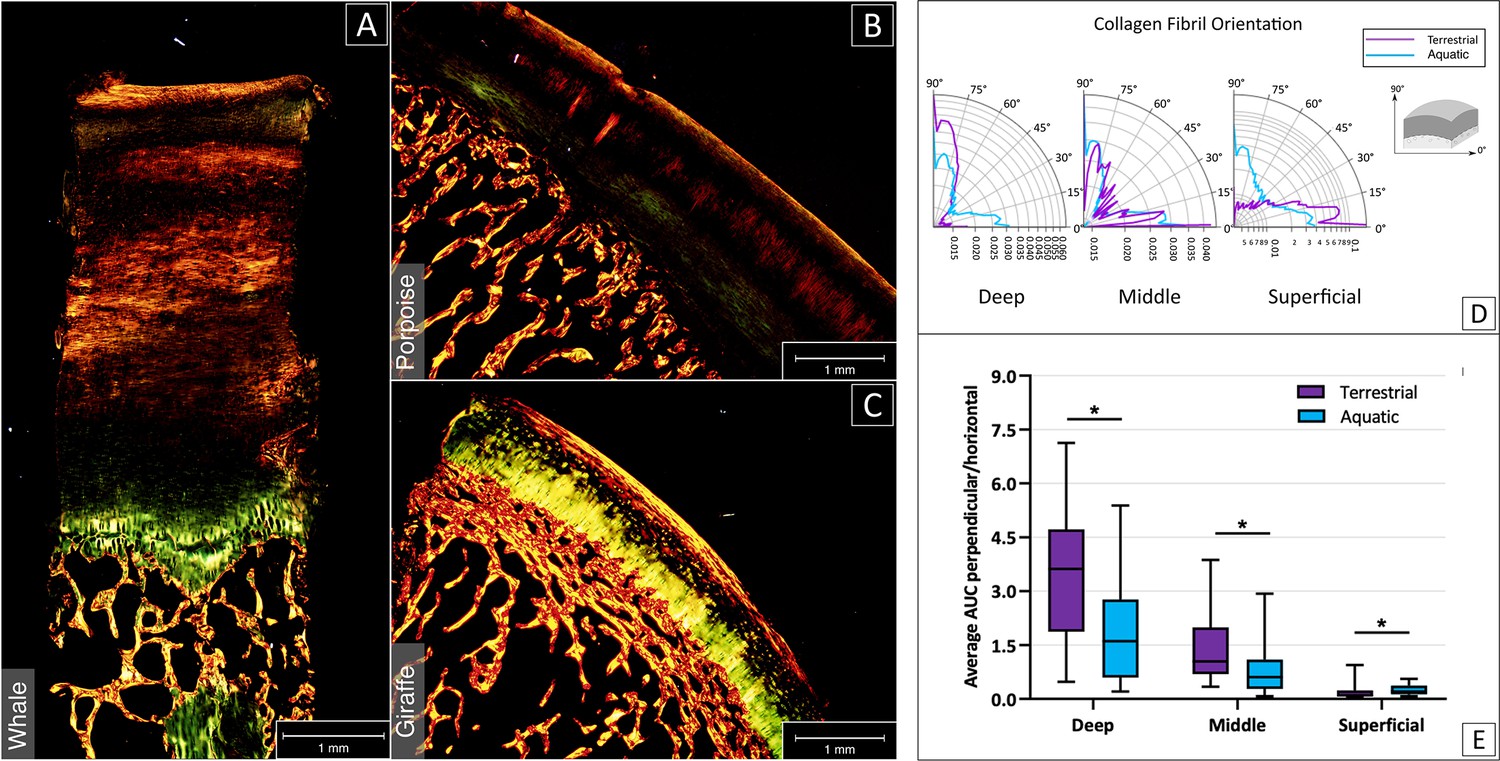
Analysis of the collagen fibre orientation based on picrosirius red staining and imaging with PLM.
The collagen fibers orientation of aquatic mammals (sperm whale, A; harbor porpoise; B) appeared less organized than fiber orientation in terrestrial mammals (giraffe; C). (C) Cartilage structure in terrestrial mammals featured a clear distinction between deep, middle and superficial layer (respectively in yellow, black and red/yellow from bone to surface). (D) Polar graphical representation of collagen fiber distribution for deep, middle and superficial layer in terrestrial (violet) and aquatic (cerulean) mammals. O° are fibers parallel to the surface, 90° are fibers perpendicular to the surface. (E) Average peak area was calculated for each cartilage layer in both terrestrial (violet) and aquatic (cerulean) mammals, showing significant differences between the two groups in all layers (p<0.05).
Figure 3 with 1 supplement
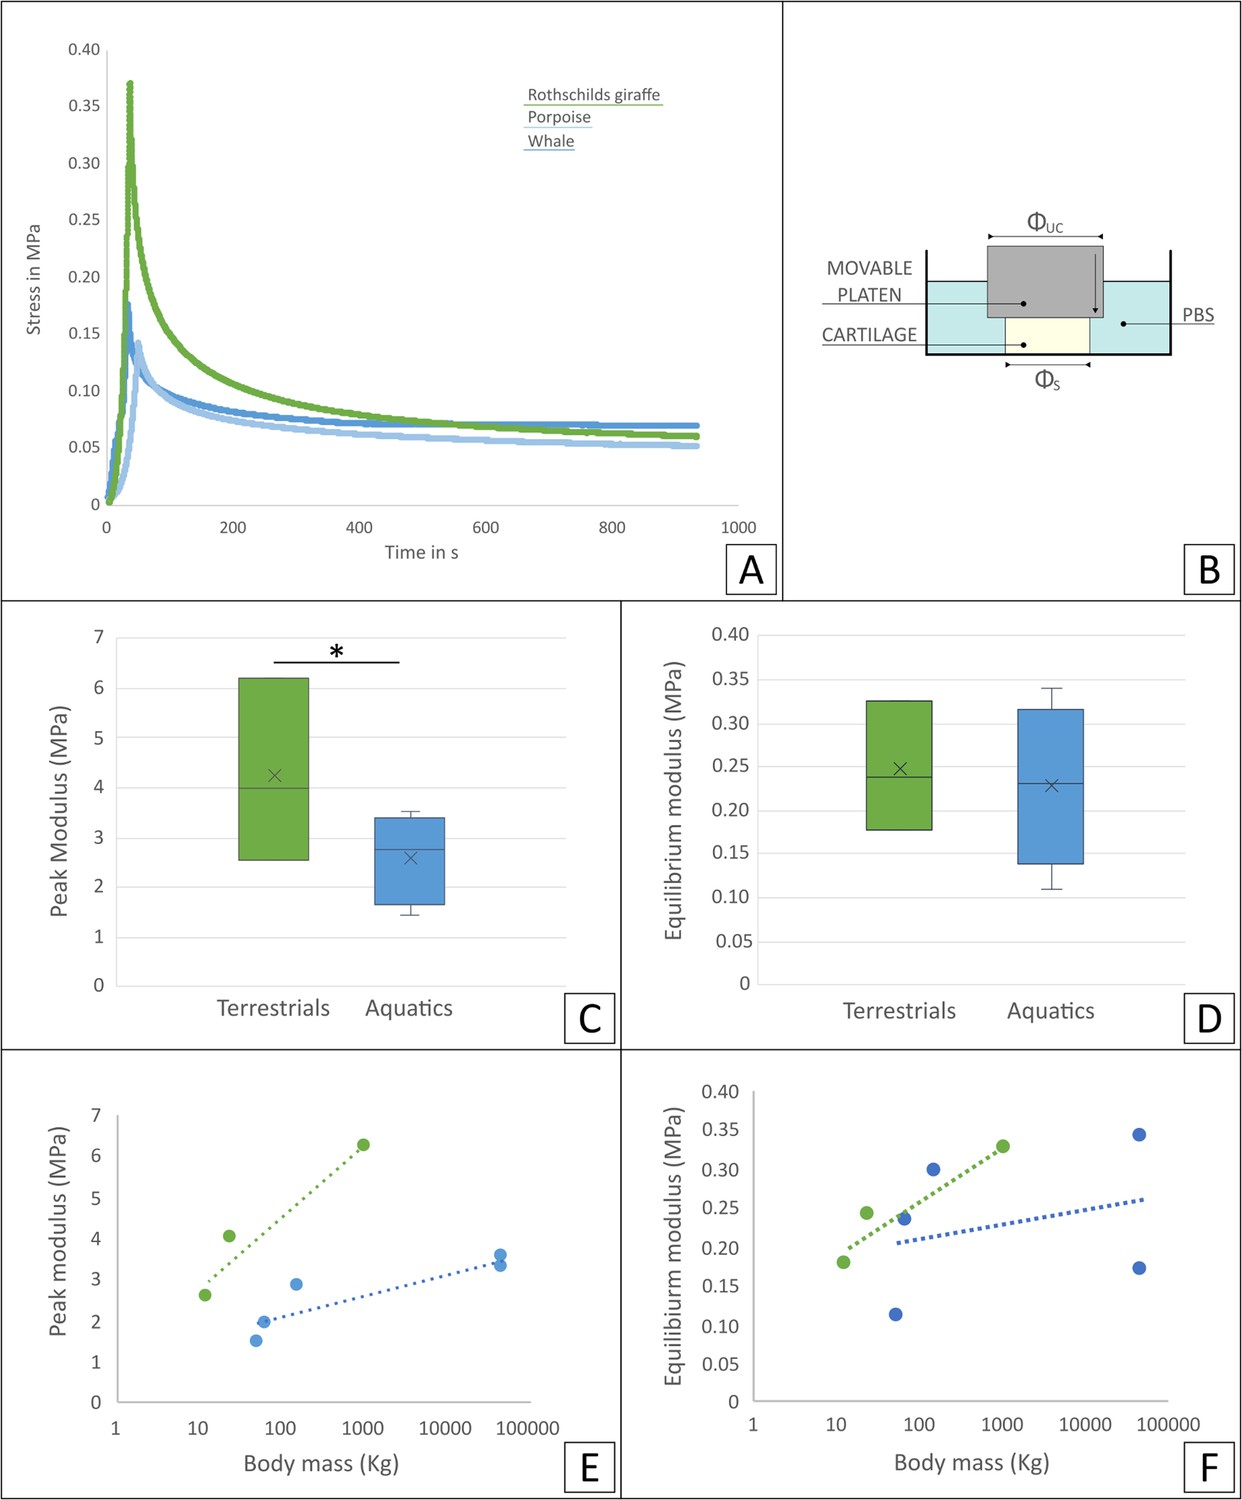
Mechanical analysis of the tissue samples.
(A) Representative stress relaxation curve of some of the tested cartilage samples (Rothschilds giraffe, porpoise and sperm whale). (B) Schematics of loading methodology: unconfined compression geometry (congruent loading) used on cartilage samples immersed in a PBS bath. Comparison of time dependent mechanical properties: (C) peak and (D) equilibrium modulus for terrestrial (green) and aquatic mammals (blue). * Indicates a significant difference. Relationship of (E) peak and (F) equilibrium moduli average for each species with body mass for terrestrial (green) and aquatic mammals (blue).
Figure 3—figure supplement 1
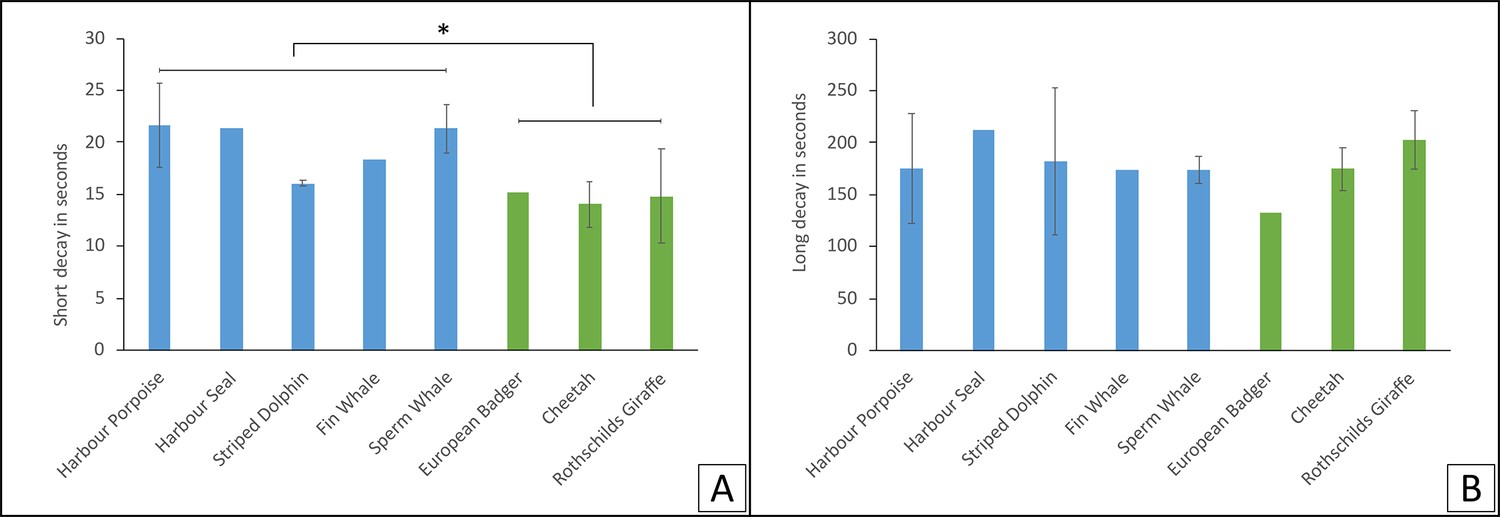
Stress relaxation.
(A) Initial stress relaxation appeared slower for aquatic mammals and steeper for terrestrial mammals. (B) No significant differences were observed in the phase of slow relaxation.
Figure 4 with 2 supplements
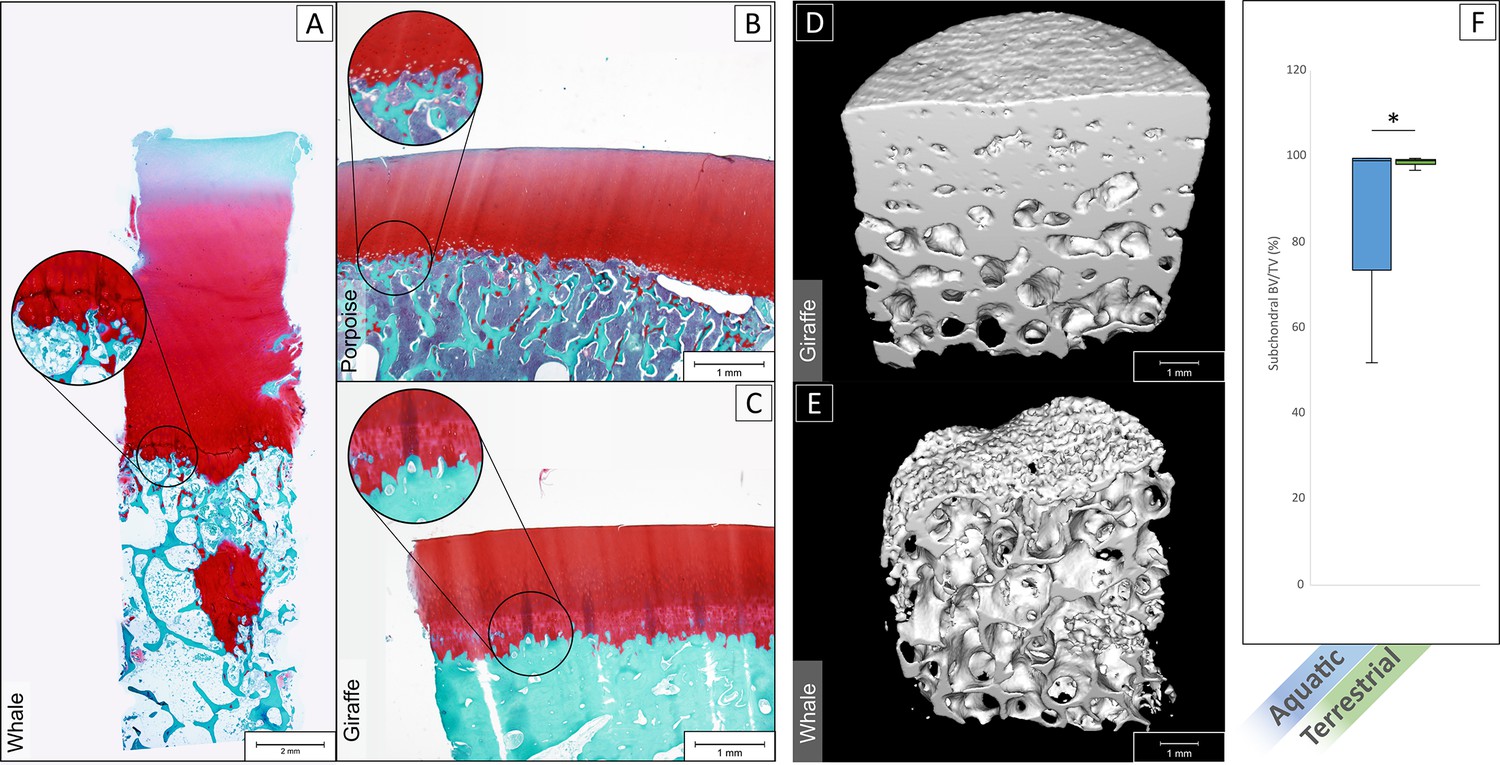
Histological staining and micro-CT analysis of the osteochondral tissues.
Safranin-O staining of histological sections of the tissue of a sperm whale (A), harbor porpoise (B) and Rothschild’s giraffe (C). Aquatic mammals (A,B) showed an abrupt transition from hyaline cartilage to subchondral trabecular bone. Terrestrial mammals (C) displayed the characteristic calcified cartilage layer with tidemark (in magnification bubble) in between and a dense subchondral plate before the subchondral trabecular bone. (D) 3D rendered micro-CT scan of giraffe bone core, showing on top a dense surface area that interfaces with the (calcified) cartilage (not shown in scan) and a gradually more porous structure as the subchondral tissue transitions to trabecular bone. (E) 3D rendered micro-CT scan of a whale bone core, showing a porous surface on top where it interfaces with cartilage, and a porous structure underneath with seemingly no transition from more dense subchondral bone to trabecular bone. (F) Bone volume/total volume (BV/TV) in the subchondral area (immediately underneath the cartilage) for aquatic mammals (blue) was significantly lower than in terrestrial mammals (green) (p<0.01).
Figure 4—figure supplement 1
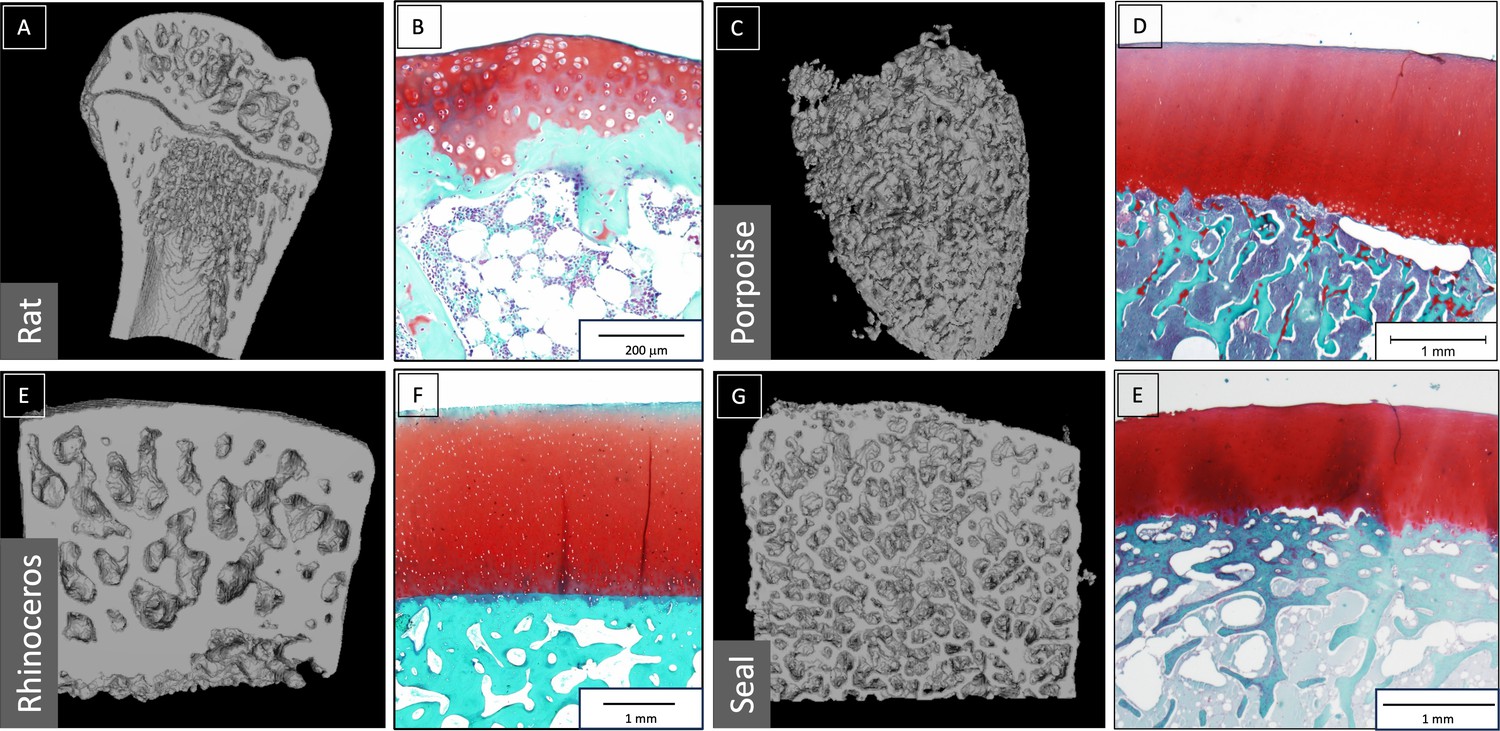
Examples of the analysis of tissue from additional species.
3D rendered micro-CT scans (A, C, E, G) and histological sections stained with safranin-O (B, D, F, H) of the osteochondral tissues derived of terrestrial (rat: A, B; white rhinoceros: E, F) and aquatic (harbor porpoise: C, D; harbor seal: G, H) mammals.
Figure 4—figure supplement 2
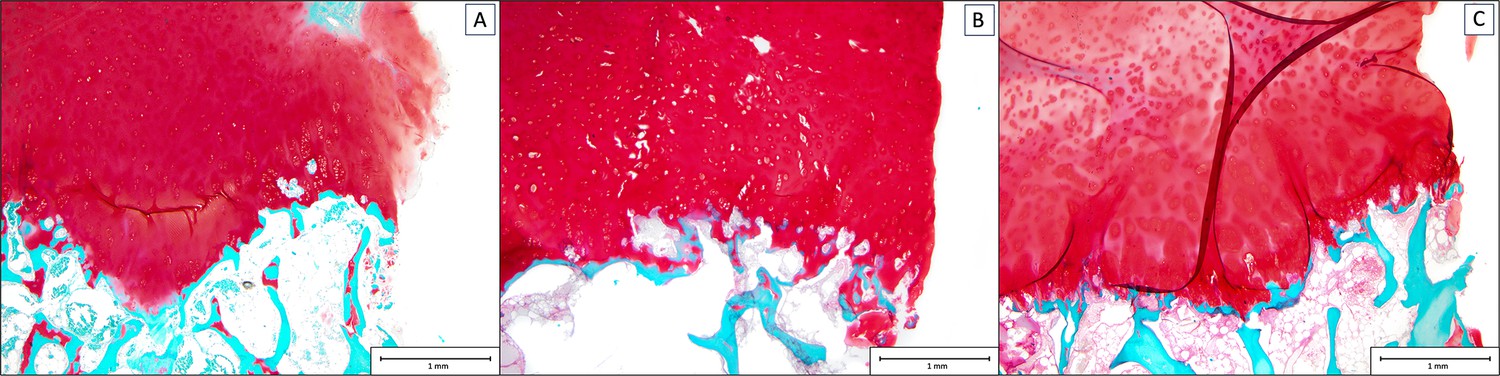
Lack of calcified cartilage in the sperm whale.
Safranin-O staining of histological sections of tissue of the three sperm whales (A, B, C) included in this study, highlighting the lack of the calcified cartilage layer at the cartilage-bone interface.
Figure 5

Comparison of the subchondral bone structures in the different species.
Examples of macroscopic (left) and micro-CT scans (right) of a Rothschild’s giraffe, porpoise and sperm whale. Left images show the macroscopic aspect of the humeral head of two aquatics and a terrestrial animal, on the right the correspondent micro-CT scan of the trabecular bone. (A, B) Terrestrial mammals featured a denser bone, while bone density was lower in harbor porpoises (C, D) and still lower in deep-diving animals (E,F). (G) Trabecular BV/TV increased with body mass in terrestrial mammals (green), and decreased with body mass in aquatic mammals (blue). (H) Trabecular bone thickness (Tb.Th) increased with size in terrestrial mammals (green), and was independent of size in aquatic mammals (blue).
Figure 6

Schematic drawings of the front extremities.
Drawings highlighting the location of the humerus (in red) of which the head (top) was sampled in this study for the sperm whale (A), harbor porpoise (B) and Rothschild’s giraffe (C).
Figure 7
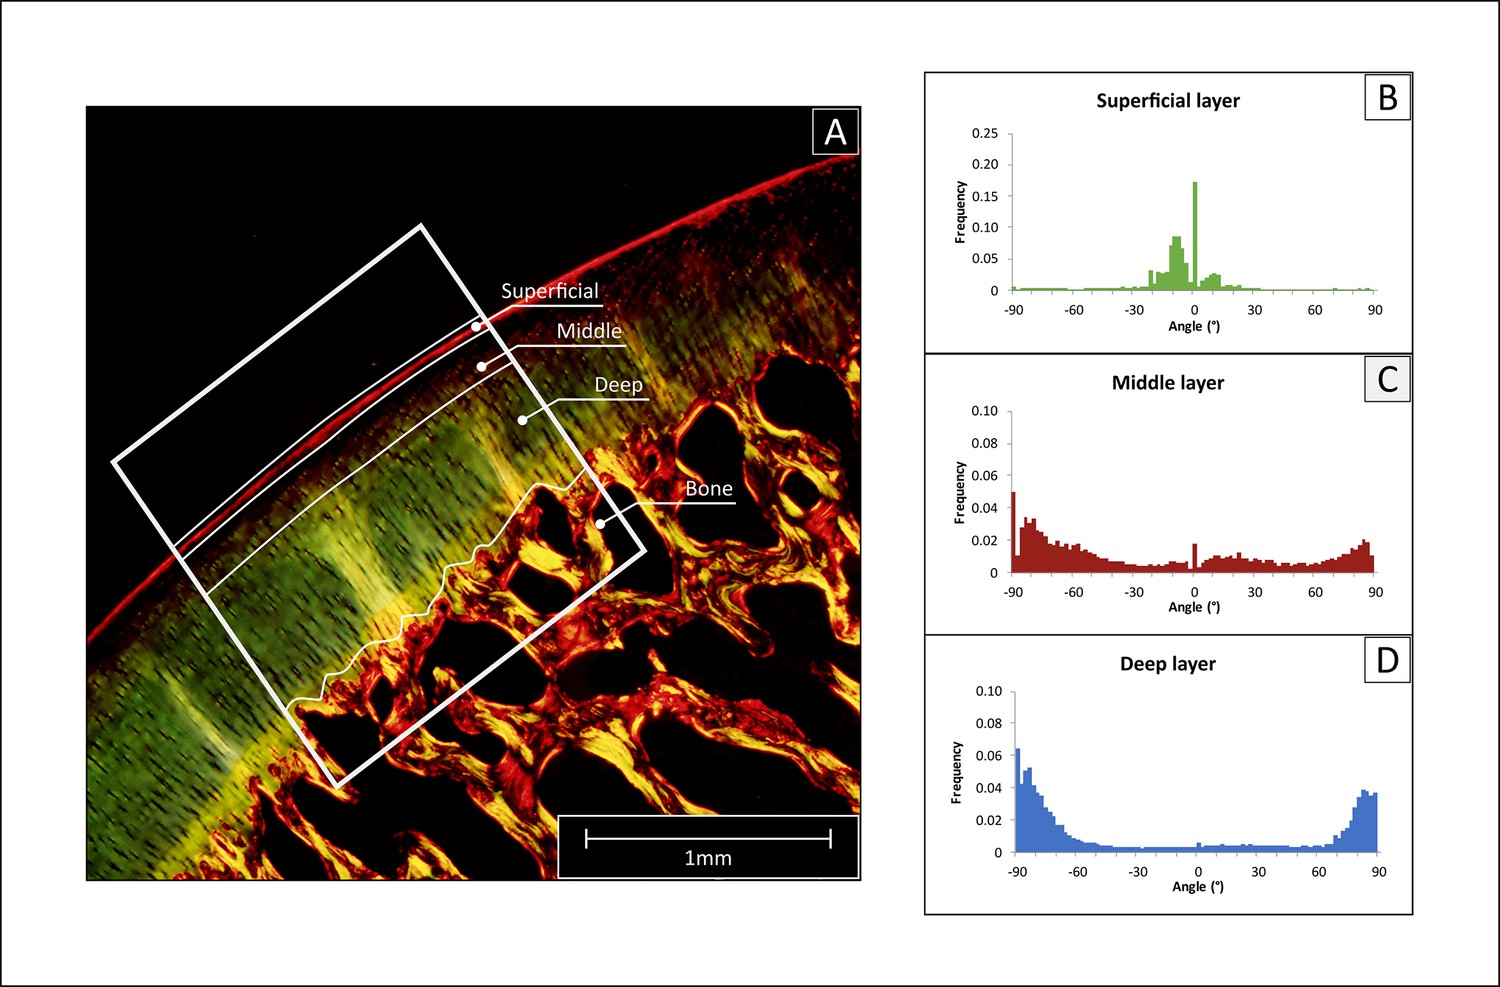
Polarized light microscopy (PLM) analysis of collagen fiber orientation.
(A) The histological sections stained with picrosirius red were imaged, then a region of interest was selected (ROI, white frame), and the cartilage tissue was divided into deep, middle and superficial layer. (B–D) The selected region was analyzed with Image J to determine the frequency of fibers for angle increments of 2°, obtaining a detailed histogram for each region.
Tables
Table 1
List of species included in the study.
In total tissue samples from 85 animals (34 for histological analysis, 29 for micro-CT and 20 for biomechanical analysis) were harvested for a total of 15 different species.
| Species | Average body mass (kg) | Thickness | Histology (n) | Micro-CT (n) | Bio-mechanics (n) | |
|---|---|---|---|---|---|---|
| 1 | Rat (Rattus sp) | 0.26 | 0.21 | 4 | 3 | - |
| 2 | European Badger (Meles meles) | 13.2 | 0.84 | 1 | 1 | 1 |
| 3 | Tufted deer (Elaphodus cephalophus) | 23 | 1.30 | 1 | - | - |
| 4 | Indian crested porcupine (Hystrix indica) | 24.5 | 0.5 | 1 | 1 | - |
| 5 | Cheetah (Acinonyx jubatus) | 25.5 | 0.48 | 1 | 1 | 2 |
| 6 | Harbor porpoise (Phocoena phocoena) | 54.5 | 1.11 | 9 | 9 | 9 |
| 7 | Harbor seal (Phoca vitulina) | 67.5 | 1.77 | 2 | 2 | 2 |
| 8 | Shetland pony (Equus ferus caballus) | 175 | 1.17 | 2 | 2 | - |
| 9 | Striped dolphin (Stenella coeruleoalba) | 180 | 1.37 | 1 | 1 | 1 |
| 10 | Onager (Equus hemionus) | 203 | 0.89 | 1 | 1 | - |
| 8b | Horse (Equus ferus caballus) | 550 | 1.38 | 2 | 2 | - |
| 11 | Rothschild’s giraffe (Giraffa camelopardalis) | 1070 | 1.85 | 2 | 1 | 2 |
| 12 | White rhinoceros (Ceratotherium simum) | 1475 | 2.16 | 1 | 1 | - |
| 13 | Common minke whale (Balaenoptera acutorostrata) | 5100 | 5.05 | 2 | - | - |
| 14 | Sperm whale (Physeter macrocephalus) | 47.300 | 6.51 | 3 | 3 | 3 |
| 15 | Fin whale (Balaenoptera physalus) | 48.000 | 7.53 | 1 | 1 | 1 |
| Total | 34 | 29 | 20 |
Table 2
Overview of cartilage samples on which biomechanical tests were conducted, with average diameter and thickness per species.
| Species | Number of animals | Number of samples | Cartilage diameter (mm) | Cartilage thickness (mm) |
|---|---|---|---|---|
| European Badger (Meles meles) | 1 | 1 | 6.4 | 1.7 |
| Cheetah (Acinonyx jubatus) | 1 | 2 | 6.5 | 2.1 |
| Rothschild’s giraffe (Giraffa camelopardalis) | 2 | 3 | 6.9 | 1.7 |
| Harbor Porpoise (Phocoena phocoena) | 9 | 9 | 6.6 | 1.7 |
| Harbor Seal (Phoca vitulina) | 2 | 2 | 7.4 | 3.7 |
| Striped dolphin (Stenella coeruleoalba) | 1 | 3 | 7.6 | 1.9 |
| Sperm whale (Physeter macrocephalus) | 3 | 4 | 6.3 | 8.5 |
| Fin whale (Balaenoptera physalus) | 1 | 2 | 6.4 | 8.9 |
Additional files
Download links
A two-part list of links to download the article, or parts of the article, in various formats.
Downloads (link to download the article as PDF)
Open citations (links to open the citations from this article in various online reference manager services)
Cite this article (links to download the citations from this article in formats compatible with various reference manager tools)
Microstructural differences in the osteochondral unit of terrestrial and aquatic mammals
eLife 12:e80936.
https://doi.org/10.7554/eLife.80936


