Defocus Corrected Large Area Cryo-EM (DeCo-LACE) for label-free detection of molecules across entire cell sections
- RNA Therapeutics Institute, University of Massachusetts Chan Medical School, Howard Hughes Medical Institute, United States
- Department of Stem Cell and Regenerative Biology, Harvard University, United States
- Harvard Stem Cell Institute, United States
- Center for Regenerative Medicine, Massachusetts General Hospital, United States
Figures
Figure 1 with 1 supplement
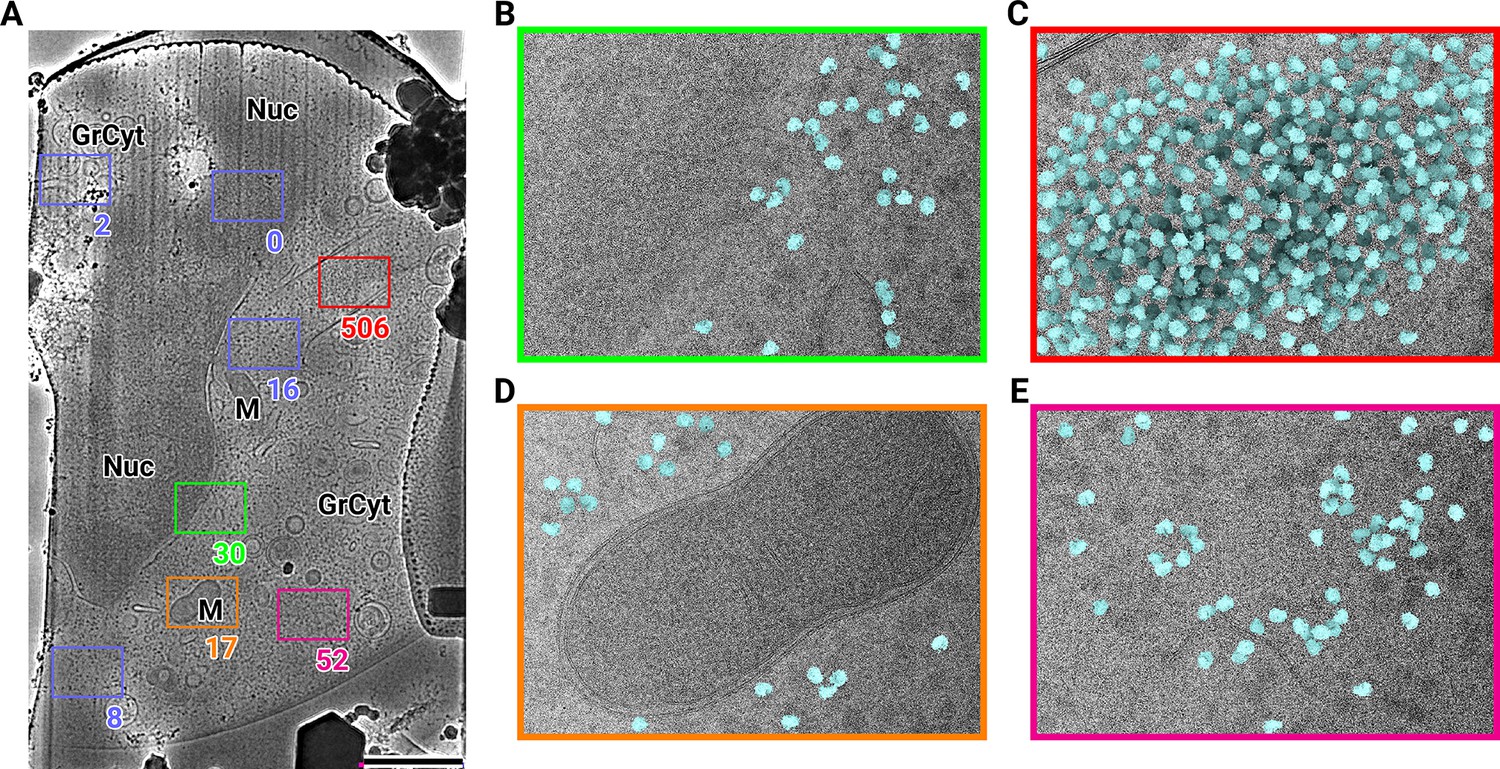
2D template matching of the large subunit of the ribosome in fib-milled neutrophil-like cells (A) Overview image of the lamella.
Major cellular regions are labeled, as Nucleus (Nuc), Mitochondria (M), and granular cytoplasm (GrCyt). FOVs where high-magnification images for template matching where acquired are indicated as boxes with the number of detected targets indicated on the bottom right. FOVs displayed in Panels B-E are color-coded. Scalebar corresponds to 1 μm. (B–E) FOVs with projection of detected LSUs shown in cyan. (B) Perinuclear region, the only detected targets are in the cytoplasmic half. (C) Cytoplasmic region with high density of ribosomes (D) Mitochondrium, as expected there are only detected LSUs in the cytoplasmic region (E) Cytoplasm, with low density of ribosomes.
Figure 1—figure supplement 1
2D template matching of the large subunit of the ribosome in fib-milled neutrophil-like cells.
Figure 2 with 1 supplement
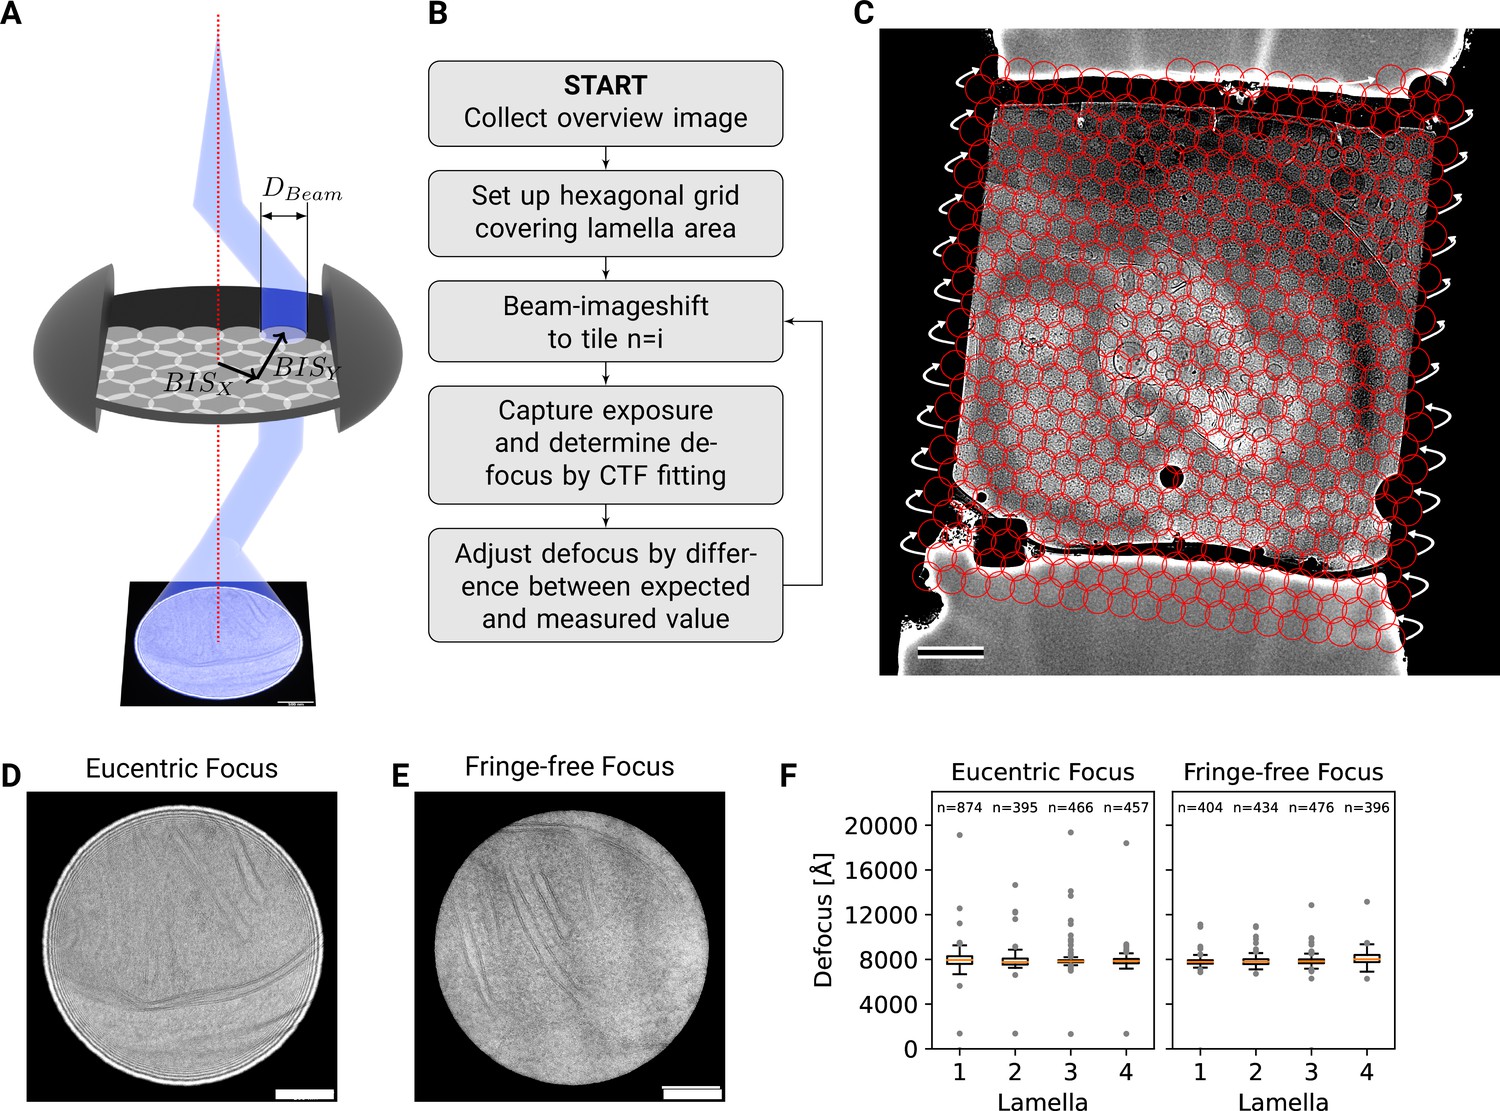
DeCo-LACE approach.
(A) Graphic demonstrating the data-collection strategy for DeCo-LACE. The electron beam is condensed to a diameter that allows capturing of the whole illuminated area on the camera. Beam-image shift along X and Y (,$) is used to scan the whole lamella. (B) Diagram of the collection algorithm. (C) Example overview image of a lamella with the designated acquisition positions and the used beam diameter indicated with red circles. Scalebar corresponds to 1 μm. (D+E) Representative micrographs taken with a condensed beam at eucentric focus (panel D) or fringe-free focus (panel E). Scalebar corresponds to 100 nm. (F) Boxplot of defocus measured by ctffind of micrographs taken by the DeCo-LACE approach on four lamellae imaged at eucentric focus and four lamellae imaged with fringe-free focus. Sample size n is indicated for each lamella.
Figure 2—figure supplement 1
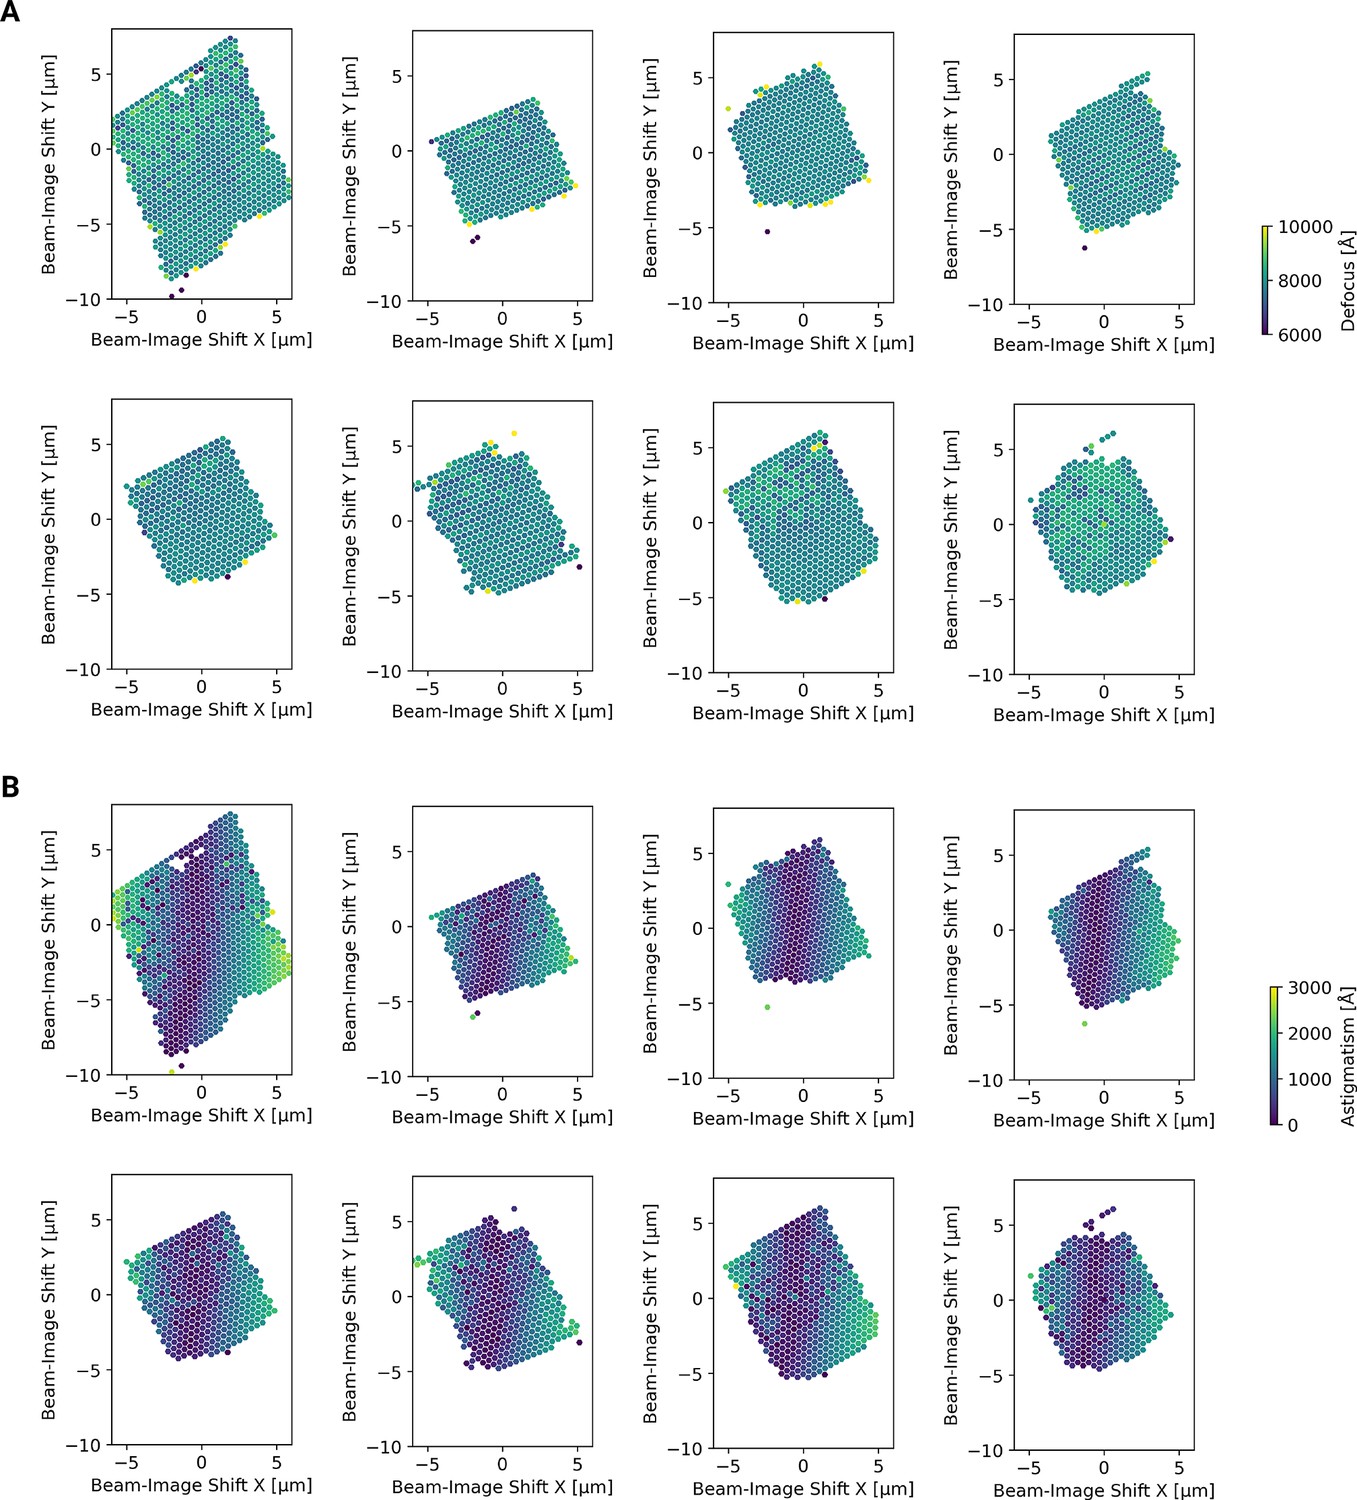
Defocus estimation of individual tiles of DeCo-LACE montages.
(A) Defocus values of individual micrographs taken using the DeCo-LACE approach plotted as a function of the beam image-shift values. (B) Defocus astigmatism of individual micrographs taken using the DeCo-LACE approach plotted as a function of the beam image-shift values.
Figure 3 with 4 supplements
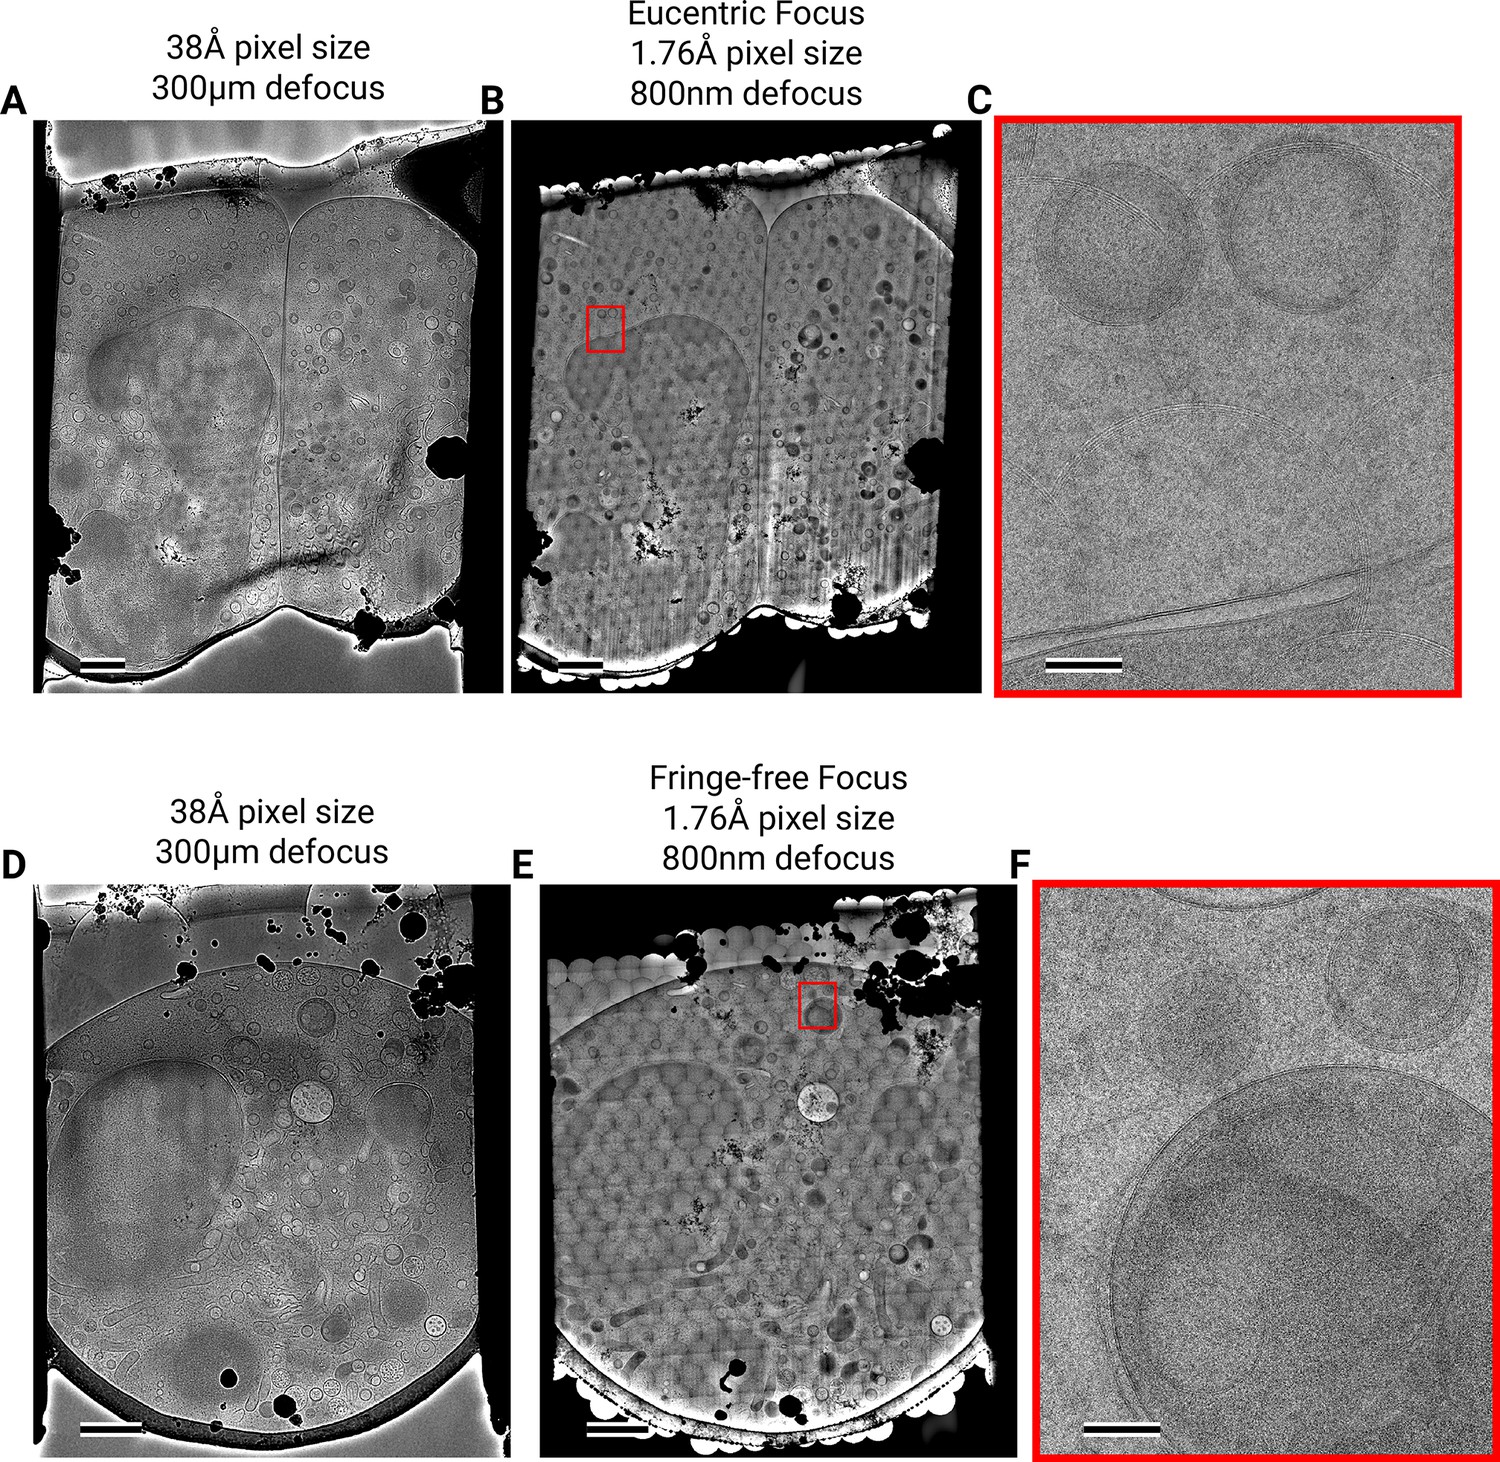
Assembling DeCo-LACE exposures into montages.
(A) Overview image of LamellaEUC 1 taken at low magnification. Scalebar corresponds to 1 μm. (B) Overview of LamellaEUC 1 created by montaging high magnification images taken with the DeCo-LACE approach. Scalebar corresponds to 1 μm. (C) Zoom-in into the red box in panel B. Slight beam-fringe artifacts are visible. Scalebar corresponds to 100 nm. (D) Overview image of LamellaFFF 4 taken at low magnification. Scalebar corresponds to 1 μm. (E) Overview of LamellaFFF 4 created by montaging high magnification images taken with the DeCo-LACE approach. Scalebar corresponds to 1 μm. (F) Zoom-in into the red box in panel E. No beam-fringe artifacts are visible. Scalebar corresponds to 100 nm.
Figure 3—figure supplement 1
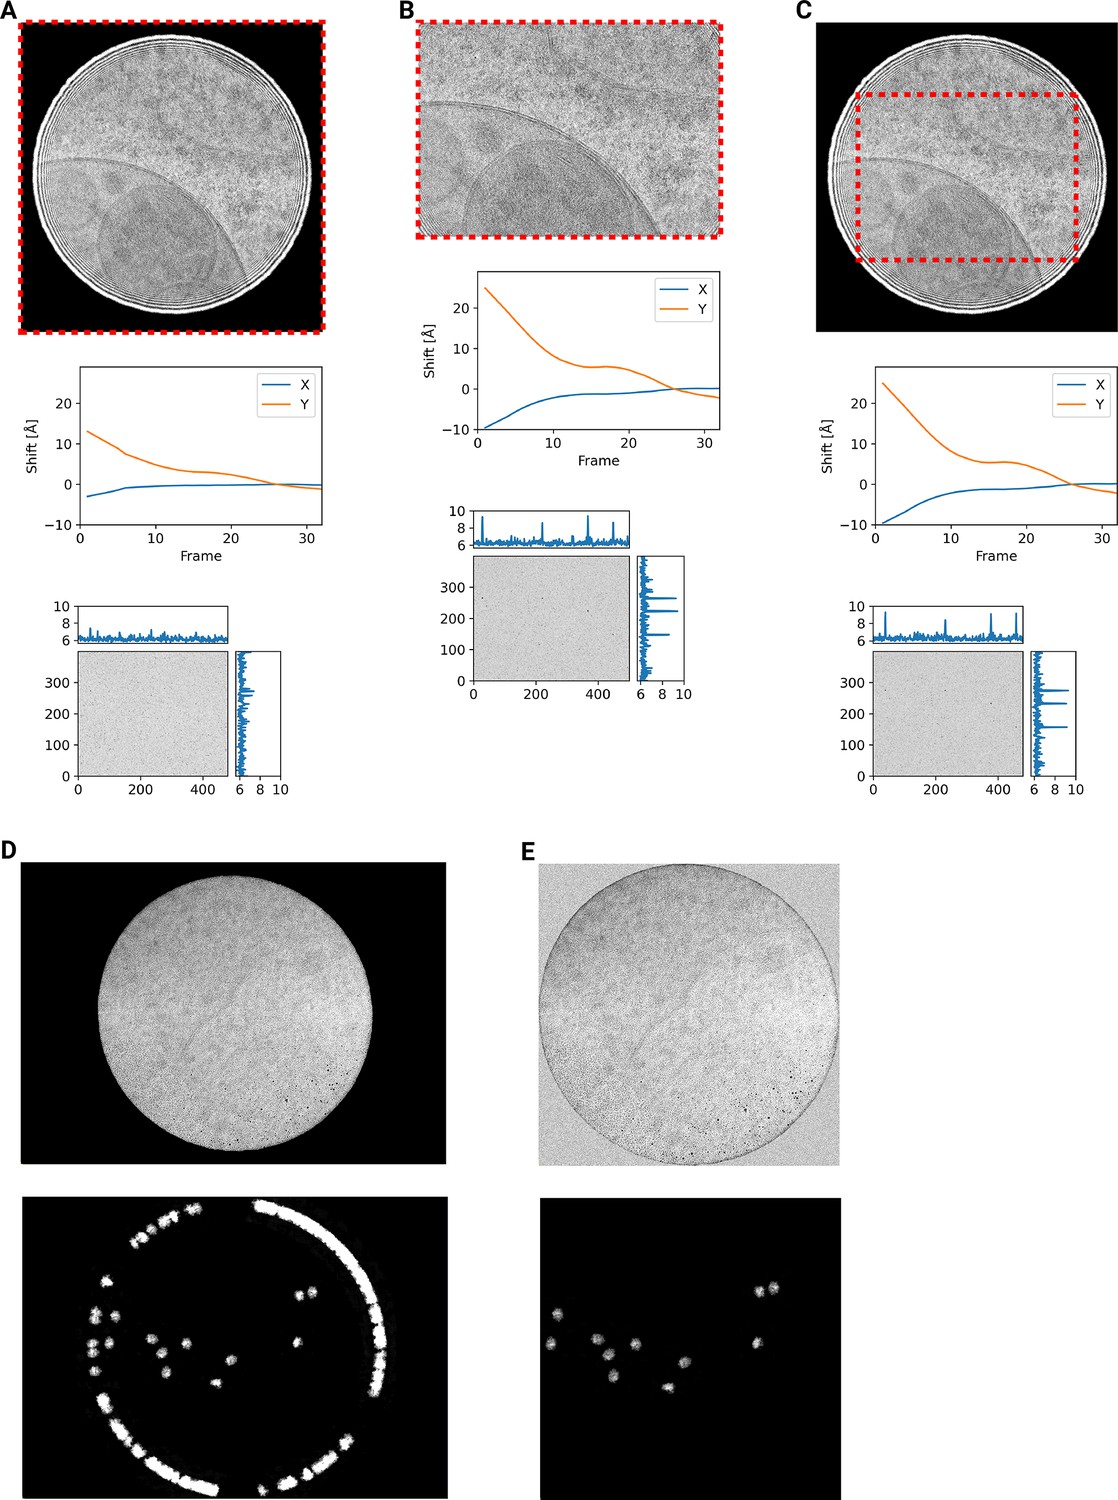
Motion correction of movies with condensed beams.
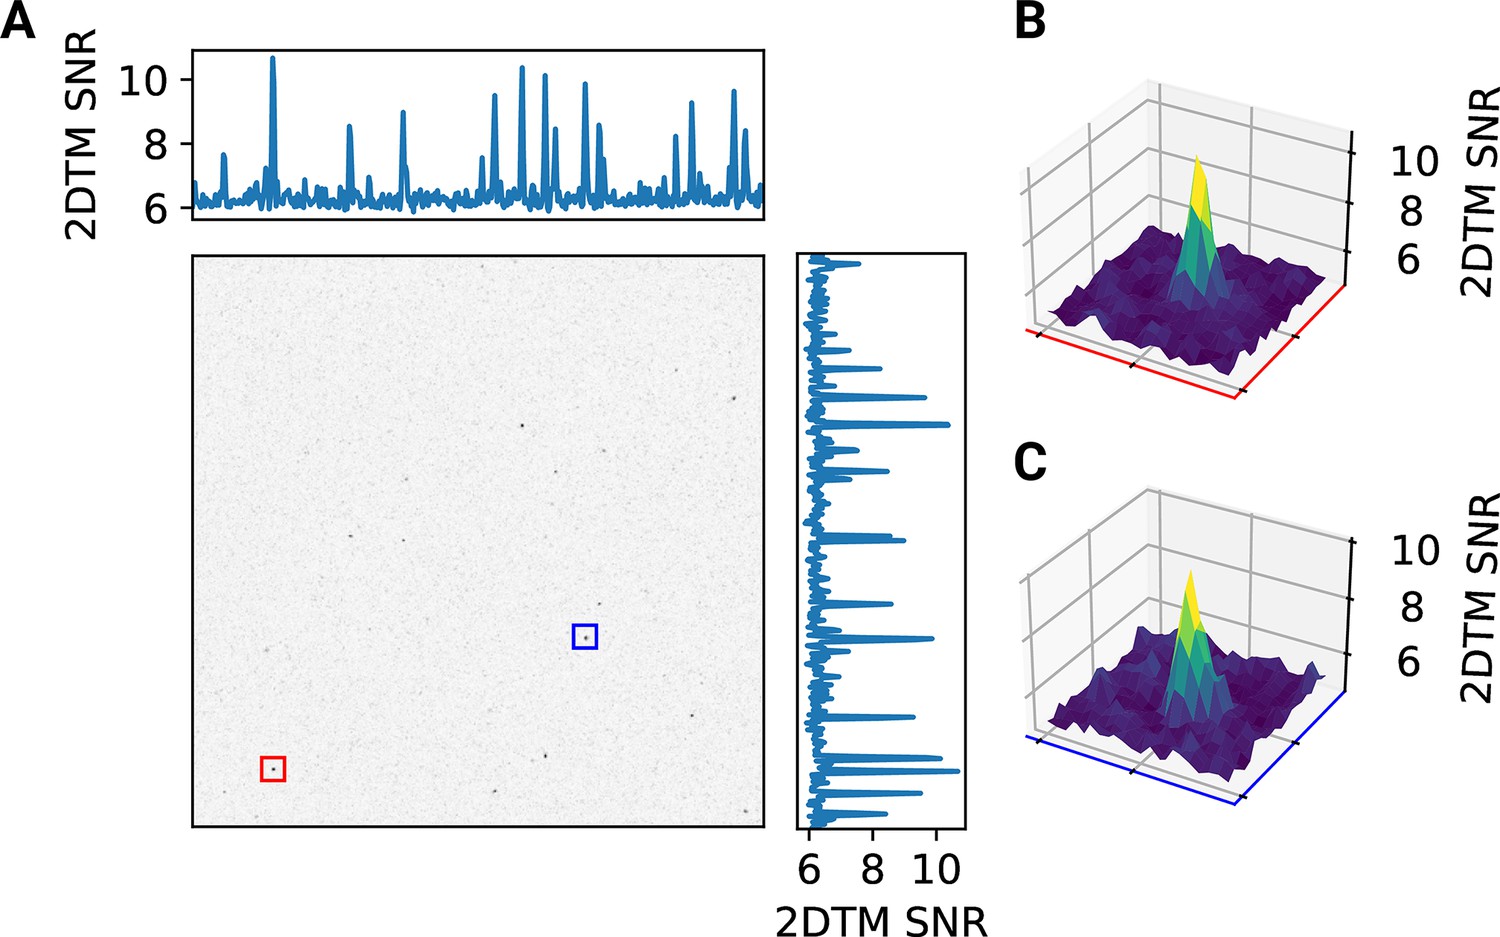
At the top of each panel is an average of the movie that was motion-corrected with a red dashed box indicating the region that was used to estimate shifts. Below is a graph indicating the estimated shifts of the individual frames of the movie. Below this is the MIP of 2DTM using the large subunit of the mouse ribosome. (A) Motion correction of the whole movie (B) Motion correction of a cropped region of the movie that eliminates the beam edges. (C) Motion correction of the whole movie, using only the central region to estimate the shifts. (D) Representative result of 2DTM (bottom) on uncorrected micrographs. Detections along the beam edge are artifacts due to the high-contrast signal. (E) Micrograph after preprocessing for 2DTM (top). The micrograph has been cropped to the perimeter of the beam and unilluminated areas of the image have been replaced with Gaussian noise. After running 2DTM on this micrograph (bottom), no more artifactual detections are observed.
Figure 3—figure supplement 2
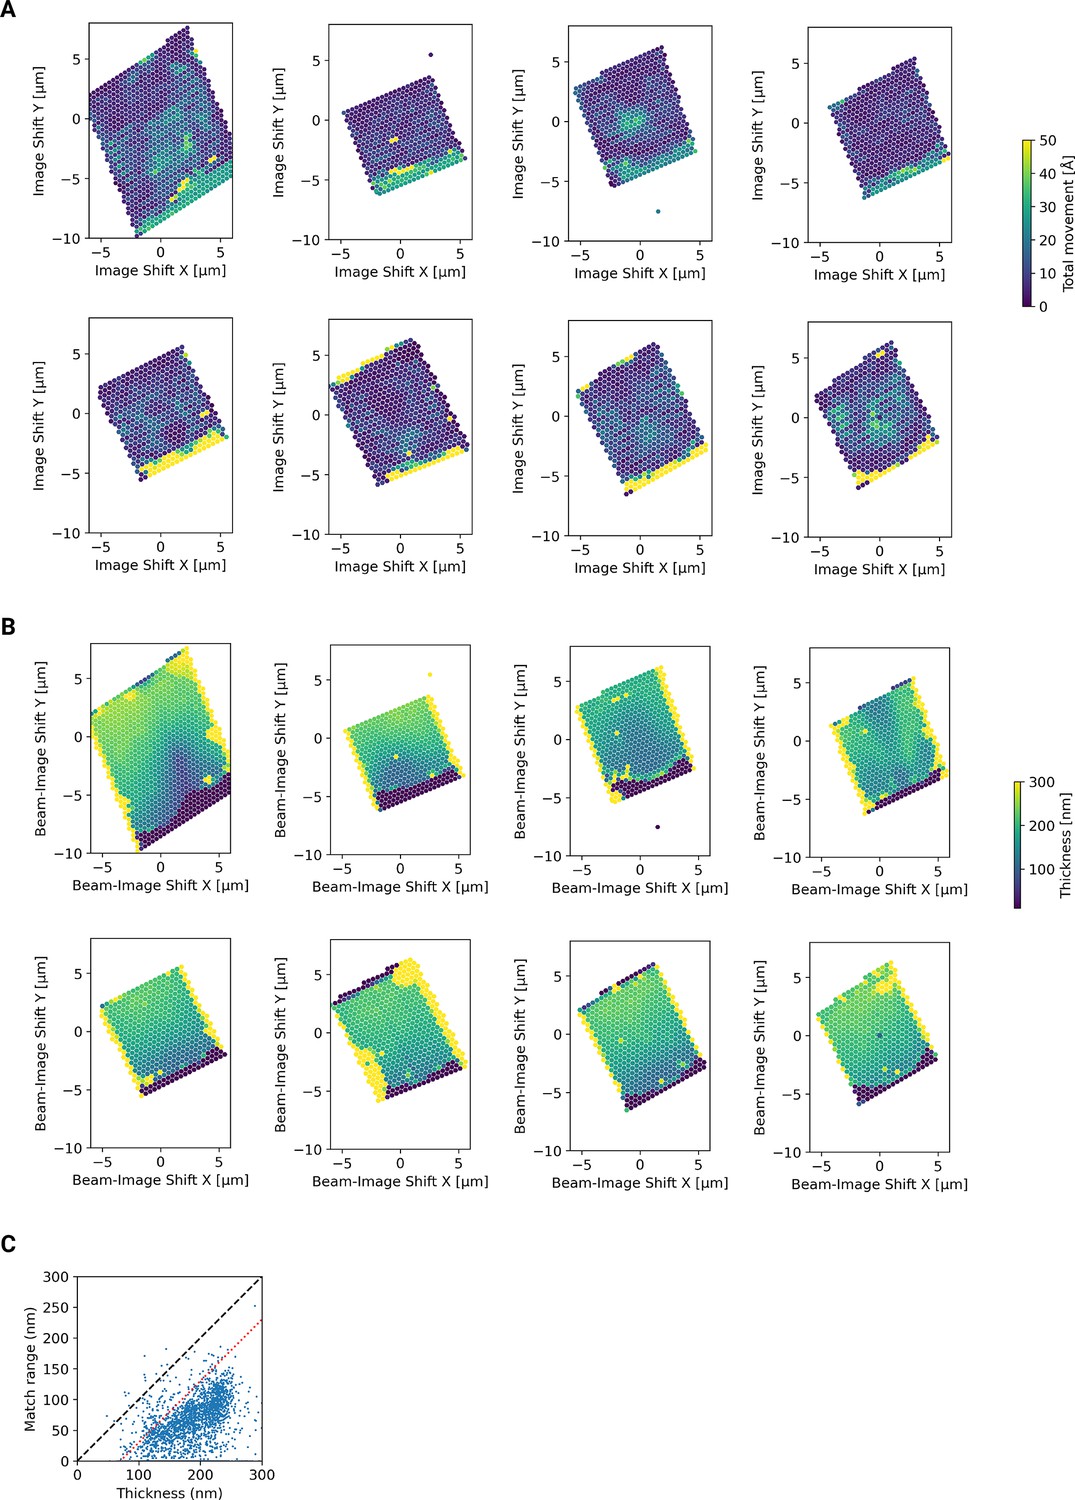
Motion correction of individual tiles imaged using the DeCo-LACE approach.
(A) Total estimated motion of individual micrographs taken using the DeCo-LACE approach plotted as a function of the beam image-shift values. (B) Sample thickness estimate of individual micrographs taken using the DeCo-LACE approach plotted as a function of the beam image-shift values. Sample thickness was estimated using Lamber-Beers law using a coefficient of 322 nm (Rice et al., 2018). (C) Distance between highest and lowest LSU detection in each micrograph plotted as a function of estimated sample thickness. The dashed black line indicates unity and red dashed line is drawn in parallel with an x intercept of 70 nm. Most data points fall below the red dashed line, indicating that no detections occur within 35 nm of the lamella edge.
Figure 3—figure supplement 3
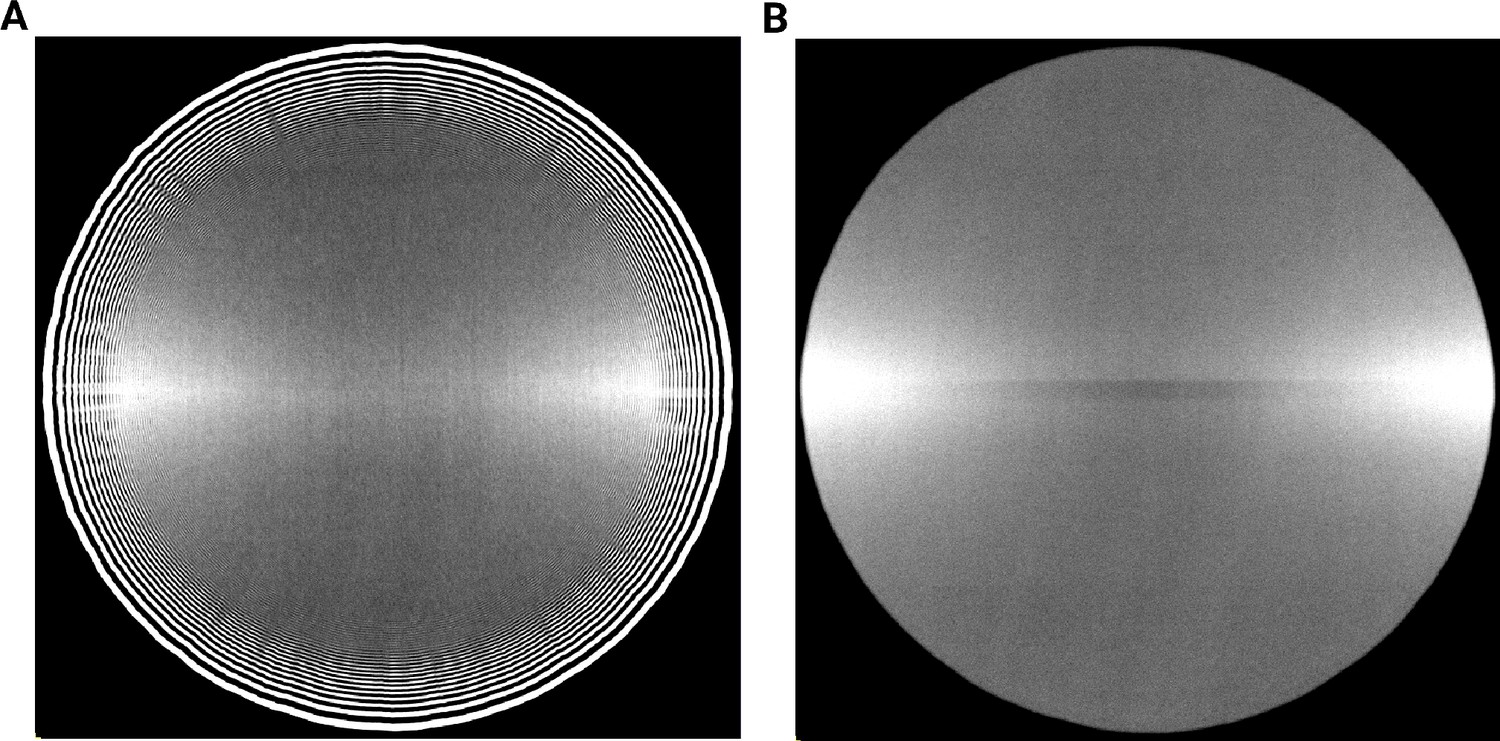
Averages of micrographs taken with a condensed beam over vacuum using a Gatan K3 detector.
Contrast and Brightness have been adjusted to highlight uneven exposure response. (A) Eucentric Focus (B) Fringe-free Focus.
Figure 3—figure supplement 4
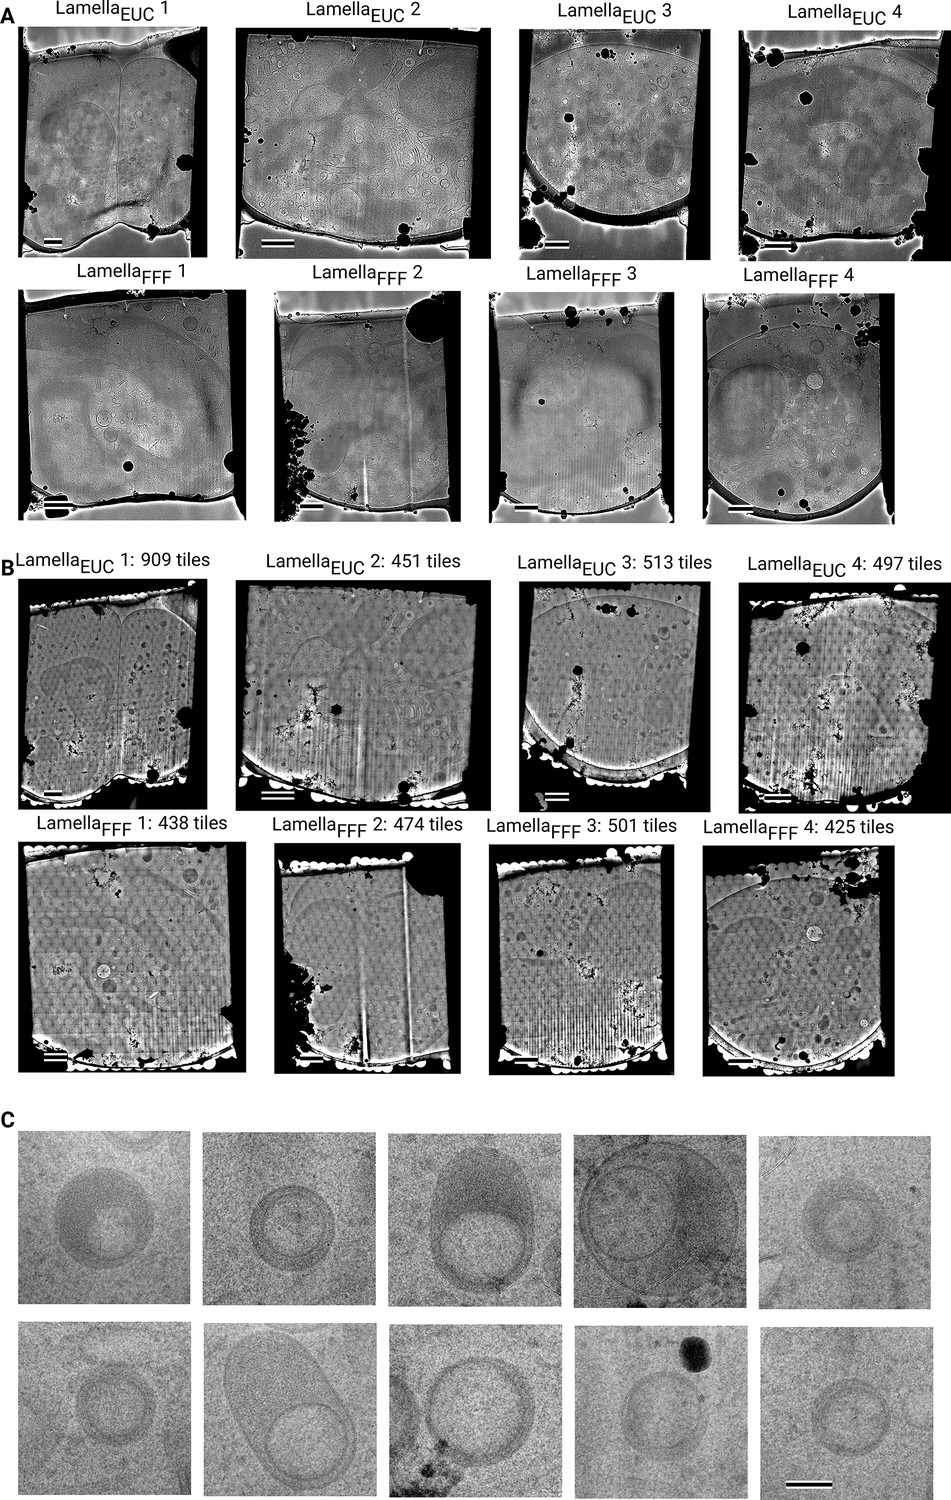
Overview images of lamellae imaged using the DeCo-LACE approach taken at low-magnification.
(A) Overviews taken at low magnification. Scalebar corresponds to 1 μm. (B) Overviews assembled using the DeCo-LACE approach. Scalebar corresponds to 1 μm. (C) Representative examples of a class of granules containing a putatively cytosolic inclusion. Scalebar corresponds to 100 nm.
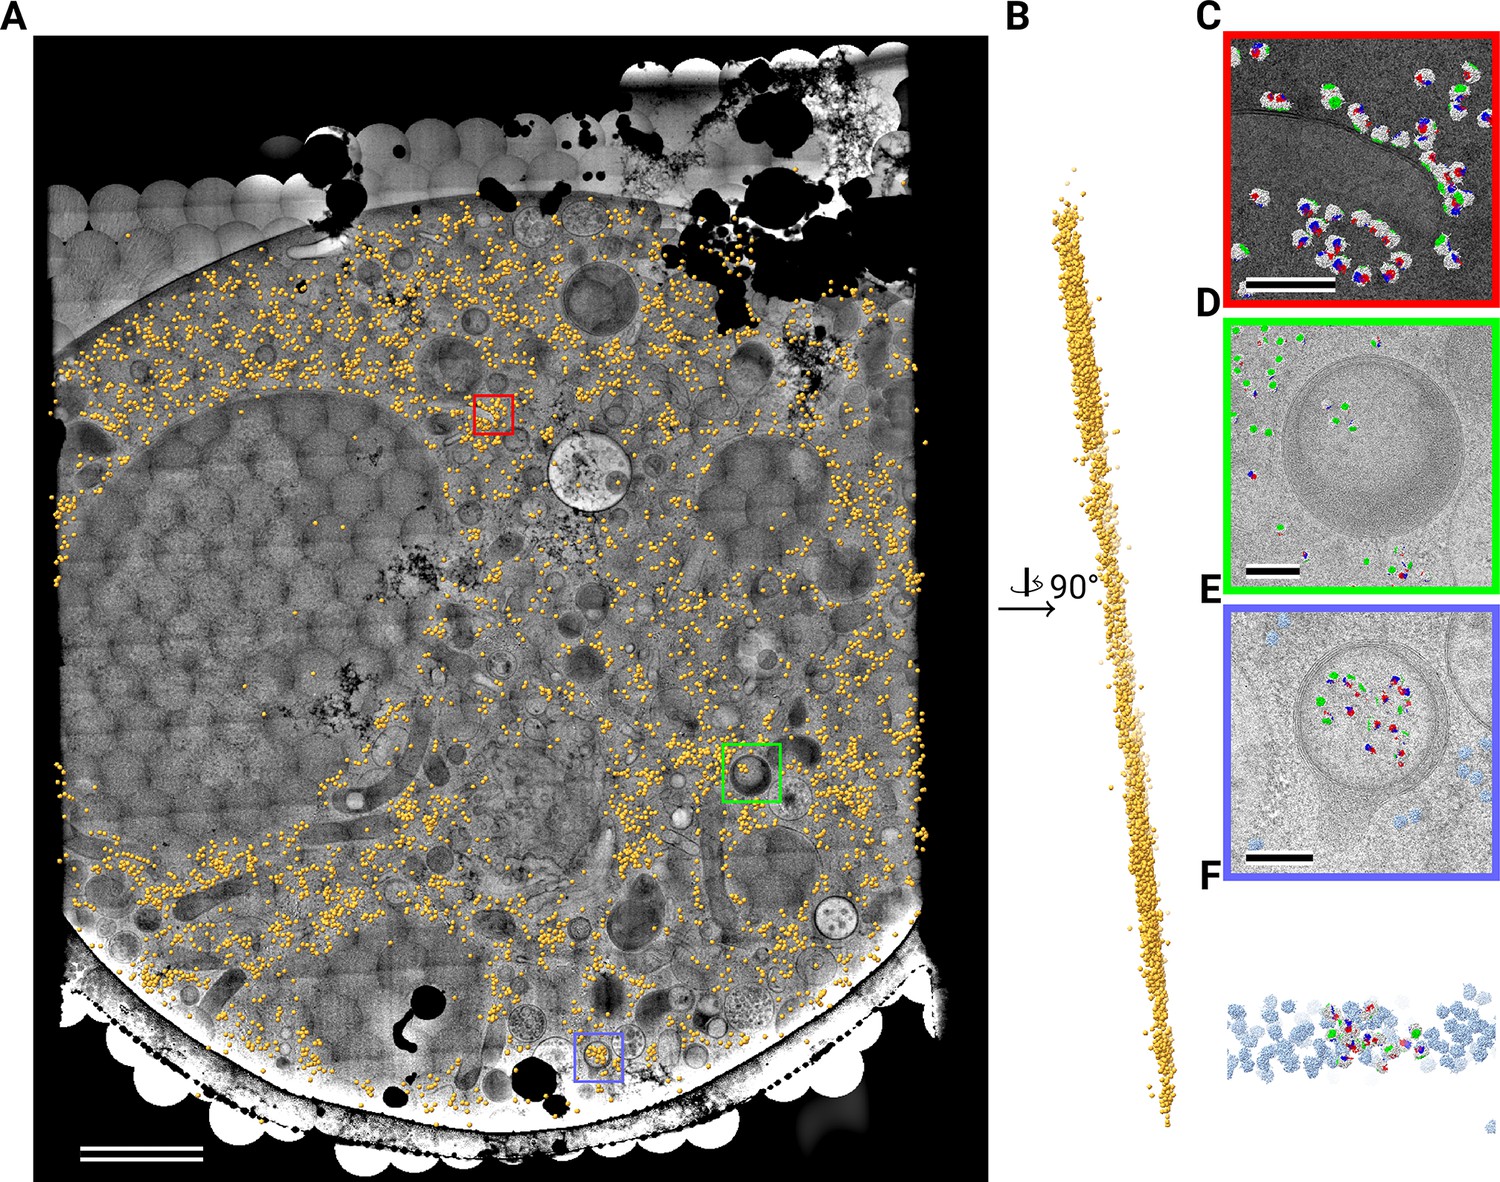
Figure 4 with 1 supplement

Template matching in a lamella imaged using the DeCo-LACE approach at eucentric focus.
(A) Montage of LamellaEUC1 overlaid with detected targets colored in orange. Scalebar corresponds to 1 μm. (B) Side view of detected targets in the lamella, such that the direction of the electron beam is horizontal. (C–F) Magnified area of panel A showing rough ER with associated ribosomes (C), outer nuclear membrane with associated ribosomes (D), ribsomes arranged in a circular fashion (E), ribosomes enclosed in a less dense inclusion in a granule (F). Ribosomes are colored in white with the surface of the peptide exit tunnel colored in green and the A, P, and E sites colored in blue, purple, and red, respectively. Scalebar corresponds to 100 nm.
Figure 4—video 1
Movie of detected LSU targets in LamellaEUC1, corresponding to Figure 4.
Figure 5 with 1 supplement
Template matching in a lamella imaged using the DeCo-LACE approach at fringe-free focus.
(A) Montage of LamellaFFF4 overlaid with detected targets colored in orange. Scalebar corresponds to 1 μm. (B) Side view of detected targets in the lamella, such that the direction of the electron beam is horizontal. (C–E) Magnified area of panel A showing rough ER with associated ribosomes (C) and ribosomes enclosed in a less dense inclusion in a granule (D,E). (F) Side view of panel E. Ribosomes are colored in white with the surface of the peptide exit tunnel colored in green and the A, P, and E sites colored in blue, purple, and red, respectively. Scalebar corresponds to 100 nm.
Figure 5—video 1
Movie of detected LSU targets in LamellaFFF 4, corresponding to Figure 5.
Figure 6
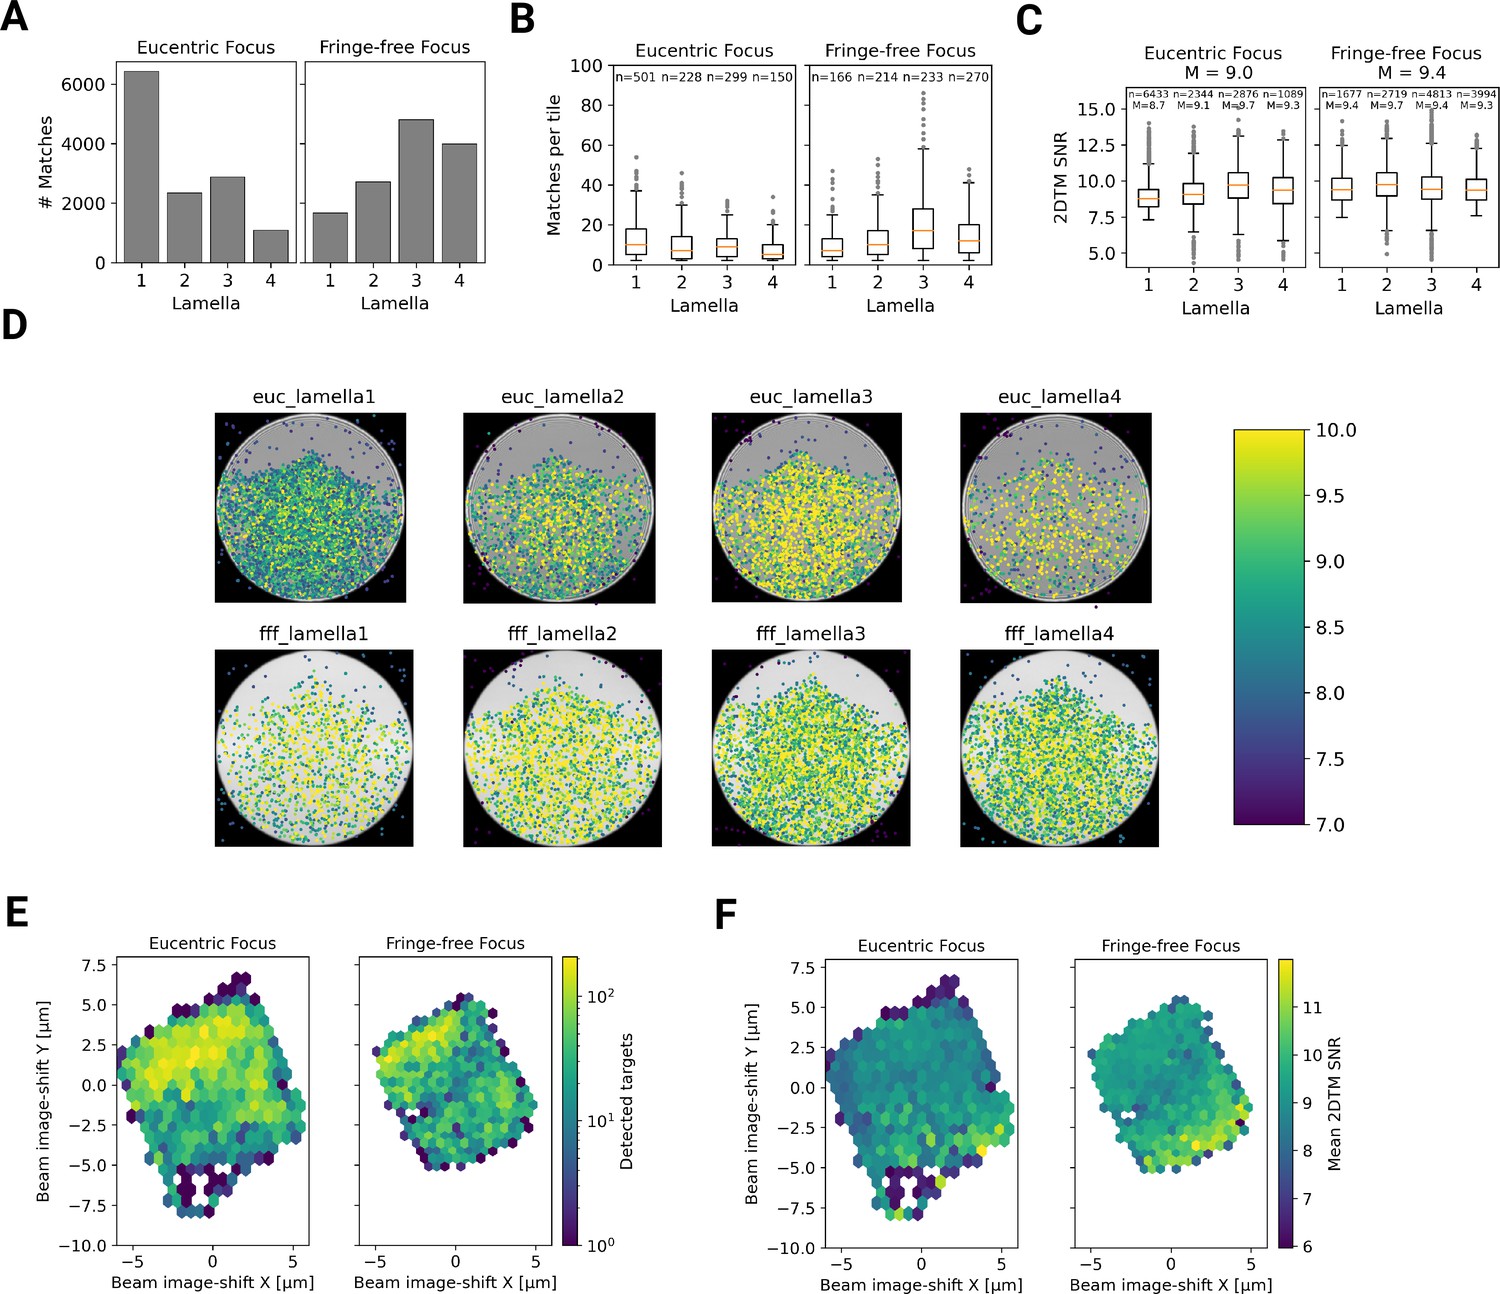
Statistics of 2DTM on a lamella imaged using DeCo-LACE.
(A) Number of detected targets in each lamella. (B) Boxplot of detections per tile in each lamella. Only tiles with two or more detected targets were included. Sample size n is indicated for each lamella. (C) Boxplot of SNRs in each lamella. Sample size n and median M are indicated for each lamella. (D) For each lamella, an average of all tiles is shown. Overlaid is a scatterplot of all detected targets in these tiles according to their in-tile coordinates. The scatterplot is colored according to the 2DTM SNR. There are no detected targets in the top circle-circle intersection due to radiation damage from previous exposures. (E) 2D histogram of the number of detected targets as a function of beam-image shift. (F) Mean 2DTM SNR as a function of beam-image shift.
Figure 7

Workflow of DeCo-LACE processing.
Tables
Key resources table
| Reagent type (species) or resource | Designation | Source or reference | Identifiers | Additional information |
|---|---|---|---|---|
| Cell line (Mus musculus) | ER-HoxB8 | Sykes et al., 2016 | Generated from mouse bone marrow as described | |
| Peptide, recombinant protein | SCF | Sykes et al., 2016 | Generated from CHO-SCF cell line as described | |
| Chemical compound, drug | Estrogen | Sigma | E8875 |
Additional files
Download links
A two-part list of links to download the article, or parts of the article, in various formats.
Downloads (link to download the article as PDF)
Open citations (links to open the citations from this article in various online reference manager services)
Cite this article (links to download the citations from this article in formats compatible with various reference manager tools)
Defocus Corrected Large Area Cryo-EM (DeCo-LACE) for label-free detection of molecules across entire cell sections
eLife 11:e80980.
https://doi.org/10.7554/eLife.80980


