The circadian clock controls temporal and spatial patterns of floral development in sunflower
- Department of Plant Biology, University of California, Davis, United States
- Department of Plant and Soil Sciences, FABI, Innovation Africa, University of Pretoria, South Africa
Figures
Figure 1
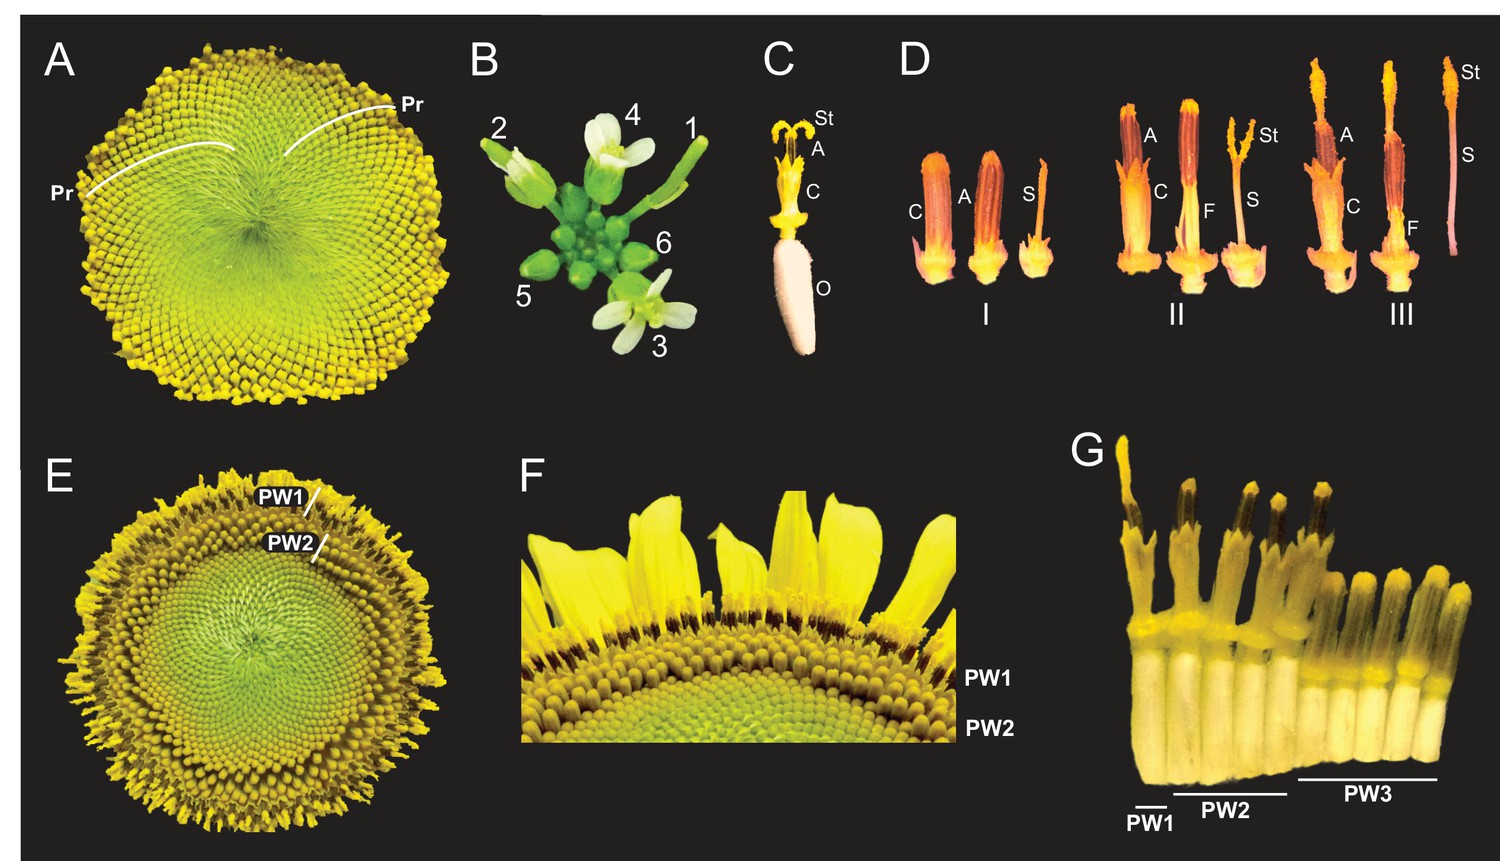
Architecture of the sunflower capitulum.
(A) A sunflower capitulum before onset of anthesis, with obvious clockwise and counter-clockwise parastichies (Pr) of individual florets. (B) An Arabidopsis thaliana inflorescence also displays spiral phyllotaxy. Numbers indicate age of flowers. (C) One sunflower floret post-anthesis. Organs are abbreviated as ovary (O), corolla tube (C), anther tube (A), filaments (F), style (S), and stigma (St). Anther tubes and filaments collectively make the stamens. (D) The primary stages of floret development: (I) pre-anthesis immature, (II) early anthesis staminate, and (III) late anthesis pistillate. For each stage, the left-most floret is undissected, the corolla tube was removed from the middle floret, and the corolla and stamen were removed from the right-most floret. (E) A sunflower capitulum on day 2 of anthesis in which coordinated pseudowhorls (PW) of developing florets are apparent. (F) An angled view of (E). (G) A cross-section of (E); florets and ovaries along a single parastichy that belong to three different pseudowhorls. Images C–G were acquired at ZT 2. All plants grown in LD|25°C (16 hr:8 hr).
Figure 2 with 2 supplements
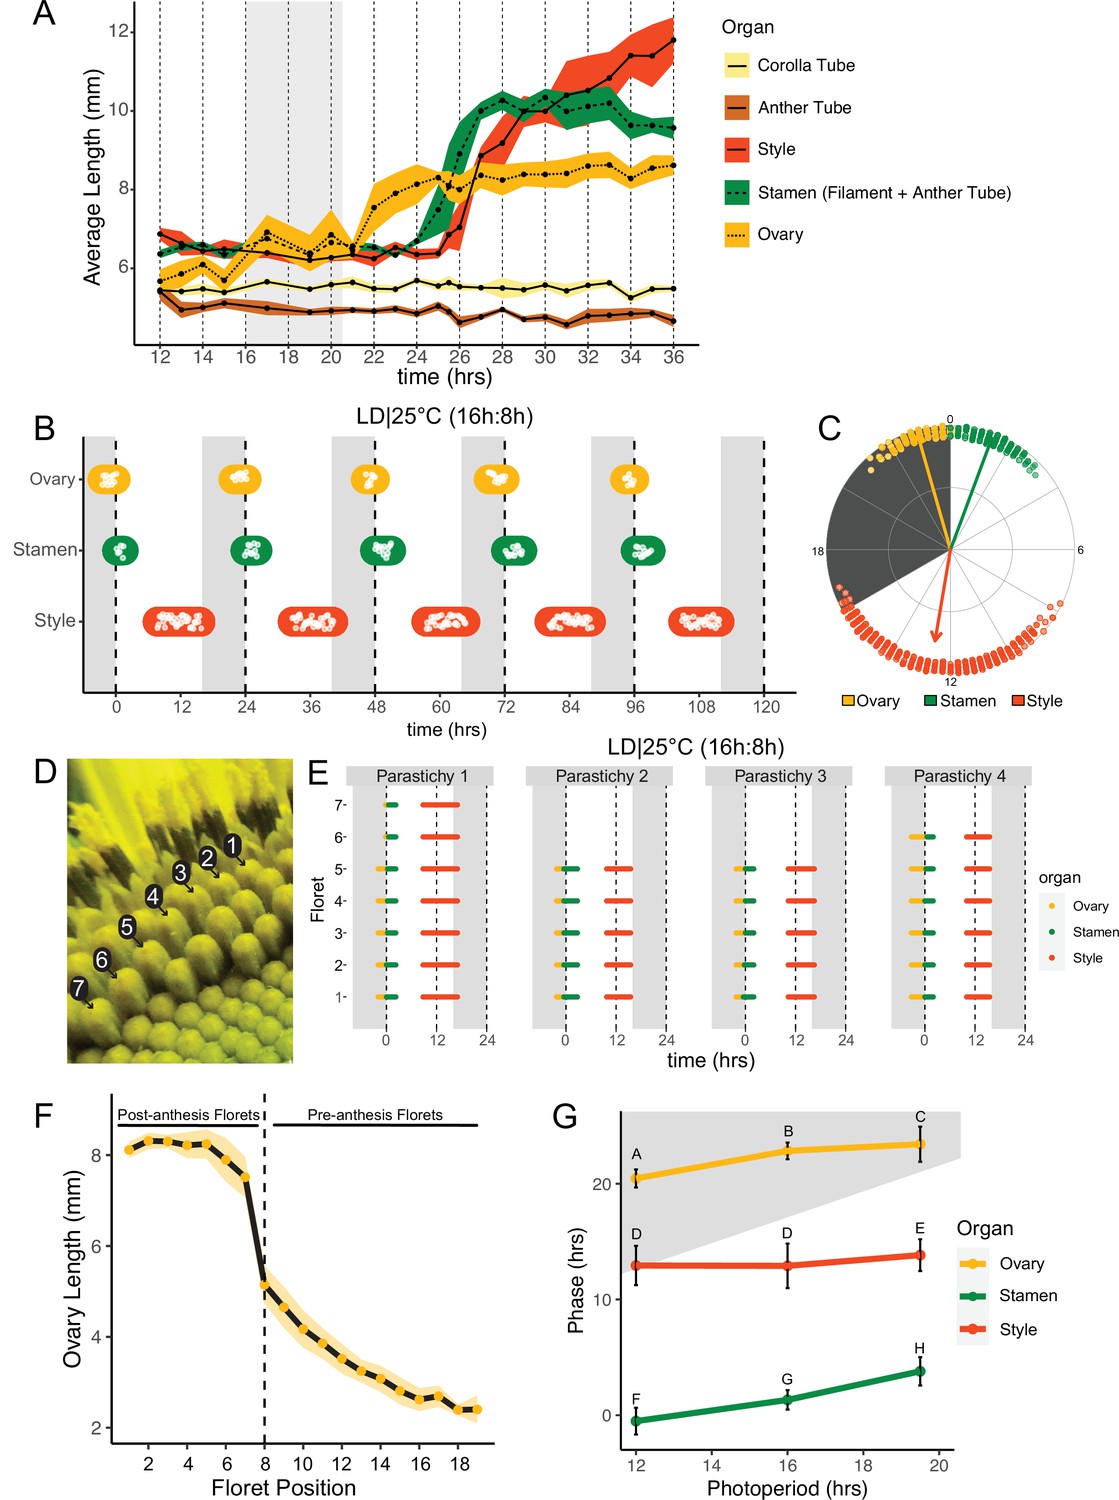
Pseudowhorls are due to coordinated daily rhythms in floret anthesis.
(A) Growth kinetics of floral organs in a single pseudowhorl for plants grown in LD|25°C with dark from ZT 16–20.5. Corolla tube, anther tube, style+stigma, stamen (filament+anther tube), and ovary were measured. Black dots represent average lengths and ribbons represent standard deviation (n=7–15 florets per time point; n=1 biological replicate). (B) Timing of ovary, stamen, and style growth for florets on a capitulum in LD|25°C (16 hr:8 hr). Each white point represents time when organs of >5% of florets per pseudowhorl elongated (n=3 capitula); colored ovals group growth of organs within a pseudowhorl and are for ease of viewing rather than to convey statistical information. (C) The timing of active organ growth for pseudowhorls as seen in (B), superimposed on a 24 hr circular clock (n=3 capitula). Dots represent individual observations, arrow directions represent average phases, and arrow lengths represent precision of timing. (D) Numbered florets within a single parastichy. (E) Timing of active growth for all florets along a parastichy within pseudowhorl 2; plants grown in LD|25°C (16 hr:8 hr) (n=4 parastichies). (F) Lengths of ovaries along a parastichy at ZT 2; plants grown in LD|25°C (16 hr:8 hr). Position 8 represents the first floret in the next pseudowhorl (n=4 parastichies). Yellow dots indicate means and the ribbon represents standard deviation. (G) The average phases of active growth for ovaries, stamens, and styles in LD|25°C with dark from either ZT 12-24 (left), ZT 16-24 (middle), or ZT 16-20.5 (right); (n = 3-4 capitula). Error bars are standard deviation. Different letters indicate statistically significant differences in mean phases by one-way ANOVA with post-hoc Tukey HSD test (P < 0.001). For all graphs the period of dark exposure is shown with grey background.
Figure 2—figure supplement 1
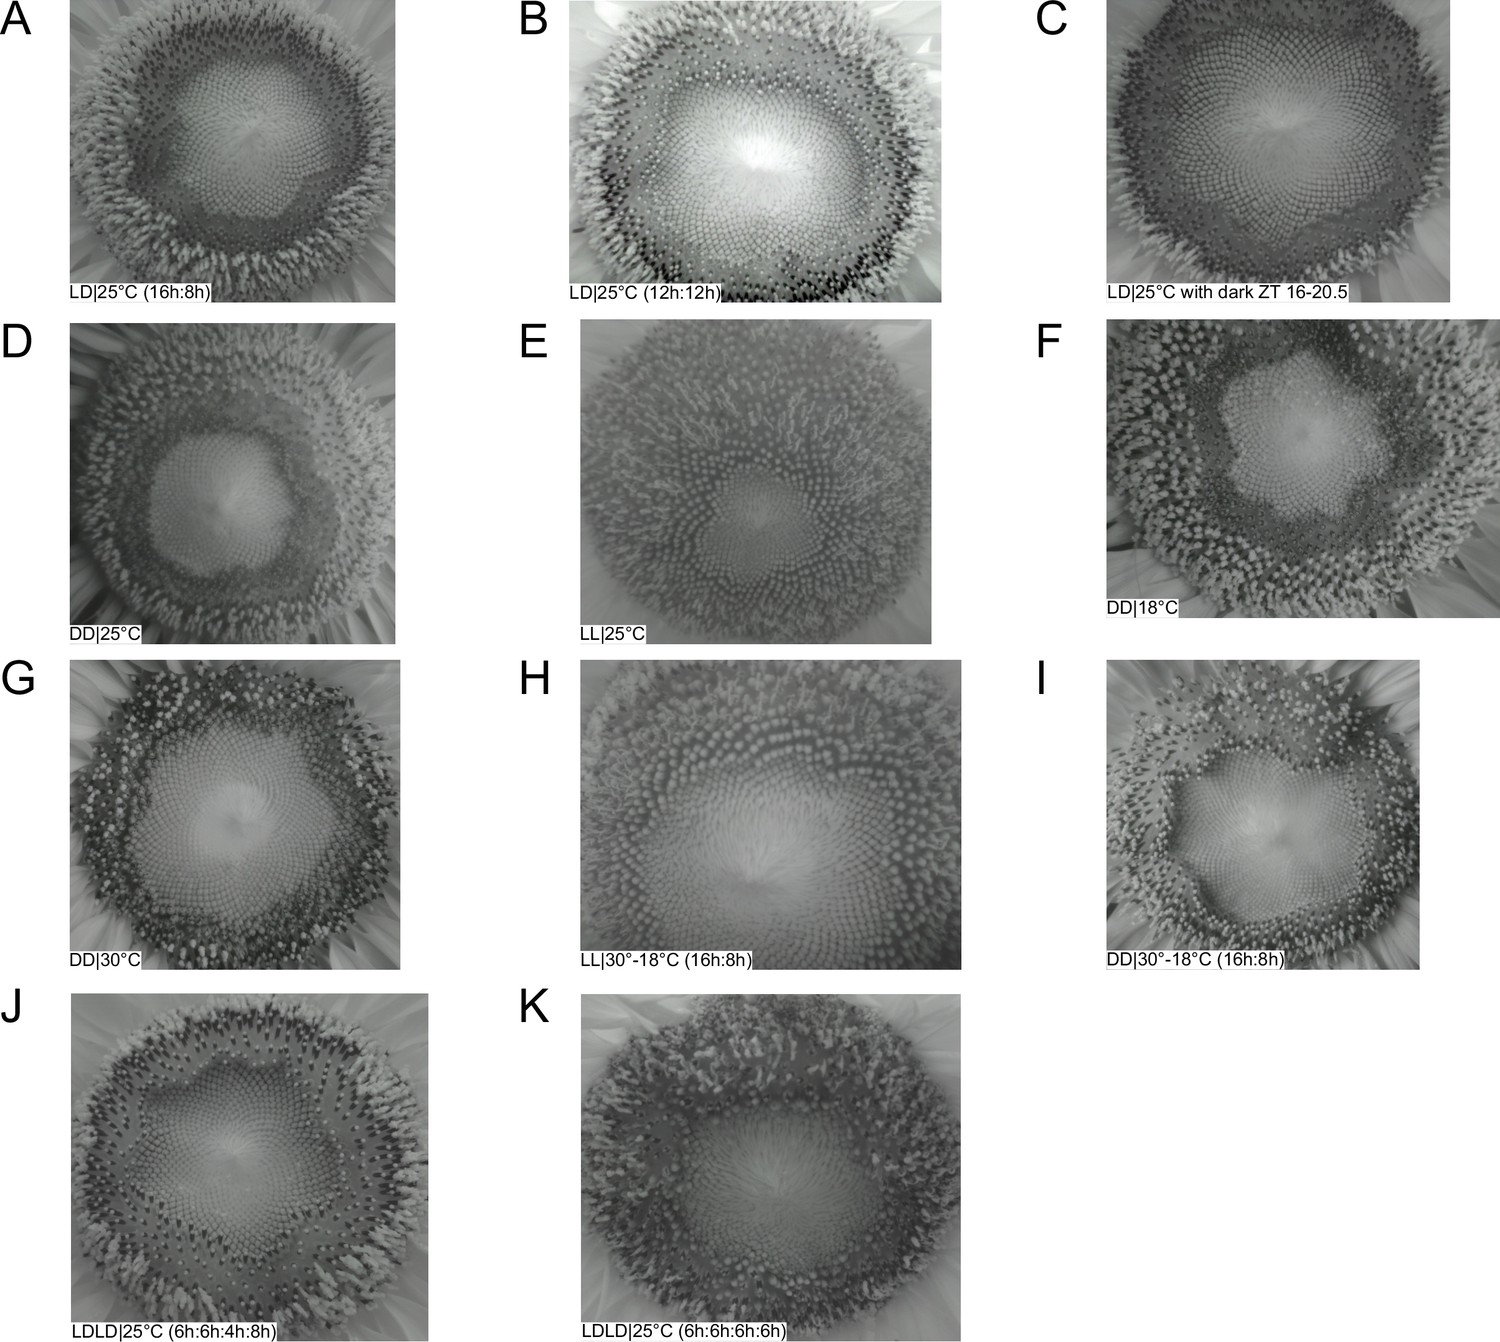
Sunflower capitulum development in various environmental conditions.
Images of sunflower capitula grown in (A) LD|25°C (16 hr:8 hr), (B) LD|25°C (12 hr:12 hr), (C) LD|25°C with dark ZT 16–20.5, (D) DD|25°C, (E) LL|25°C, (F) DD|18°C, (G) DD|30°C, (H) LL|30–18°C (16 hr:8 hr), (I) DD|30–18°C, (J) LDLD|25°C (6 hr:6 hr:4 hr:8 hr), and (K) LDLD|25°C (6 hr:6 hr:6 hr:6 hr). All images were taken 2 hr after subjective dawn relative to their entrainment conditions of LD|25°C (16 hr:8 hr), but at various numbers of days after transfer to the new environmental conditions.
Figure 2—figure supplement 2
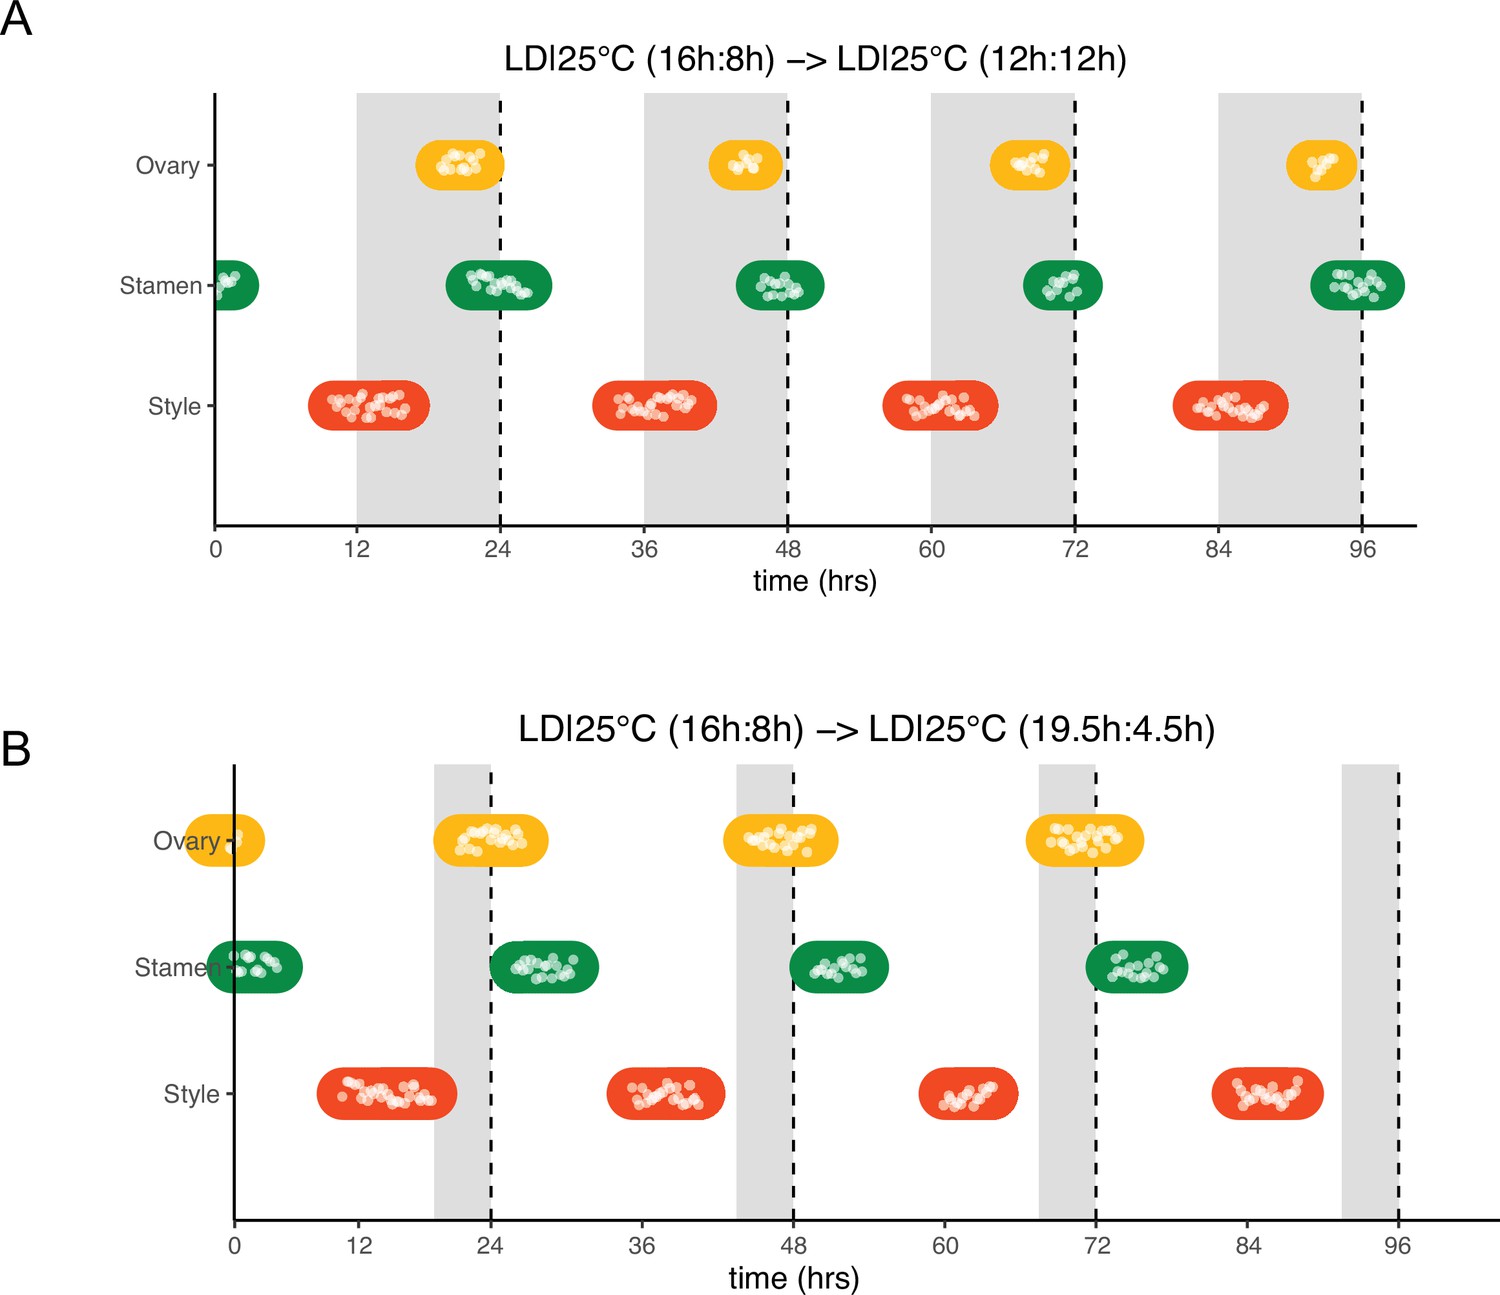
Sunflower anthesis is rhythmic in different photoperiodic conditions.
(A, B) Timing of ovary, stamen, and style growth for florets on a capitulum in (A) LD|25°C (12 hr:12 hr) and (B) LD|25°C (19.5 hr:4.5 hr), representing growth for >5% of florets in a pseudowhorl (n=4 capitula for each condition). Plants were grown in LD|25°C (16 hr:8 hr) and then transferred to the indicated photoperiods at time 0. White dots are individual observations of growth, and colored bars group growth for organs within a pseudowhorl. Periods of dark exposure are shown with gray boxes. Panel B has suffered a formatting problem - see overlap between labels and colored ovals on left side of panel. Can you please replace this figure with the original submitted image? I can provide it again if needed.
Figure 3 with 2 supplements
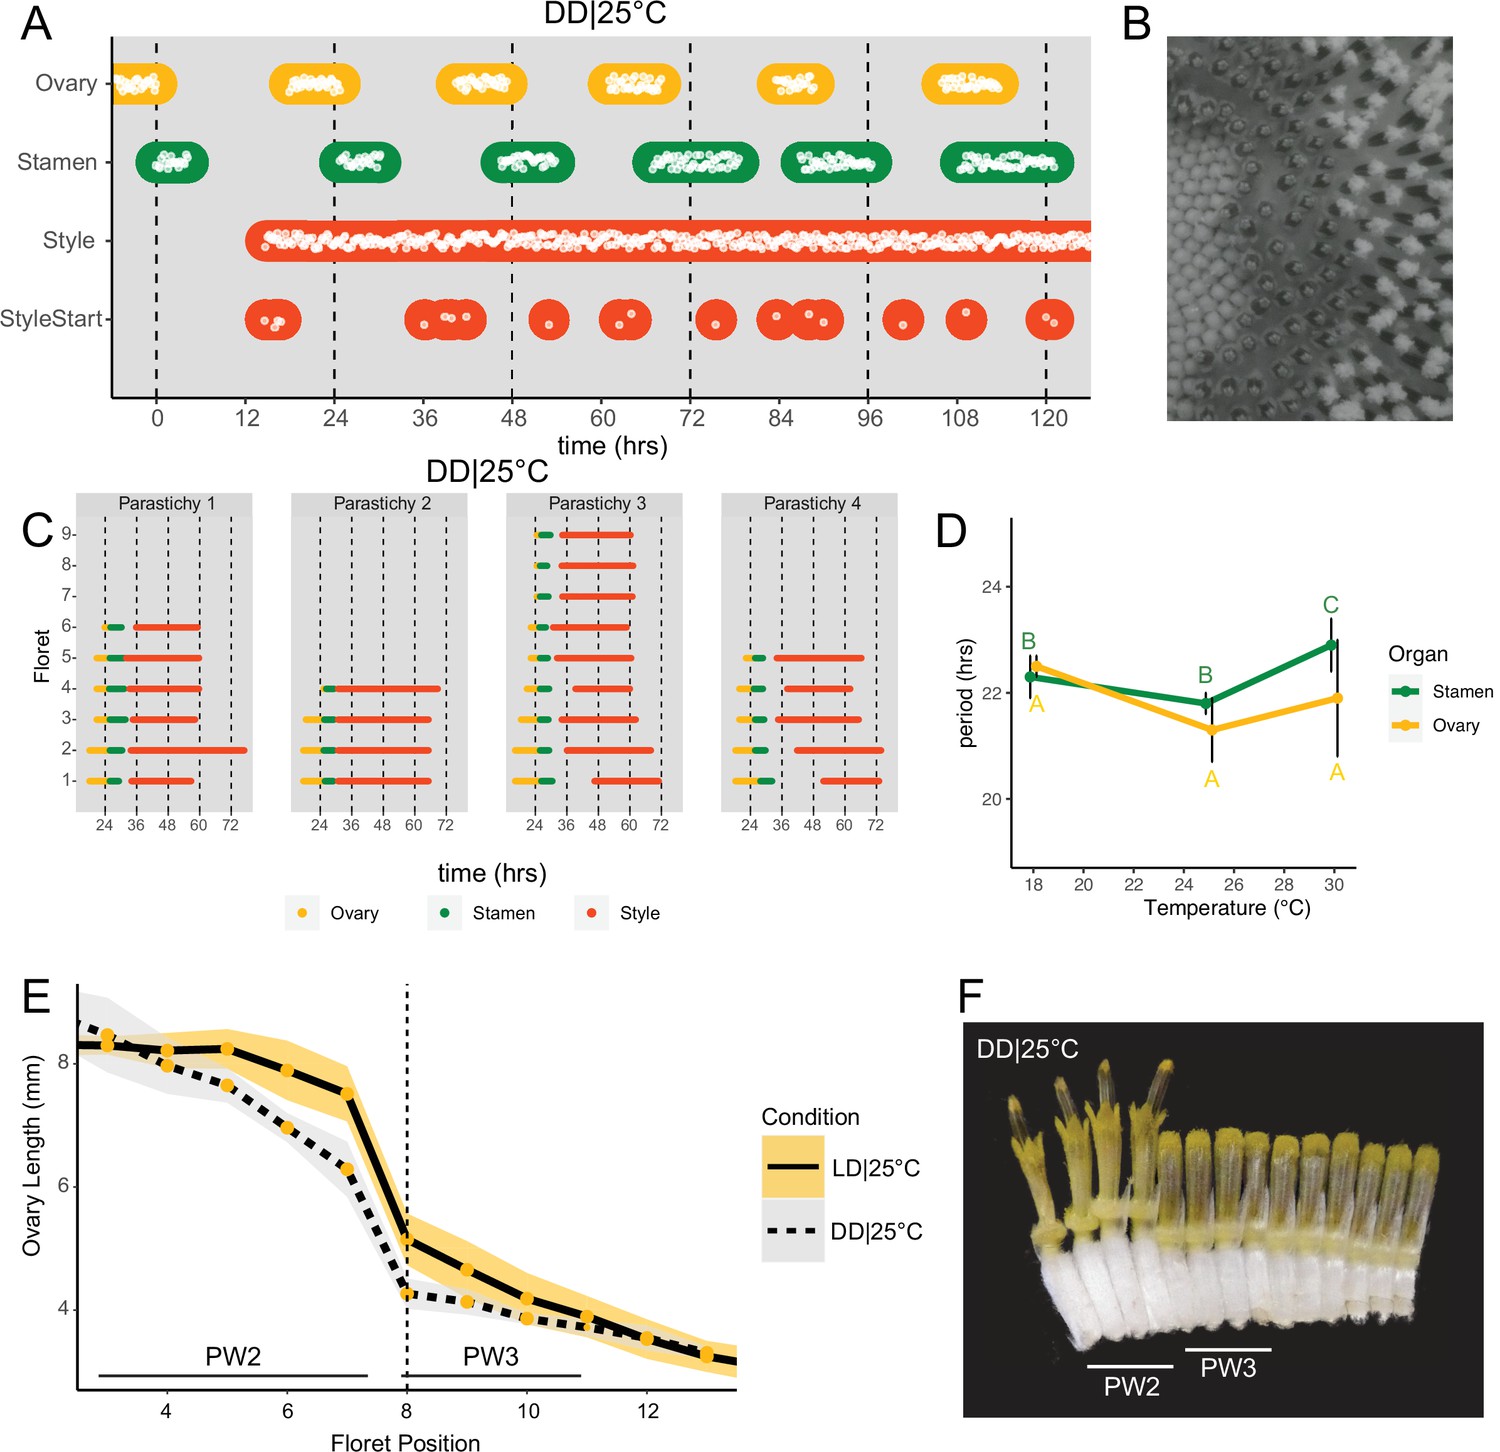
Daily rhythms in floret anthesis are regulated by the circadian clock.
(A) Timing of ovary, stamen, style, and start-of-style growth for florets in DD|25°C (n=4 capitula). (B) Sunflower capitulum in DD|25°C at zeitgeber time (ZT) 50, showing coordinated floret anthesis. (C) Timing of active growth for all florets per parastichy within pseudowhorl 2; DD|25°C (n=4 parastichies). (D) Average periods (hr) of rhythmic ovary and stamen growth in DD|18°C (n=3), DD|25°C (n=4), or DD|30°C (n=3 capitula). Error bars represent standard deviation. Different letters indicate statistically significant differences by one-way ANOVA with post hoc Tukey HSD test (p<0.001), with yellow letters for differences within ovaries and green letters for differences within stamens. Periods of stamen and ovary growth are not statistically different within any temperature treatment. (E) Lengths of ovaries along a parastichy for sunflowers grown in either LD|25°C (16 hr:8 hr) (n=4 parastichies) or DD|25°C (n=8 parastichies) at ZT 26, with position 8 the first ovary in the next pseudowhorl. Yellow dots indicate means and the ribbons standard deviation. (F) A cross-section of a capitulum grown in DD|25°C; florets and ovaries along a single parastichy that belong to two different pseudowhorls. Photograph taken at ZT 26. Plots are as described for Figure 2.
Figure 3—figure supplement 1
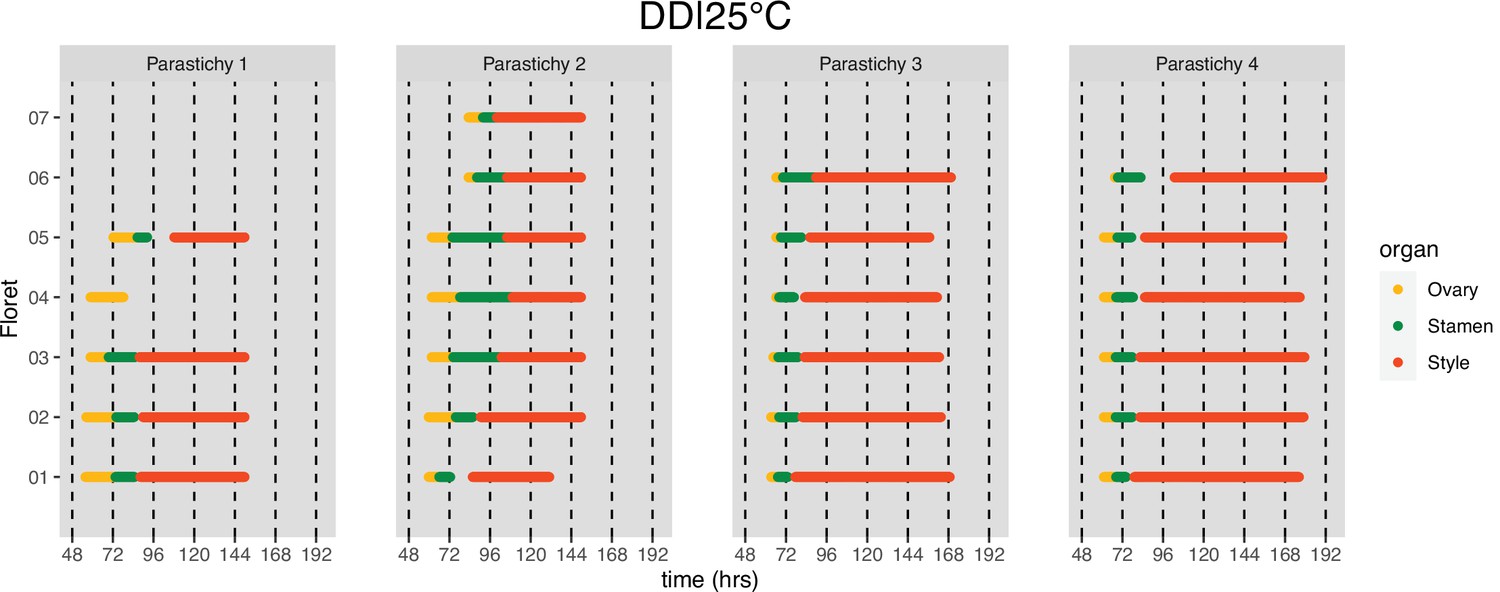
Pseudowhorl coordination persists for multiple days in constant dark free-running conditions.
Timing of active growth for all florets along parastichies within pseudowhorl 4 of sunflowers after transfer to DD|25°C (n=4 parastichies).
Figure 3—figure supplement 2
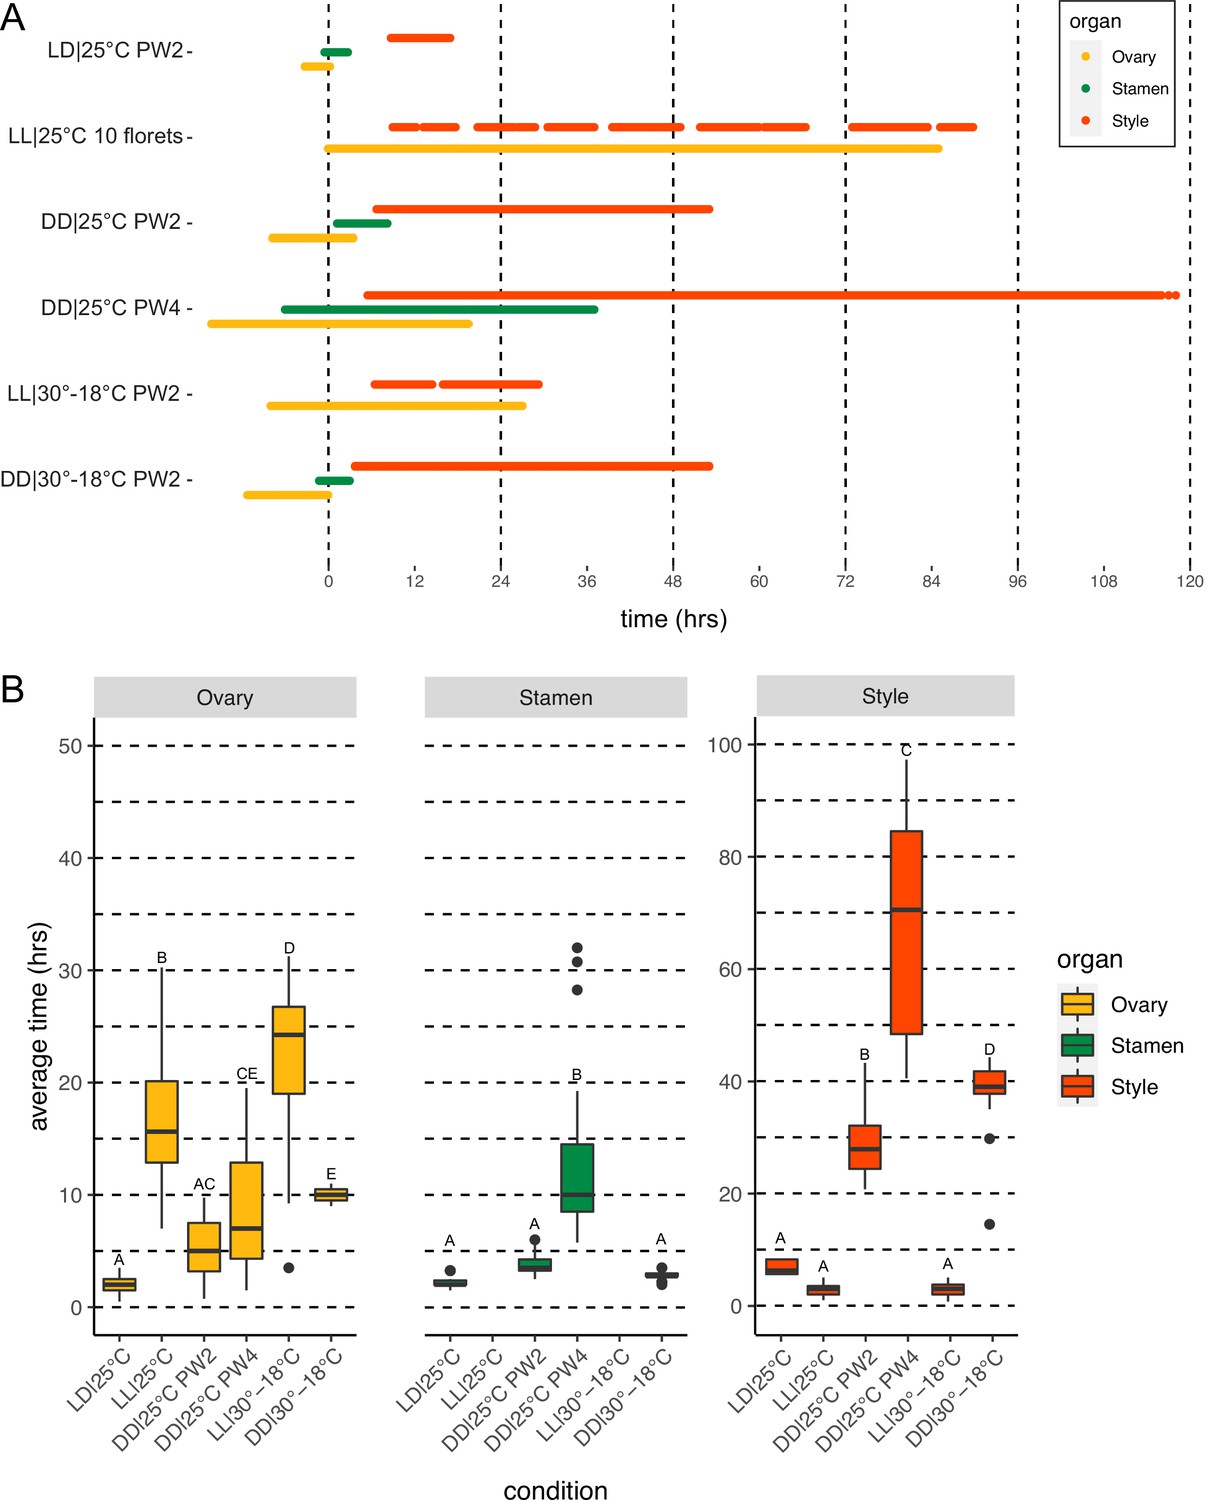
Rates of floral organ maturation are dependent on environmental conditions.
(A) Total time for florets within the indicated pseudowhorls to complete anthesis, compiled from the individual floret timing for: LD|25°C (16 hr:8 hr) (Figure 2E); LL|25°C (Figure 6B); DD|25°C PW2 (Figure 3C); DD|25°C PW4 (Figure 3—figure supplement 1); LL|30–18°C (16 hr:8 hr) (Figure 6D); and DD|30–18°C (16 hr:8 hr) (Figure 6—figure supplement 2B). (B) Average time required for completion of maturation of individual florets, calculated from above data. Florets were selected from the same pseudowhorl (except in LL|25°C). Error bars indicate standard deviation. Different letters indicate statistically significant differences by one-way ANOVA with post hoc Tukey HSD test (p<0.001).
Figure 4 with 2 supplements
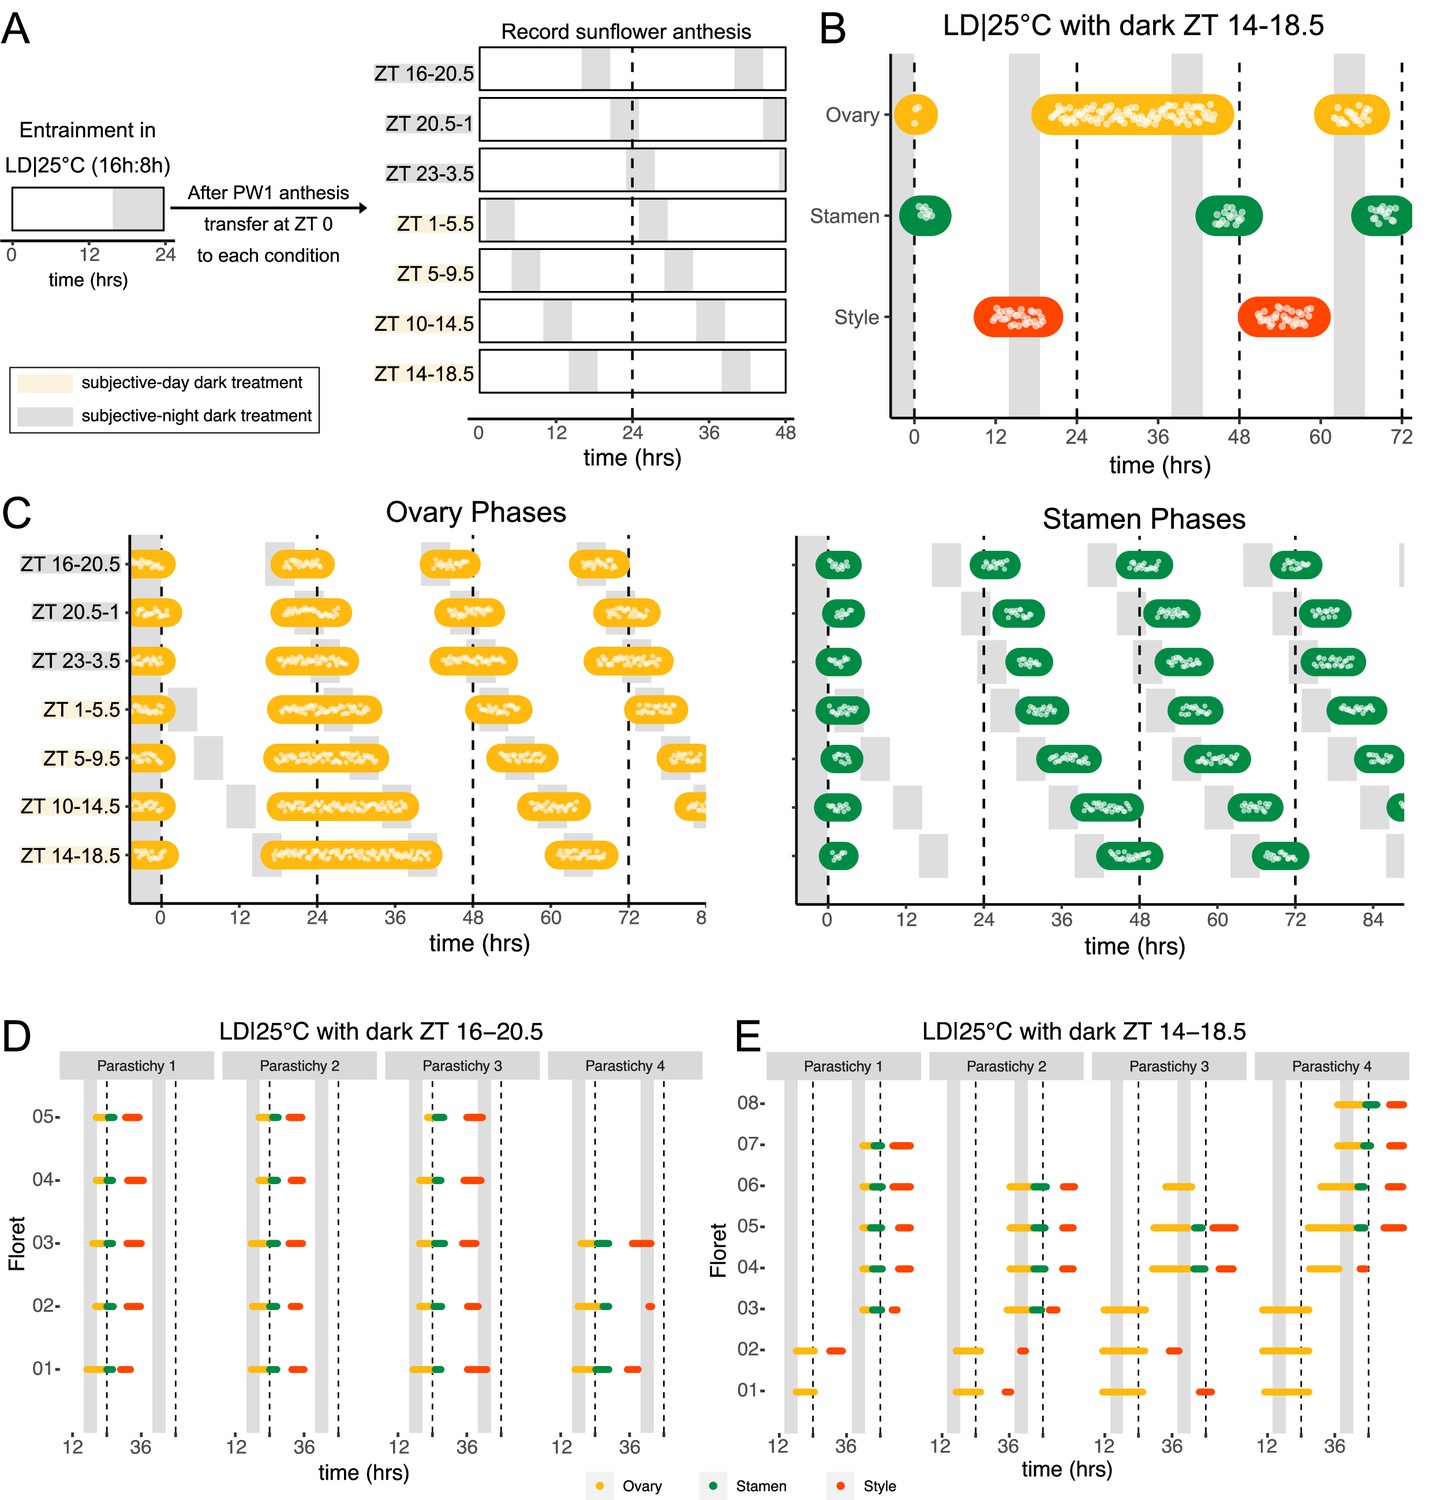
Normal rhythms of anthesis are maintained with darkness during the subjective night but not during the subjective day.
(A) Schematic representation of experiment. All plants were maintained at 25°C with 4.5 hr of darkness provided at the times indicated with gray boxes. (B) Timing of ovary, stamen, and style growth with dark during zeitgeber time (ZT) 14–18.5 (n=4 capitula). (C) Timing of ovary (left) and stamen (right) growth with darkness provided during the indicated times (n=3–4 capitula per condition). (D, E) Timing of active growth for all florets along a parastichy within pseudowhorl 2 of sunflowers with dark during (D) ZT 16–20.5 or (E) ZT 14–18.5 (n=4 parastichies for each condition). Plots are as described for Figure 2.
Figure 4—figure supplement 1
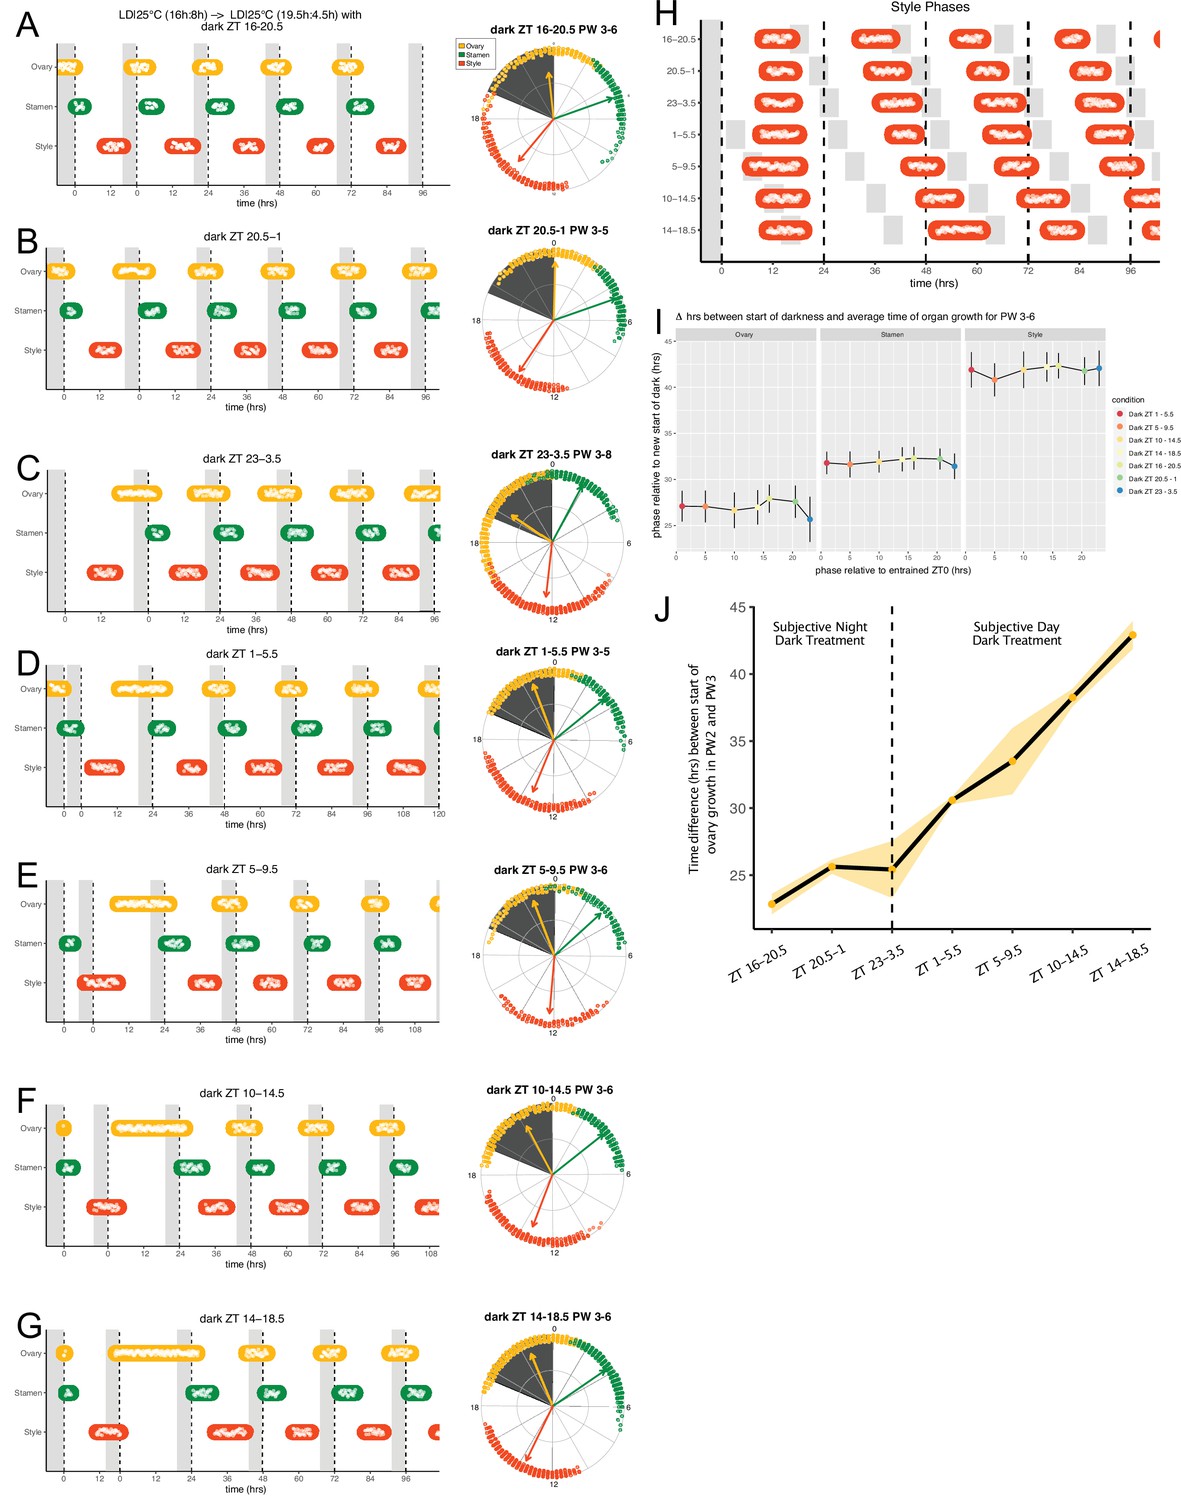
Phase of organ growth resets rapidly to new entrainment conditions.
Plants were transitioned from LD|25°C (16 hr:8 hr) to 19.5 hr light:4.5 hr dark at various times of the subjective day or night. New times of dark onset are indicated with gray boxes and labeled relative to the original entrainment condition. (A–G) Left plots are as described for Figure 2—figure supplement 1. On the right plots, the timing of active organ growth for pseudowhorls 3 and later are superimposed on a 24 hr circular clock. Dots represent individual observations of growth, arrow angles represent average phases of growth, and arrow lengths represent precision of timing (n=3–4 capitula for each condition). (H) Timing of active style growth in LD|25°C with the new short night at the indicated times (relative to the original entrainment condition; n=3–4 capitula per condition). (I) Average times of growth for ovaries, stamens, and styles in pseudowhorls (PW) 3–6 for all indicated conditions. x-Axis indicates phase of start-of-darkness for each condition relative to the original entrainment conditions. y-Axis indicates phase of average organ growth relative to the start of the 4.5 hr dark treatment in the new entrainment conditions. Error bars indicate standard deviation. (J) Average difference in hours from the start of pseudowhorl 2 ovary growth and the start of pseudowhorl 3 ovary growth (y-axis) for each dark treatment condition (x-axis). Yellow dots represent mean differences, and the yellow ribbon represents standard deviation. Dotted line separates dark treatments given during the subjective night and the subjective day.
Figure 4—figure supplement 2
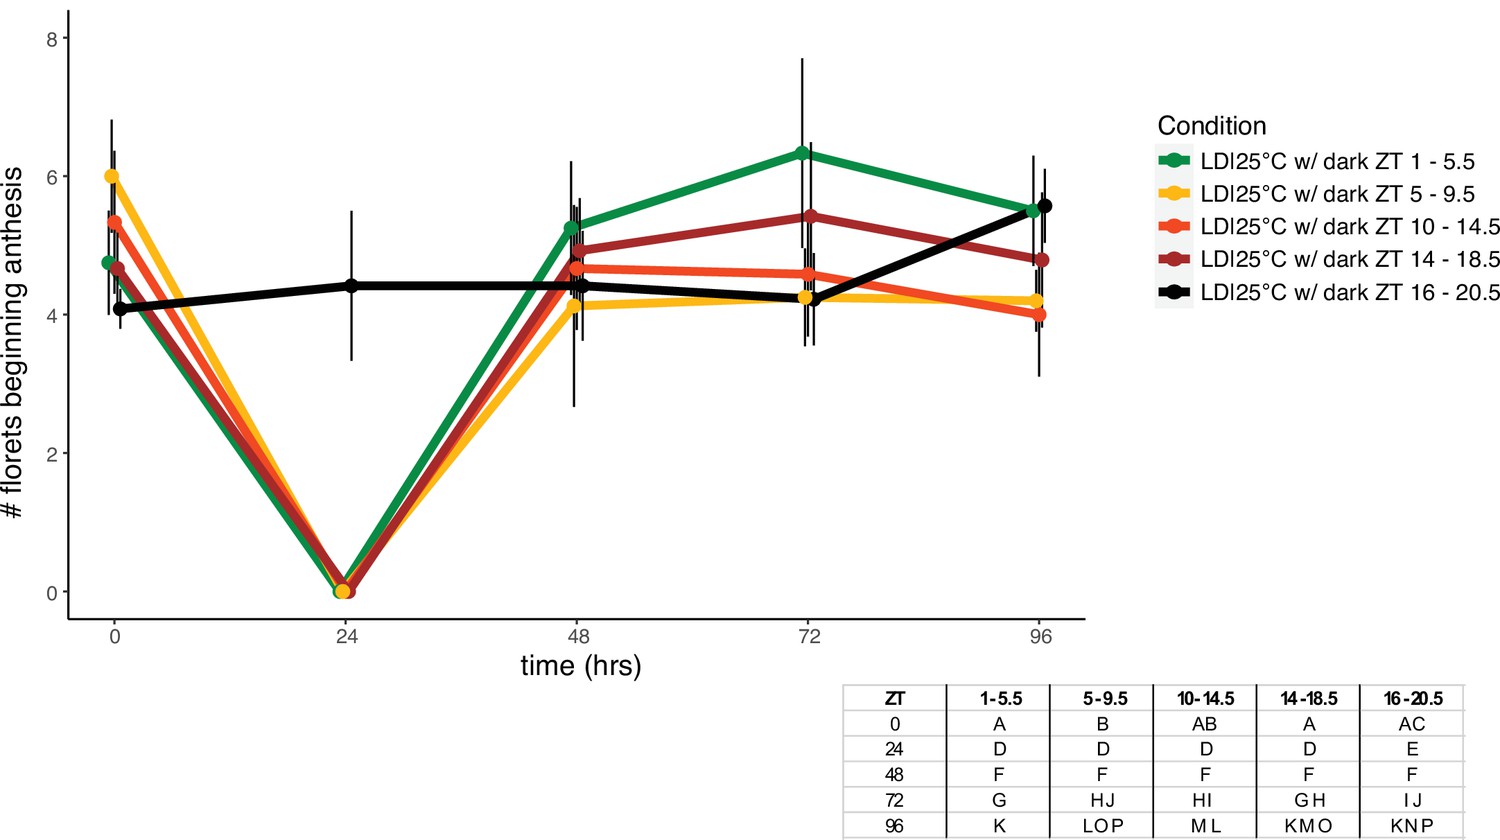
Number of florets in a pseudowhorl not altered after delay in anthesis.
Average number of florets beginning anthesis along a parastichy and within a pseudowhorl for the indicated conditions (n=12–19 parastichies per condition). At zeitgeber time (ZT) 24, only condition LD|25°C with dark during ZT 16–20.5 had a new pseudowhorl undergoing anthesis. Error bars represent standard deviation. Different letters in table indicate statistically significant different groups within a time point, one-way ANOVA with post hoc Tukey HSD test (p<0.001).
Figure 5 with 2 supplements
Frequency demultiplication of sunflower anthesis rhythms.
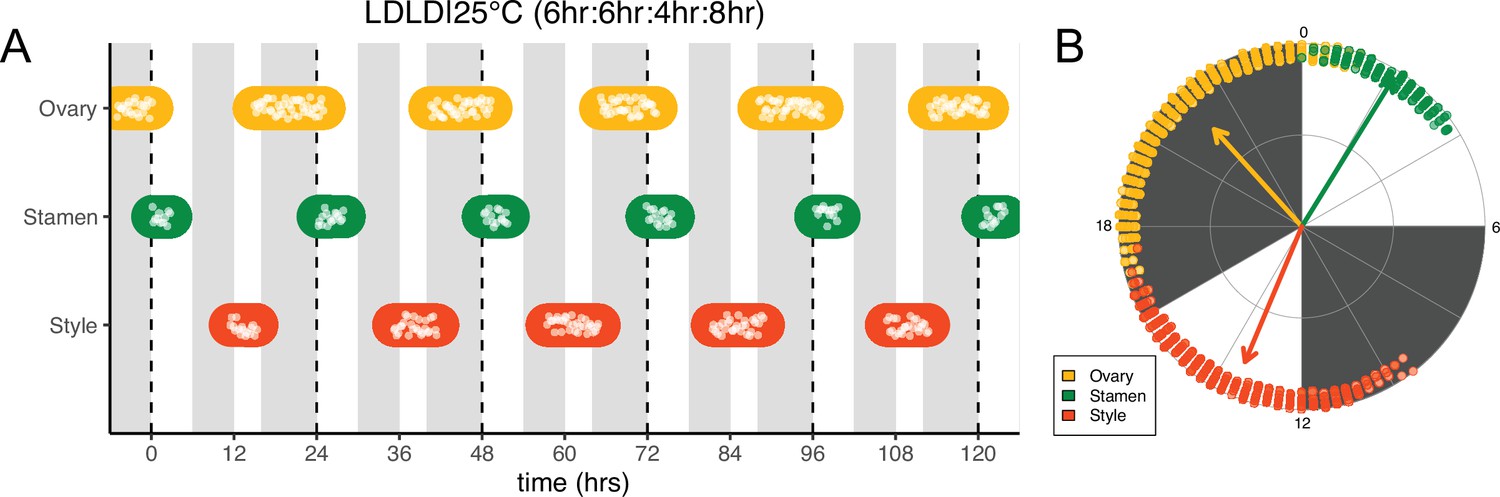
(A) Timing of ovary, stamen, and style growth for florets on a capitulum with two cycles of light and dark each day, namely 6 hr L, 6 hr D, 4 hr L, 8 hr D (n=3 capitula). (B) The timing of active organ growth for pseudowhorls as seen in (A), superimposed on a 24 hr circular clock (n=3 capitula). Plots are as described for Figure 2.
Figure 5—figure supplement 1
Frequency demultiplication in anthesis requires a dominant night.
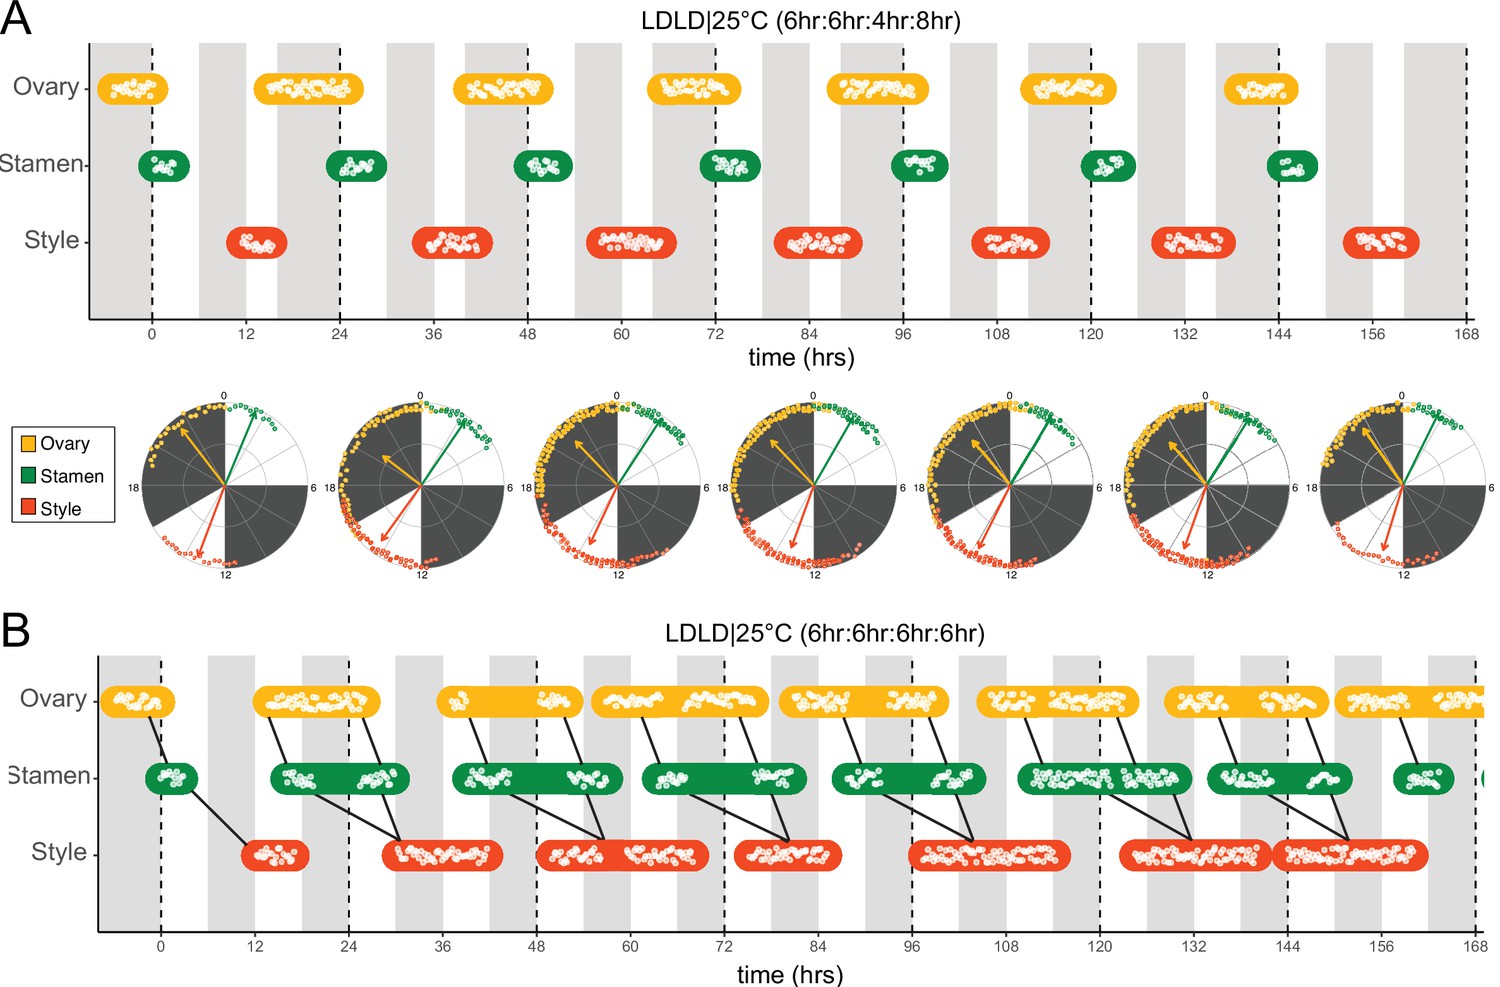
Timing of ovary, stamen, and style growth for florets on a capitulum with two cycles of light and dark each day. (A) When one dark period is longer than the other (LDLD|25°C [6 hr L:6 hr D:4 hr L:8 hr D]), floret development only responds to the longer dark period. Individual polar plots are shown for each successive pseudowhorl. (B) When the two dark periods are of equal length (LDLD|25°C [6 hr L:6 hr D:6 hr L:6 hr D]), development is uncoordinated, with two distinct phases of growth within each pseudowhorl (n=3 capitula per condition). See text for further description. Black lines link together floret organs within one pseudowhorl. Plots are otherwise as described for Figure 2—figure supplement 1.
Figure 5—figure supplement 2
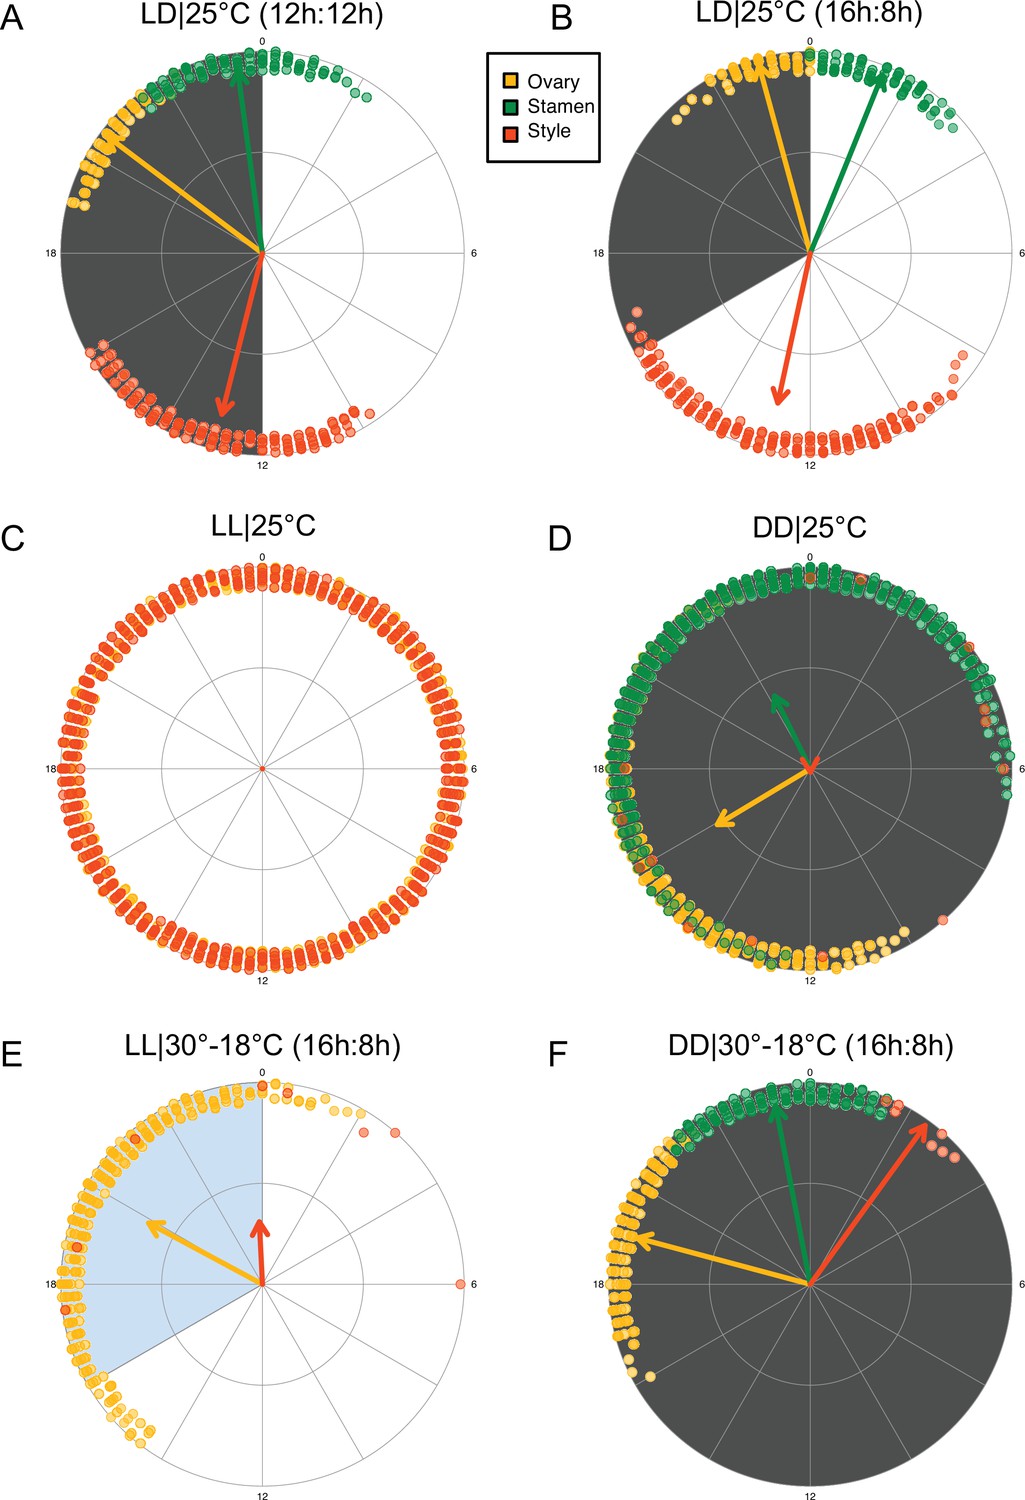
Relative phases of floret development in different environmental conditions.
Phases after 48 hr in new entrainment conditions are depicted for organ growth in pseudowhorls 3–6 for conditions (A) LD|25°C (12 hr:12 hr), (B) LD|25°C (16 hr:8 hr), (C) LL|25°C, (D) DD|25°C, (E) LL|30–18°C (16 hr:8 hr), and (F) DD|30–18°C (n=3–4 capitula per condition). Polar plots are as described for Figure 4—figure supplement 1.
Figure 6 with 2 supplements
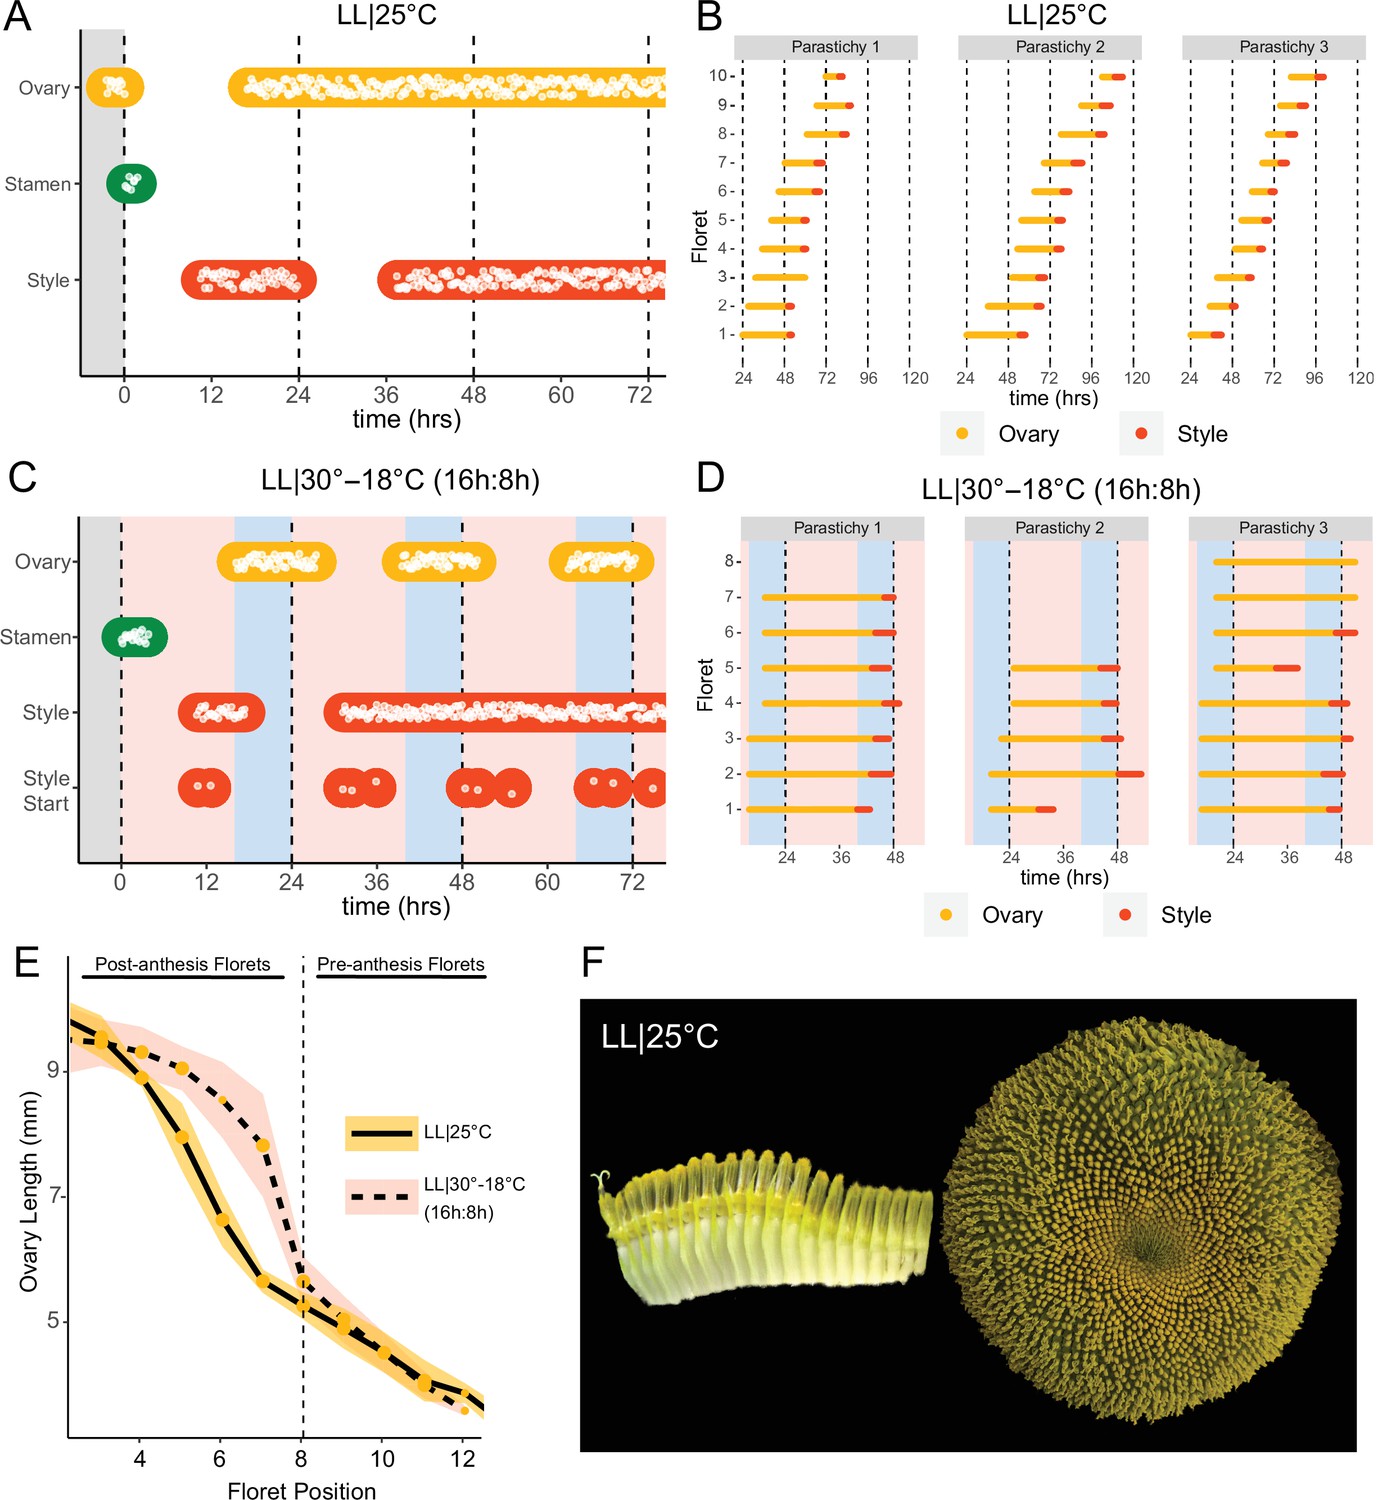
Constant light disrupts coordination of anthesis and pseudowhorl formation.
(A, C) Timing of ovary, stamen, and style growth for florets on a capitulum in (A) LL|25°C (n=3 capitula), and (C) LL|30–18°C (16 hr:8 hr) (n=3 capitula). (B, D) Timing of active growth 24 hr after transfer to (B) LL|25°C, 10 consecutive florets measured along each parastichy (n=3 parastichies), and (D) LL|30–18°C (16 hr:8 hr) for all florets per parastichy in pseudowhorl 2 (n=3 parastichies). (E) Lengths of ovaries along a parastichy for sunflowers grown in either LL|25°C (n=4 parastichies) or LL|30–18°C (16 hr:8 hr) (n=5 parastichies) at zeitgeber time (ZT) 26, with position 8 the first ovary in the next pseudowhorl. (F) Florets along a parastichy at ZT 26 and the comparable sunflower capitulum at ZT 120; plants grown in LL|25°C. Periods of constant light at 30°C (pink background), 25°C (white background), and 18°C (blue background) are indicated; plots are otherwise as described for Figure 2.
Figure 6—figure supplement 1
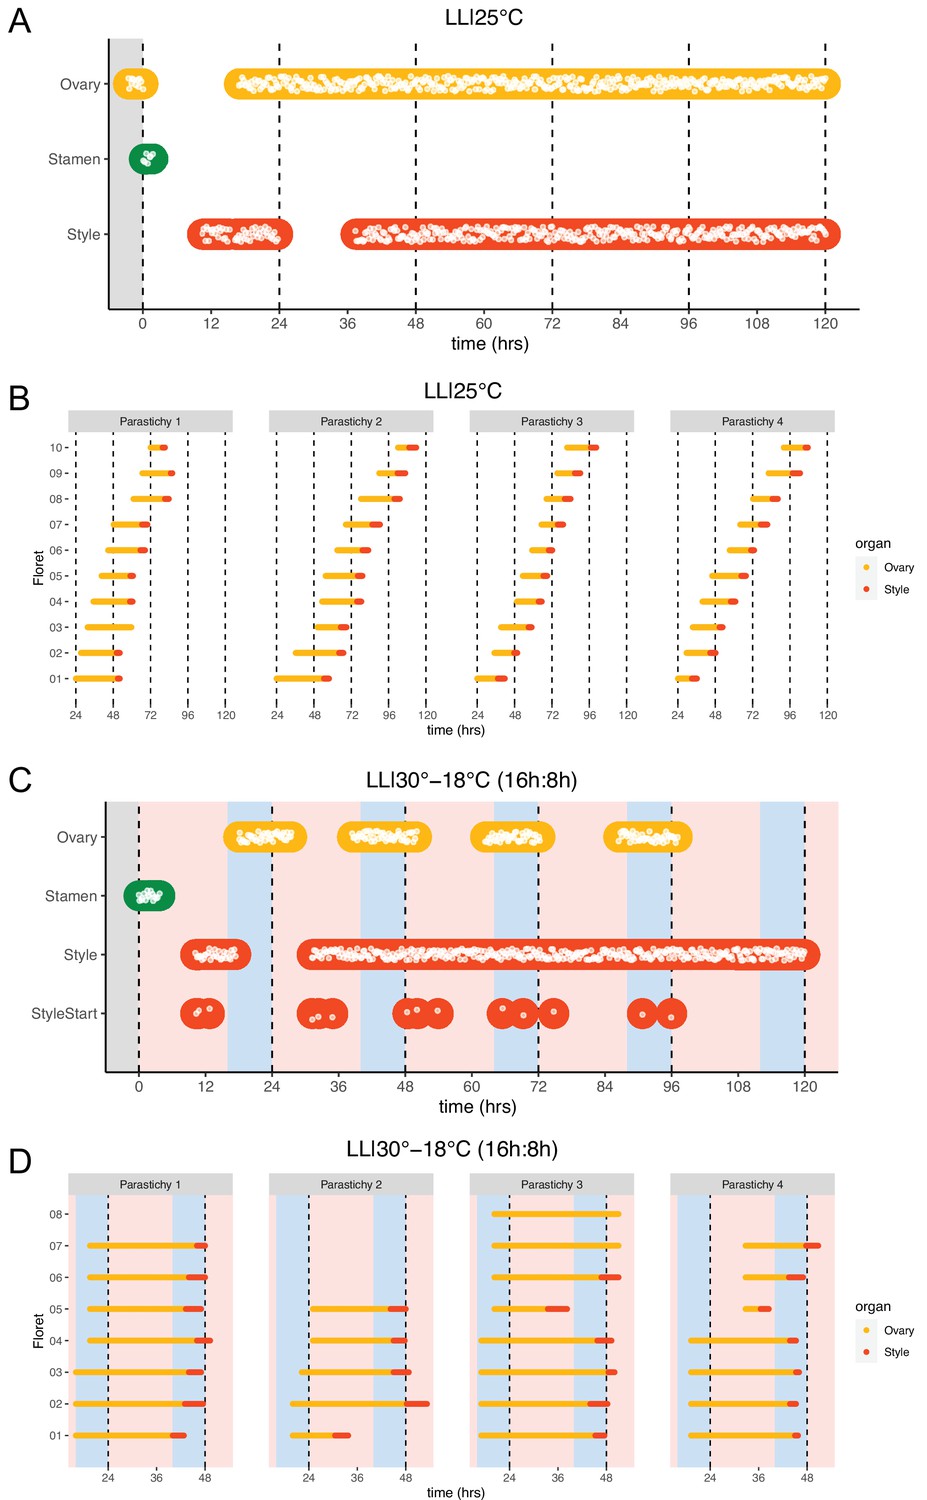
Sunflower anthesis is impaired in constant light.
(A, C) Timing of ovary, stamen, and style growth for florets on a capitulum (A) LL|25°C (n=3 capitula) and (C) LL|30–18°C (16 hr:8 hr) (n=3 capitula), representing growth for >5% of florets in a pseudowhorl (n=3). Plots are as described for Figure 2—figure supplement 1. (B, D) Timing of active growth of individual florets along a parastichy 24 hr after transfer to (B) LL|25°C for 10 florets per parastichy, and (D) LL|30–18°C (16 hr:8 hr) for all florets along a parastichy within pseudowhorl 2 (n=4 parastichies). Different temperatures are indicated by pink (30°C), white (25°C), and blue (18°C) backgrounds.
Figure 6—figure supplement 2
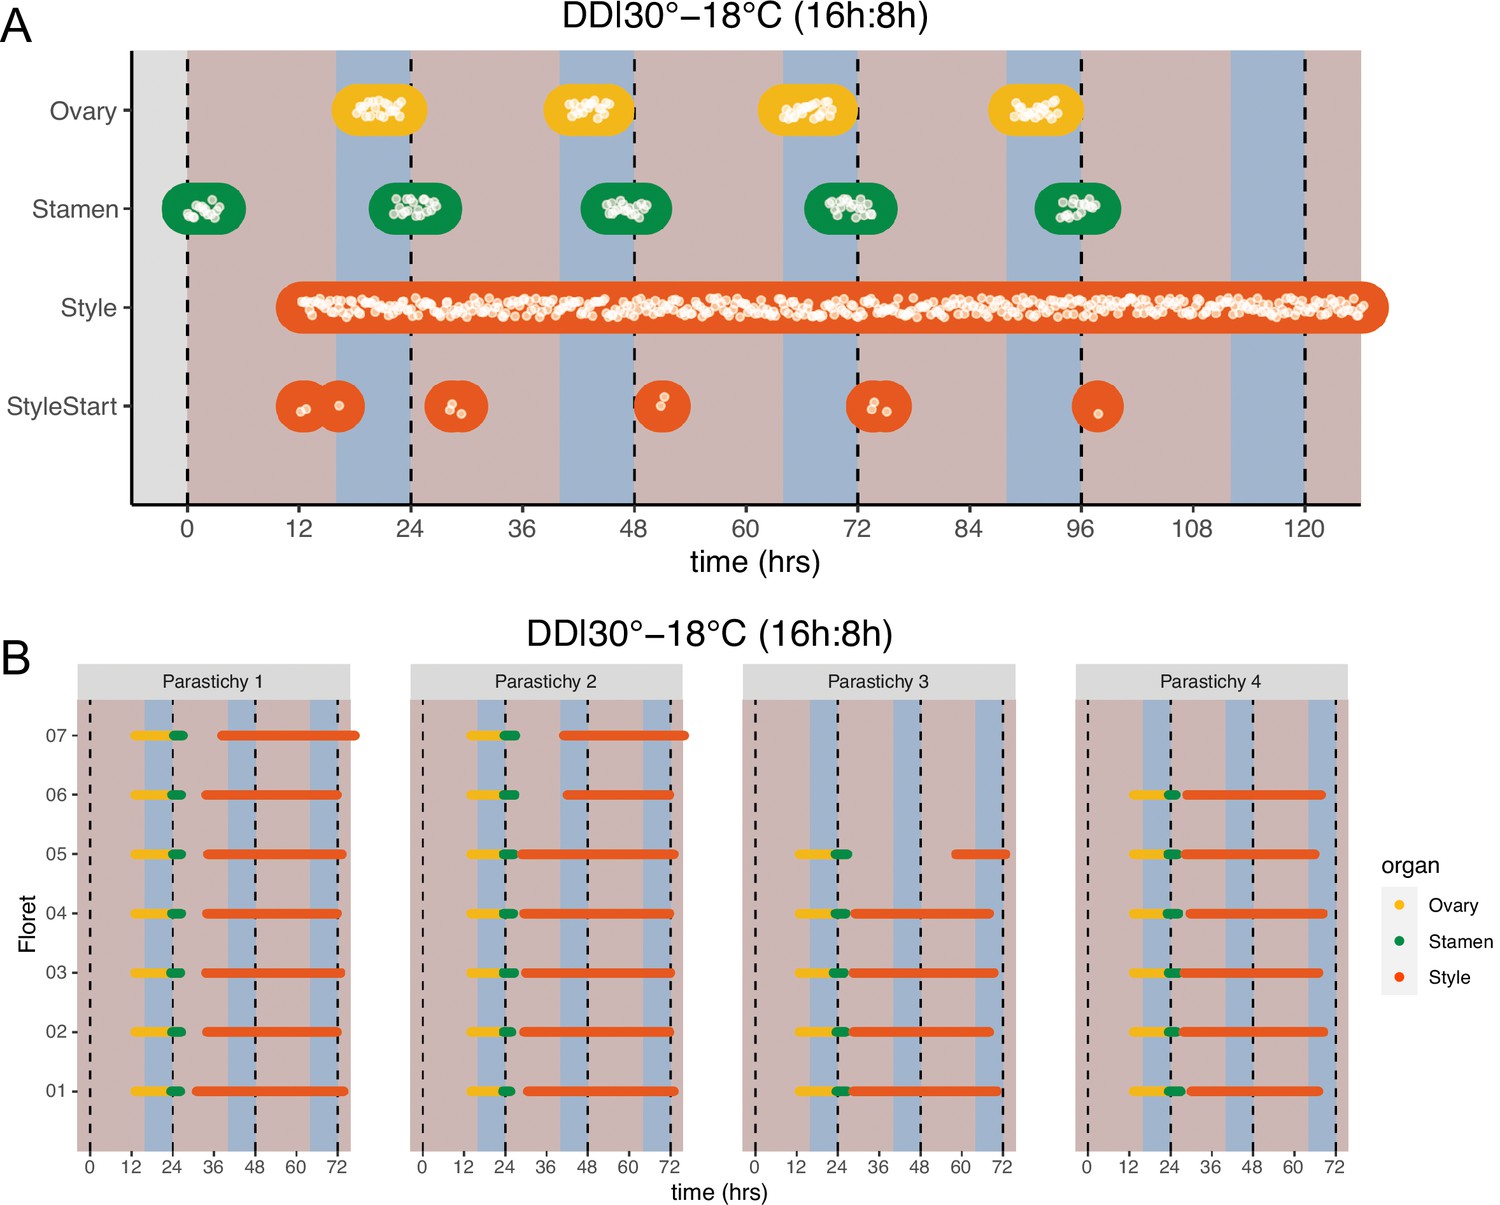
Thermocycles in constant dark strengthen coordination of rhythms of floret development.
(A) Timing of ovary, stamen, style, and start-of-style growth for florets on a capitulum in DD|30–18°C (16 hr:8 hr) (n=3 capitula). (B) Timing of active growth for all florets along a parastichy within pseudowhorl 2 after transfer to DD|30–18°C (16 hr:8 hr) (n=4 parastichies). Plots are as described for Figure 2—figure supplement 1.
Figure 7 with 1 supplement
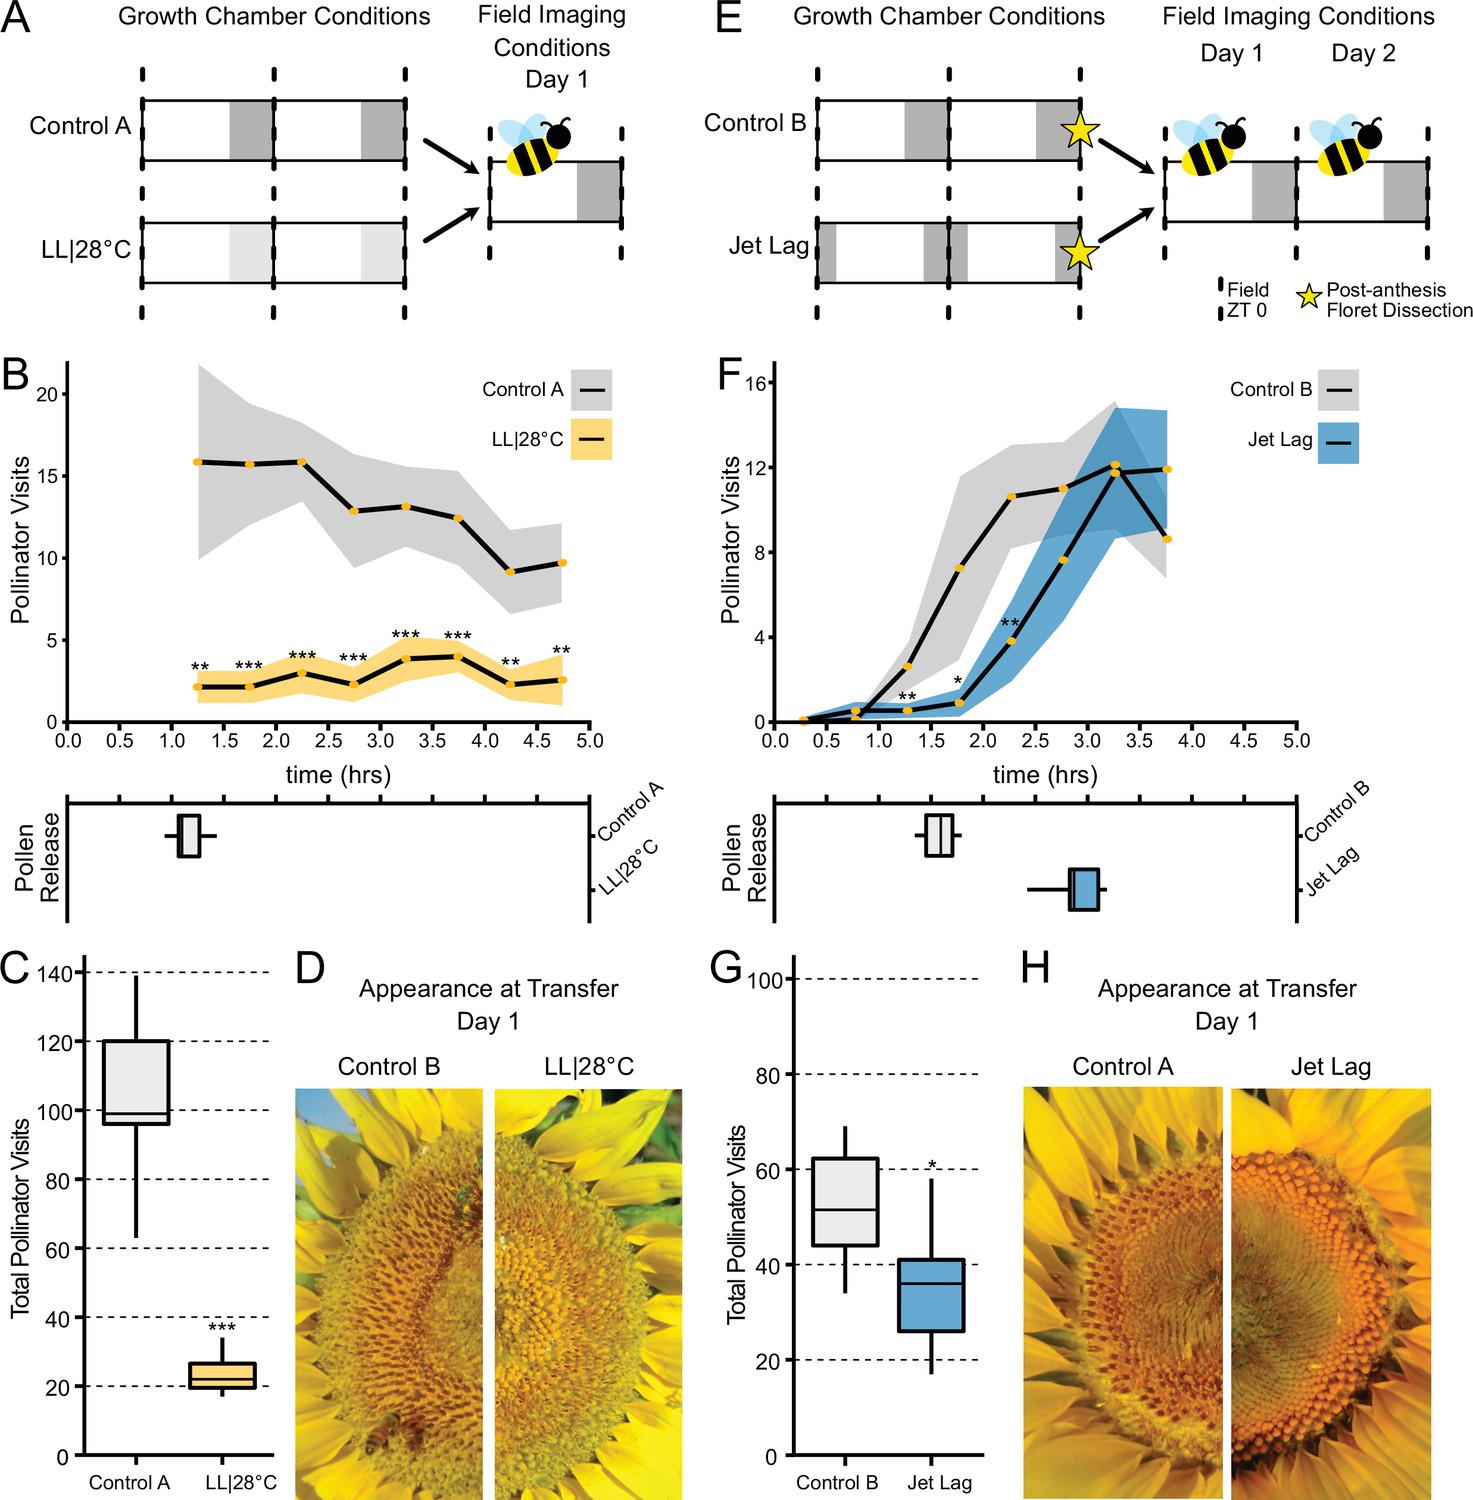
Effect of the circadian clock and discrete anthesis patterns on pollinator visits to sunflowers.
(A, E) Schematic representation of experiment. Dark gray boxes indicate timing of darkness, light gray boxes indicate subjective night. Arrows show time when plants were transitioned to the field and stars indicate dissections of post-anthesis (open) florets. Control plants were maintained in conditions consistent with the local environment in Davis, CA. (B, F) Timing of pollinator visits and pollen presentation. Pollinator visits per 30 min bin were quantified starting immediately upon transfer to the field. (B) Control A (n=7 capitula), LL|28°C (n=7 capitula). (F) Control B (n=8 capitula), jet lag (n=11 capitula). Yellow dots represent means, ribbons represent 95% confidence intervals, stars indicate statistically significant differences by one-way ANOVA test (***p<0.001, **p<0.01, *p<0.05). (C, G) Total pollinator visits over the period quantified in (B) and (F), respectively. (D, H) Representative sunflower capitula at the time of transfer to the field. (D) LL|28°C capitula do not exhibit coordination of the psuedowhorls or pollen release. (H) White ovaries are visible at the margins of the capitula after dissection of post-anthesis florets.
Figure 7—figure supplement 1
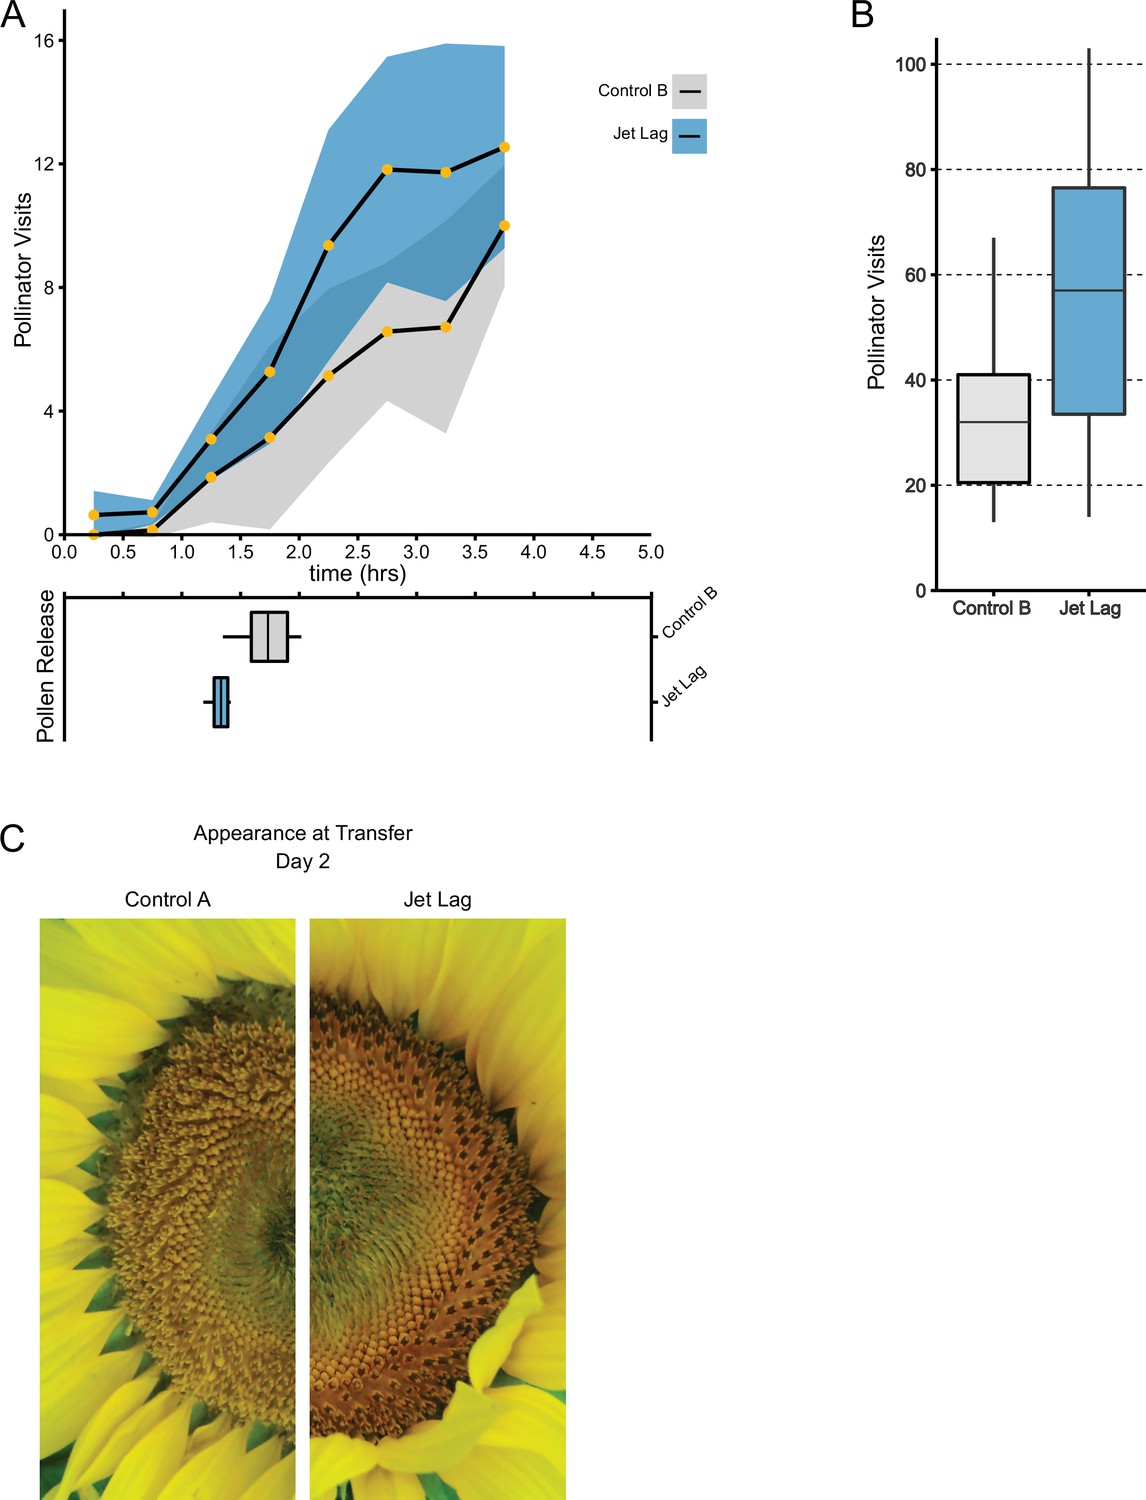
Pollinator day 2 data.
(A) Timing of pollinator visits and pollen presentation for Control B and jet lag capitula on the second day in the field. Pollinator visits per 30 min bin were quantified starting immediately upon transfer to the field. Control B (n=7 capitula), jet lag (n=11 capitula). Yellow dots represent means, ribbons represent 95% confidence intervals. Control and jet lag plants were not statistically different from each other (one-way ANOVA test; p>0.05). (B) Total pollinator visits over the period quantified in (A). (C) Representative sunflower capitula at dawn.
Figure 8
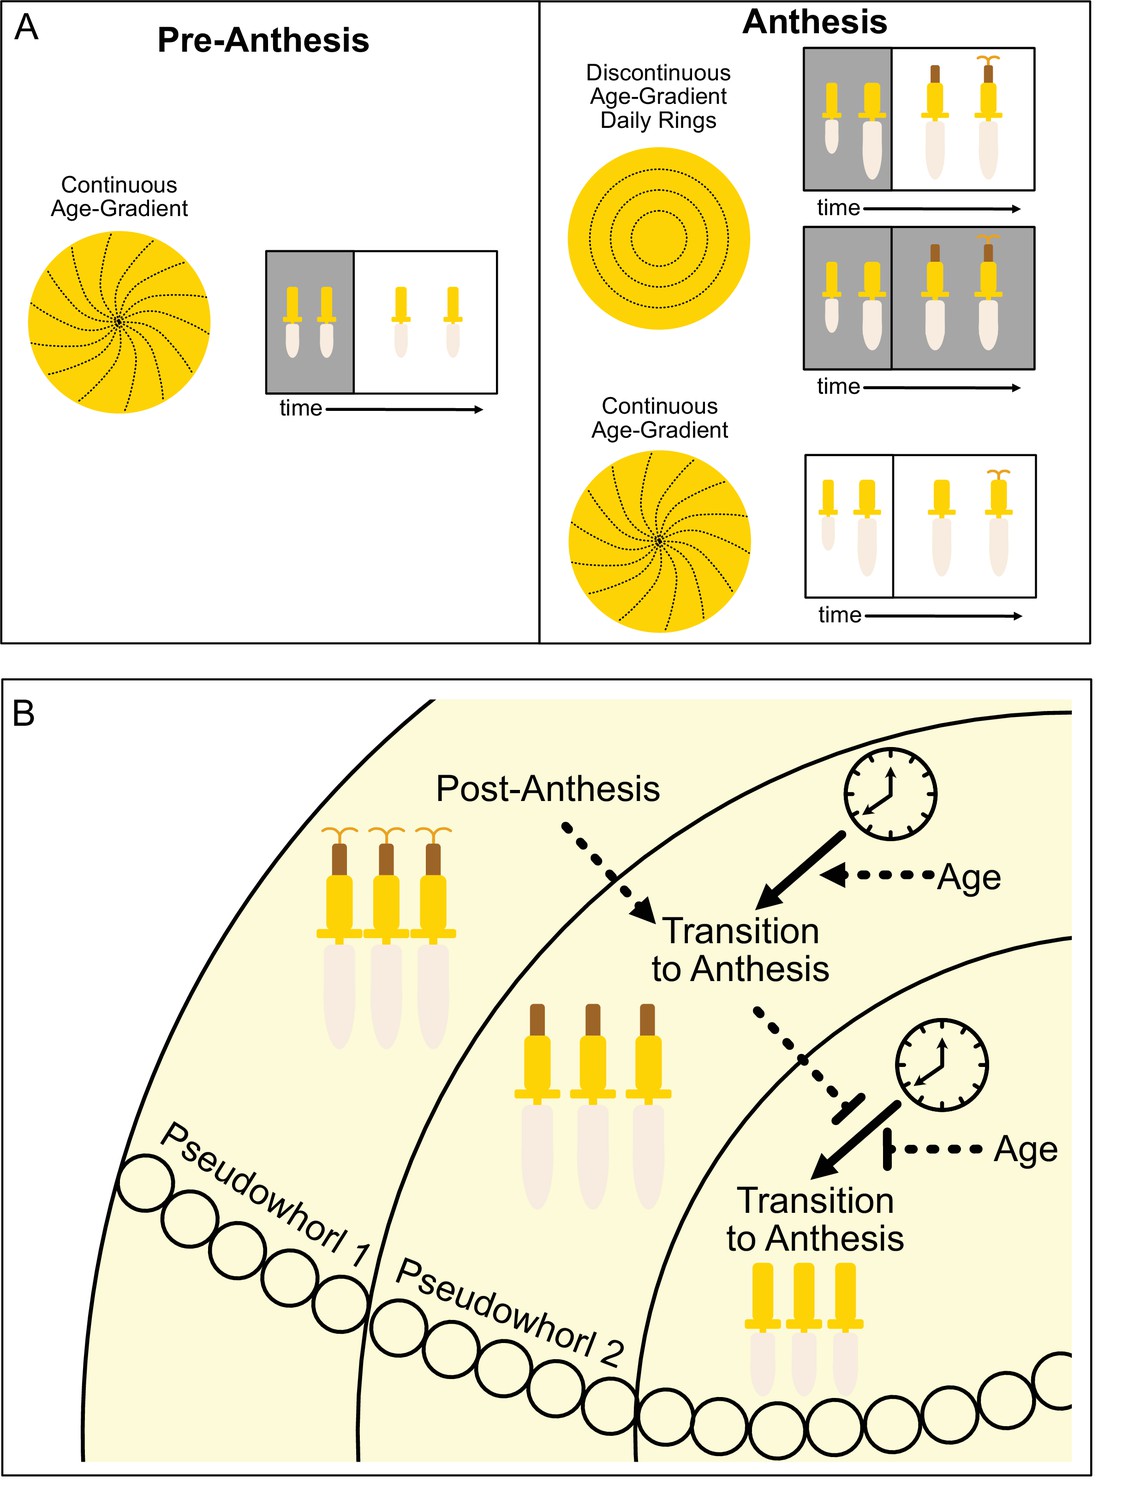
Model of sunflower anthesis patterns.
(A) Developmental patterns observed when sunflowers undergo anthesis in different environmental conditions. Pre-anthesis, the apparent pattern of florets on a capitulum, is a continuous age gradient with spiral phyllotaxy (left panel). During anthesis in both normal light/dark cycles and in constant darkness, the capitulum transitions to a discontinuous age gradient of florets in which rings of florets, or pseudowhorls, undergo synchronized daily rhythms of development (top right panel). In constant light conditions, however, the capitulum maintains a continuous age gradient of floret development. Ovaries and styles grow, but stamens do not (bottom right panel). (B) Speculative model for transition of floret development from age-dependent continuous gradients to organization into discrete pseudowhorls that undergo coordinated anthesis. After anthesis, florets comprising pseudowhorl 1 send an unknown signal (dashed line) to younger florets, creating a permissive state for the transition to anthesis. In order to respond to this signal, younger florets must both (1) be developmentally competent and (2) be exposed to a sufficient period of darkness during the subjective night (as determined by the circadian clock). Florets younger than pseudowhorl 2 do not elongate floral organs until the post-anthesis state of pseudowhorl 2, floret developmental status, environmental cues, and the circadian clock allow transition to anthesis and the generation of the next pseudowhorl.
Videos
Video 1
Anthesis on a capitulum maintained in light/dark cycles (16 hr light, 8 hr dark) at a constant 25°C.
Video 2
Anthesis on a capitulum maintained in constant darkness and temperature (25°C).
Video 3
Anthesis on a capitulum maintained in constant light and temperature (25°C).
Tables
Table 1
Circadian parameters for anthesis in different environmental conditions.
| Condition | Organ | n | Mean period (hr) | St. dev. | ZT window for period analysis (hr) | Mean phase (hr) | St. dev. | Phase analysis window (pseudowhorls) |
|---|---|---|---|---|---|---|---|---|
| LD|25°C (16 hr:8 hr) | Ovary | 3 | 24.2 | 0.4 | 21–137 | 22.9 | 0.7 | 1–5 |
| Stamen | 3 | 24.4 | 0.3 | 1.3 | 0.8 | |||
| Style | 3 | 24.4 | 0.1 | 12.6 | 2.1 | |||
| LD|25°C (12 hr:12 hr) | Ovary | 4 | 25.2 | 0.9 | 17–136 | 20.5 | 0.8 | 3–6 |
| Stamen | 4 | 25.0 | 0.7 | 23.5 | 1.5 | |||
| Style | 4 | 23.7 | 1.5 | 13.1 | 1.7 | |||
| LD|25°C (19.5 hr:4.5 hr) | Ovary | 3 | 23.5 | 0.6 | 18–110 | 19.9 | 1.5 | 3–6 |
| Stamen | 3 | 23.2 | 0.1 | 0.3 | 1.2 | |||
| Style | 3 | 23.8 | 1.5 | 10.3 | 1.4 | |||
| DD|18°C | Ovary | 3 | 22.5 | 0.2 | 17.5–81 | 22.4 | 2.3 | 2–4 |
| Stamen | 3 | 22.3 | 0.4 | 5.1 | 2.6 | |||
| DD|25°C | Ovary | 4 | 21.3 | 0.6 | 17–98 | 18.4 | 3.5 | 2–5 |
| Stamen | 4 | 21.8 | 0.2 | 0.0 | 3.7 | |||
| DD|30°C | Ovary | 3 | 21.9 | 1.1 | 18–80 | 20.4 | 3.6 | 2–4 |
| Stamen | 3 | 22.9 | 0.5 | 1.2 | 2.1 | |||
| LL|30–18°C (16 hr:8 hr) | Ovary | 3 | 22.8 | 0.2 | 15–97 | 20.2 | 3.2 | 2–5 |
| DD|30–18°C (16 hr:8 hr) | Ovary | 3 | 23.4 | 0.4 | 17–98 | 19.0 | 1.3 | 3–5 |
| Stamen | 3 | 23.5 | 0.3 | 23.3 | 1.2 | |||
| Start Style | 3 | 21.7 | 2.2 | 2.4 | 0.6 | |||
| LDLD|25°C (6 hr:6 hr:4 hr:8 hr) | Ovary | 3 | 24.2 | 0.5 | 40–136 | 21.2 | 2.3 | 3–6 |
| Stamen | 3 | 24.0 | 0.1 | 2.1 | 0.9 | |||
| Style | 3 | 23.9 | 0.1 | 13.5 | 1.8 |
Table 2
Time between initiation of PW2 and PW3.
| Period of darkness (ZT) | Mean time between PW2 and PW3 (hr) | St. dev. |
|---|---|---|
| 16–20.5 | 22.8 | 0.76 |
| 20.5–1 | 25.6 | 0.53 |
| 23–3.5 | 25.4 | 2.13 |
| 1–5.5 | 30.6 | 0.29 |
| 5–9.5 | 33.5 | 2.47 |
| 10–14.5 | 38.3 | 0.66 |
| 14–18.5 | 42.9 | 1.00 |
Table 3
Summary of pollinator visits to jet lag and constant light grown sunflowers.
| Experiment | Condition | n | Mean pollen release (hr) | 95% CI pollen release | p-Value | Mean total pollinators | 95% CI total pollinators | p-Value |
|---|---|---|---|---|---|---|---|---|
| LL vs. control | Control A | 7 | 1.16 | ±0.105 | 104.71 | ±15.6 | ||
| LL vs. control | LL|28°C | 7 | NA | NA | NA | 22.29 | ±5.11 | 2.67E-06 |
| Jet lag Day1 | Control B | 8 | 1.55 | ±0.101 | 52.38 | ±7.61 | ||
| Jet lag Day1 | Jet lag | 11 | 2.89 | ±0.198 | 9.48E-08 | 37.18 | ±8.16 | 0.0456 |
| Jet lag Day 2 | Control B | 7 | 1.73 | ±0.150 | 33.57 | ±11.7 | ||
| Jet lag Day 2 | Jet lag | 11 | 1.39 | ±0.104 | 0.00618 | 55.18 | ±14.0 | NS (0.095) |
Key resources table
| Reagent type (species) or resource | Designation | Source or reference | Identifiers | Additional information |
|---|---|---|---|---|
| Genetic reagent (Helianthus annuus) | HA412 HO | US Department of Agriculture, US National Plant Germplasm System | PI 603993 | https://npgsweb.ars-grin.gov/gringlobal/search |
| Other | Raspberry pi cameras and computers | Raspberry Pi | NoIR V2 cameras, 3 Model B computers | low cost, small computers and cameras used for time-course image capture |
| Other | Wingscapes Timelapse Cam | https://www.wingscapes.com | WCT-00121 | weatherproof camera used for time-course image capture |
| Software | R, base package | https://www.r-project.org | ||
| Software | R, tidyverse package | https://cran.r-project.org/web/packages/tidyverse/index.html | RRID:SCR_019186 | |
| Software | R, circular package | https://cran.r-project.org/web/packages/circular/index.html | RRID:SCR_003005 | |
| Software | BioDare2 | https://biodare2.ed.ac.uk | ||
| Software | ImageJ software | ImageJ (http://imagej.nih.gov/ij/) | RRID:SCR_003070 |
Additional files
Download links
A two-part list of links to download the article, or parts of the article, in various formats.
Downloads (link to download the article as PDF)
Open citations (links to open the citations from this article in various online reference manager services)
Cite this article (links to download the citations from this article in formats compatible with various reference manager tools)
The circadian clock controls temporal and spatial patterns of floral development in sunflower
eLife 12:e80984.
https://doi.org/10.7554/eLife.80984


