GJA1 depletion causes ciliary defects by affecting Rab11 trafficking to the ciliary base
- Department of Biological Sciences, Ulsan National Institute of Science and Technology, Republic of Korea
- Center for Genomic Integrity, Institute for Basic Science, Republic of Korea
- KNU-Center for Nonlinear Dynamics, CMRI, School of Life Sciences, BK21 Plus KNU Creative Bio Research Group, College of Natural Sciences, Kyungpook National University, Republic of Korea
- Department of Biomedical Engineering, Ulsan National Institute of Science and Technology, Republic of Korea
Figures
Figure 1 with 1 supplement
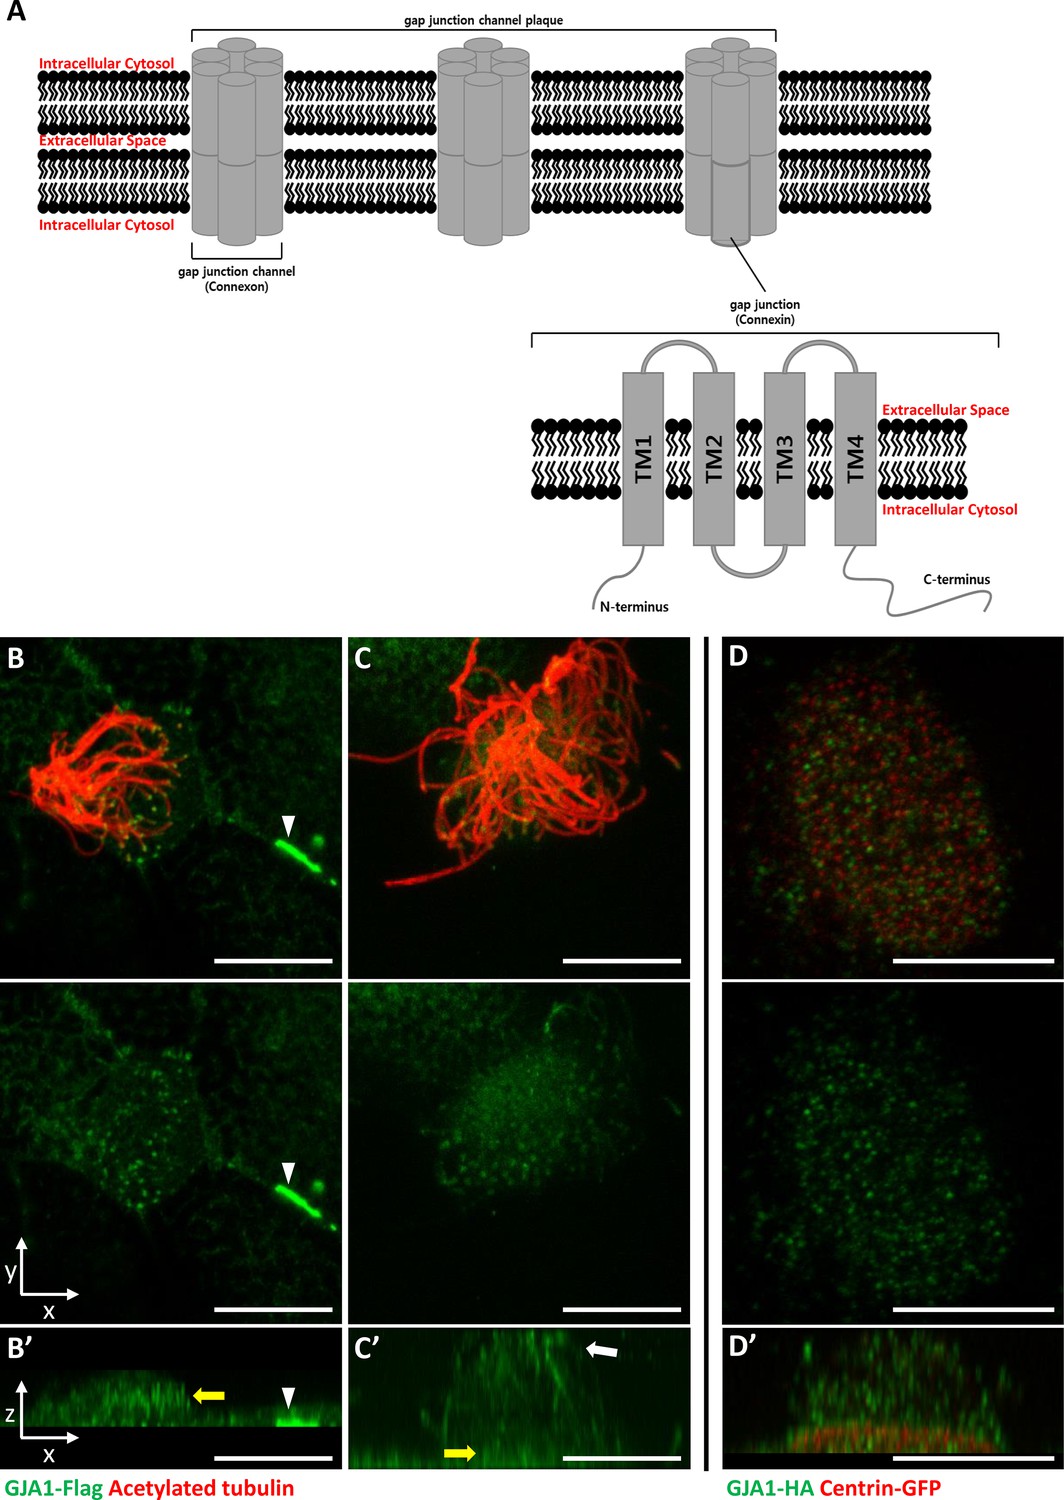
GJA1 is localized at the ciliary base and axonemes in addition to gap junctions in Xenopus multiciliated epithelial cells.
(A) The schematic structure of gap junction channels and GJA1. (B, C) Immunofluorescence analysis of the localization of GJA1 in Xenopus multiciliated epithelial cells. Xenopus embryos were microinjected with GJA1-Flag mRNA, and the embryos were stained with antibodies against acetylated tubulin (red) and flag-tag (green). Scale bars: 10 µm. (D) Immunofluorescence analysis of the localization of GJA1 and the basal body marker centrin in Xenopus multiciliated epithelial cells. Xenopus embryos were co-microinjected with GJA1-HA mRNA and centrin-GFP mRNA. The embryos were stained with antibodies against HA-tag (green) and GFP (red). Scale bars: 10 µm B’–D’. X-Z projection images of panels (B–D).
Figure 1—figure supplement 1
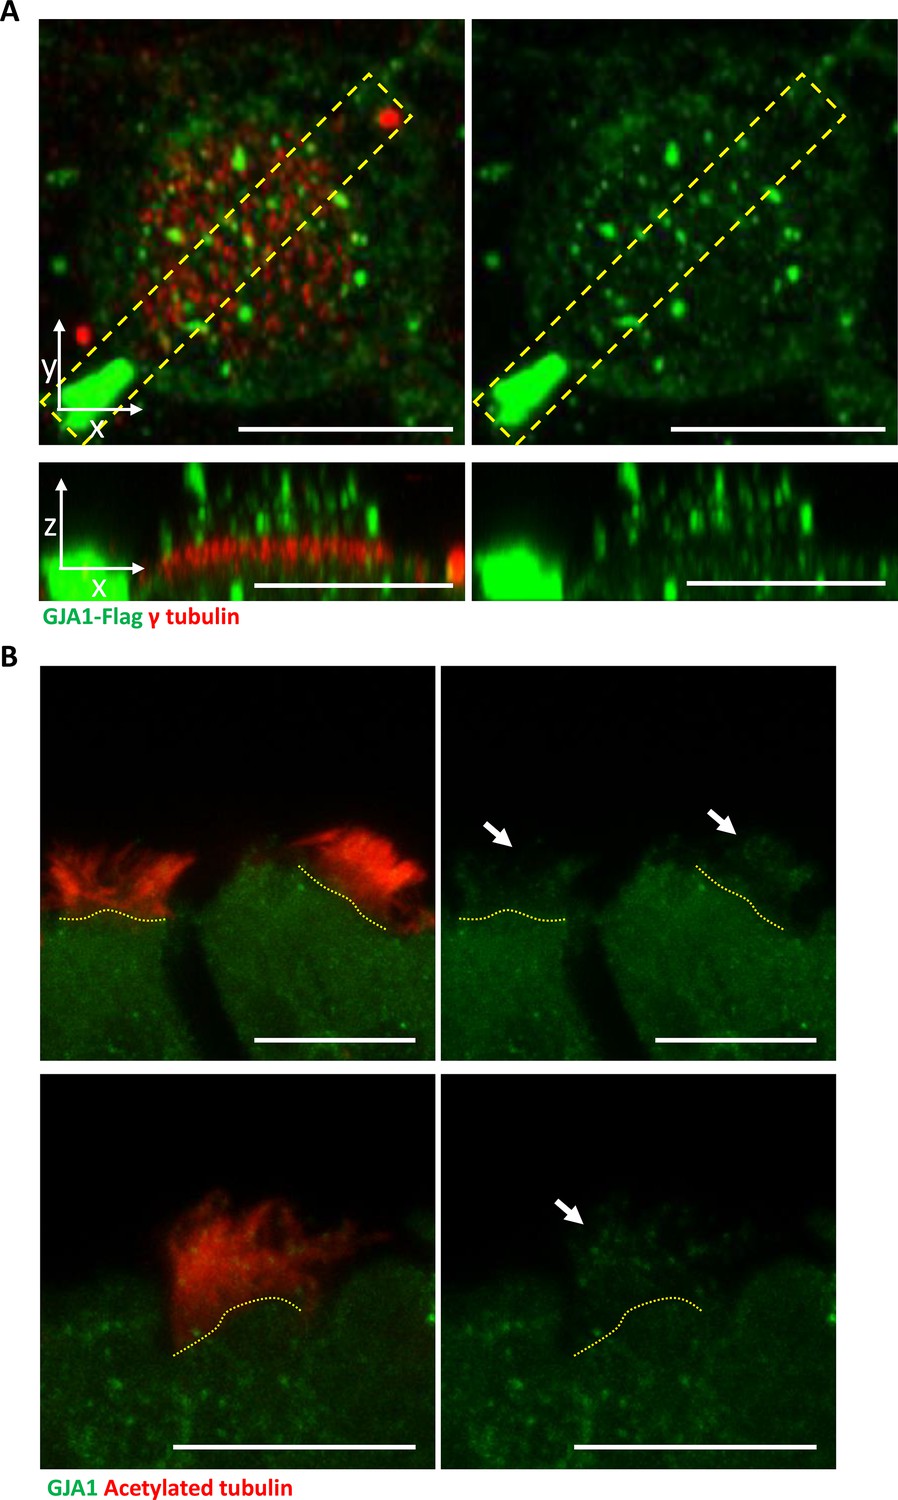
GJA1 is localized to ciliary axonemes in Xenopus multiciliated cells and mouse tracheal tissues.
(A) Immunofluorescence analysis of GJA1 localization in Xenopus laevis multiciliated epithelial cells. Xenopus laevis embryos were microinjected with GJA1-Flag mRNA. The embryos were stained with antibodies against flag (green) and γ-tubulin (red). The bottom images are X-Z projections of the top images. Scale bars: 10 µm. (B) Immunofluorescence analysis of GJA1 localization in mouse tracheal tissues. Mouse tracheal tissues were sectioned at 100 µm and stained with antibodies against GJA1 (green) and acetylated tubulin (red). Scale bars: 10 µm.
Figure 2 with 1 supplement

GJA1 dysfunction causes ciliary defects in Xenopus multiciliated epithelial cells.
(A) Xenopus embryos were injected with the indicated dnGJA1 mRNAs, and the mucociliary epithelium was immunostained. The ciliary axonemes were stained with acetylated tubulin antibody (red). Basal bodies were visualized by microinjection of centrin-GFP (green). Plasma membranes were labeled with membrane RFP and detected using an anti-RFP antibody (blue). Scale bars: 10 µm. (B) Statistical analysis of the number of multiciliated cells per unit area in panel (A). Error bars represent the mean ± SD. P values were determined by one-way ANOVA (p****<0.0001). n=28(CTL), 36(T154A), 38(Δ130-136), 31(Δ234-243). Raw values are provided in the Figure 2—source data 1 file. (C) Xenopus laevis embryos were co-microinjected with HA-tagged wild-type (WT) GJA1 (wtGJA1-HA) and flag-tagged dominant-negative mutant GJA1 (dnGJA1-Flag) mRNAs. Wild-type GJA1 was stained with an HA antibody (green), and each dominant-negative mutant GJA1 was stained with a flag antibody (red). Scale bars: 10 µm. (D) Statistical analysis of GJA1 intensity as a ratio of that in the ciliary axoneme to that in the cytoplasm in panel (C). Error bars represent the mean ± SD. P values were determined by one-way ANOVA (p****<0.0001, p*=0.0194). n=23(CTL,T154A), 10(Δ130-136), 17(Δ234-243). Raw values are provided in the Figure 2—source data 2 file.
-
Figure 2—source data 1
The number of multiciliated cells per unit area.
- https://cdn.elifesciences.org/articles/81016/elife-81016-fig2-data1-v2.xlsx
-
Figure 2—source data 2
The intensity of GJA1 signal as a ratio of that in the ciliary axoneme to that in the cytoplasm.
- https://cdn.elifesciences.org/articles/81016/elife-81016-fig2-data2-v2.xlsx
Figure 2—figure supplement 1
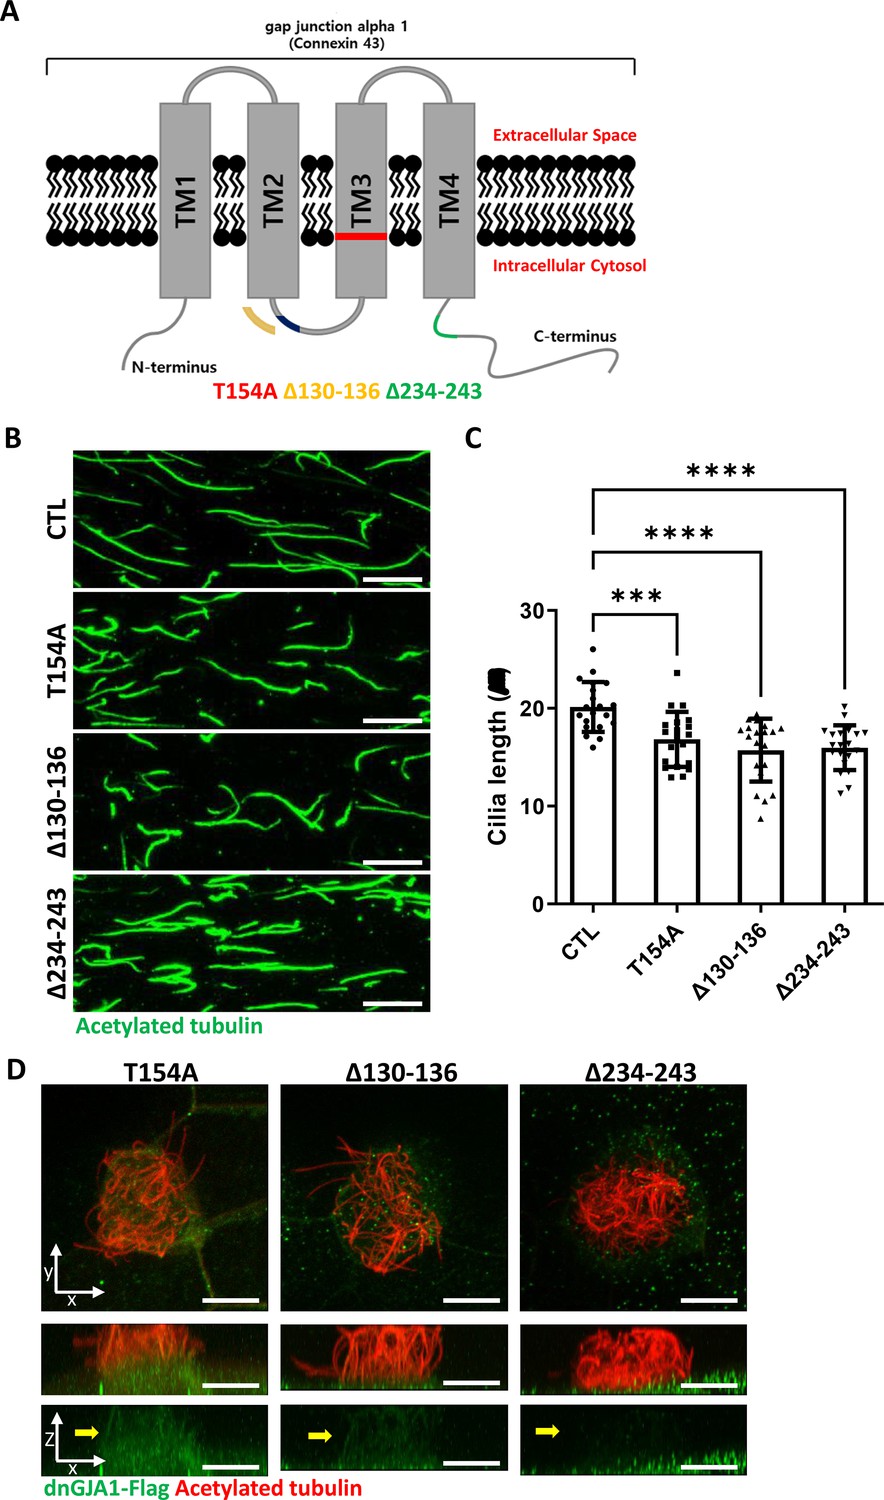
Dominant-negative GJA1 mutants cause ciliary defects and exhibit differential localization.
(A) The schematic structure of dominant-negative GJA1 mutants (dnGJA1). The T154A mutant contained a threonine (154)-to-alanine point mutation in transmembrane domain (TM) 3. The Δ130–136 mutant contained a deletion of the intracellular loop between TM 2 and 3. The Δ234–243 mutant also contained a deletion of the C-terminus of GJA1. (B) dnGJA1-injected embryos were treated with cilia isolation buffer, and isolated cilia were labeled with an acetylated tubulin antibody (green). Scale bars: 10 µm. (C) The average lengths of ciliary axonemes in panel (B) were plotted. Error bars represent the mean ± SD. P values were determined by one-way ANOVA (p***=0.0008, p****<0.0001). n=20(CTL, T154A, Δ130-136, Δ234-243). Raw values are provided in the Figure 2—figure supplement 1—source data 1 file. (D) Immunofluorescence analysis of the localization of each dnGJA1 mutant in Xenopus laevis multiciliated epithelial cells. Xenopus laevis embryos were microinjected with each dnGJA1-Flag mRNA, and the embryos were stained with antibodies against flag (green) and acetylated tubulin (red). The bottom images are X-Z projections of the top images. Scale bars: 10 µm.
-
Figure 2—figure supplement 1—source data 1
The average lengths of ciliary axonemes.
- https://cdn.elifesciences.org/articles/81016/elife-81016-fig2-figsupp1-data1-v2.xlsx
Figure 3 with 2 supplements
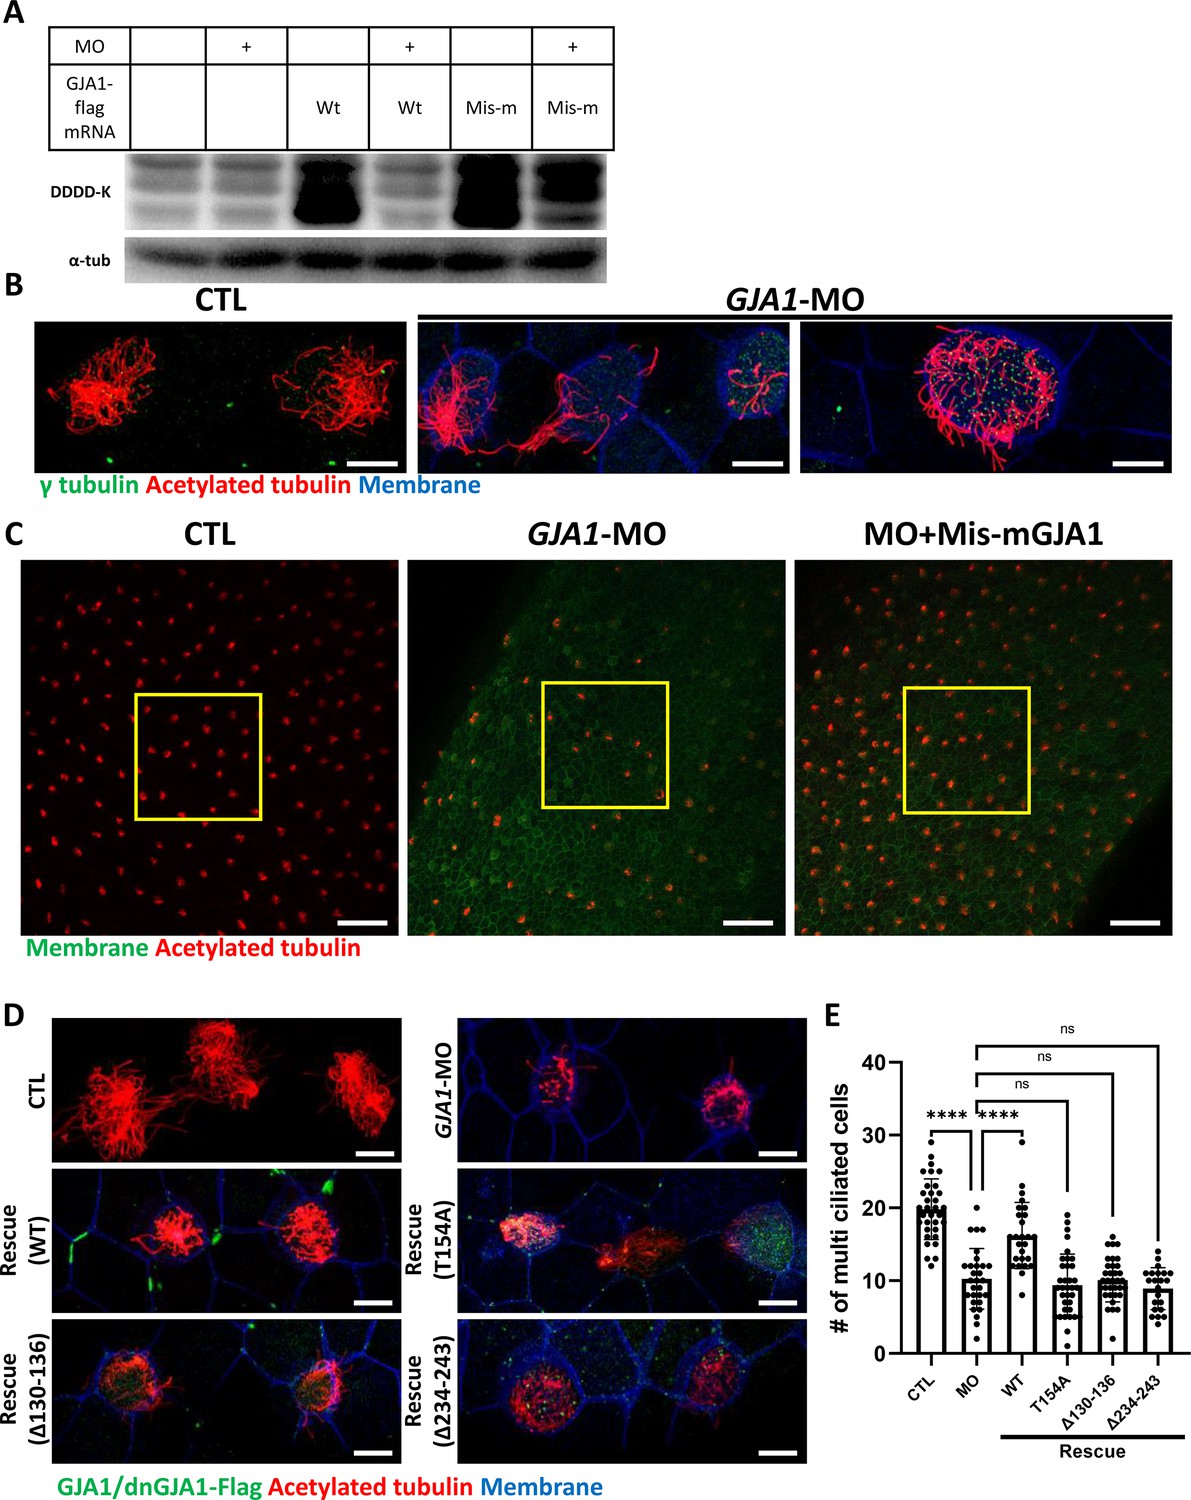
Morpholino-mediated knockdown of GJA1 causes severe disruption of ciliogenesis in Xenopus multiciliated epithelial cells.
(A) Wild-type (WT) GJA1 (Wt-GJA1-Flag) mRNA or silent mutant mRNA (Mis-mGJA1-Flag; non-targetable by GJA1-MO), which was modified to be mismatched to the morpholino oligo (MO) sequence, was co-injected with GJA1-MO into embryos. Immunoblotting was performed with an anti-Flag antibody for GJA1-Flag or with α-tubulin as the loading control. GJA1-MO efficiently inhibited GJA1-Flag expression from Wt-GJA1 mRNA. (B) Microinjection of a GJA1 antisense morpholino (GJA1-MO) disrupted normal ciliary axoneme assembly in multiciliated cells. The ciliary axonemes were labeled with an acetylated tubulin antibody (red), and centrosomes or basal bodies were stained with a γ-tubulin antibody (green). The cell membranes were labeled by microinjection of membrane RFP and detected using an anti-RFP antibody (blue). Scale bars: 10 µm. (C) Low-magnification confocal images of Xenopus multiciliated epithelial cells. Embryos were either injected with GJA1-MO alone or co-injected with MO-mismatched-GJA1 mRNA (Mis-mGJA1) and GJA1-MO. Mis-mGJA1 mRNA effectively rescued the ciliary defects. Multi-cilia bundles were stained with acetylated tubulin (red), and membranes were labeled by microinjection of membrane-GFP and detected with an anti-GFP antibody (green). Scale bars: 100 µm. (D) Flag-tagged wild-type or dominant-negative GJA1 mutant mRNAs were co-injected with GJA1-MO. All mutant mRNAs contained MO-mismatched target sequences. Only WT-GJA1-Flag mRNA rescued the loss-of-function phenotype. Each GJA1 flag-tagged protein was detected with a flag antibody (green). Ciliary axonemes (red) and cell membranes (blue) were visualized with an anti-acetylated antibody and an anti-GFP antibody, respectively. Scale bars: 10 µm. (E) Statistical analysis of the number of multiciliated cells per unit area in panels (C) and (D). Error bars represent the mean ± SD. P values were determined with the ordinary one-way ANOVA (p****<0.0001, Pns >0.05). n=33(CTL), 29(MO), 26(Rescue(WT)), 35(Rescue(T154A)), 34(Rescue(Δ130-136)), 22(Rescue(Δ234-243)). Raw values are provided in the Figure 3—source data 1 file.
-
Figure 3—source data 1
The number of multiciliated cells per unit area.
- https://cdn.elifesciences.org/articles/81016/elife-81016-fig3-data1-v2.xlsx
-
Figure 3—source data 2
The uncropped images of Western blots.
- https://cdn.elifesciences.org/articles/81016/elife-81016-fig3-data2-v2.zip
Figure 3—figure supplement 1
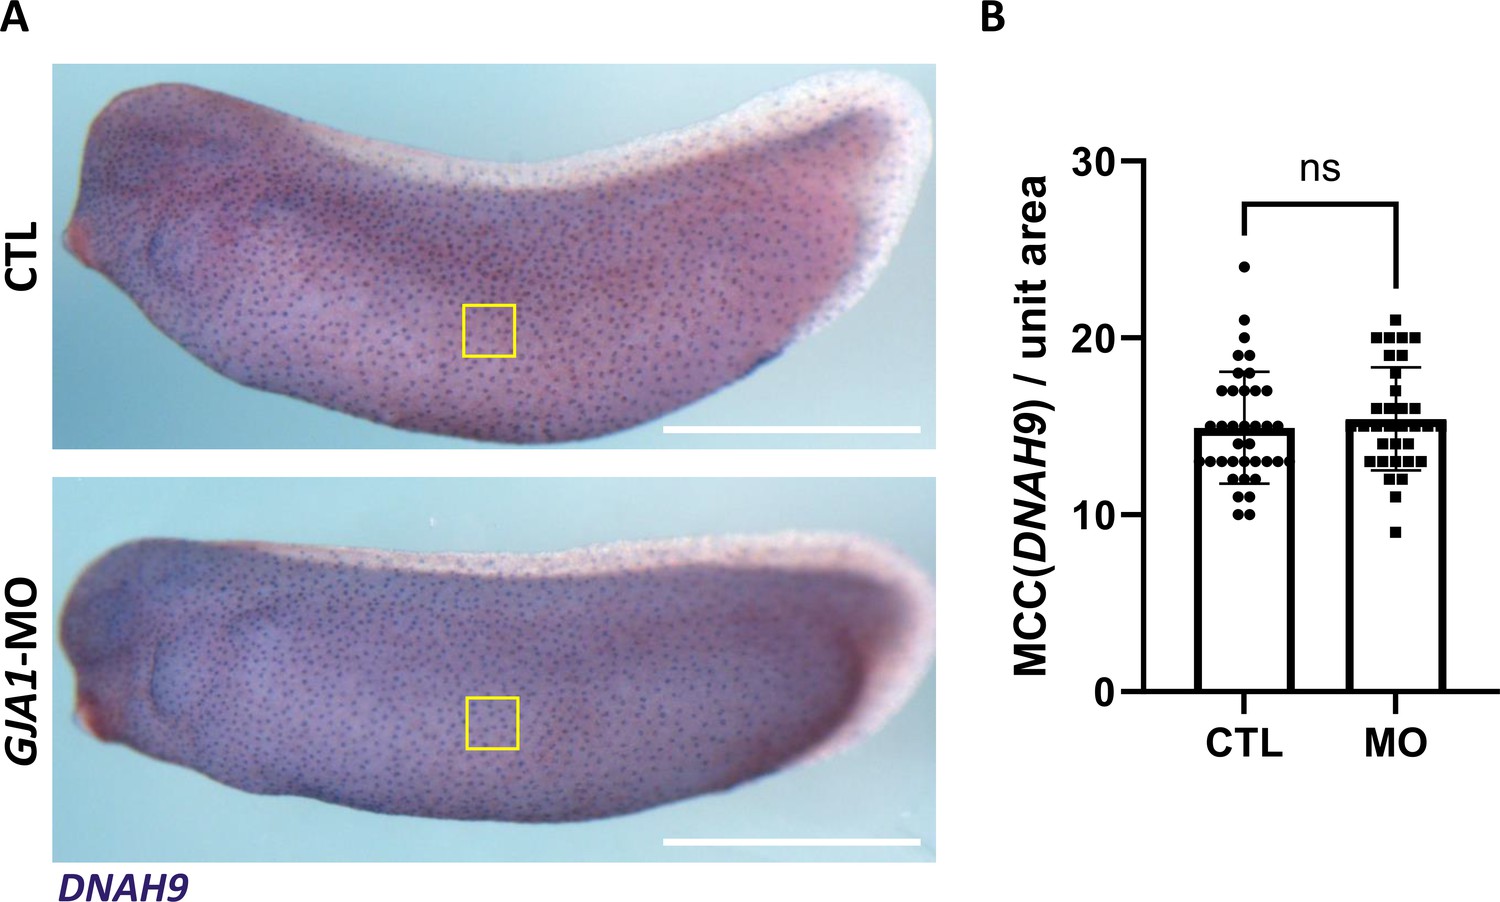
Morpholino oligo (MO)-mediated knockdown of GJA1 does not affect the cell fate specification of multiciliated cells.
(A) Expression of a multiciliated cell fate marker, DNAH9, was not altered in GJA1 morphants. Scale bars: 1 mm. (B) Statistical analysis of DNAH9-positive cells in panel (A). GJA1 depletion resulted in no significant difference in DNAH9 expression. P values were determined with a two-tailed t-test (Pns >0.05). n=37(CTL), 33(MO). Raw values are provided in the Figure 3—figure supplement 1—source data 1 file.
-
Figure 3—figure supplement 1—source data 1
The number of DNAH9-positive cells per unit area.
- https://cdn.elifesciences.org/articles/81016/elife-81016-fig3-figsupp1-data1-v2.xlsx
Figure 3—figure supplement 2
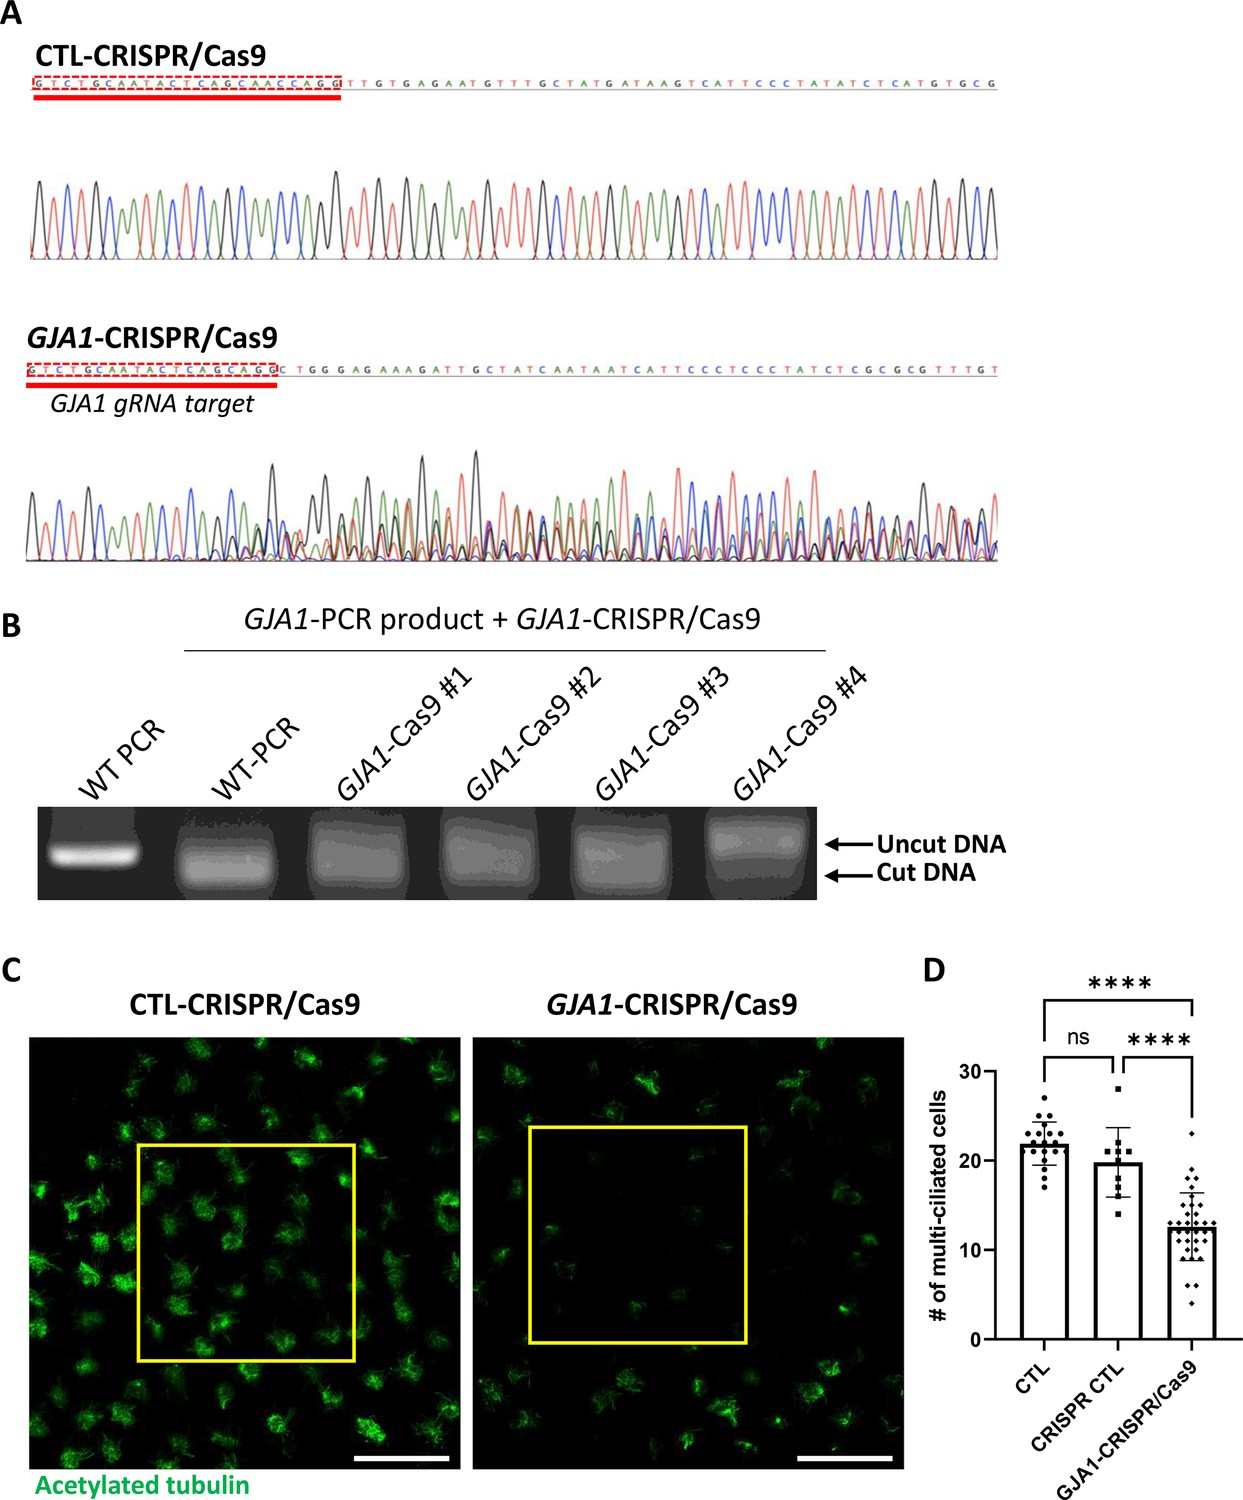
CRISPR/Cas9-mediated GJA1 knockout shows ciliary defect phenotypes similar to morpholino oligo (MO)-mediated knockdown.
(A) The sequencing results of GJA1 genomic DNA PCR products. CRISPR/Cas9-mediated GJA1 deletion mutagenesis effectively disrupted the GJA1 genomic DNA sequences of the GJA1 guide RNA target. (B) class=‘jrnlPatterns’ data-tag-desc=‘FNW’ title=‘FNW’ data-tag-type=‘FNW’ data-offset=‘2’ data-match=‘In vitro’ data-pattern=‘data-tag-index=’237_1 data-function=‘removeItalics’> In vitro GJA1-CRISPR/Cas9 reaction with GJA1 PCR products from wild-type or GJA1-CRISPR/Cas9-injected embryos. GJA1-Cas9 failed to cut PCR products from GJA1-Cas9-injected embryos due to mutations at the target site. (C) Microinjection of the GJA1-CRISPR/Cas9 disrupted ciliary bundle formation. The ciliary axonemes were labeled with an acetylated tubulin antibody (green). Scale bars: 100 µm. (D) Statistical analysis of the number of multiciliated cells per unit area in panel (C). Error bars represent the mean ± SD. P values were determined by one-way ANOVA (p****<0.0001, Pns >0.05). n=20(CTL), 10(CRISPR/Cas9 CTL), 35(GJA1-CRISPR/Cas9). Raw values are provided in the Figure 3—figure supplement 2—source data 1 file.
-
Figure 3—figure supplement 2—source data 1
The number of multiciliated cells per unit area.
- https://cdn.elifesciences.org/articles/81016/elife-81016-fig3-figsupp2-data1-v2.xlsx
-
Figure 3—figure supplement 2—source data 2
The uncropped images of DNA gel electrophoresis.
- https://cdn.elifesciences.org/articles/81016/elife-81016-fig3-figsupp2-data2-v2.zip
Figure 4 with 2 supplements
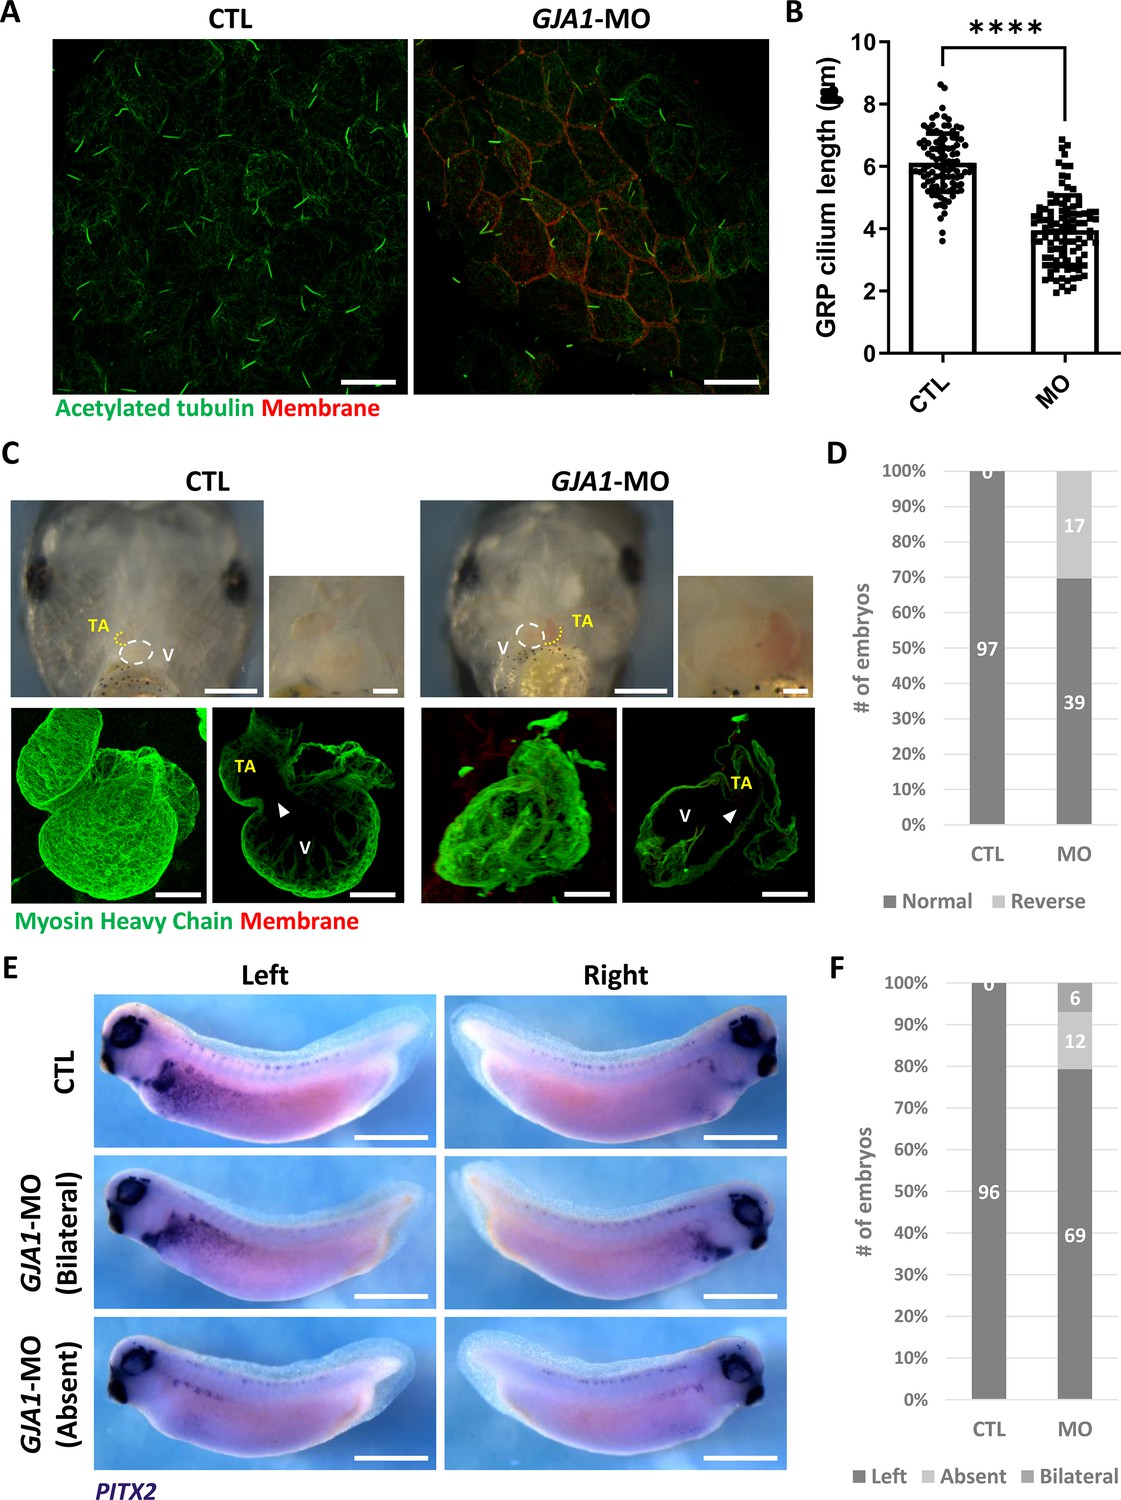
GJA1 depletion disrupts GRP cilium formation and left-right asymmetry.
(A) GJA1-MO was injected into the dorso-vegetal blastomeres to target gastrocoel roof plate (GRP) tissues. Nodal cilium in the GRP were stained with an anti-acetylated tubulin antibody (green), and the cell membrane was visualized by membrane-GFP, which was detected by an anti-GFP antibody (red). Scale bars: 20 µm. (B) The average lengths of GRP ciliary axonemes were plotted. Error bars represent the mean ± SD. P values were determined with the two-tailed t-test (p****<0.0001). n=100(CTL, MO). Raw values are provided in the Figure 4—source data 1 file. (C–D) GJA1 depletion reversed heart looping in Xenopus embryos. Embryonic hearts were visualized by immunostaining with an anti-myosin heavy chain antibody (lower panel). GJA1 morphants displayed reversed heart looping. Approximately 30% of MO-injected embryos displayed reversed heart looping. Raw values are provided in the Figure 4—source data 2 file. Scale bars: 500 µm (upper-left panel), 100 µm (upper-right, lower panel). TA; truncus arteriosus, V; ventricle. (E–F) Expression of the left LPM-specific marker PITX2 was disrupted in GJA1 morphants. Raw values are provided in the Figure 4—source data 3 file. Scale bars: 1 mm.
-
Figure 4—source data 1
The average lengths of GRP ciliary axonemes.
- https://cdn.elifesciences.org/articles/81016/elife-81016-fig4-data1-v2.xlsx
-
Figure 4—source data 2
The numbers of embryos displaying reversed heart looping.
- https://cdn.elifesciences.org/articles/81016/elife-81016-fig4-data2-v2.xlsx
-
Figure 4—source data 3
The numbers of embryos displaying normal or abnormal PITX2 expression.
- https://cdn.elifesciences.org/articles/81016/elife-81016-fig4-data3-v2.xlsx
Figure 4—video 1
Heartbeat of a wildtype embryo.
Figure 4—video 2
Heartbeat of GJA1 a morphant embryo.
Figure 5 with 2 supplements
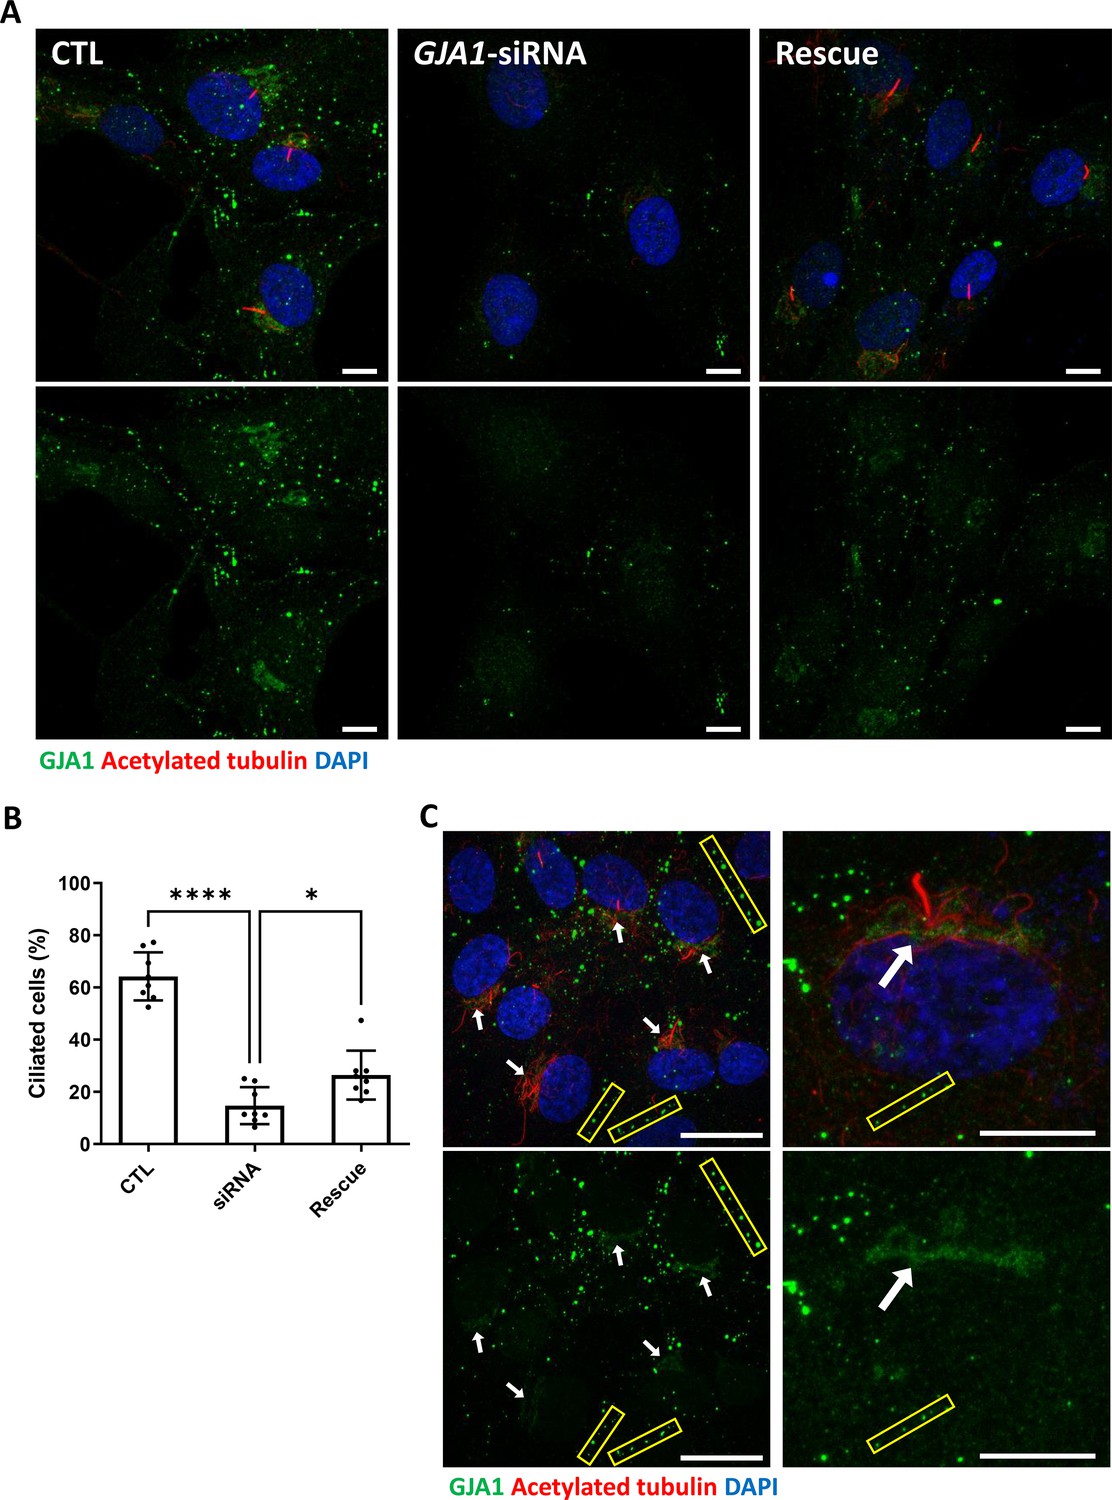
siRNA-mediated knockdown of GJA1 disrupts primary cilium formation in human RPE1 cells.
(A) RPE1 cells were serum-starved for 24 hr and labeled with an anti-GJA1 antibody (green), an anti-acetylated tubulin antibody (red), and DAPI (blue). siRNA-mediated knockdown of GJA1 inhibited primary cilium formation, and the ciliary defects in human RPE1 cells were rescued by GJA1 transfection. Scale bars: 10 µm. (B) Statistical analysis of the percentage of ciliated cells in panel (A). Error bars represent the mean ± SD. P values were determined with the ordinary one-way ANOVA (p****<0.0001, p*=0.0238). n=8(CTL, siRNA, Rescue), cell n=417(CTL), 242(siRNA), 193(Rescue). Raw values are provided in the Figure 5—source data 1 file. (C) RPE1 cells were serum-starved for 24 hr and labeled with an anti-GJA1 antibody (green), an anti-acetylated tubulin antibody (red), and DAPI (blue). GJA1 was localized around the pericentriolar region in addition to gap junctions. Scale bars: 20 µm (left panel), 10 µm (right panel).
-
Figure 5—source data 1
The percentage of ciliated cells.
- https://cdn.elifesciences.org/articles/81016/elife-81016-fig5-data1-v2.xlsx
Figure 5—figure supplement 1
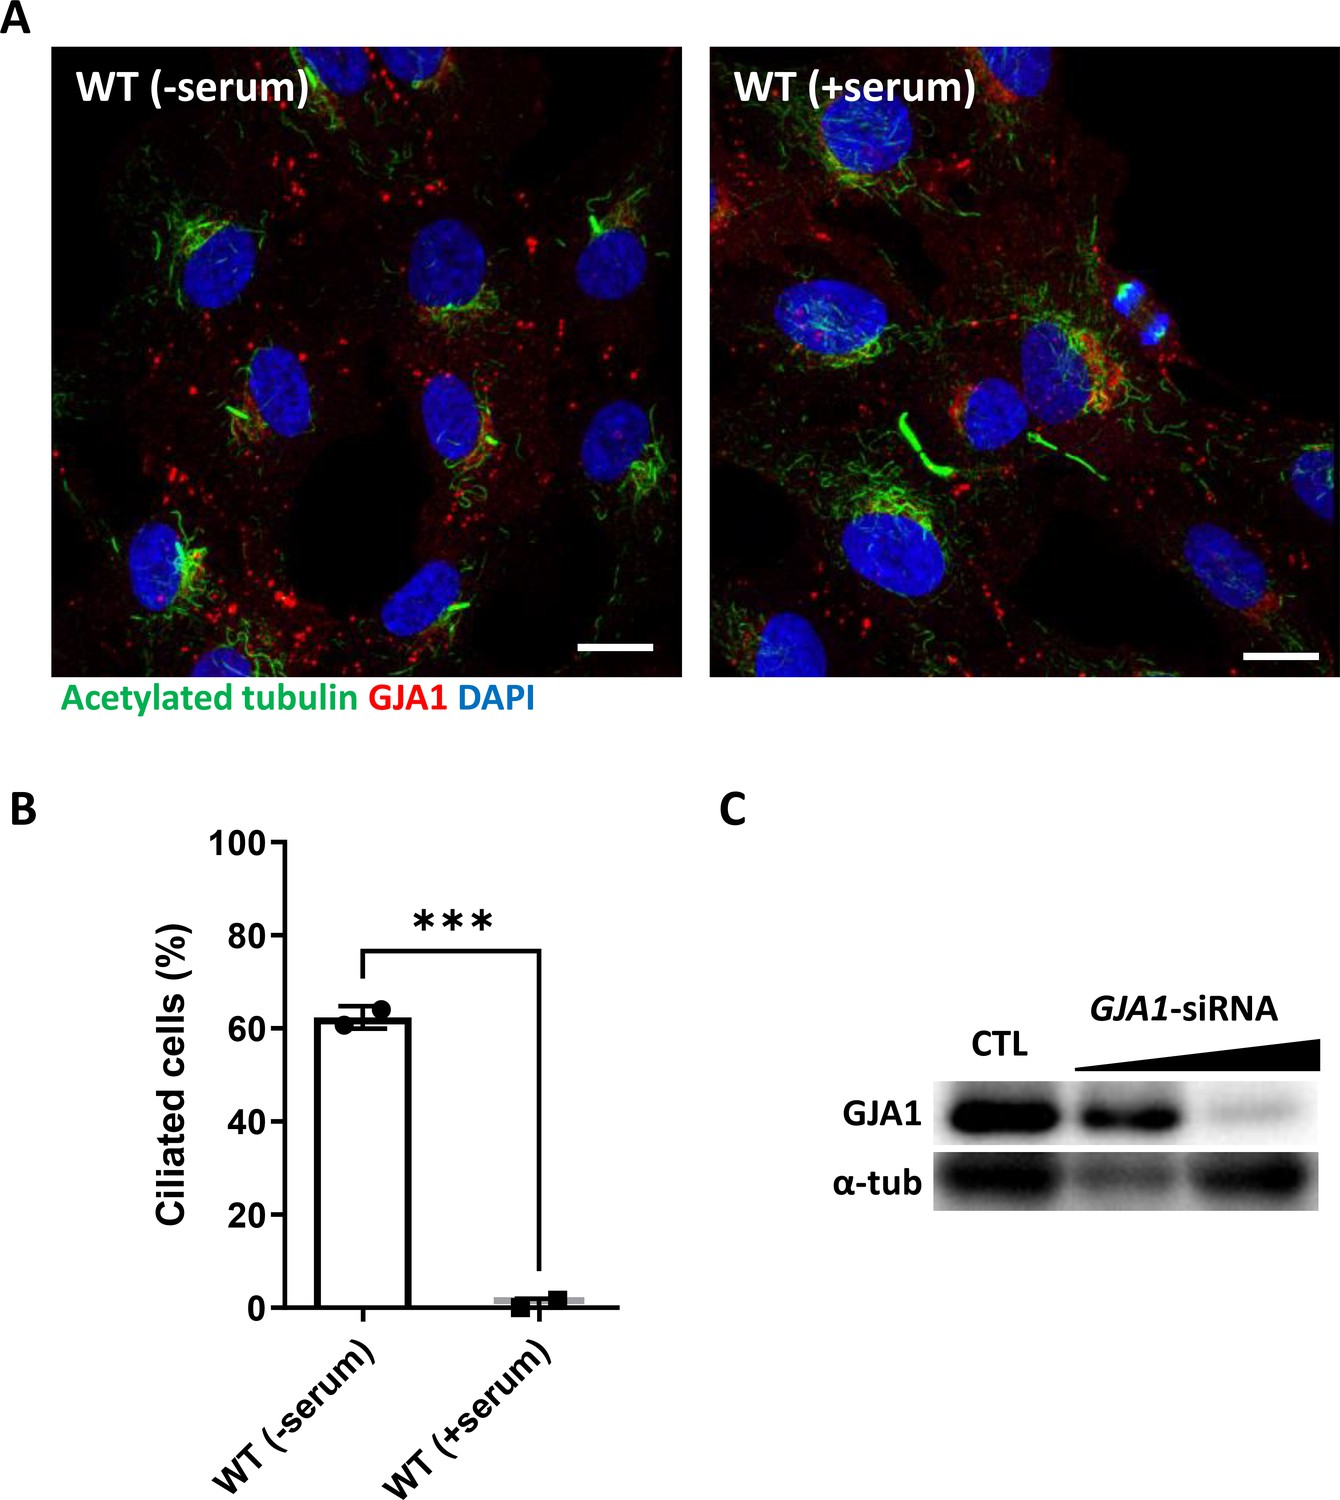
Ciliation of RPE1 cells by serum starvation and the efficacy of GJA1 siRNA.
(A) Ciliogenesis of RPE1 was induced by serum starvation. Scale bars: 10 µm. (B) The percentage of ciliated cells in panel (A) was plotted. Error bars represent the mean ± SD. P values were determined with a two-tailed t-test (p***=0.0009). n=2(WT(±Serum)), cell n=153(WT(-Serum)), 125(WT(+Serum)). Raw values are provided in the Figure 5—figure supplement 1—source data 1 file. (C) siRNA transfection effectively depleted GJA1 levels in human RPE1 cells. Immunoblotting was performed with an anti-GJA1 antibody and an anti-α-tubulin antibody as a loading control. WT; wild-type.
-
Figure 5—figure supplement 1—source data 1
The percentage of ciliated cells.
- https://cdn.elifesciences.org/articles/81016/elife-81016-fig5-figsupp1-data1-v2.xlsx
-
Figure 5—figure supplement 1—source data 2
The uncropped images of Western blots.
- https://cdn.elifesciences.org/articles/81016/elife-81016-fig5-figsupp1-data2-v2.zip
Figure 5—figure supplement 2
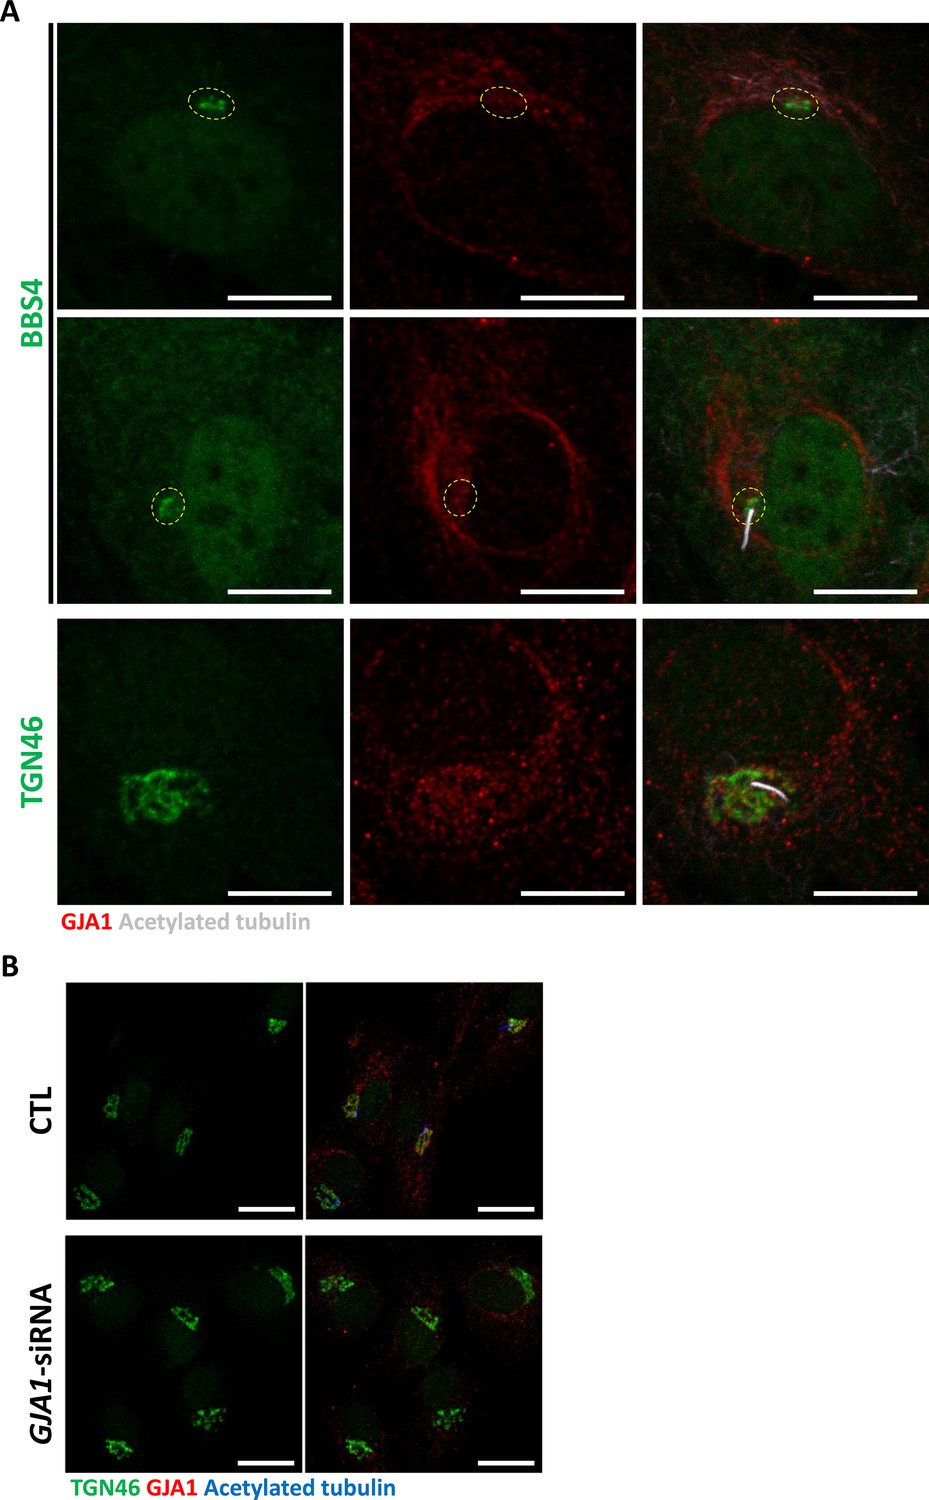
GJA1 localizes to the Golgi complex but GJA1 depletion does not affect Golgi morphology.
(A) Serum-starved RPE1 cells were labeled with an anti-BBS4 or anti-TGN46 antibody (green), an anti-GJA1 antibody (red), and an anti-acetylated tubulin antibody (gray). GJA1 localized to the Golgi complex. Scale bars: 10 µm (B) RPE1 cells were labeled with an anti-TGN46 antibody (green), an anti-GJA1 antibody (red), and an anti-acetylated tubulin antibody (blue). siRNA-mediated knockdown of GJA1 did not affect the morphology of the Golgi complex. Scale bars: 10 µm.
Figure 6 with 2 supplements
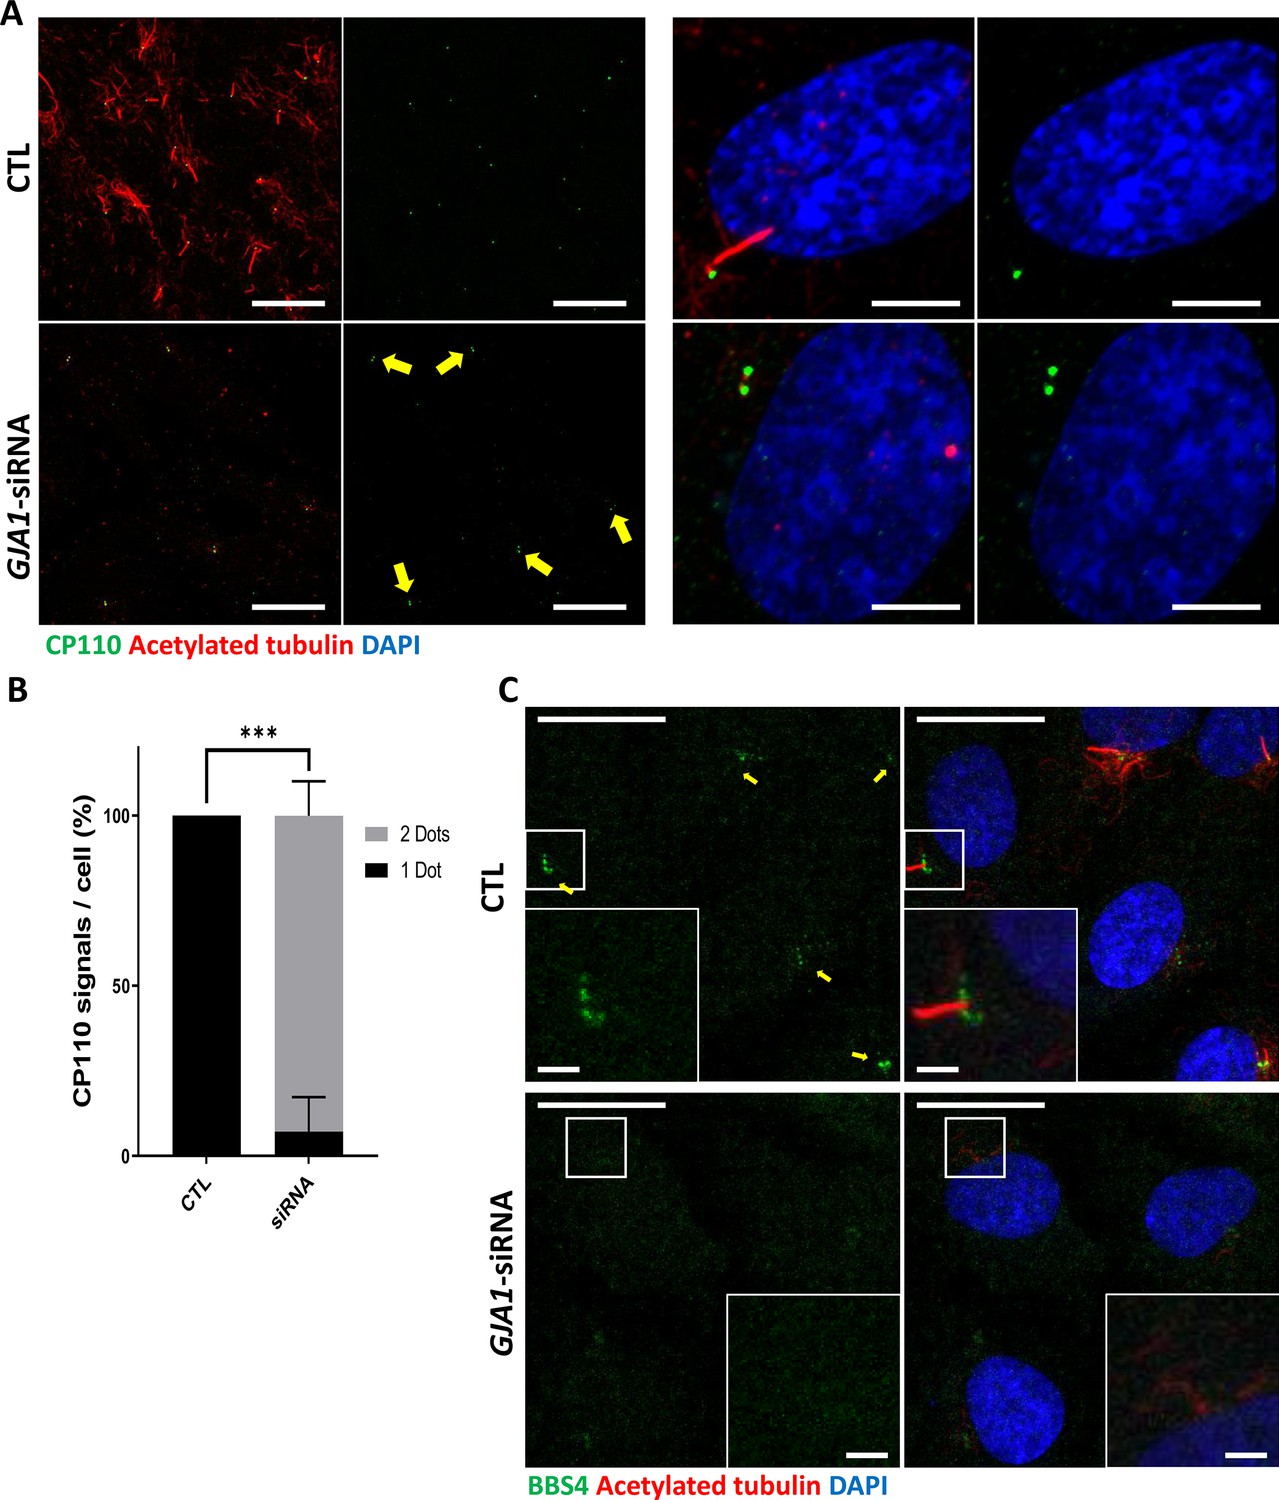
Knockdown of GJA1 results in the abnormal distribution of pericentriolar proteins involved in ciliogenesis.
(A) RPE1 cells were transfected with GJA1 siRNA and immunostained with an anti-CP110 antibody (green), an anti-acetylated tubulin antibody (red), and DAPI (blue). Two CP110 spots in both mother and daughter centrioles were observed in GJA1-depleted RPE1 cells. Scale bars: 20 µm (left panel), 5 µm (right panel). (B) The percentage of CP110 dots per cell in panel (A). Error bars represent the mean ± SD. P values were determined with the with the two-way ANOVA (p***=0.0004). n=2(CTL, siRNA/1 Dot, 2Dots), cell n = 24(CTL), 22 (siRNA). Raw values are provided in the Figure 6—source data 1 file. (C) RPE1 cells were transfected with GJA1 siRNA and immunostained with an anti-BBS4 antibody (green) and an anti-acetylated tubulin antibody (red), and DAPI (blue). BBS4 puncta in the pericentriolar material (PCM) were absent from the pericentriolar region of GJA1-depleted cells. The pericentriolar region is shown with higher magnification in the inset panels. Scale bars: 20 µm, 5 µm (inset).
-
Figure 6—source data 1
The percentage of CP110 dots per cell.
- https://cdn.elifesciences.org/articles/81016/elife-81016-fig6-data1-v2.xlsx
Figure 6—figure supplement 1
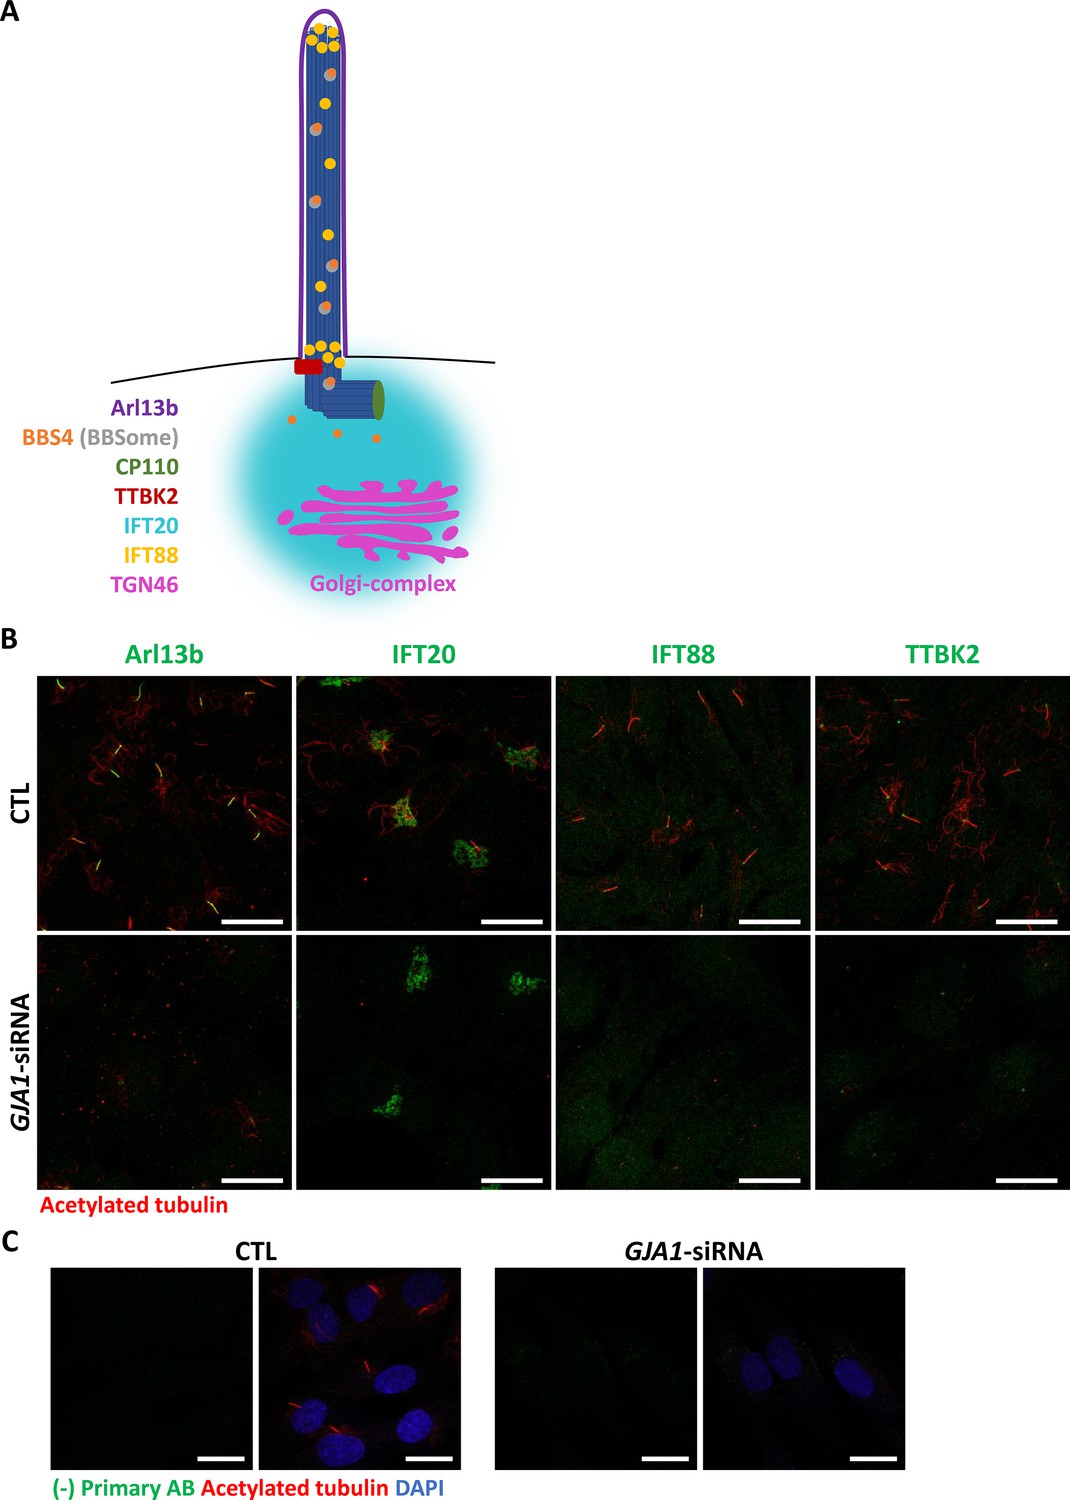
Subcellular localization of ciliary proteins near the pericentriolar region in GJA1-depleted RPE1 cells.
(A) Subcellular localization of ciliary proteins (Arl13B, IFT20, IFT88, and TTBK2) near the pericentriolar region during ciliogenesis. (B) RPE1 cells were transfected with GJA1 siRNA and immunostained with acetylated tubulin antibody (red) and anti-Arl13B, anti-IFT20, anti-IFT88, or anti-TTBK2 (green) antibodies. Scale bars: 20 µm. (C) RPE1 cells were transfected with GJA1 siRNA and immunostained with an acetylated tubulin antibody (red) and an Alexa-488-conjugated secondary antibody (green) without other primary antibodies as a negative control. Scale bars: 20 µm.
Figure 6—figure supplement 2

CP110 localization in multiciliated cells in GJA1-MO-injected Xenopus embryos.
(A) Wild-type and GJA1-MO-injected embryos were stained with CP110 (red) and acetylated tubulin (green) antibodies at stage 30. Scale bars: 20 µm (upper, middle panel), 10 µm (lower panel). (B) The relative intensity of CP110 signals in the ciliated cells in panel (A) was measured and plotted. Error bars represent the mean ± SD. P values were determined with a two-tailed t-test (p****<0.0001). n=27(CTL), 19(MO). Raw values are provided in the Figure 6—figure supplement 2—source data 1 file.
-
Figure 6—figure supplement 2—source data 1
The relative intensity of CP110 signals in the ciliated cells.
- https://cdn.elifesciences.org/articles/81016/elife-81016-fig6-figsupp2-data1-v2.xlsx
Figure 7 with 3 supplements

Knockdown of GJA1 disrupted Rab11 trafficking to the ciliary base.
(A) HA-tagged Rab11a was expressed in RPE1 cells, and the lysates were used for immunoprecipitation assays with GJA1 antibody-conjugated or IgG-conjugated beads. The immunoprecipitants were analyzed by immunoblotting with anti-GJA1 or anti-HA antibodies. Rab11a-HA was co-immunoprecipitated with endogenous GJA1. (B) RPE1 cells were serum-starved for 24 hr, and immunofluorescence staining analysis was performed with an anti-Rab11 antibody (green), an anti-GJA1 antibody (red), an anti-acetylated tubulin antibody (blue), and DAPI (gray). Rab11 and GJA1 accumulated around the pericentriolar-ciliary base. Scale bars: 5 µm. (C) GJA1-siRNA-treated RPE1 cells were immunostained with an anti-Rab11 antibody (green), an anti-GJA1 antibody (red), an anti-acetylated tubulin antibody (blue), and DAPI (gray). siRNA-mediated knockdown of GJA1 inhibited Rab11 accumulation around the pericentriolar region and basal bodies, and GJA1 transfection rescued the phenotype in RPE1 cells. Scale bars: 10 µm. (D) Statistical analysis of Rab11 accumulation in panel (C). Error bars represent the mean ± SD. P values were determined by one-way ANOVA (p***=0.0008, p*=0.0117). n=6(CTL, siRNA, Rescue), cell n=221(CTL), 157(siRNA), 133(Rescue). Raw values are provided in the Figure 7—source data 1 file. (E–F) Super-resolution images of Rab11 localization. RPE1 cells were labeled with an anti-Rab11 antibody (green) and an anti-acetylated tubulin antibody (red). GJA1 depletion was not observed in Rab11-positive ciliary vesicles in the pericentriolar region. Images were obtained by SIM. Scale bars: 5 µm (E), 1 µm (F).
-
Figure 7—source data 1
The percentage of Rab11 accumulated cell.
- https://cdn.elifesciences.org/articles/81016/elife-81016-fig7-data1-v2.xlsx
-
Figure 7—source data 2
The uncropped images of western blots.
- https://cdn.elifesciences.org/articles/81016/elife-81016-fig7-data2-v2.zip
Figure 7—figure supplement 1
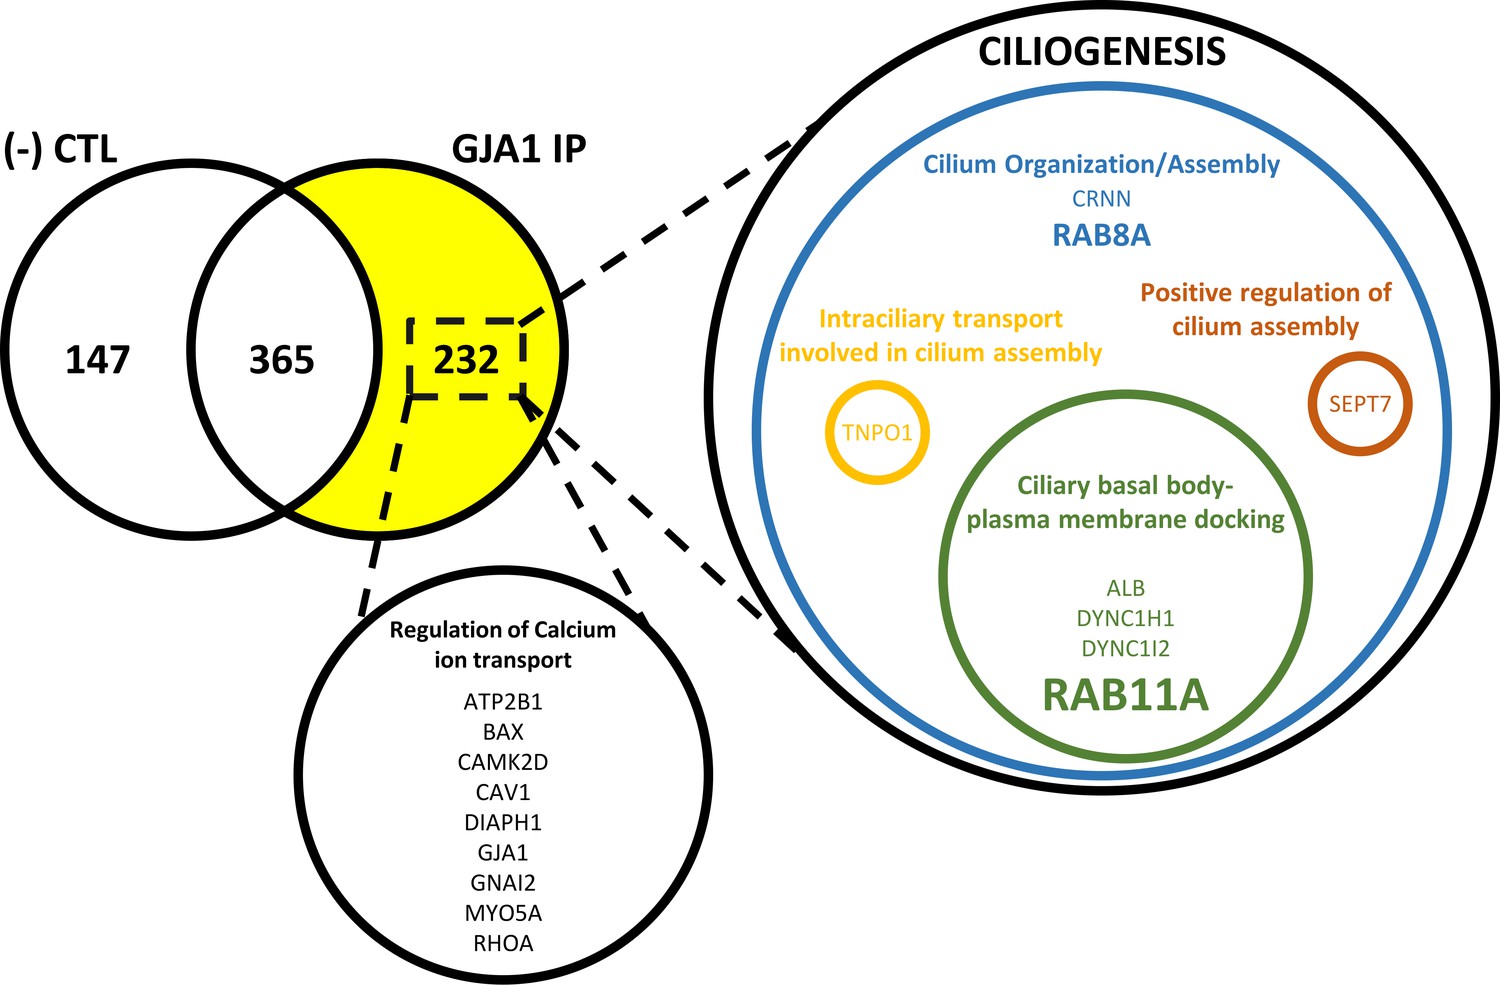
Identification of GJA1-interacting proteins by IP-MS.
In total, 232 proteins were detected by immunoprecipitation of GJA1 and mass spectrometry analysis. Gene ontology term analysis of the proteins identified two distinct groups of proteins involved in Ca2+ transport and ciliogenesis.
Figure 7—figure supplement 2

Basal Ca2+ levels and Ca2+ influx in GJA1-depleted RPE1 cells.
(A) Basal Ca2+ levels in RPE1 control (CTL), GJA1 siRNA-transfected, and GJA1 overexpressed cells were monitored by Fura-2 fluorescence ratios. Error bars represent the mean ± SD. P values were determined by one-way ANOVA (Pns >0.05). n=13(CTL, siRNA, Overexpression). Raw values are provided in the Figure 7—figure supplement 2—source data 1 file. (B) Ca2+ influx in RPE1 CTL, GJA1 siRNA-transfected, and GJA1-overexpressed cells was monitored by Fura-2 fluorescence ratios. Error bars represent the mean ± SD. P values were determined by one-way ANOVA [p**=0.0076 (siRNA), p** = 0.0014 (overexpression)]. n=3(CTL, siRNA, Overexpression). Raw values are provided in the Figure 7—figure supplement 2—source data 2 file.
-
Figure 7—figure supplement 2—source data 1
Basal Ca2+ levels in RPE1 cells.
- https://cdn.elifesciences.org/articles/81016/elife-81016-fig7-figsupp2-data1-v2.xlsx
-
Figure 7—figure supplement 2—source data 2
Ca2+ influx in RPE1 cells.
- https://cdn.elifesciences.org/articles/81016/elife-81016-fig7-figsupp2-data2-v2.xlsx
Figure 7—figure supplement 3
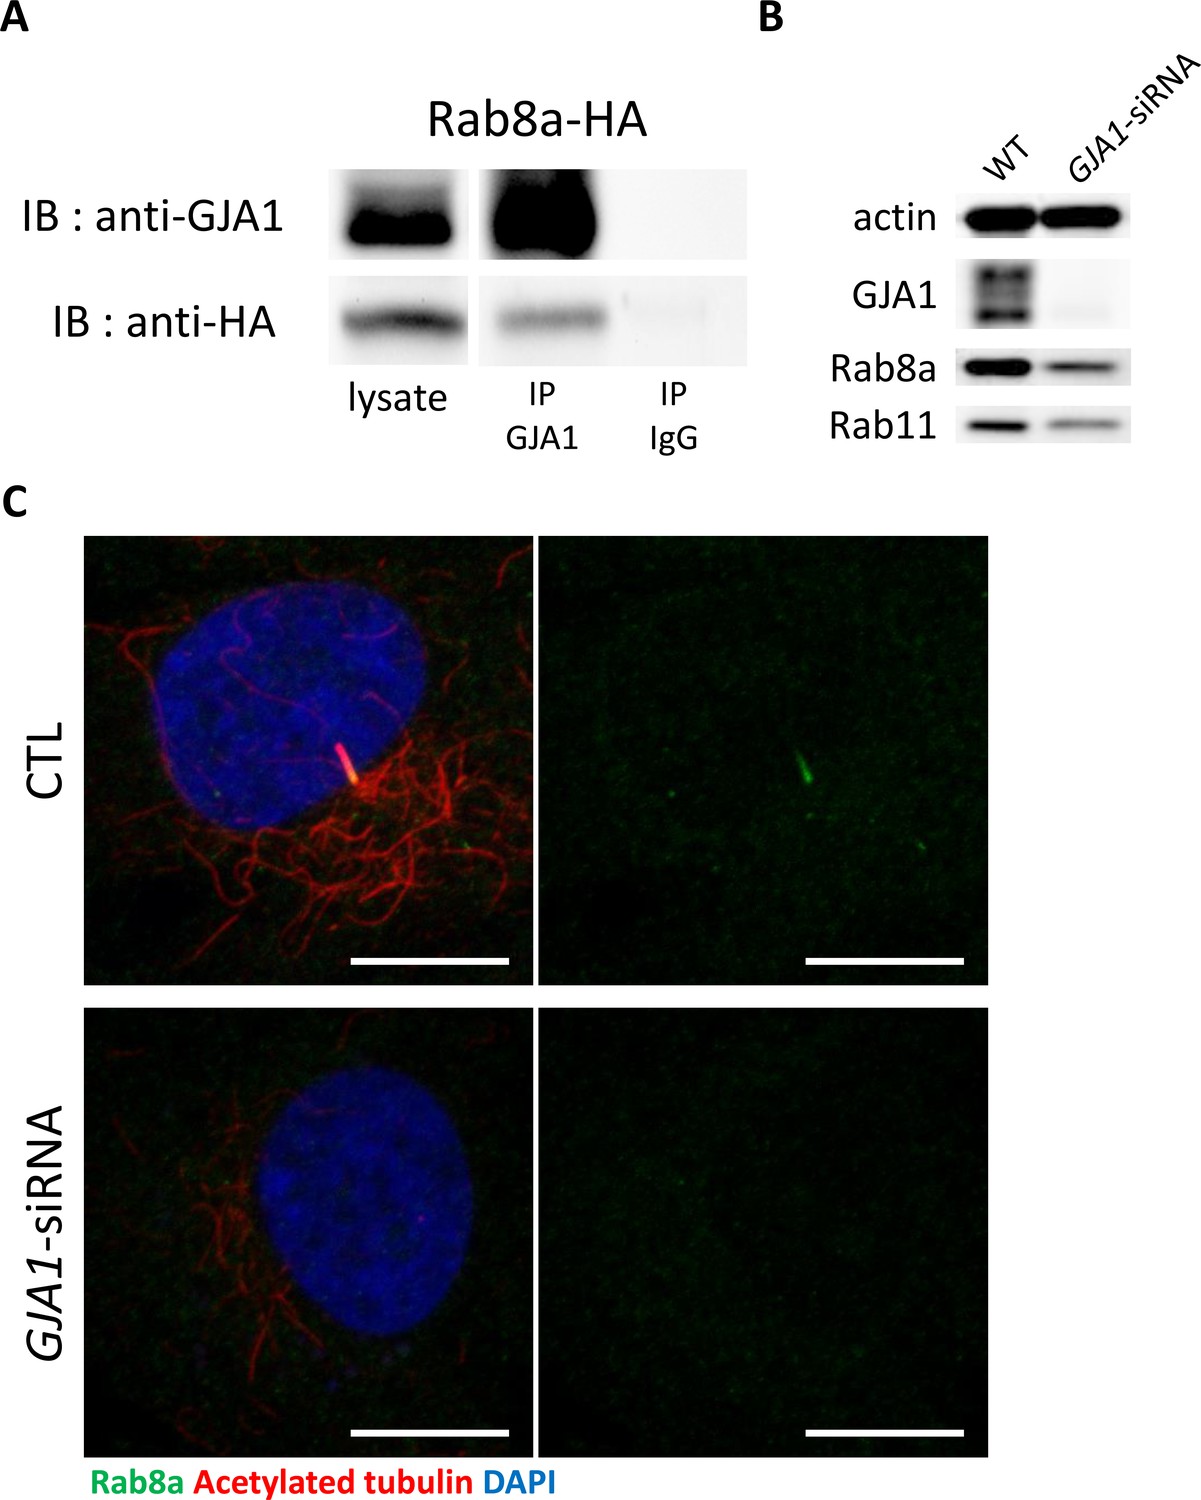
GJA1 interacts with Rab8a.
(A) HA-tagged Rab8a protein was co-immunoprecipitated with GJA1. Immunoblotting (IB) was performed with anti-GJA1 and anti-HA antibodies. (B) Rab8a, Rab11, and GJA1 expression levels in GJA1 siRNA-transfected RPE1 cells were analyzed by immunoblotting. Actin was used as a loading control. (C) siRNA-mediated knockdown of GJA1 inhibited Rab8a localization in RPE1 cells. RPE1 cells were labeled with an anti-Rab8a antibody (green), an anti-acetylated tubulin antibody (red), and DAPI (blue). Scale bars: 10 µm.
-
Figure 7—figure supplement 3—source data 1
The uncropped images of western blots.
- https://cdn.elifesciences.org/articles/81016/elife-81016-fig7-figsupp3-data1-v2.zip
-
Figure 7—figure supplement 3—source data 2
The uncropped images of western blots.
- https://cdn.elifesciences.org/articles/81016/elife-81016-fig7-figsupp3-data2-v2.zip
Figure 8
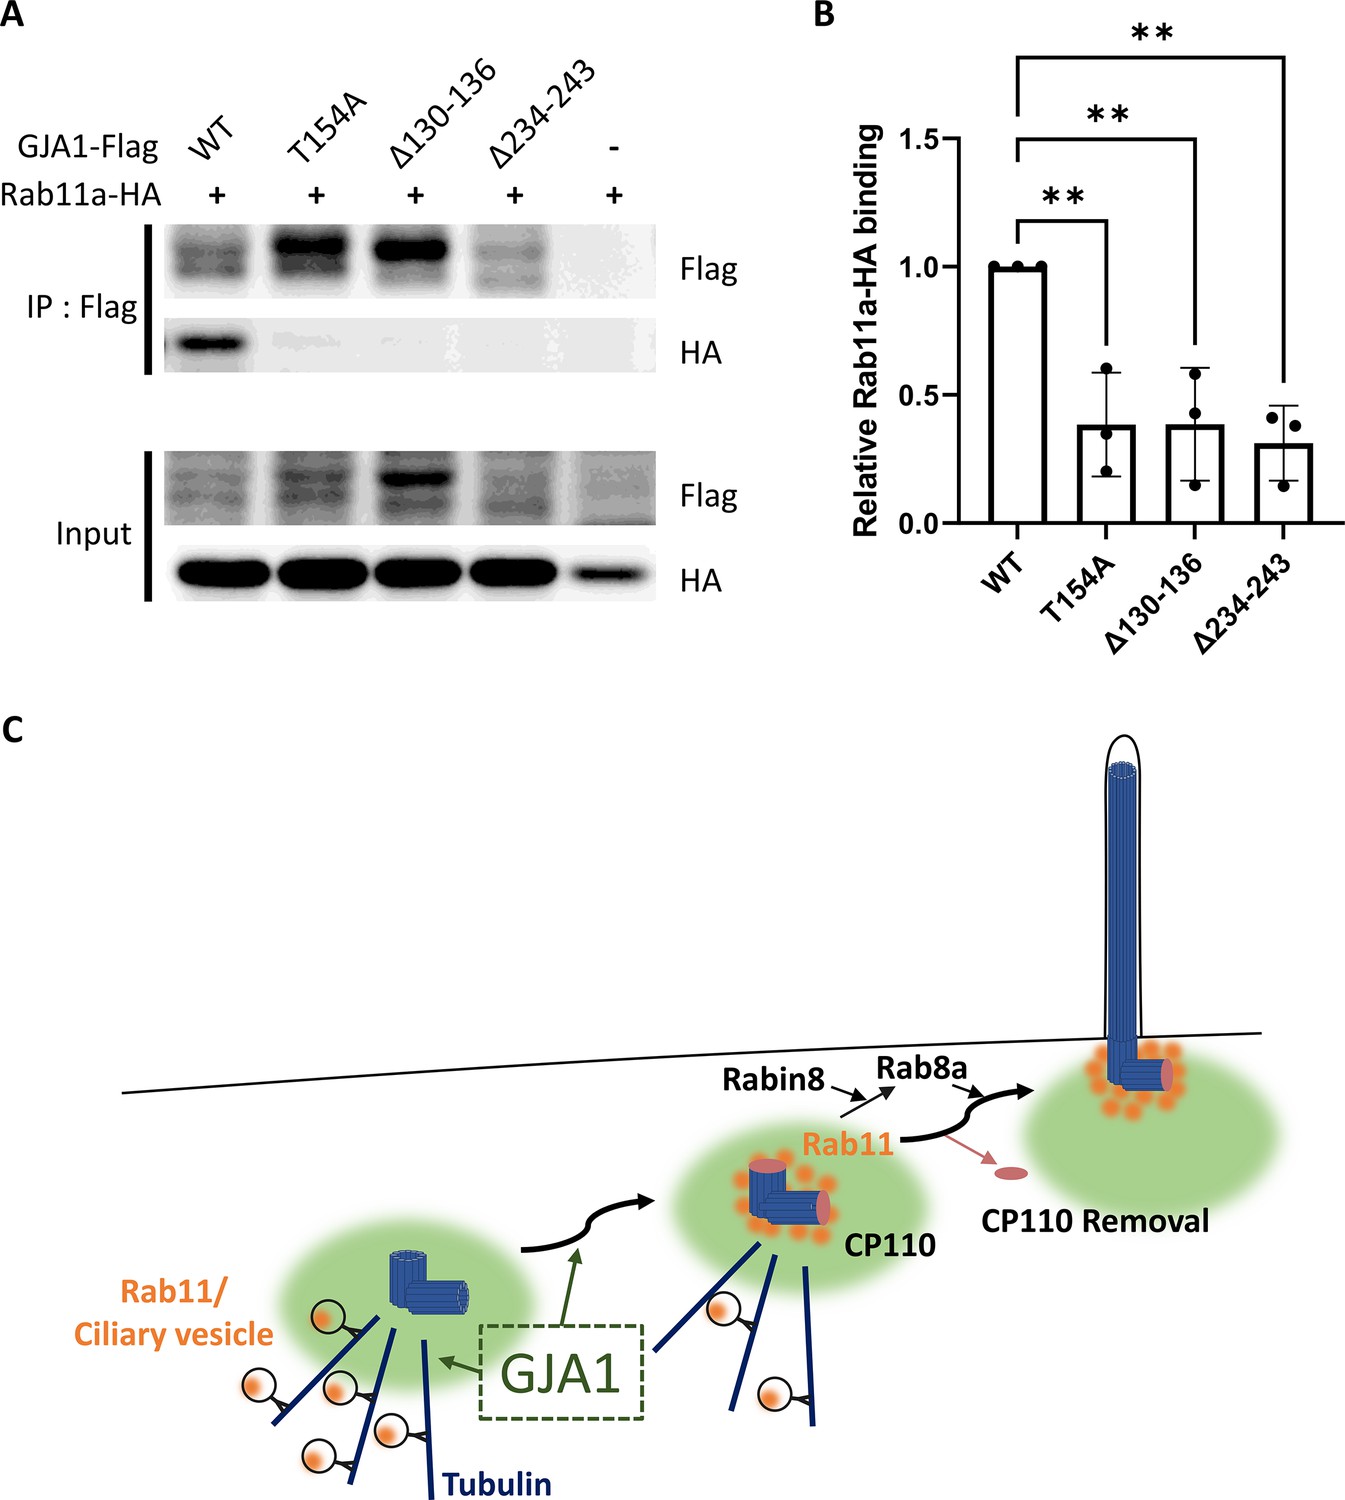
Dominant-negative mutant proteins of Xenopus laevis GJA1 fail to bind to Rab11.
(A) HA-tagged Rab11a and WT-GJA1-Flag or dnGJA1-Flag were co-expressed in RPE1 cells, and the lysates were used for immunoprecipitation assays with anti-flag antibody-conjugated beads. The immunoprecipitants were analyzed by immunoblotting with anti-flag or anti-HA antibodies. Rab11a-HA co-immunoprecipitated only with WT-GJA1-Flag. (B) Statistical analysis of the relative Rab11a-HA binding affinity to WT-GJA1-Flag or dnGJA1-Flag mutant proteins in panel (A). Error bars represent the mean ± SD. P values were determined by one-way ANOVA [p**=0.0050 (T154A, Δ130–136), p** = 0.0025 (Δ234–243)]. n=3(WT, T154A, Δ130-136, Δ234-243). Raw values are provided in the Figure 8—source data 1 file. (C) Suggested role of GJA1 during ciliogenesis. GJA1 is necessary for Rab11 positive vesicles trafficking to the vicinity of the basal bodies, thereby affecting CP110 removal to initiate ciliogenesis.
-
Figure 8—source data 1
The relative Rab11a-HA binding affinity to WT-GJA1-Flag or dnGJA1-Flag mutant proteins.
- https://cdn.elifesciences.org/articles/81016/elife-81016-fig8-data1-v2.xlsx
-
Figure 8—source data 2
The uncropped images of western blots.
- https://cdn.elifesciences.org/articles/81016/elife-81016-fig8-data2-v2.zip
Tables
Key resources table
| Reagent type (species) or resource | Designation | Source or reference | Identifiers | Additional information |
|---|---|---|---|---|
| Strain, strain background (Xenopus laevis) | Xenopus; Xenopus laevis | Korea National Research Resource Center (KNRRC) | KXRCR000001; KXRCR000002 | Materials and Methods 1. |
| Gene (Xenopus laevis) | GJA1 | Xenbase | XB-GENE-876609 | Materials and Methods 4. |
| Gene (Homo sapiens) | GJA1 | NCBI | Gene ID: 2697 | Materials and Methods 4. |
| Gene (Homo sapiens) | Rab11a | NCBI | Gene ID: 8766 | Materials and Methods 4. |
| Cell line (Homo sapiens) | hTERT-RPE1 | ATCC | Cat# CRL-4000; RRID:CVCL_4388 | Materials and Methods 2. |
| Sequence-based reagent | GJA1-MO | Gene Tools | XB-GENE-876609 | Materials and Methods 1.2. |
| Sequence-based reagent | GJA1-siRNA | Genolution | Gene ID: 2697 | Materials and Methods 2.1. |
| Antibody | Anti-CP110 (rabbit polyclonal) | Proteintech | 12780–1-AP; RRID:AB_10638480 | Materials and Methods 5. |
| Antibody | Anti-BBS4 (rabbit polyclonal) | Proteintech | 12766–1-AP; RRID:AB_10596774 | Materials and Methods 5. |
| Antibody | Anti-Rab11 (rabbit monoclonal) | Cell Signaling | #5589; RRID:AB_10693925 | Materials and Methods 5, 6. |
| Antibody | Anti-GJA1 (rabbit polyclonal) | ThermoFisher | PA1-25098; RRID:AB_779905 | Materials and Methods 5, 6, 7. |
| Antibody | Anti-GJA1 (mouse monoclonal) | ThermoFisher | 13–8300; RRID:AB_2533038 | Materials and Methods 5. |
Table 1
Primer information.
| Primer Name | Primer Sequences (5’ – 3’) |
|---|---|
| SalI-xlGJA1-Forward | aatgtcgacATGGGTGACTGGAGTGCCTTAGG |
| XbaI-xlGJA1-Backward | aattctagaGATCTCTAAATCATCAGGTCGTGGTCT |
| SalI-hGJA1-Forward | aatgtcgacATGGGTGACTGGAGCGCCT |
| XbaI-hGJA1-Backward | aattctagaGATCTCCAGGTCATCAGGCCG |
| point mut-xlGJA1-Forward | CGACATGGGGGATTGGAGCGCATTGGGAAGACTT |
| point mut-xlGJA1-Backward | AGTCTTCCCAATGCGCTCCAATCCCCCATGTCGA |
| point mut-hGJA1-Forward | TGAGATAAAGAAATTTAAATATGGAATAGAGGAGCATGGTAAGGTGAAA |
| point mut-hGJA1-Backward | CTTACCATGCTCCTCTATTCCATATTTAAATTTCTTTATCTCAATCTGC |
| SalI-hRab8a-Forward | aatgtcgacATGGCGAAGACCTACGATTACCTG |
| XbaI-hRab8a-Backward | aattctagaCAGAAGAACACATCGGAAAAAGCTG |
| SalI-hRab11a-Forward | aatgtcgacATGGGCACCCGCGACG |
| XbaI-hRab11a-Backward | aattctagaGATGTTCTGACAGCACTGCACCTT |
| xlGJA1-T154A-Forward | AAAGTCAAGATGCGAGGTGGACTGCTTCGCGCCTACATCATCAGCATTTTGTTTAAA |
| xlGJA1-T154A-Backward | TACTGATTTAAACAAAATGCTGATGATGTAGGCGCGAAGCAGTCCACCTCGCATCTT |
| xlGJA1-Δ130–136-Forward | ATGCACCTTAAACAATATGGCCTTGAAGAG |
| xlGJA1-Δ130–136-Backward | CTCTTCAAGGCCATATTGTTTAAGGTGCAT |
| xlGJA1-Δ234–243-Forward | TTCTATGTCACCTACAAAGACCCATTTTCT |
| xlGJA1-Δ234–243-Backward | AGAAAATGGGTCTTTGTAGGTGACATAGAA |
Additional files
-
Supplementary file 1
GJA1 IP-MS results.
Ciliogenesis genes (bold) and Ca2+ transport genes (italics) are indicated.
- https://cdn.elifesciences.org/articles/81016/elife-81016-supp1-v2.xlsx
-
MDAR checklist
- https://cdn.elifesciences.org/articles/81016/elife-81016-mdarchecklist1-v2.docx
Download links
A two-part list of links to download the article, or parts of the article, in various formats.
Downloads (link to download the article as PDF)
Open citations (links to open the citations from this article in various online reference manager services)
Cite this article (links to download the citations from this article in formats compatible with various reference manager tools)
GJA1 depletion causes ciliary defects by affecting Rab11 trafficking to the ciliary base
eLife 11:e81016.
https://doi.org/10.7554/eLife.81016


