Selection on plastic adherence leads to hyper-multicellular strains and incidental virulence in the budding yeast
- Department of Biology, College of William and Mary, United States
Figures
Figure 1 with 1 supplement
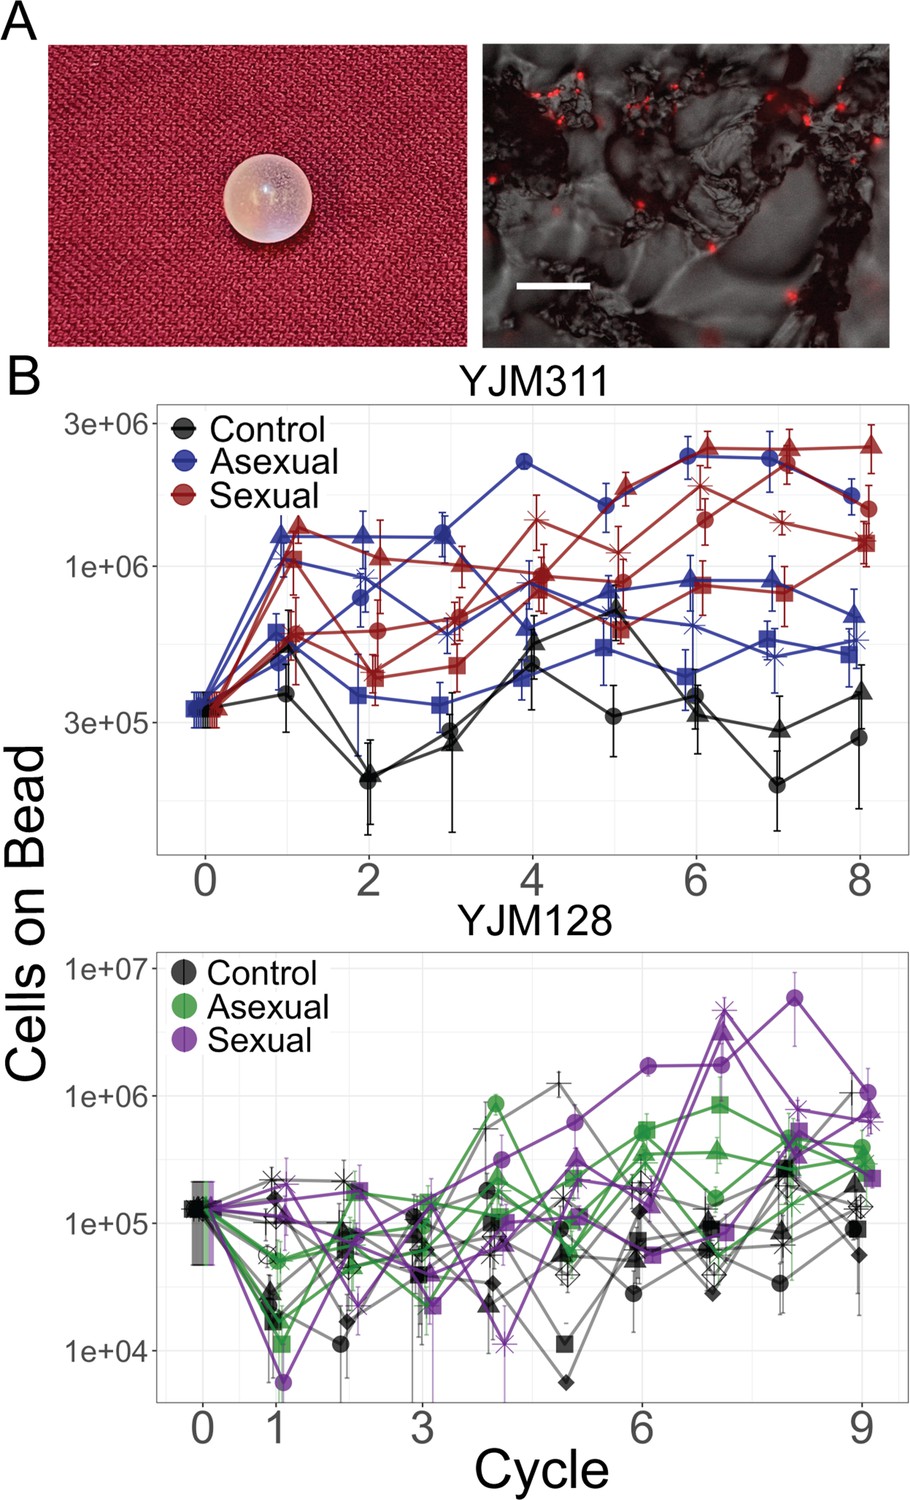
Evolution of bead adherence.
(A) Image of a 7 mm experimental bead; close-up image with attached cells expressing mCherry, scale bar represents 50 µm. (B) Whole population-bead adherence of replicate populations over the experimental cycles, as estimated at the end of the experiment from cryopreserved stocks. All replicates of one background were grown and measured in one assay to test their adherence ability (including control populations that were not evolved in the presence of a bead). Y-axis plots the number of cells adhering to a plastic bead on a log scale, as estimated by hemocytometer counts (± S.E.M.). Along with the ancestral timepoint, for each population at each timepoint, cells from eight replicate beads were counted in YJM311 (670 beads in total); for YJM128, four replicate beads were counted (542 beads in total).
-
Figure 1—source data 1
Counts of cells that adhered to plastic beads grown with replicate populations at different timepoints from YJM311/HMY7-derived populations.
- https://cdn.elifesciences.org/articles/81056/elife-81056-fig1-data1-v2.csv
-
Figure 1—source data 2
Counts of cells that adhered to plastic beads grown with replicate populations at different timepoints from YJM128/HMY355-derived populations.
- https://cdn.elifesciences.org/articles/81056/elife-81056-fig1-data2-v2.csv
Figure 1—figure supplement 1
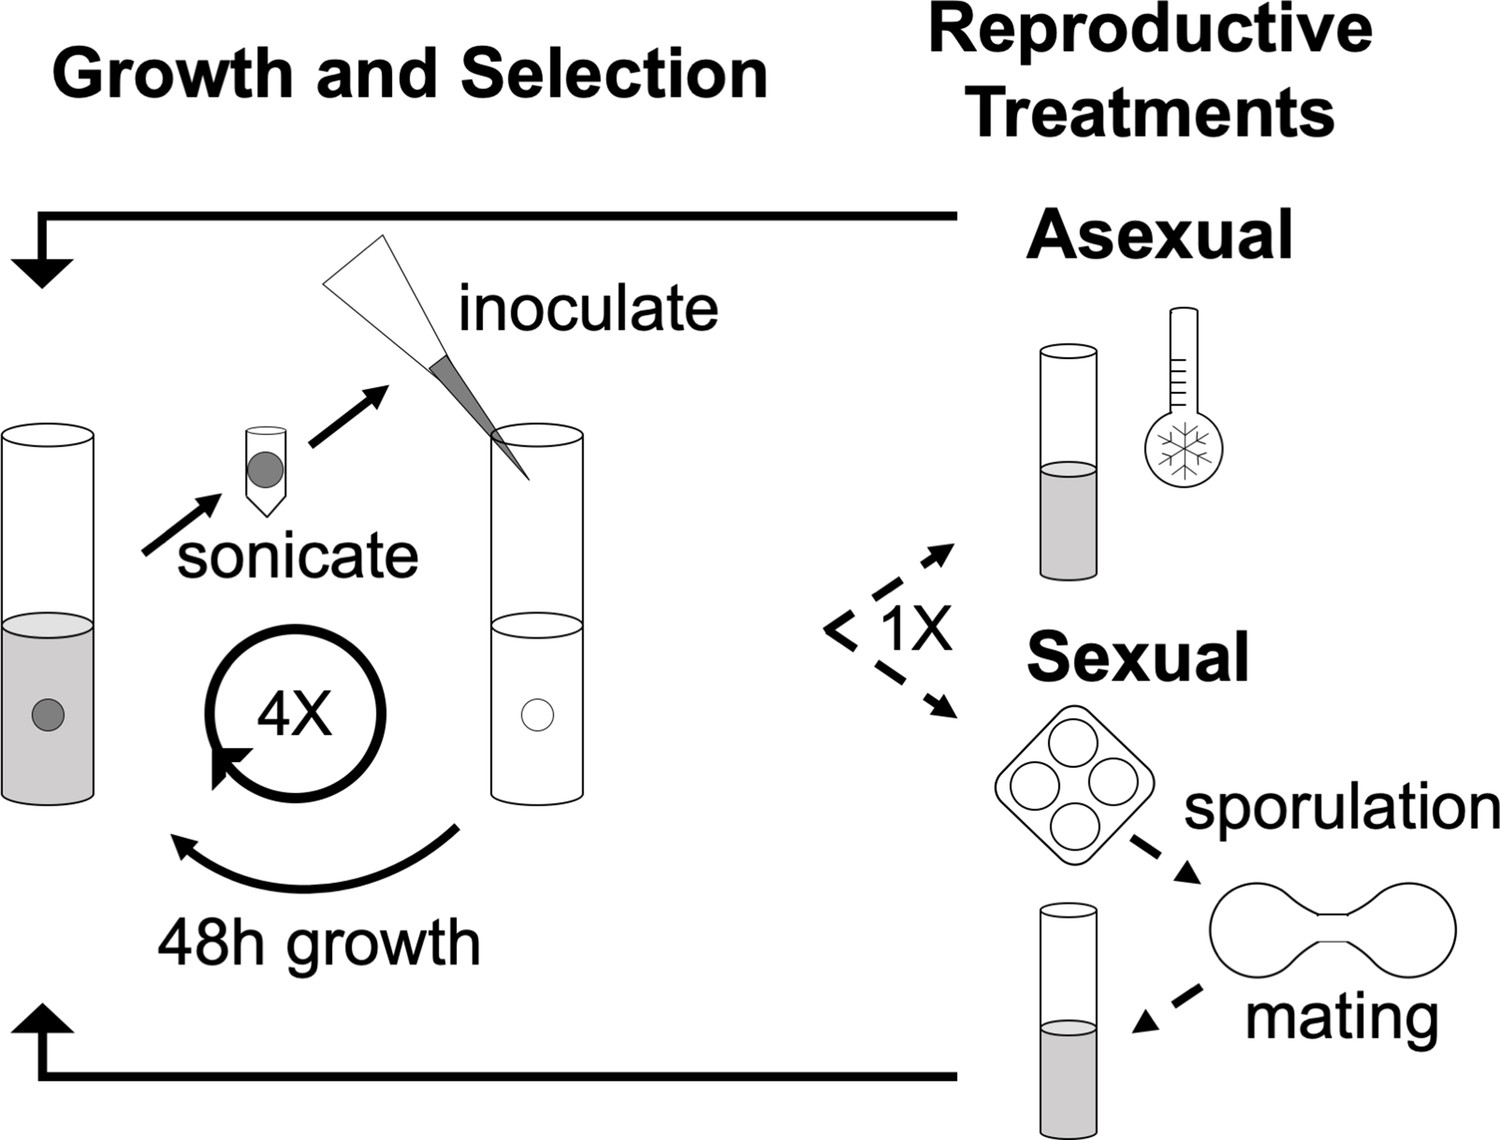
Schematic of the Experimental Cycle.
Solid arrows represent steps in serial transfer; dashed lines represent punctuated sexual treatments. Populations were evolved on a 12-day cycle. In each cycle, populations were grown in 10 ml of minimal medium in a glass tube containing a sterile 7 mm polystyrene bead for 48 hr with rotation. The bead was removed, washed, suspended in water, and gently sonicated to detach cells from the bead. The cell suspension was used to inoculate the next 10 ml tube. After four serial transfers, asexual populations were refrigerated and sexual populations were sporulated for 48 hr. Asci were digested, germinated and mated. Refrigerated cultures and mated spores were used to begin the next 12-day cycle.
Figure 2 with 2 supplements
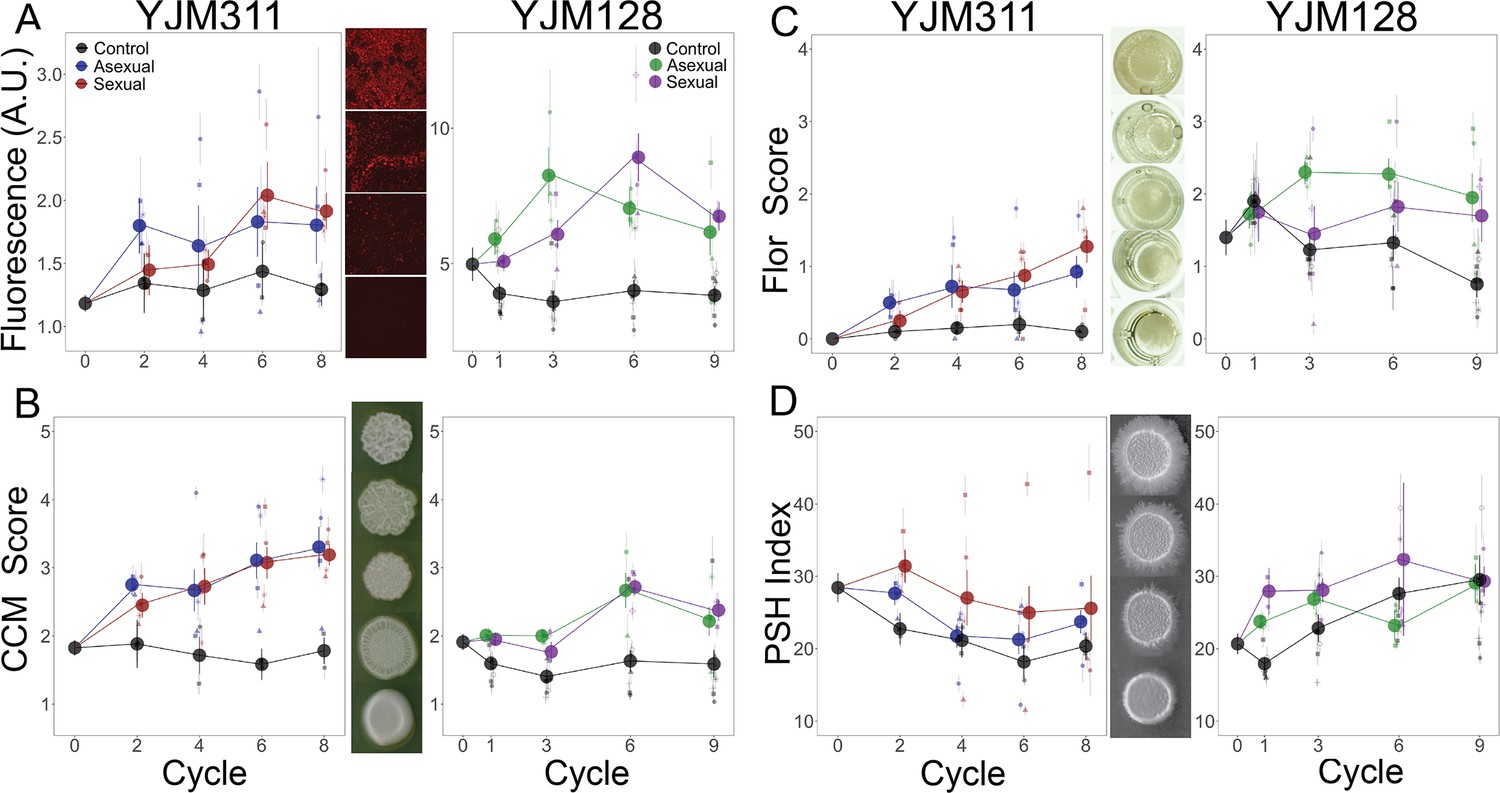
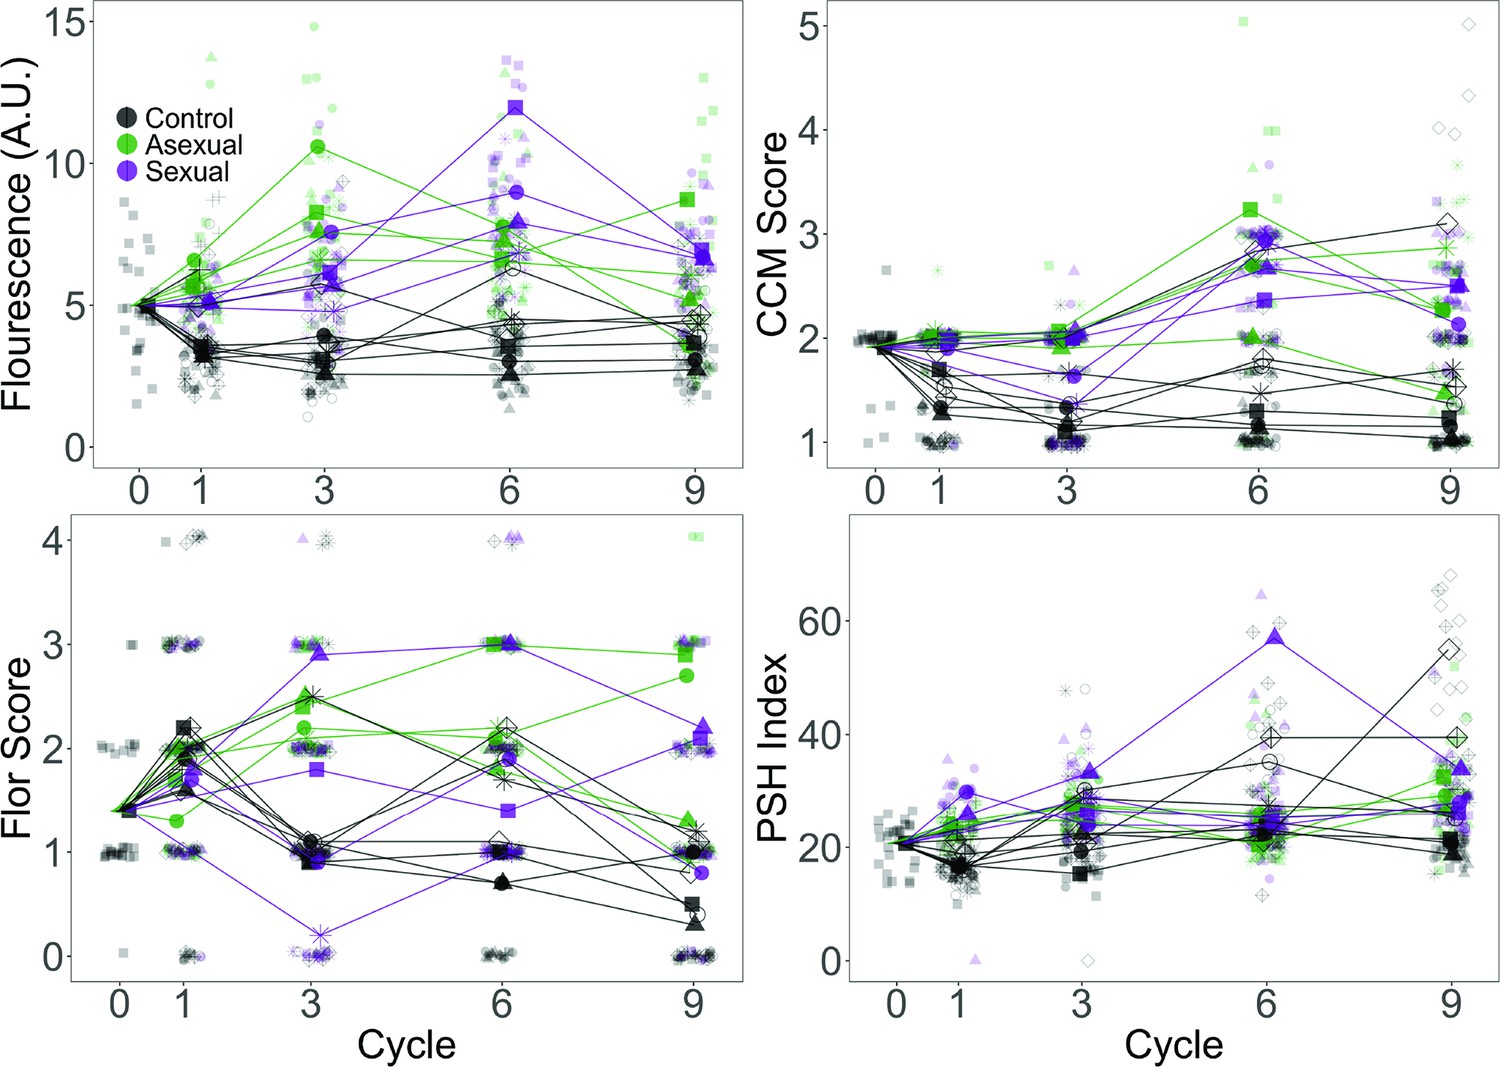
Evolution of multicellular phenotypes.
Ten clones were isolated from each population at four timepoints and assayed in triplicate (except for flor formation, which had a single replicate). In all panels, large points represent the average of a treatment (asexual, sexual, control) ± 2 s.e.m.; smaller points represent the average of a replicate population ± s.e.m. Data at cycle 0 represent the average of 20 ancestral segregants. Representative images demonstrate the variation found in the phenotypes. (A) Plastic adherence was estimated by measuring the fluorescent signal of cells that adhered to the bottom of of a black, clear-bottom 96-well plate. (B) CCM was scored after growth on solid, glucose-limiting medium using the scale on the right, with 1 representing no biofilm and 5 the most structured colonies. (C) Flor formation was scored after growth in minimal medium using the scale on the right, with 0 representing no floating cells and 4 representing a full mat. (D) PSH was scored after growth on solid nitrogen-limiting medium. Images were processed to determine the percentage of growth pixels that were pseudohyphal compared to the central colony. The trajectory of replicate populations from each ancestral background can be found in Figure 2—figure supplements 1 and 2.
-
Figure 2—source data 1
Plastic adherence, biofilm, flor, and PSH measurements for ancestor and evolved clones from the YJM311/HMY7-derived replicate populations.
- https://cdn.elifesciences.org/articles/81056/elife-81056-fig2-data1-v2.csv
-
Figure 2—source data 2
Plastic adherence, biofilm, flor, and PSH measurements for ancestor and evolved clones from the YJM/128HMY355-derived replicate populations.
- https://cdn.elifesciences.org/articles/81056/elife-81056-fig2-data2-v2.csv
Figure 2—figure supplement 1
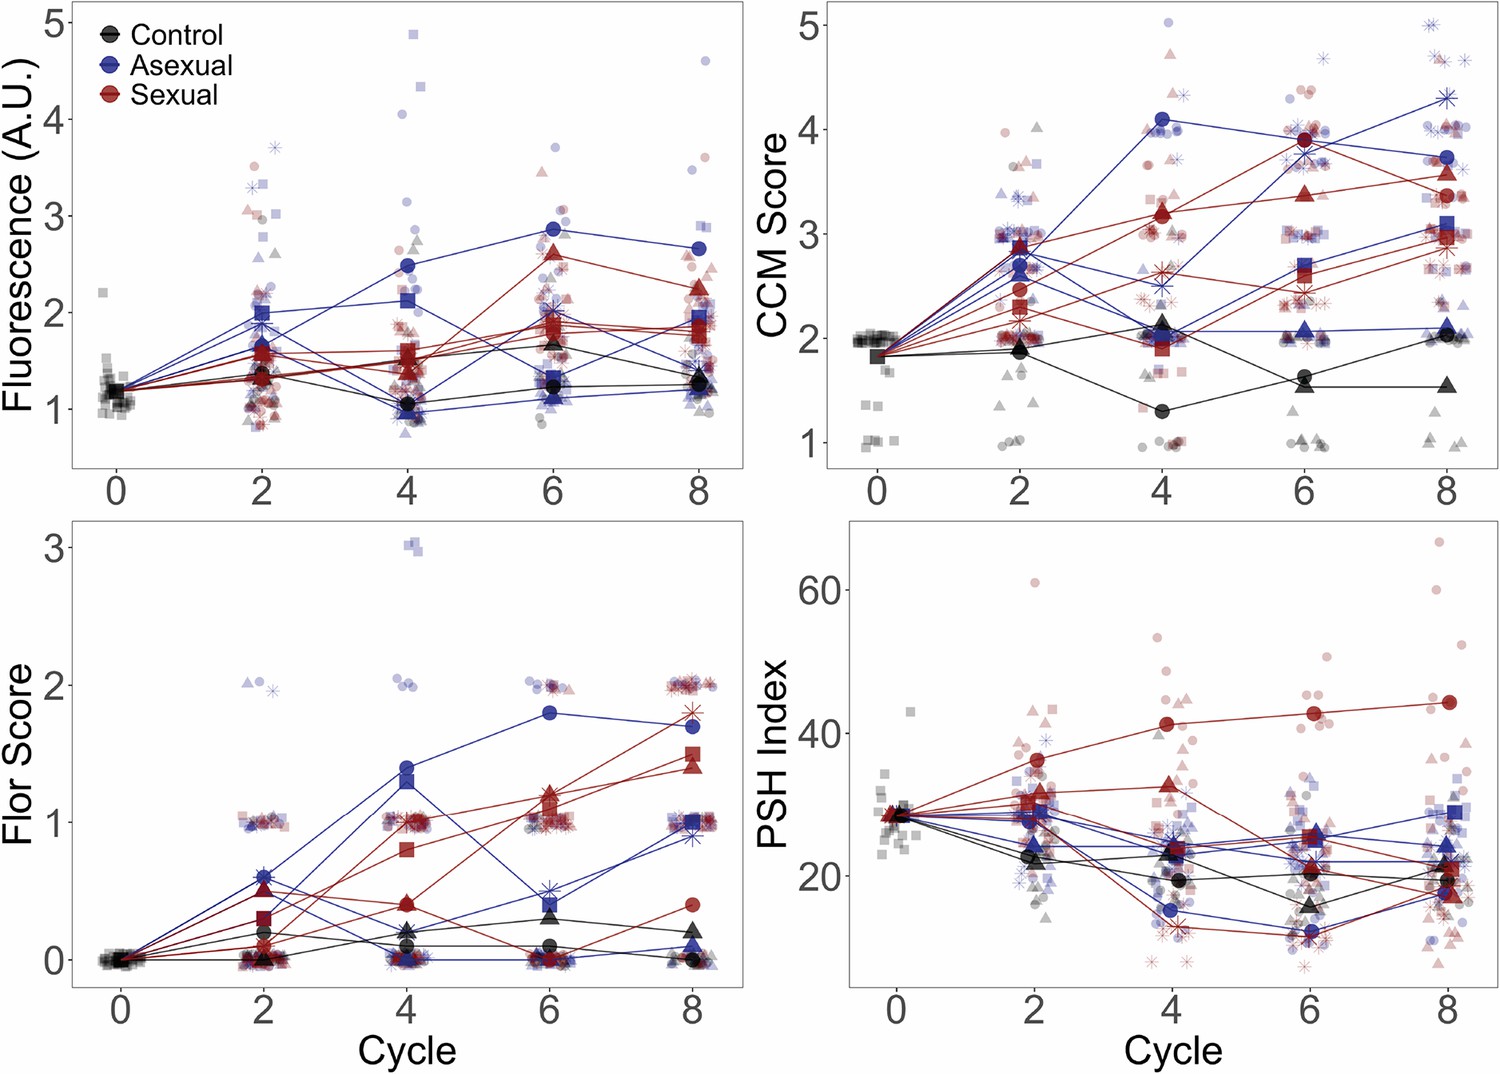
Evolved phenotypes by replicate population for the YJM311 background.
Phenotypes were assessed as in Figure 2. Larger points represent replicate population averages, with each replicate represented by a different shape/color combination (as in Figure 4); smaller points represent measurements from individual clones. Fluorescence, CCM, and PSH are average values of three replicate measurements per clone; Flor is based on one replicate.
Figure 2—figure supplement 2
Evolved phenotypes by replicate population for the YJM128 background.
Phenotypes were assessed as in Figure 2. Larger points represent replicate population averages, with each replicate represented by a different shape/color combination (as in Figure 4); smaller points represent measurements from individual clones. Fluorescence, CCM, and PSH are average values of three replicate measurements per clone; Flor is based on one replicate.
Figure 3 with 4 supplements
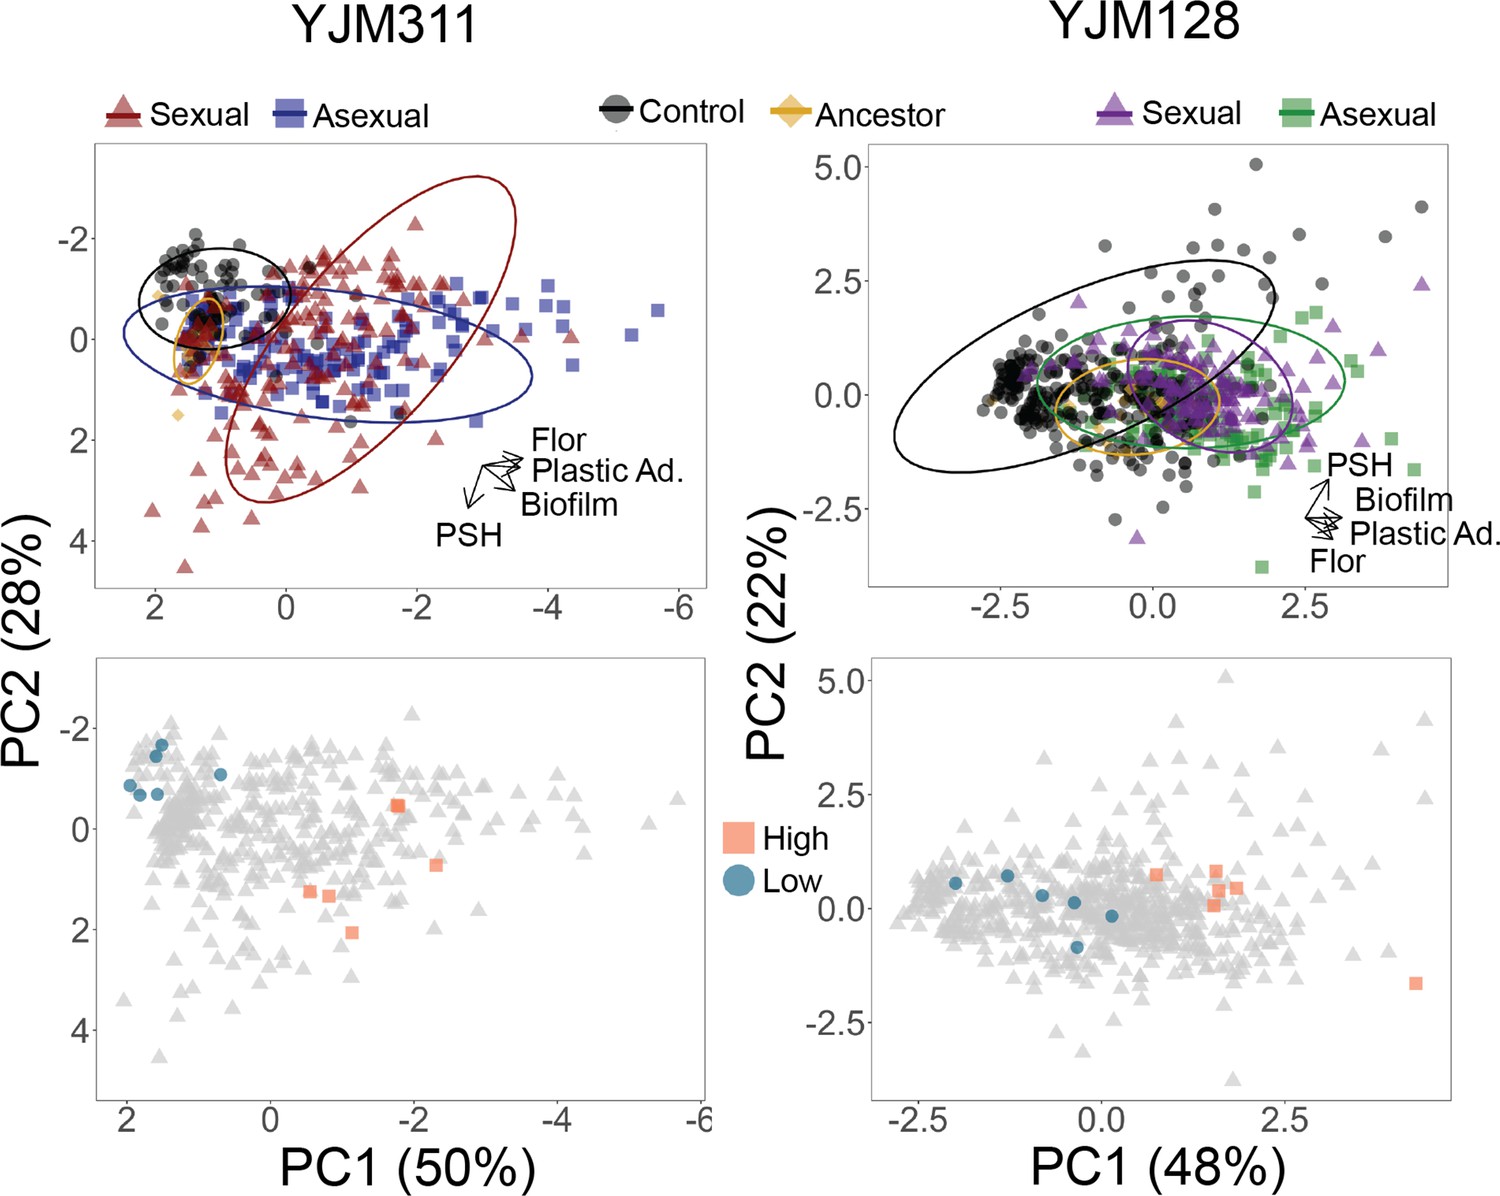
Evolved multicellularity.
(Top panel) Principal components analysis of clones from ancestral and evolved populations. The loadings of PC1 for YJM311 were –0.616*Flor - 0.573*PA - 0.493*CCM +0.221*PSH; for PC2, they were 0.851*PSH +0.506*CCM - 0.137*Flor. In YJM128, the loadings of PC1 were 0.601*CCM +0.535*PA +0.451*Flor +0.386*PSH; for PC2, they were 0.852*PSH - 0.226*PA - 0.472*Flor. PCA with population and cycle information can be found in Figure 3—figure supplements 1 and 2, while individual correlations can be found in Figure 3—figure supplements 3 and 4. (Bottom panel) Principal components analysis with highlighted points representing strains chosen for virulence assays: blue circles represent low multicellularity clones; orange squares represent hyper-multicellular clones; gray triangles represent the rest of the clonal panel. In YJM311, the non-multicellular clones were chosen from ancestral and control populations, while in YJM128, they were chosen from ancestral and early experimental populations.
-
Figure 3—source data 1
Survival data for wax moth larvae injected with strains from YJM311/HMY7-derived populations.
- https://cdn.elifesciences.org/articles/81056/elife-81056-fig3-data1-v2.csv
-
Figure 3—source data 2
Survival data for wax moth larvae injected with strains from YJM128/HMY355-derived populations.
- https://cdn.elifesciences.org/articles/81056/elife-81056-fig3-data2-v2.csv
Figure 3—figure supplement 1
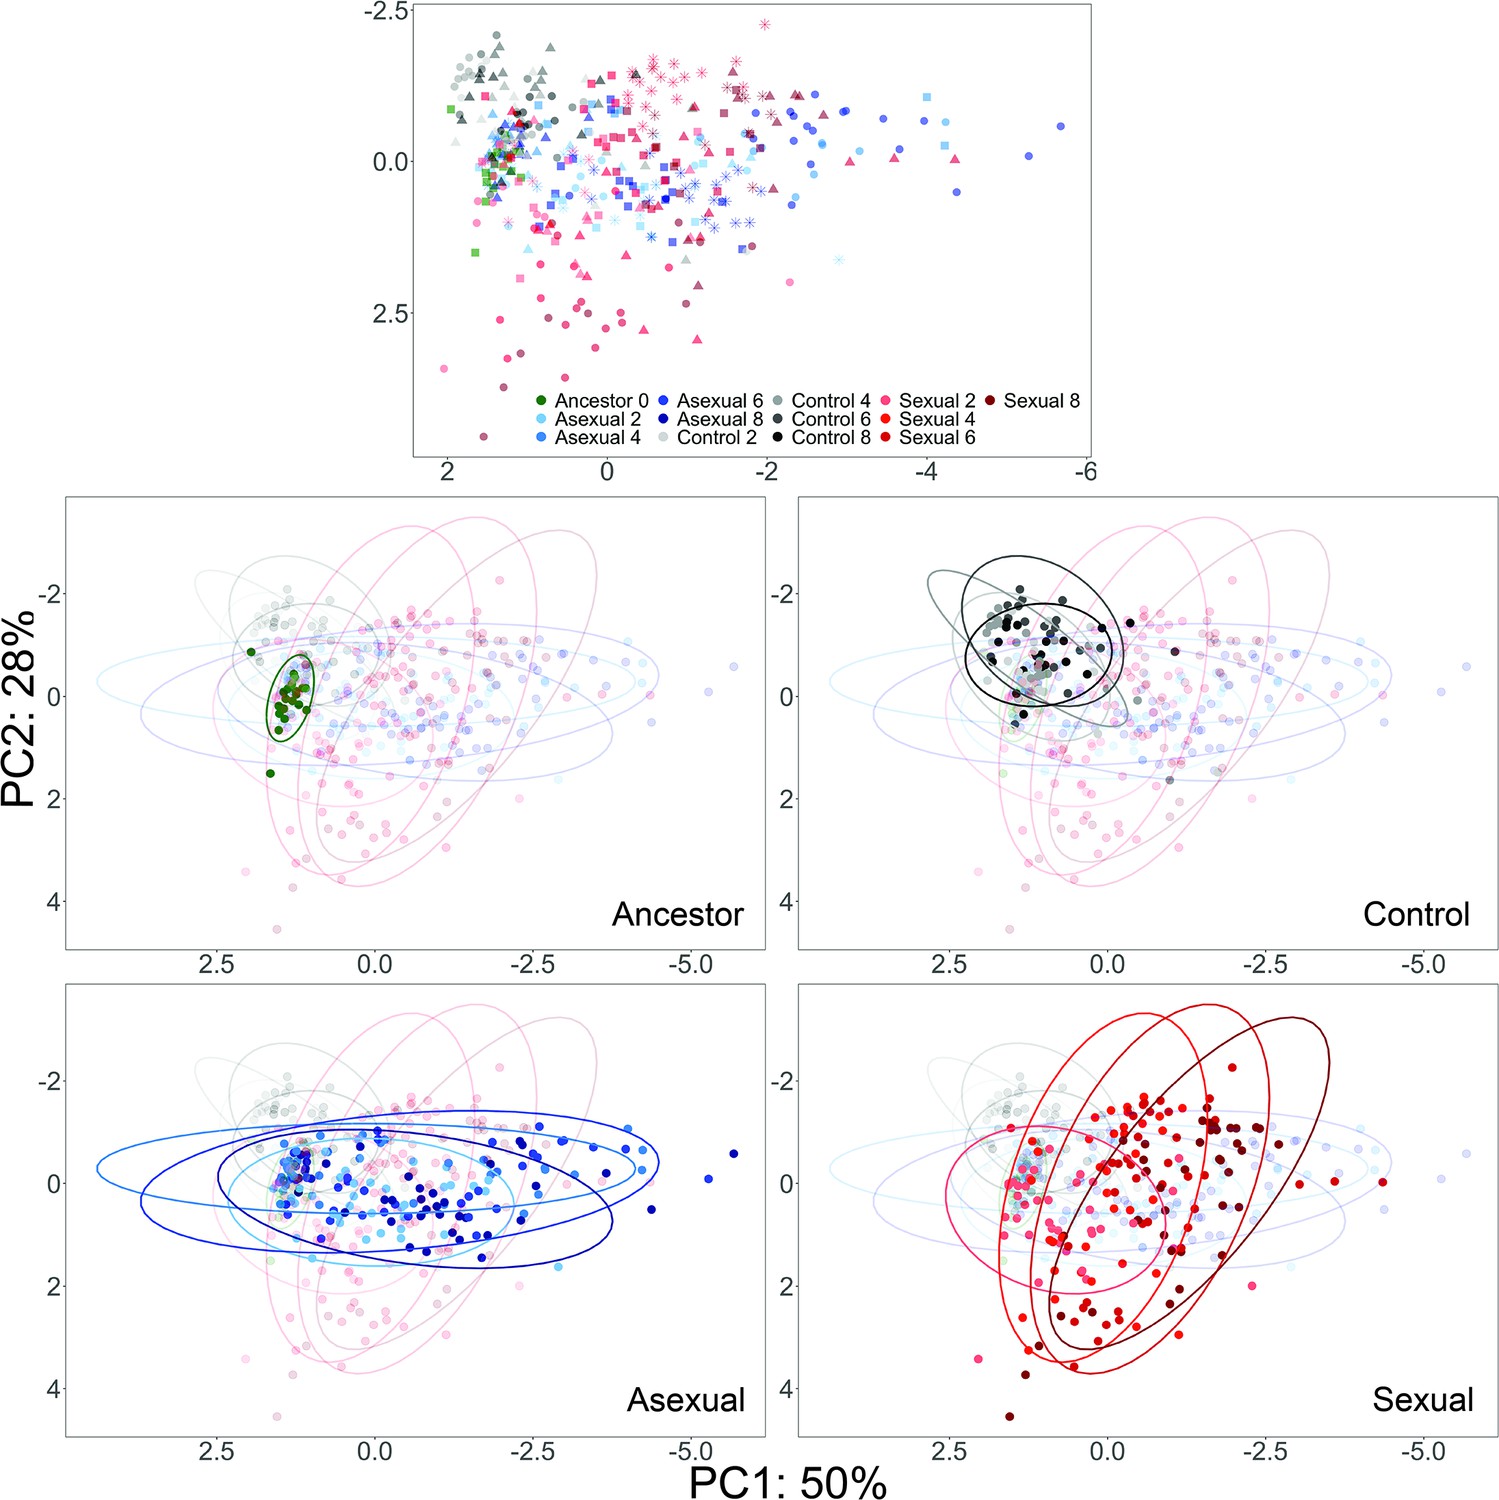
PCA of YJM311 Evolved Populations.
Each point represents a single clone; ancestor- green, control- gray through black, asexual- light blue through dark blue, sexual- light red through dark red. Colors become darker as cycle number increases. In the first panel, shapes as in Figure 4 to highlight different replicate populations.
Figure 3—figure supplement 2
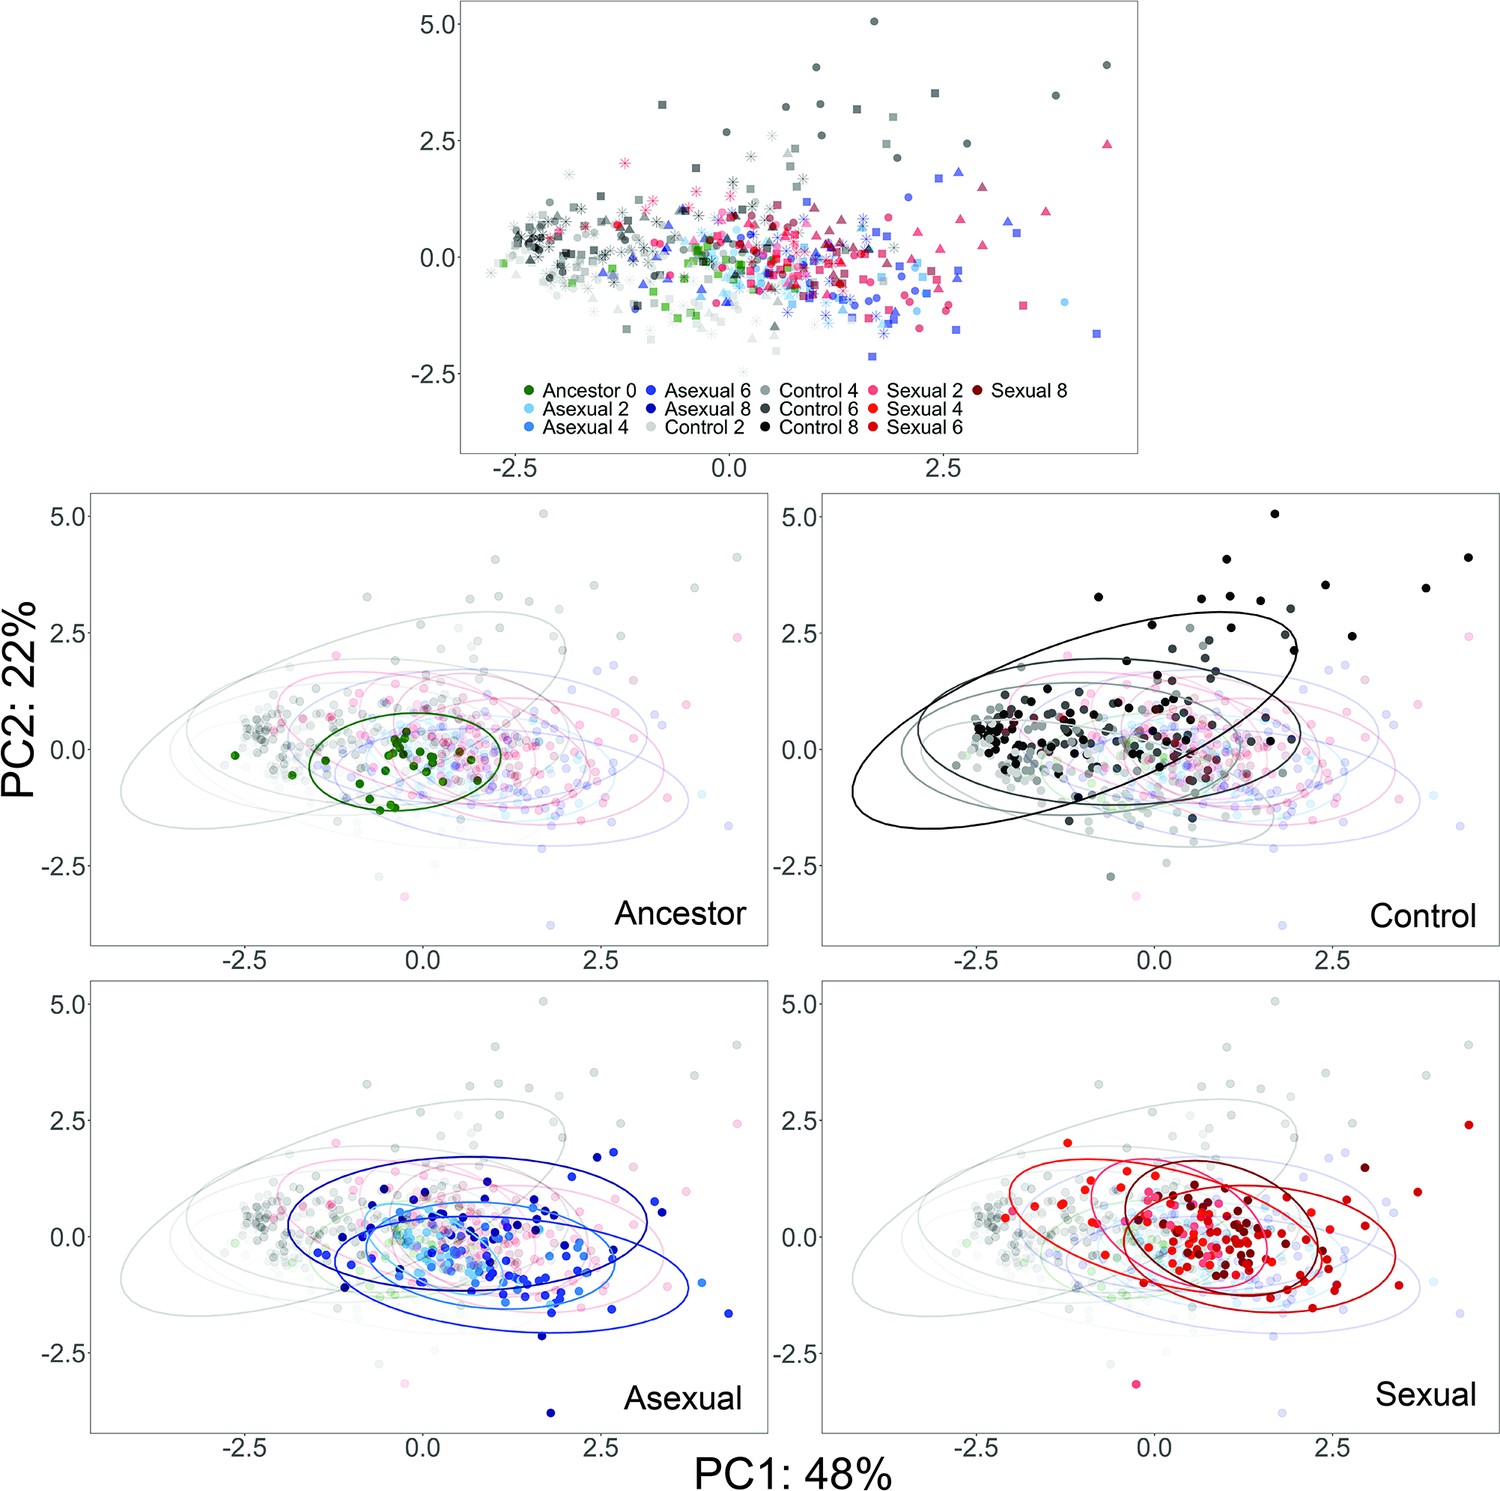
PCA of YJM128 evolved populations.
Each point represents a single clone; ancestor- green, control- gray through black, asexual- light blue through dark blue, sexual- light red through dark red. Colors become darker as cycle number increases. In the first panel, shapes as in Figure 4 to highlight different replicate populations.
Figure 3—figure supplement 3
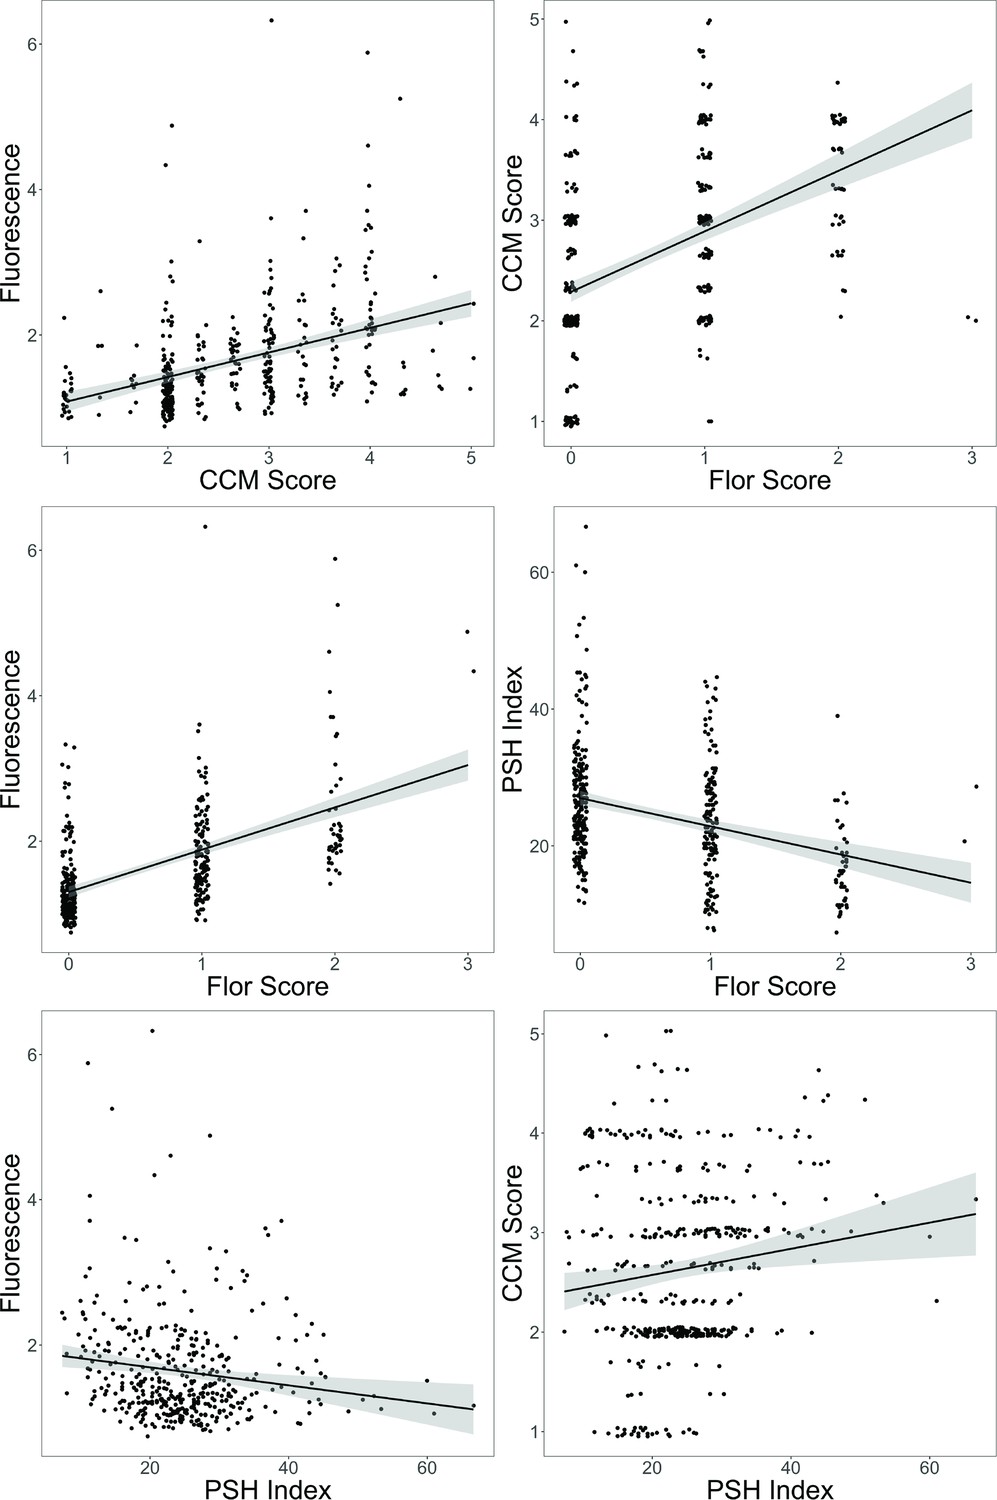
Correlations among phenotypes for individual clones from YJM311 populations.
All correlations were significant with p<0.001. The adjusted R2 for the relationships are as follows: PA vs. CCM: 0.167, PA vs. Flor: 0.306, PA vs. PSH: 0.020, CCM vs. Flor: 0.220, PSH vs Flor: 0.105, CCM vs. PSH: 0.015. Despite the statistical significance, most of these correlations explain little of the variance in the data; the presence of one multicellular phenotype does not necessarily predict the presence of another.
Figure 3—figure supplement 4
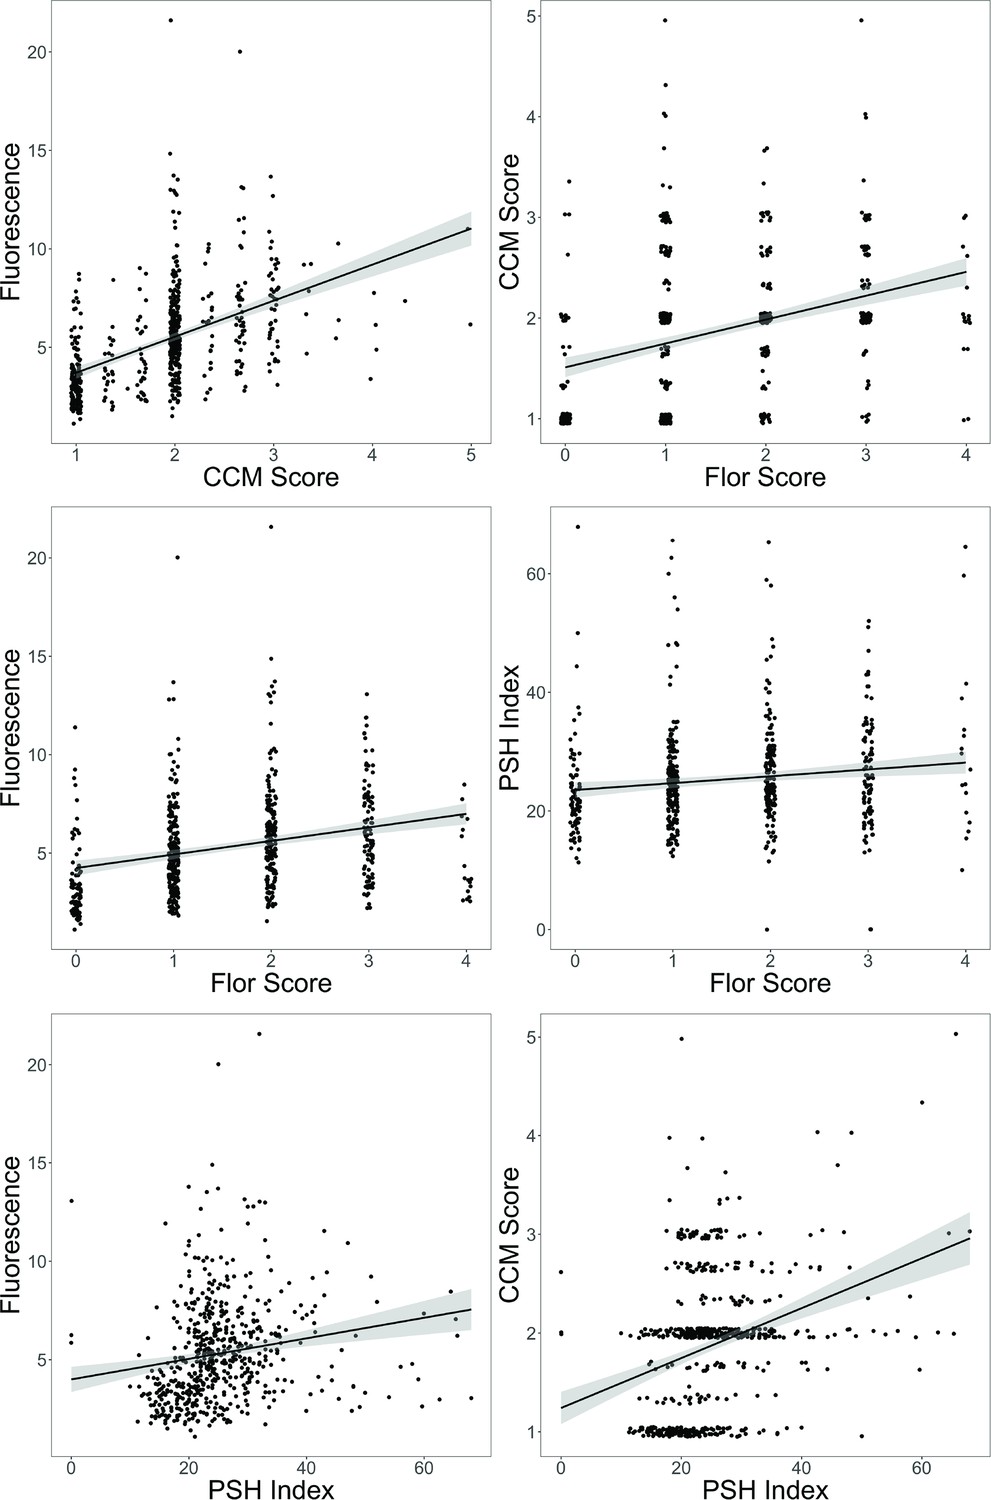
Correlations among phenotypes for individual clones from YJM128 populations.
All correlations were significant with p<0.001. The adjusted R2 for the relationships are as follows: PA vs. CCM: 0.235, PA vs. Flor: 0.071, PA vs. PSH: 0.0294, CCM vs. Flor: 0.121, PSH vs Flor: 0.0162, CCM vs. PSH: 0.102. Despite the statistical significance, most of these correlations explain little of the variance in the data; the presence of one multicellular phenotype does not necessarily predict the presence of another.
Figure 4 with 2 supplements
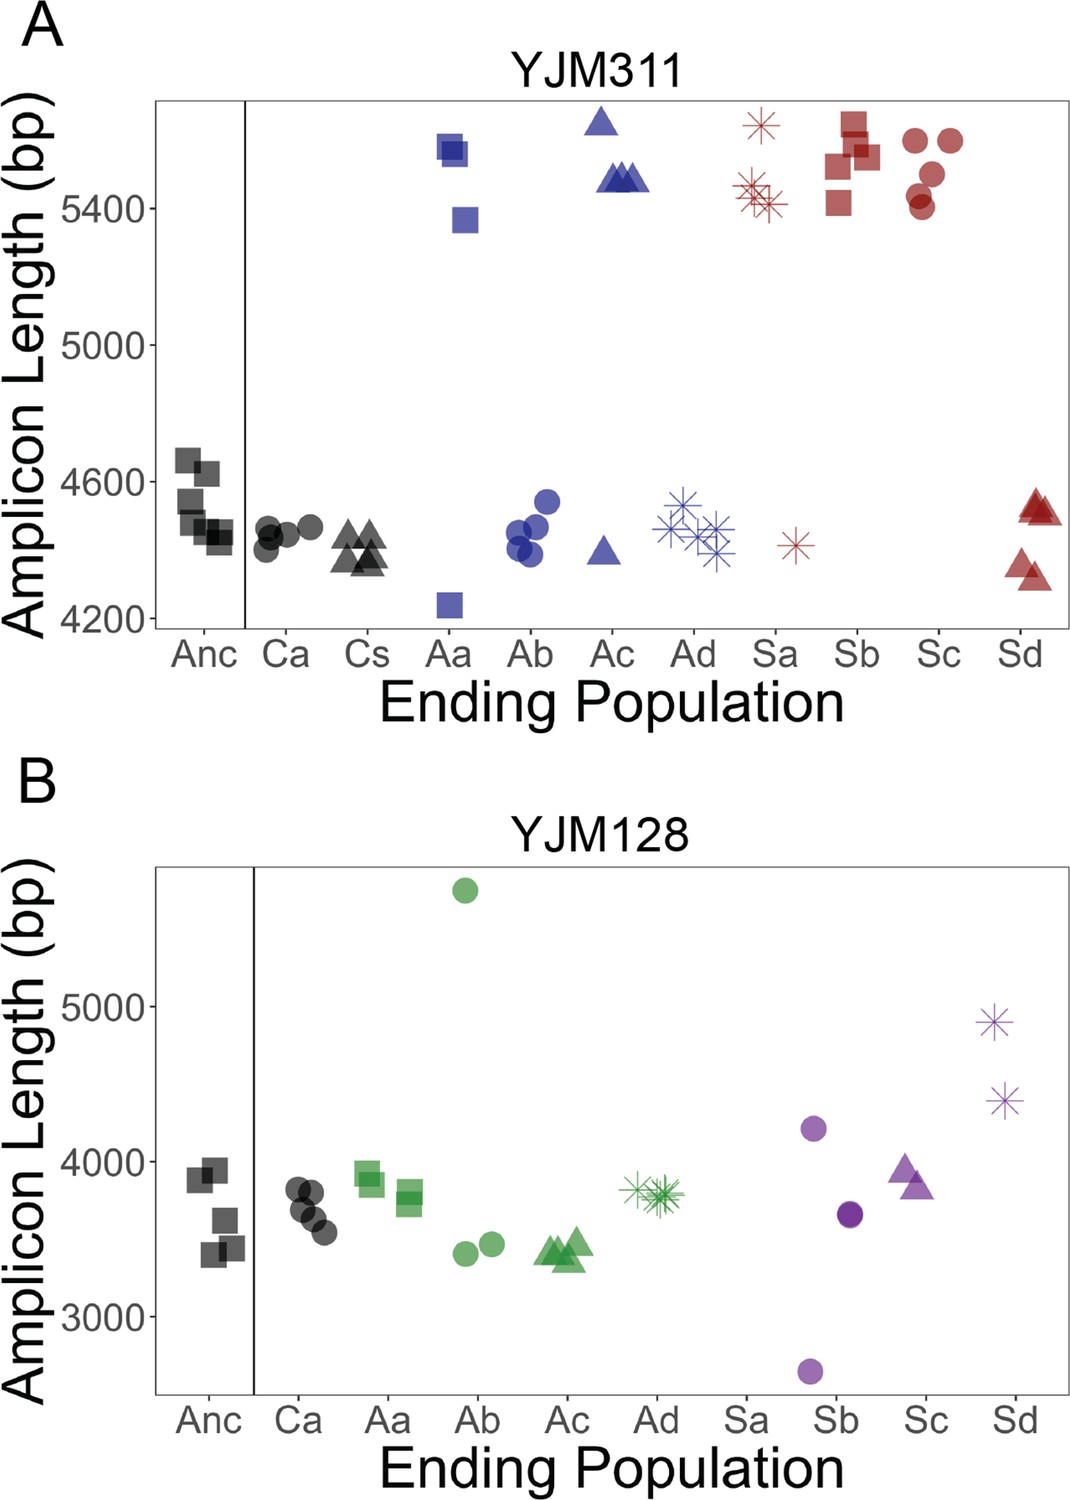
FLO11 length evolution.
In 8 ancestral clones and 5 clones per replicate population at the final cycle, the full gene was amplified and run through a BioAnalyzer to determine its length. Amplicons of this length have an accuracy of ±100 bp. x-axis: Anc refers to ancestor, A to asexual populations, and S to sexual populations, while a-d denote replicates; C refers to control populations, and a and s refer to the asexual and sexual controls, respectively. (A) In YJM311, it appears there were two major length alleles, with the possibility of derived variants with smaller changes in length. (B) In YJM128, it appears there were also two alleles, separated by ~500 bp. Clones from the final timepoint show variation in length. Correlations between length and different adherence phenotypes can be found in Figure 4—figure supplements 1 and 2.
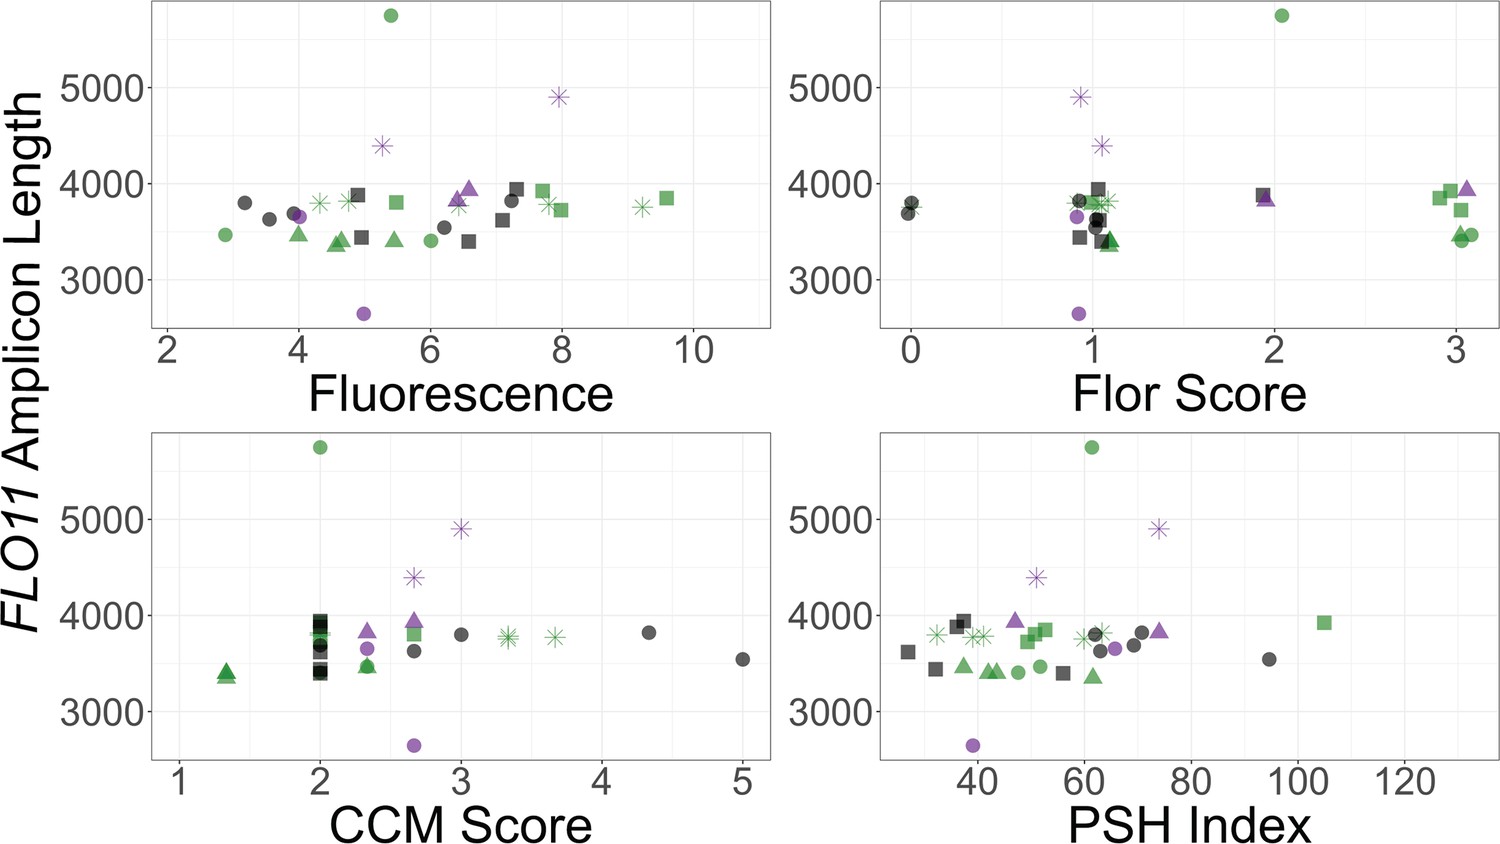
Figure 4—figure supplement 1
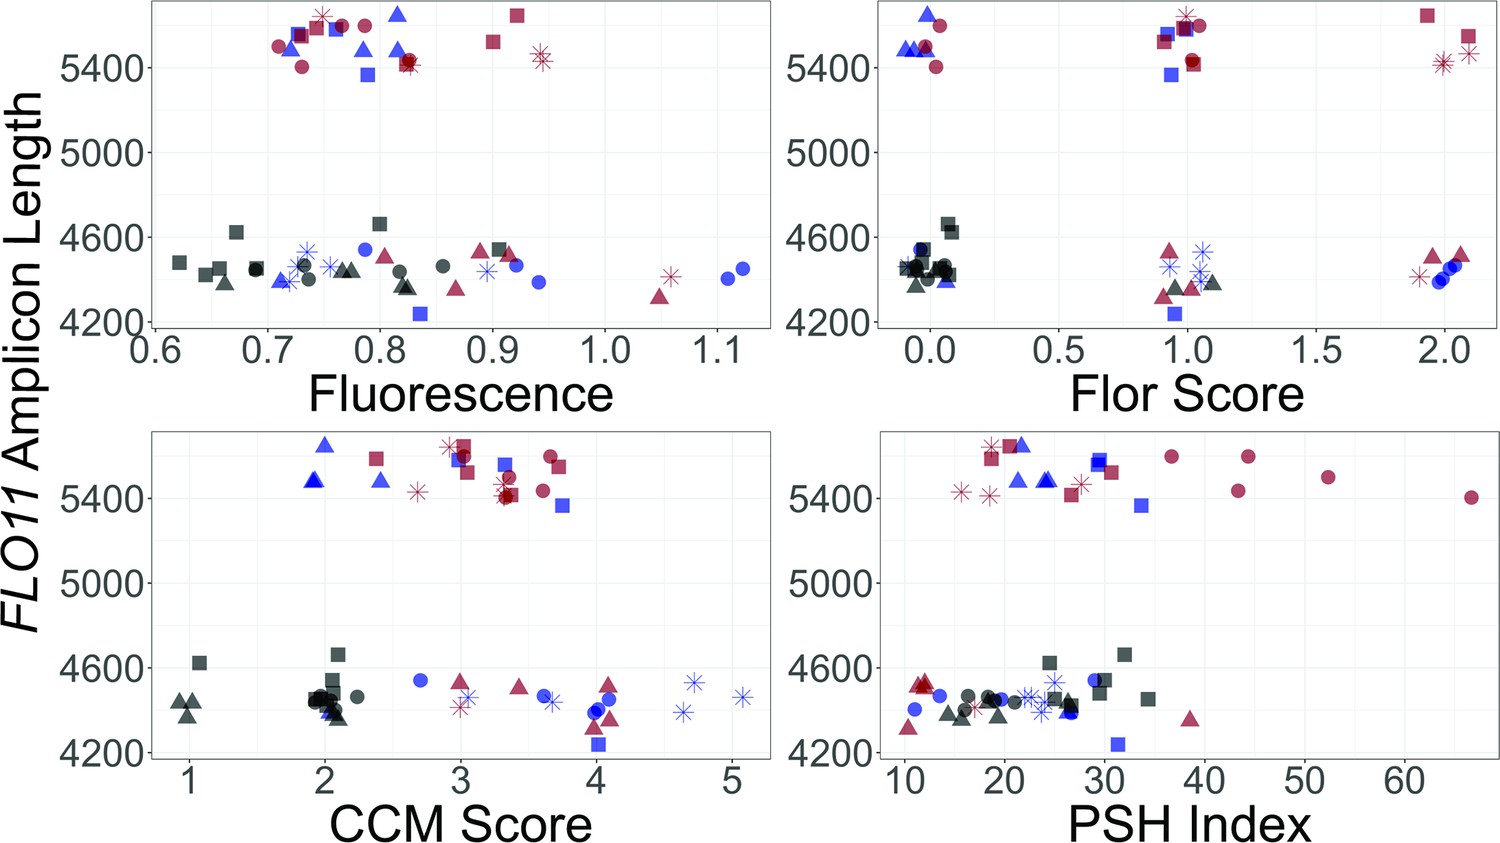
FLO11 Length by Phenotype for the YJM311 Background.
FLO11 length measurements, point shapes and point colors as in Figure 4. Each panel plots the allele length for a clone with one of its phenotypic measurements.
Figure 4—figure supplement 2
FLO11 length by phenotype for the YJM128 background.
FLO11 length measurements, point shapes and point colors as in Figure 3. Each panel plots the allele length for a clone with one of its phenotypic measurements.
Figure 5
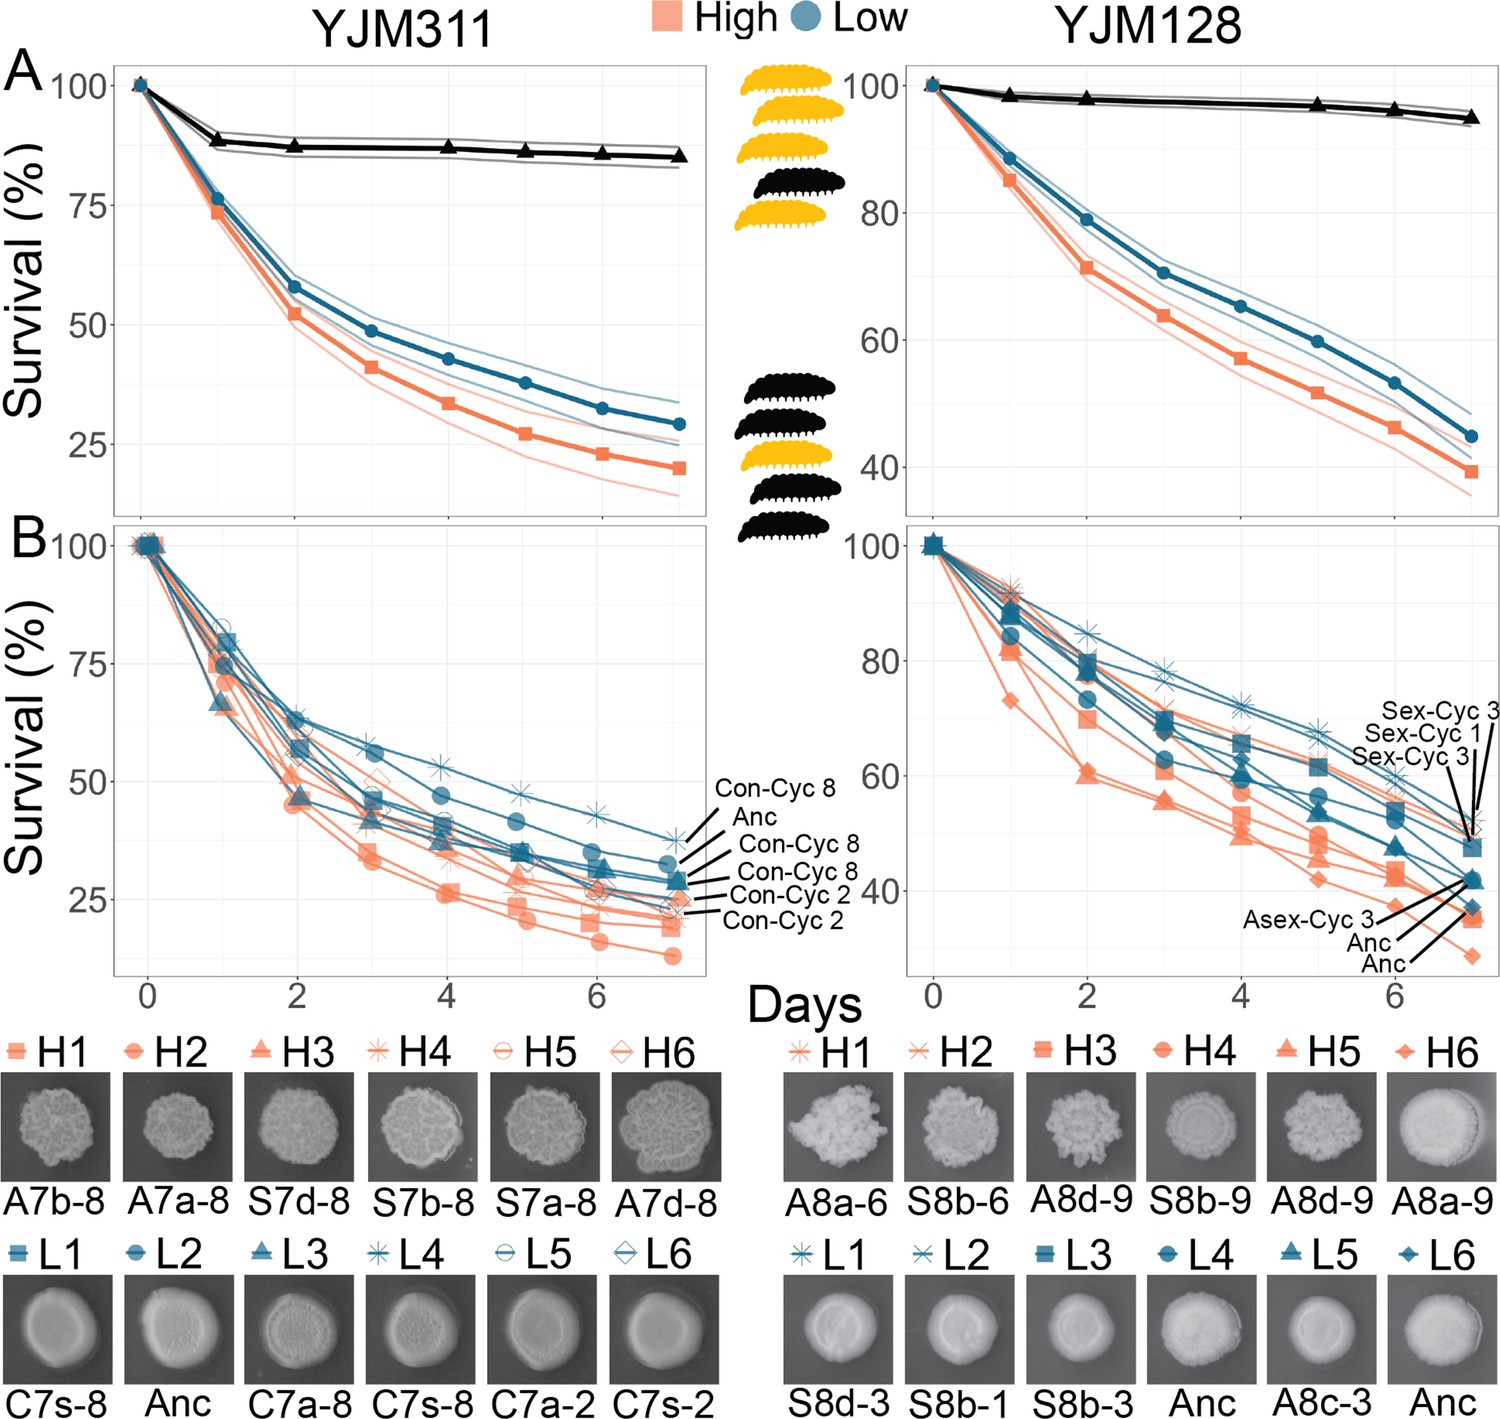
Virulence of Evolved Populations.
G. mellonella survival curves for strains highlighted in Figure 3; each strain was injected into 200 larvae for YJM311-derived clones or 180 larvae for YJM128-derived clones. Points represent Kaplan-Meier estimates. (A) Survival curves with confidence limits for non- and hyper-multicellular treatments; black triangles represents the control treatment injected with sterile water. (B) Survival for individual strains along with associated CCM images. The low multicellular curves are labeled for ease of identification. Strains used in survival analyses can be found in Supplementary file 1a and b.
Tables
Key resources table
| Reagent type (species) or resource | Designation | Source or reference | Identifiers | Additional information |
|---|---|---|---|---|
| Gene (Saccharomyces cerevisiae) | FLO11 | Saccharomyces Genome Database | YIR019C | |
| Strain, strain background (Saccharomyces cerevisiae) | YJM311 | Gift from Paul Magwene at Duke | ||
| Strain, strain background (Saccharomyces cerevisiae) | YJM128 | Gift from Paul Magwene at Duke | ||
| Genetic reagent (Saccharomyces cerevisiae) | HMY7 | This paper | YJM311 homozygous for PGK1 tagged with mCherry-KanMX | |
| Genetic reagent (Saccharomyces cerevisiae) | HMY355 | This paper | YJM128 homozygous for PGK1 tagged with mCherry-HygMX | |
| Biological sample (Galleria mellonella) | Galleria mellonella larvae | Vanderhorst Wholesale Inc. | https://www.waxworms.net/ | |
| Recombinant DNA reagent | pBS34 | Addgene | RRID: Addgene_83796 | Source of mCherry for tagging original strains |
| Sequence-based reagent | FLO11-for | This paper | PCR primers | GCCTCAAAA ATCCATATA CGCACACTA TG |
| Sequence-based reagent | FLO11-rev | This paper | PCR primers | TTAGAATAC AACTGGAAG AGCGAGTAG |
| Commercial assay or kit | MasterPure Yeast DNA Purification Kit | Lucigen | Cat #: MPY80200 | DNA extraction kit |
| Commercial assay or kit | Agilent DNA 7500 kit | Agilent | Cat #: 5067–1506 | PCR product length analysis kit |
| Other | 7 mm polystyrene beads | American Educational Products | Product #: 3276 | Plastic beads used in the evolution experiment (Figure 1A) |
Additional files
-
MDAR checklist
- https://cdn.elifesciences.org/articles/81056/elife-81056-mdarchecklist1-v2.docx
-
Supplementary file 1
This file contains tables that list strains used for injections and full results from linear models.
(a) YJM311 Strains used in virulence experiments. (b) YJM128 Strains used in virulence experiments. (c) Results of the mixed-effect linear model for whole-population cell count data over experimental cycles. (d) Results of the mixed-effect linear model for clonal plastic adherence data. (e) Results of the mixed-effect linear model for clonal CCM data. (f) Results of the mixed-effect linear model for clonal flor data. (g) Results of the mixed-effect linear model for clonal PSH data.
- https://cdn.elifesciences.org/articles/81056/elife-81056-supp1-v2.docx
Download links
A two-part list of links to download the article, or parts of the article, in various formats.
Downloads (link to download the article as PDF)
Open citations (links to open the citations from this article in various online reference manager services)
Cite this article (links to download the citations from this article in formats compatible with various reference manager tools)
Selection on plastic adherence leads to hyper-multicellular strains and incidental virulence in the budding yeast
eLife 12:e81056.
https://doi.org/10.7554/eLife.81056


