Biological brain age prediction using machine learning on structural neuroimaging data: Multi-cohort validation against biomarkers of Alzheimer’s disease and neurodegeneration stratified by sex
- Barcelonaβeta Brain Research Center, Pasqual Maragall Foundation, Spain
- Universitat Pompeu Fabra, Spain
- IMIM (Hospital del Mar Medical Research Institute), Spain
- CIBER Fragilidad y Envejecimiento Saludable (CIBERFES), France
- Centro de Investigación Biomédica en Red de Bioingeniería, Biomateriales y Nanomedicina (CIBER-BBN), Spain
- Department of Radiology and Nuclear Medicine, Amsterdam Neuroscience, Vrije Universiteit Amsterdam, Netherlands
- CIRD Centre d'Imagerie Rive Droite, Switzerland
- Normandie Univ, UNICAEN, INSERM, U1237, PhIND "Physiopathology and Imaging of Neurological Disorders", Institut Blood and Brain, France
- Centre for Dementia Prevention, Edinburgh Imaging, and UK Dementia Research Institute at The University of Edinburgh, United Kingdom
- Takeda Pharmaceutical Company Ltd, United States
- Institutes of Neurology and Healthcare Engineering, University College London, United Kingdom
- Roche Diagnostics International Ltd, Switzerland
- Roche Diagnostics GmbH, Germany
- Institute of Neuroscience and Physiology, University of Gothenburg, Sweden
- Clinical Neurochemistry Laboratory, Sahlgrenska University Hospital, Sweden
- Department of Neurodegenerative Disease, UCL Queen Square Institute of Neurology, United Kingdom
- Hong Kong Center for Neurodegenerative Diseases, China
- UK Dementia Research Institute at UCL, United Kingdom
- Servei de Neurologia, Hospital del Mar, Spain
- Department of Signal Theory and Communications, Universitat Politècnica de Catalunya, Spain
Figures
Figure 1 with 2 supplements
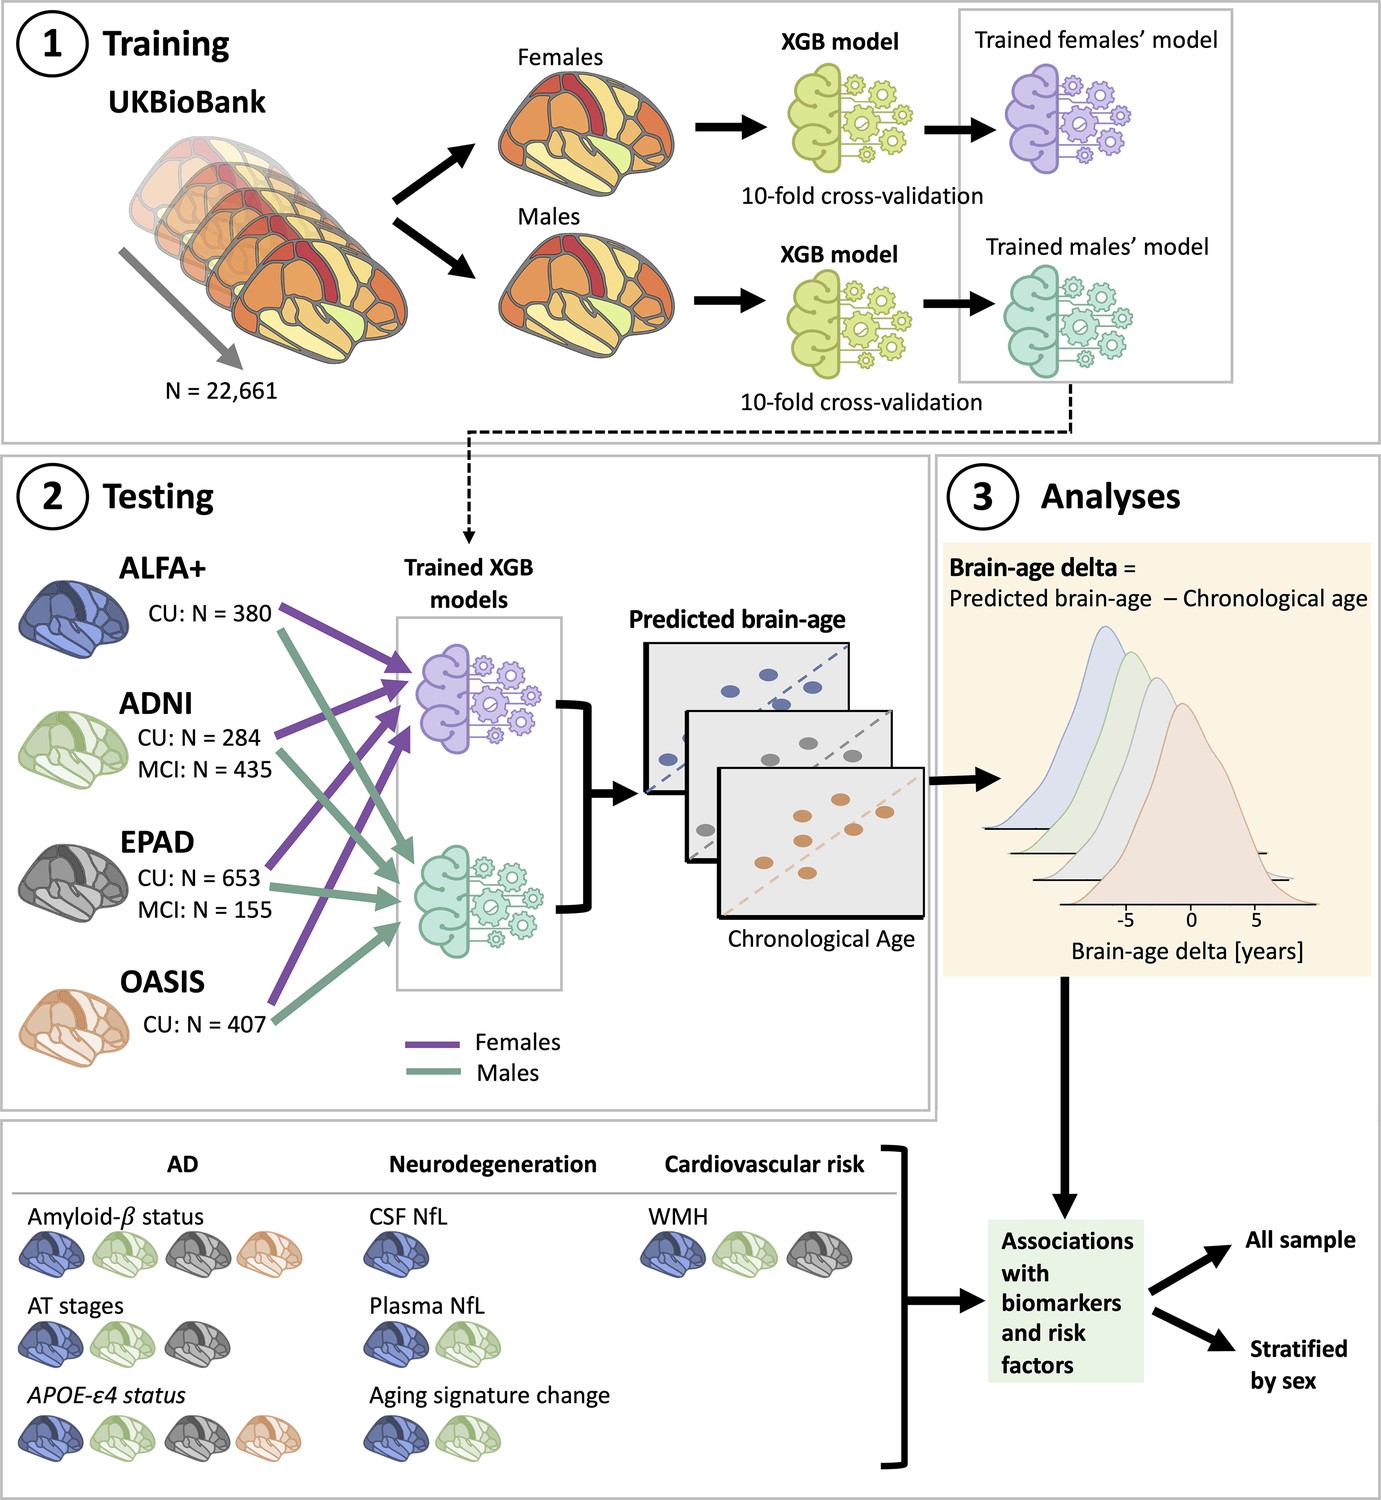
Overview of project steps.
Illustration of the methods used to generate predicted brain-age and to study the associations between the brain-age delta and the biomarkers and risk factors used. 3D T1-weighted MRI scans across all cohorts were segmented into volumes and thickness using the Desikan-Killiany and the aseg atlas. 1. Training phase: We trained XGBoost regressor models for females and males from the UK Biobank. For this we performed a cross-validation scheme with 10-folds and 10 repeats per fold. 2. Testing phase: We tested the age prediction models on unseen data from independent cohorts: ALFA+ (in blue), ADNI (in green), EPAD (in gray), and OASIS (in orange). 3 Analyses phase: We computed the brain-age delta for each cohort. We then studied the associations with the biomarkers and risk factors of AD, neurodegeneration, and cardiovascular risk. We performed these analyses within the whole sample and stratified by sex. The table on the bottom left shows the available biomarkers and risk factor available for which cohorts.
Figure 1—figure supplement 1
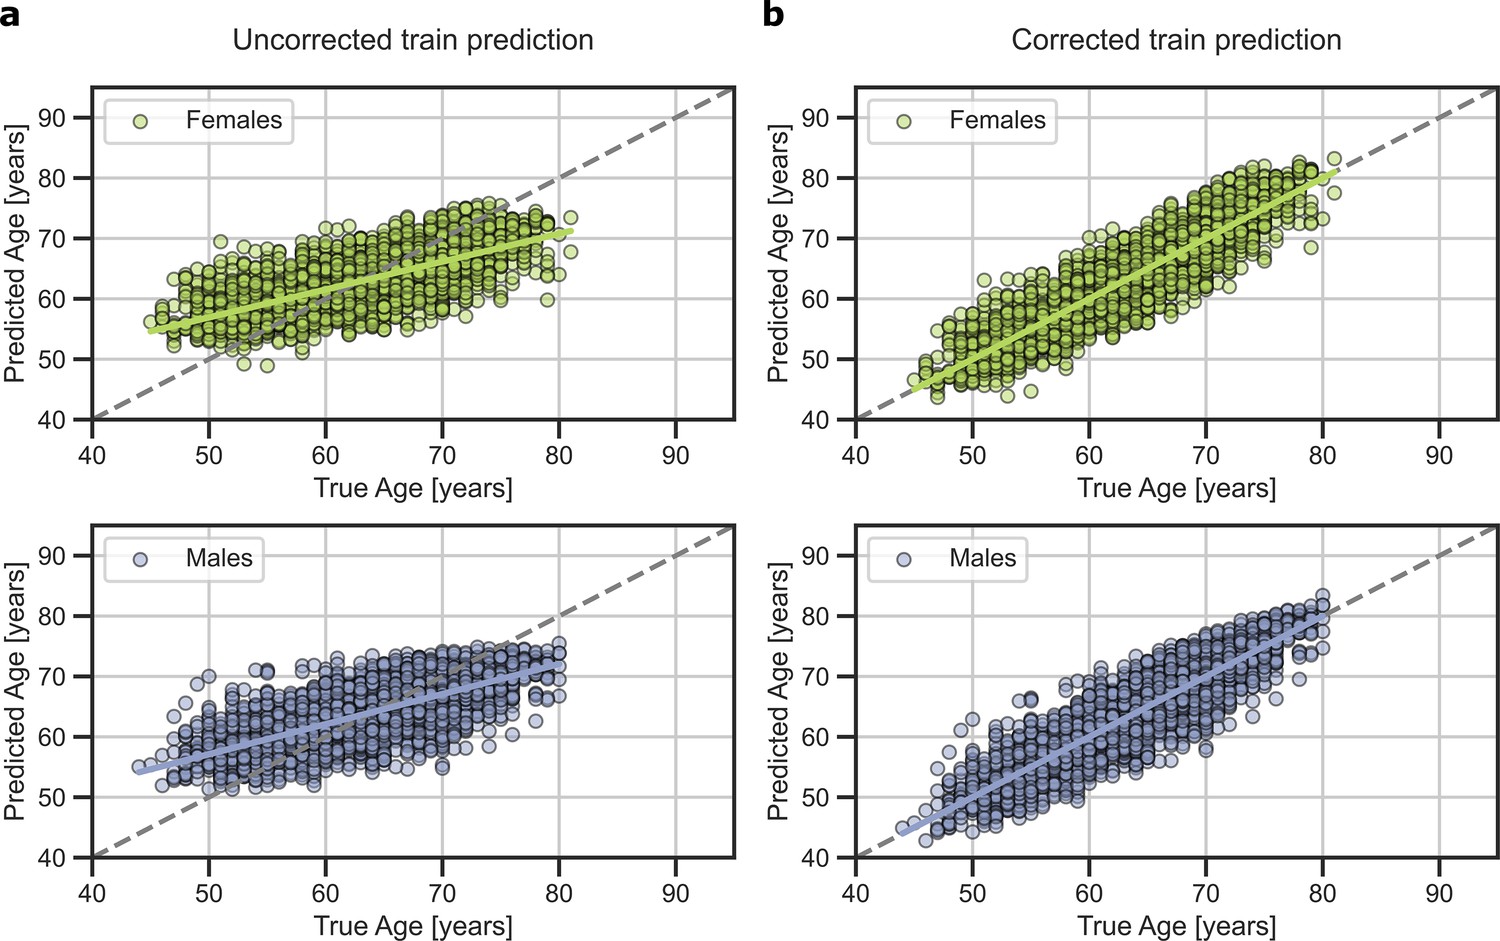
Predicted brain-age in validation subsamples of UK Biobank for females (blue) and males (orange).
On the left, original prediction. On the right, prediction after bias correction.
Figure 1—figure supplement 2
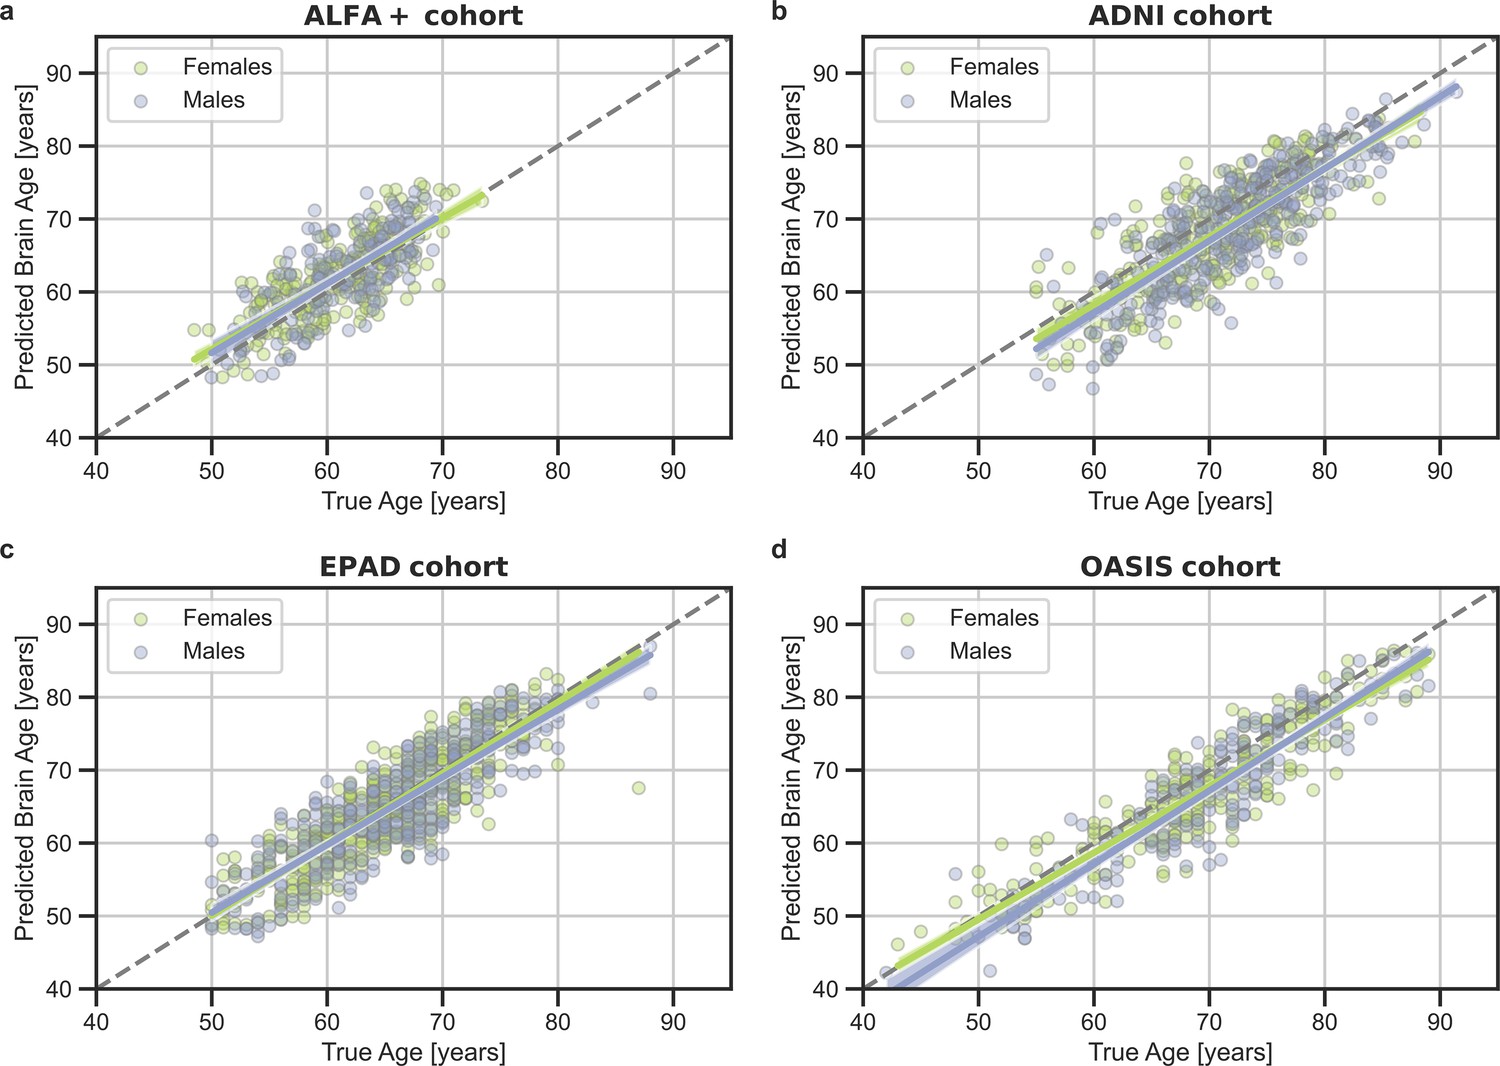
Predicted brain-age versus chronological age for (a) ALFA+, (b) ADNI, (c) EPAD, and (d) OASIS cohorts.
In blue, female subjects and in green, male subjects.
Figure 2
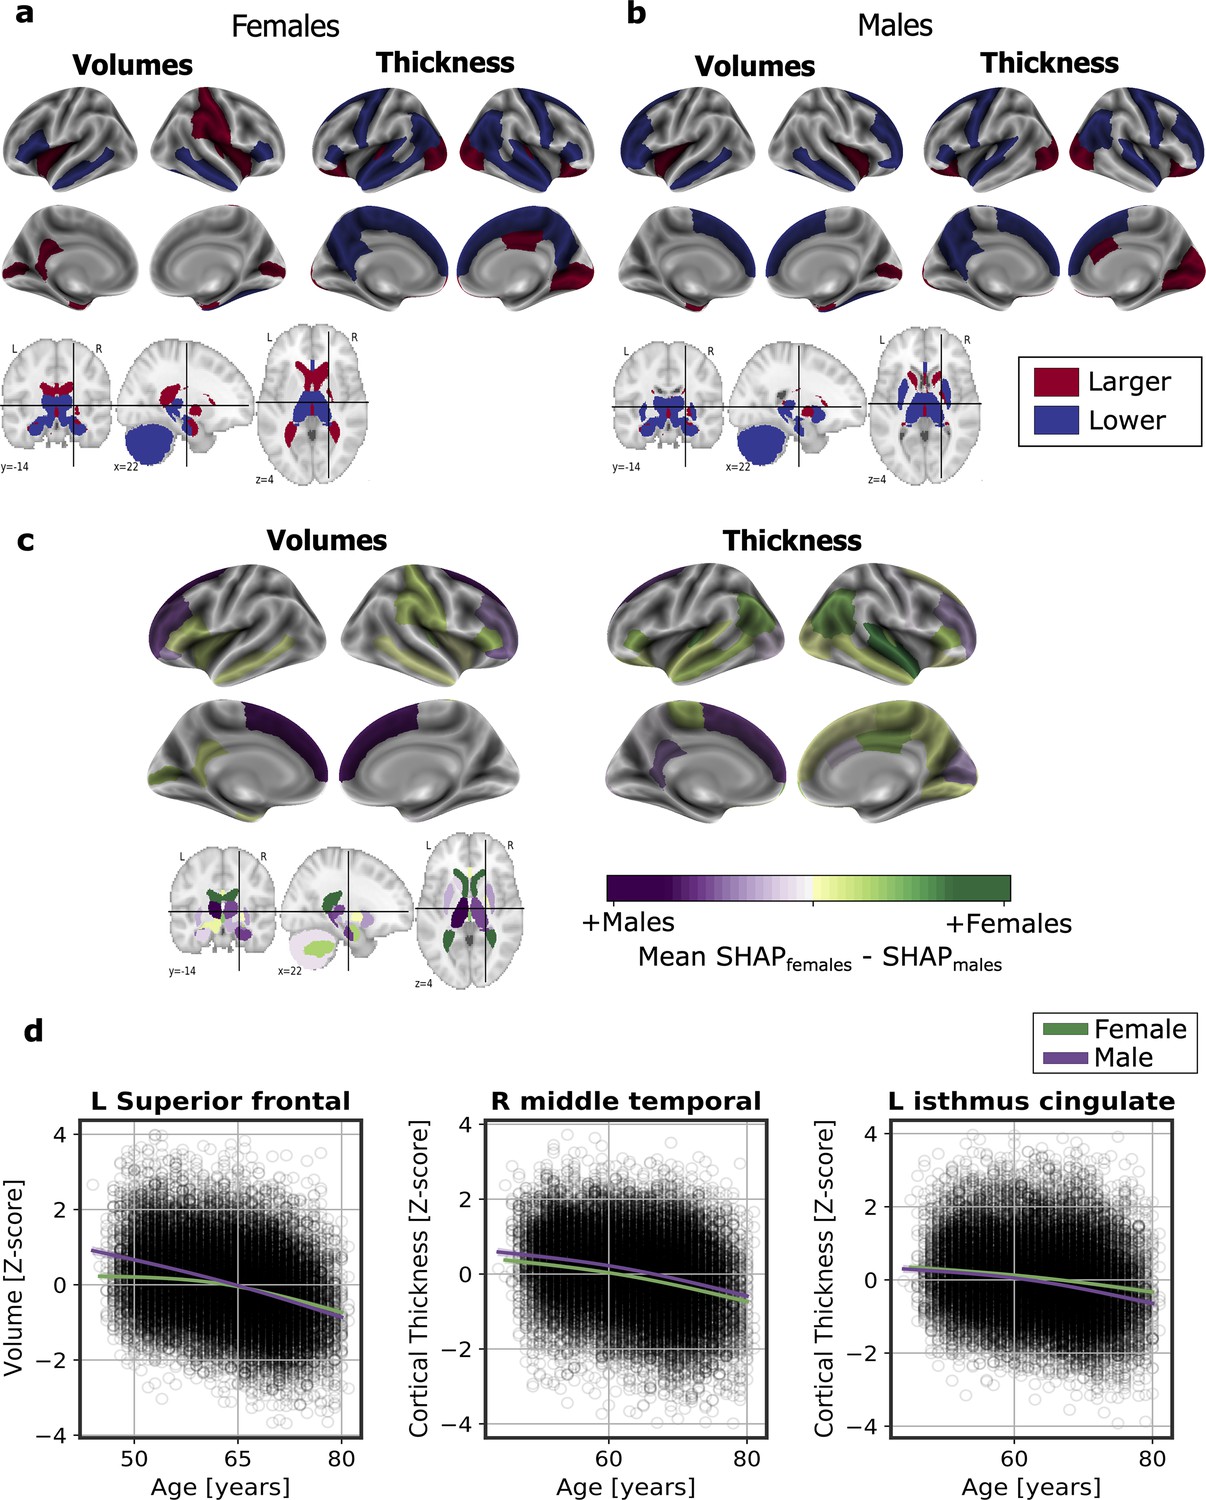
Significant SHAP-selected brain regions most important in prediction for (a) females and (b) males separately.
Significance was studied by assessing the stability of the region’s importance by performing subsampling of data over 1,000 permutations. Colored regions had a P < 0.05 corrected for multiple comparisons using Bonferroni correction approach. Regions in red show larger volume or cortical thickness, while regions in blue show lower volume or cortical thickness. In (c), comparison for the regions with higher SHAP values that were significant for females (green) and males (purple). The color map shows the results from subtracting the males’ mean SHAP value to the female’s mean SHAP value for each region. In (d), examples of the fit of three significant SHAP-selected regions against chronological age for females and males. For visualization purposes, nonparametric smoothing spline functions were used to fit the data (mean ± 95%CI).
Figure 3
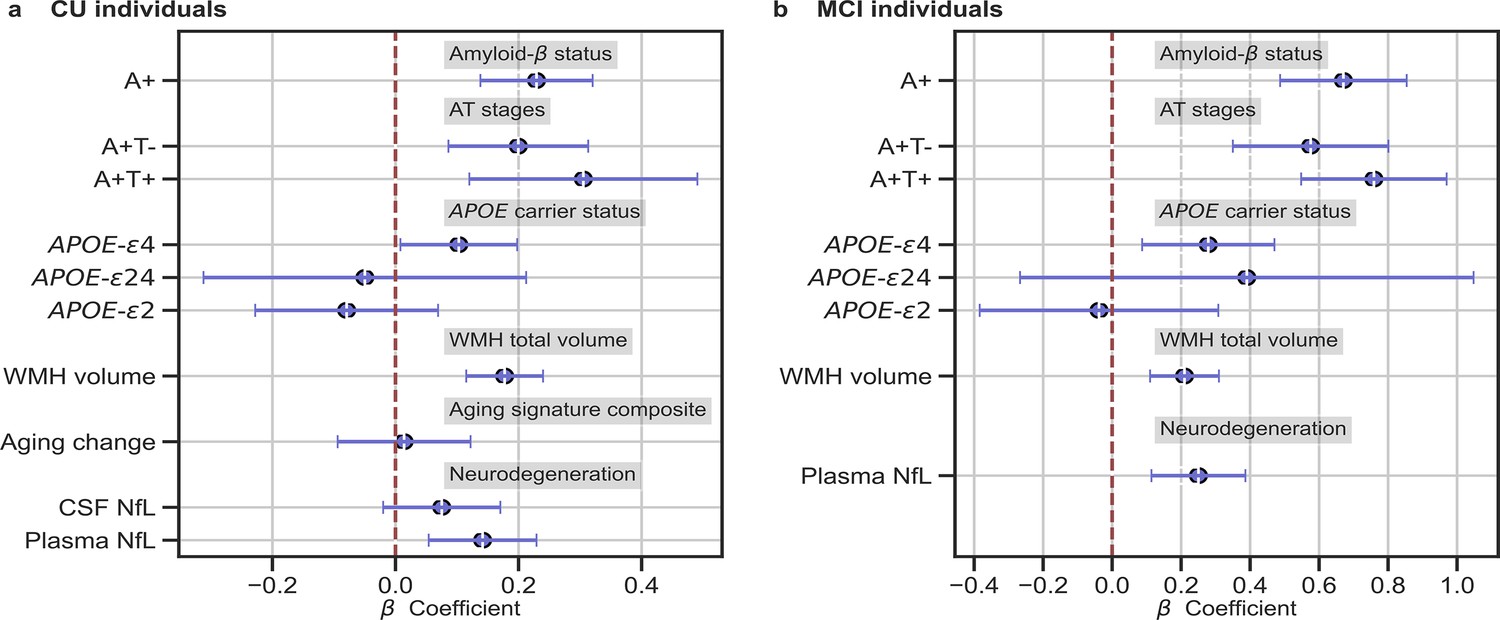
In (a) and (b), the standardized associations (β±95% CI) between measures of brain-age delta validation variables for (a) CU individuals and (b) MCI individuals.
Variables include AD biomarkers and risk factors: amyloid-β status, AT stages and APOE status; and neurodegeneration markers (available in ALFA + and ADNI): CSF NfL, plasma NfL and aging signature change. The analyses included age and sex as covariates. Sample size for each variable can be seen in Table 4.
Figure 4
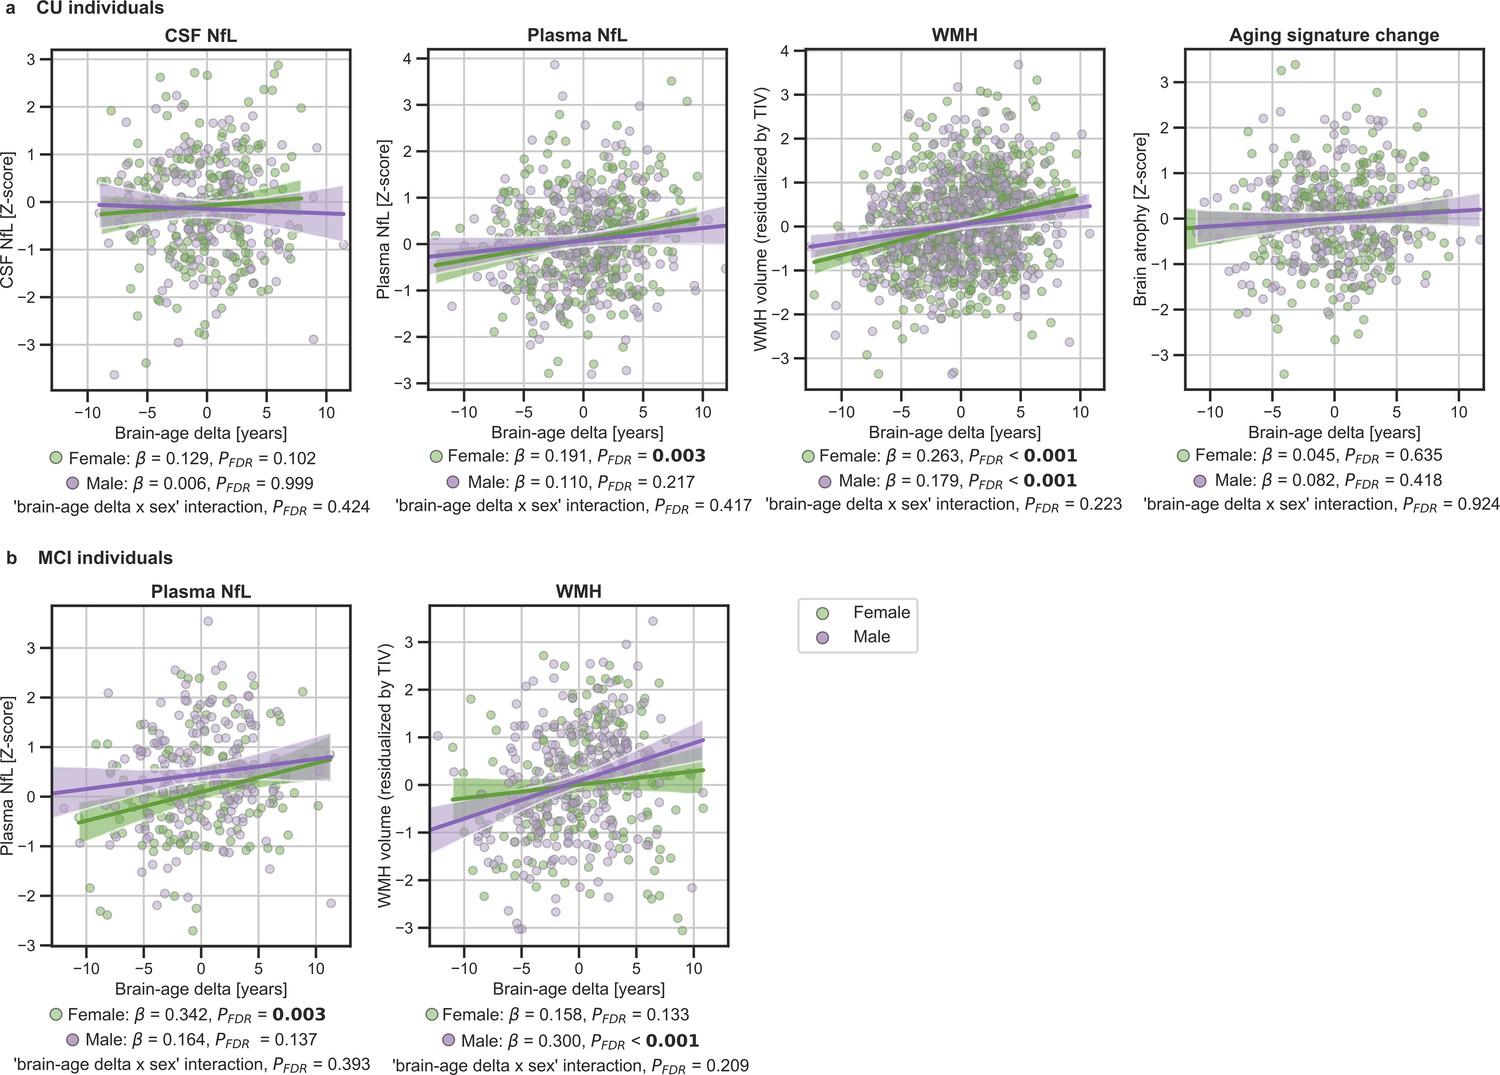
In (a) and (b), the associations of brain-age delta and continuous validation variables stratified by sex for (a) CU individuals and (b) MCI individuals.
Scatter plots representing the associations of CSF NfL, plasma NfL, brain atrophy and WMH with brain-age delta in females (green) and males (purple). Each point depicts the value of the validation biomarkers of an individual and the solid lines indicate the regression line for each of the groups. 95% Confidence intervals are shown in the shaded areas. The standardized regression coefficients (β) and the corrected p-values are shown, which were computed using a linear model adjusting for age and sex. Additionally, we also computed the ‘brain-age delta x sex’ interaction term. The sample size for each variable can be seen in Table 5.
Figure 5 with 1 supplement
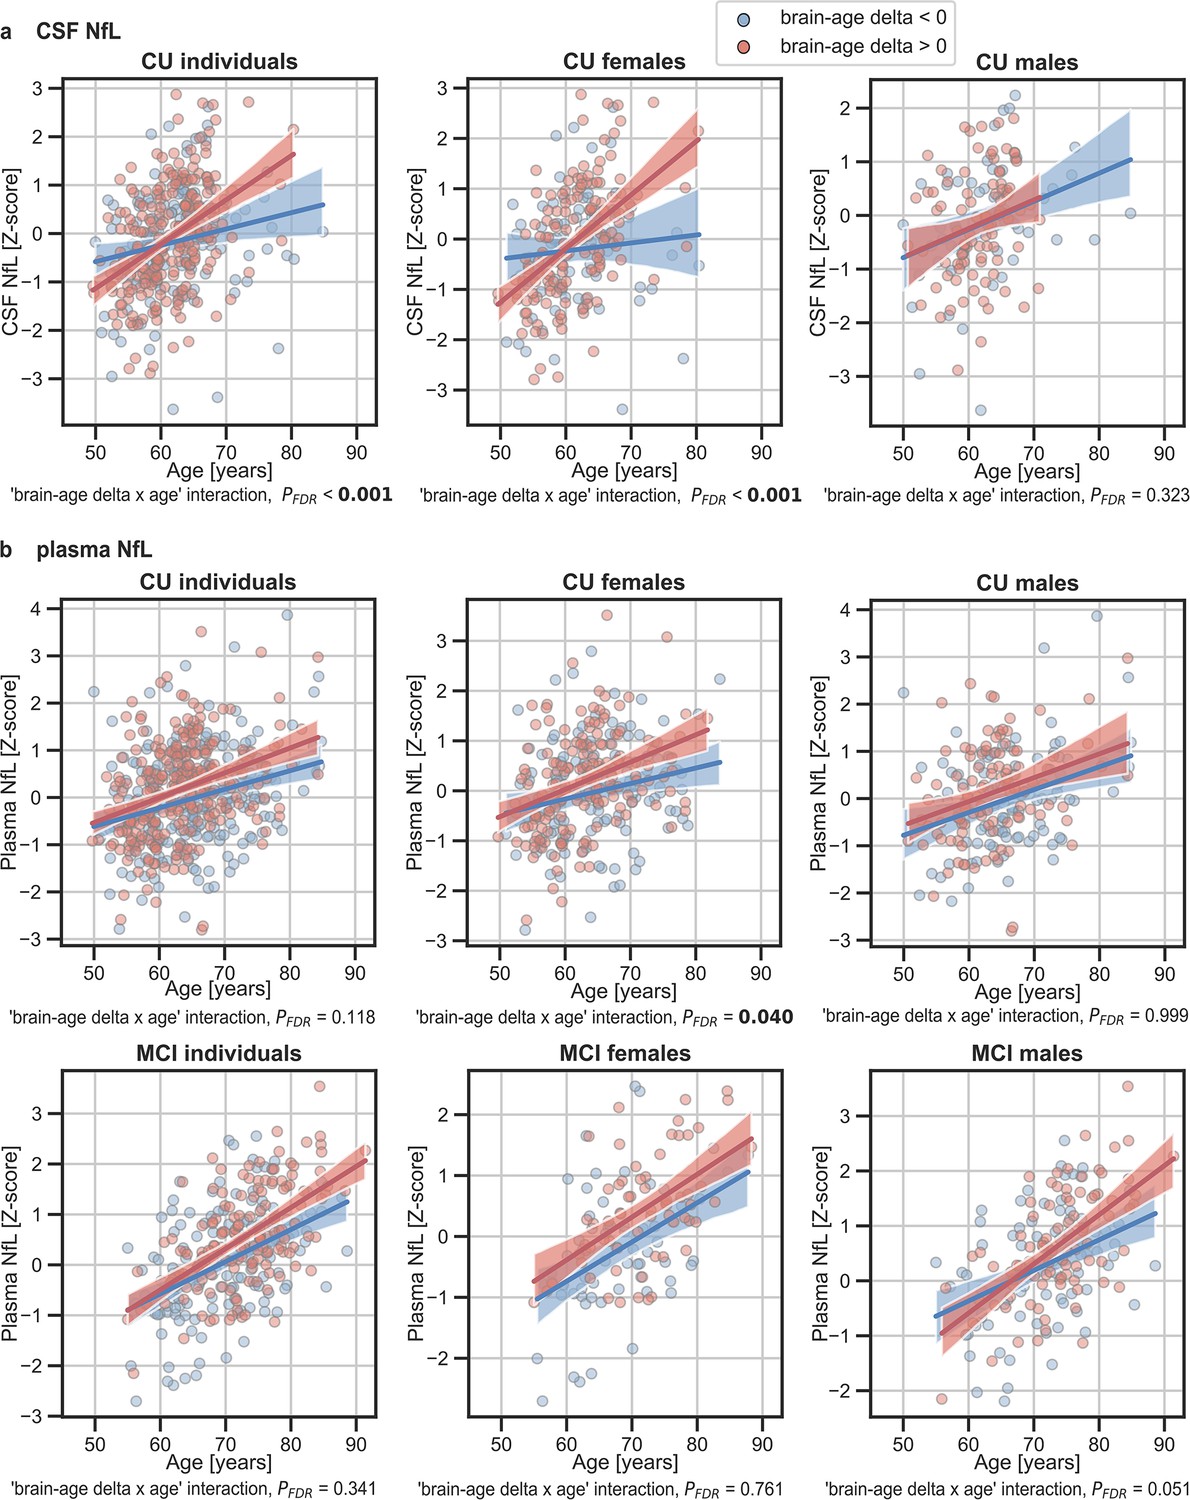
The associations of brain-age delta and (a) CSF NfL and (b) plasma NfL with chronological age for all CU and, when available, MCI individuals.
For visualization purposes, individuals were categorized into two groups according to their brain-age delta: ‘brain-age delta <0’ representing decelerated brain aging (blue); and ‘brain-age delta >0’ representing accelerated brain aging (red). Scatter plots representing the associations of CSF NfL, plasma NfL and WMH with age in individuals with brain-age delta >0 and brain-age delta <0. Each point depicts the value of the validation biomarkers of an individual and the solid lines indicate the regression line for each of the groups. The regression coefficients (β) and the FDR corrected p-values are shown, which were computed using a linear model adjusting for age and sex. Additionally, we also computed the ‘brain-age delta x sex’ interaction term. The sample size for each variable can be seen in Table 5.
Figure 5—figure supplement 1
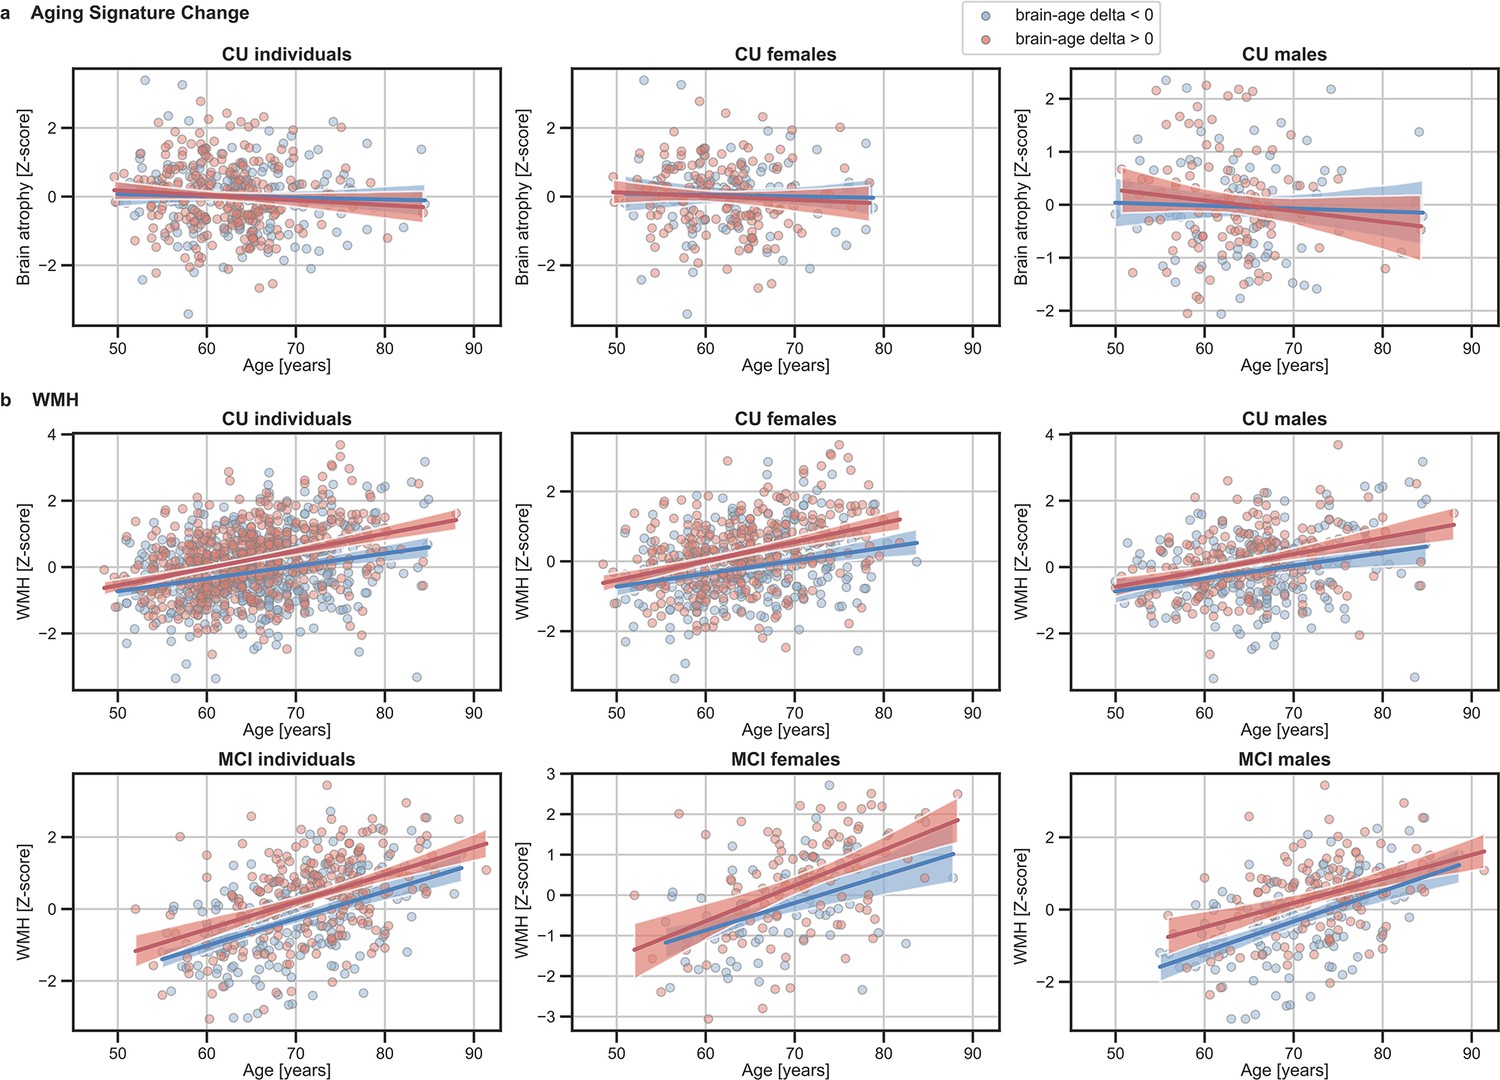
The associations of (a) Aging signature change and (b) WMH with chronological age for all CU and, when available, MCI individuals.
The sample size for each variable can be seen in Table 4 and Table 5. For visualization purposes, individuals were categorized into two groups according to their brain-age delta: ‘brain-age delta <0’ representing decelerated brain aging (blue); and ‘brain-age delta >0’ representing accelerated brain aging (red). Scatter plots representing the associations of CSF NfL, plasma NfL and WMH with age in individuals with brain-age delta >0 and brain-age delta <0. Each point depicts the value of the validation biomarkers of an individual and the solid lines indicate the regression line for each of the groups.
Appendix 1—figure 1
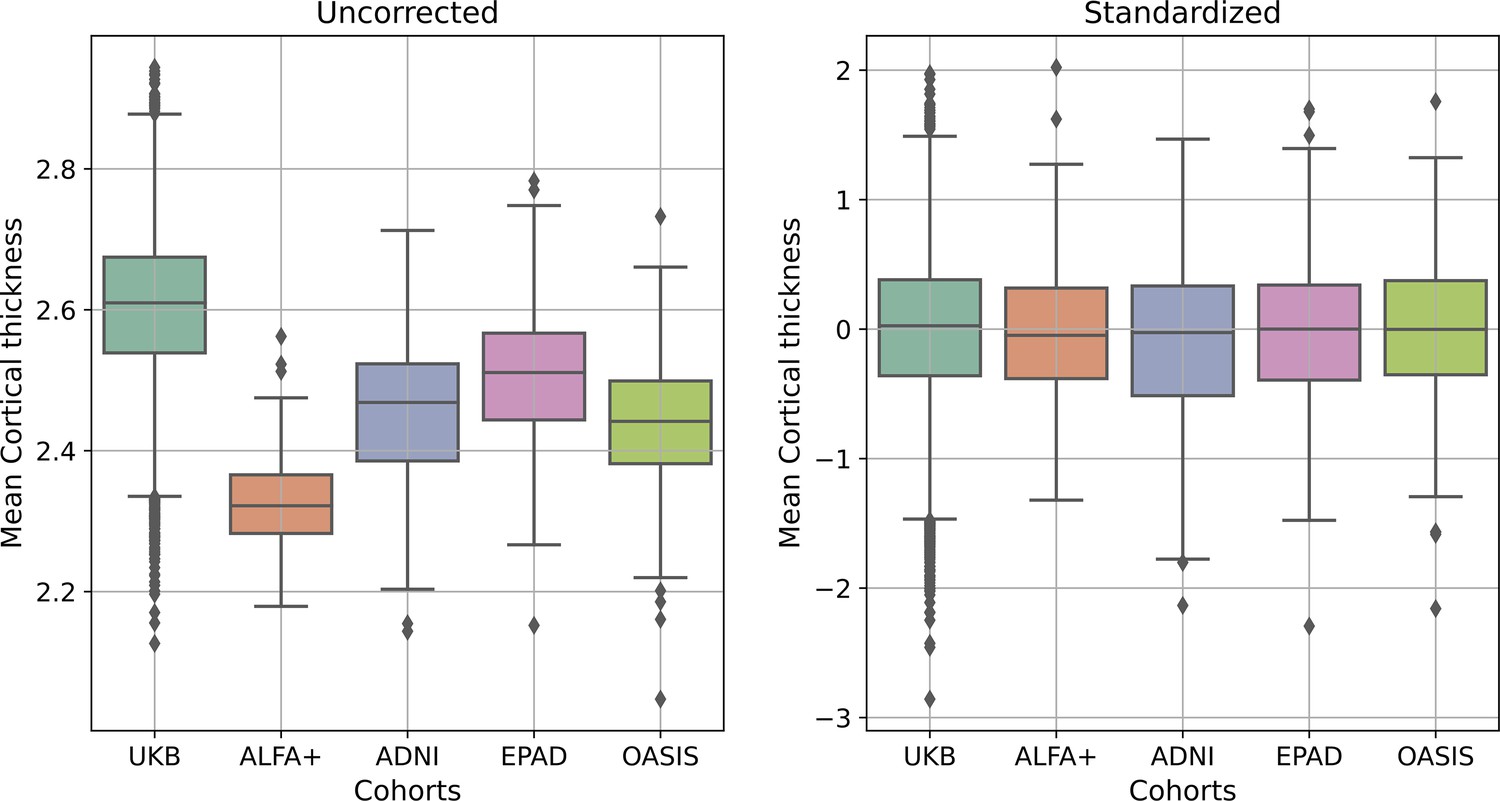
Median (and interquartile range) cortical thickness for all individuals from all cohorts (UK Biobank (UKB), ALFA+, ADNI, EPAD and OASIS), without any correction (left) and after the standardization procedure (right).
The sample size can be seen in Table 1.
Tables
Table 1
Sample demographics and characteristics separated by cohort and by diagnosis.
| CU | MCI | ||||||
|---|---|---|---|---|---|---|---|
| Characteristics | UK Biobank | ALFA+ | ADNI | EPAD | OASIS | ADNI | EPAD |
| (N=22,661) | (N=380) | (N=284) | (N=653) | (N=407) | (N=435) | (N=155) | |
| Age, years | 64.54 (7.55) | 60.61 (4.72) | 71.42 (6.36) | 64.96 (7.01) | 69.07 (9.42) | 71.09 (7.31) | 69.08 (6.97) |
| Age range, years | [44, 81] | [48, 73] | [55, 89] | [50, 88] | [42, 89] | [55, 91] | [52, 88] |
| Female, n (%) | 11,767 (51.92) | 254 (60.76) | 126 (50.00) | 386 (59.11) | 244 (59.95) | 249 (50.00) | 81 (47.74) |
| Education, years | 17.75 (5.42) | 13.43 (3.71) | 16.54 (2.49) | 14.83 (3.56) | 15.93 (2.59) | 16.23 (2.71) | 14.17 (3.77) |
| APOE-ε4 carriers, n (%) | 6,334 (27.95) | 221 (52.87) | 72 (28.57) | 217 (33.23) | 118 (28.99) | 218 (43.78) | 60 (38.71) |
| MMSE | - | 29.15 (0.95) | 28.985 (1.24) | 28.82 (1.40) | 29.03 (1.31) | 27.57 (2.19) | 27.86 (1.97) |
-
Notes: Data are expressed as mean (M) and standard deviation (SD) or percentage (%), as appropriate. Abbreviations: APOE, apolipoprotein E; MMSE, Mini-Mental State Examination.
Table 2
Biomarkers separated by cohort and by diagnosis.
| CU | MCI | |||||||||||
|---|---|---|---|---|---|---|---|---|---|---|---|---|
| ALFA+ | ADNI | EPAD | OASIS | ADNI | EPAD | |||||||
| BIOMARKERS | N | Mean (SD) | N | Mean (SD) | N | Mean (SD) | N | Mean (SD) | N | Mean (SD) | N | Mean (SD) |
| Centiloids | 0 | - | 0 | - | 0 | - | 407 | 13.468 (28.138) | 0 | - | 0 | - |
| CSF Aβ42 (pg/mL)* | 380 | 1318.059 (599.223) | 284 | 1223.890 (556.648) | 653 | 1403.617 (681.736) | 0 | - | 435 | 986.248 (446.402) | 155 | 1245.181 (741.756) |
| CSF p-tau (pg/mL) | 380 | 16.289 (7.813) | 283 | 22.234 (9.692) | 627 | 18.326 (8.380) | 0 | - | 434 | 26.490 (14.402) | 151 | 24.715 (14.897) |
| CSF NfL (pg/mL)† | 380 | 82.717 (29.124) | 26 | 1052.444 (376.095) | 0 | - | 0 | - | 48 | 1383.638 (918.231) | 0 | - |
| Plasma NfL (pg/mL) | 368 | 10.519 (3.739) | 184 | 35.843 (17.988) | 0 | - | 0 | - | 404 | 38.157 (18.908) | 0 | - |
| WMH volume | 360 | 0.045 (0.845) | 240 | –0.0085 (1.267) | 456 | 0.038 (1.072) | 0 | - | 458 | –0.005 (1.229) | 108 | 0.048 (1.076) |
| Aging signature† | 360 | 2.387 (0.071) | 240 | 2.284 (0.105) | 456 | 0 | - | 458 | 2.251 (0.109) | 0 | - | |
| Aging signature V2† | 187 | 2.376 (0.072) | 45 | 2.299 (0.118) | 0 | - | 0 | - | 46 | 2.257 (0.119) | 0 | - |
| Aging signature change ( )† | 187 | –0.003 (0.011) | 45 | –0.0007 (0.037) | 0 | - | 0 | - | 46 | –0.003 (0.050) | 0 | - |
-
Data are expressed as mean (M) and standard deviation (SD) or percentage (%), as appropriate. Amyloid-β status was defined by CSF (ALFA+, ADNI and EPAD) or amyloid PET (OASIS). For ALFA+ and ADNI, we calculated the aging signature from MRI scans acquired 3 years later than the original MRI scan, called aging signature V2. Aging signature change was calculated as the difference in aging signature over these two MRI scans.
-
Abbreviations: CSF, cerebrospinal fluid; NfL, neurofilament light; WMH, White Matter Hyperintensities.
-
*
Individuals that fell into the A-T+group: 25 from ALFA+, 116 from ADNI and 71 from EPAD.
-
†
As the number of MCI individuals with CSF NfL and aging signature change was relatively low, we excluded them from the following results.
Table 3
Prediction metrics for all independent cohorts.
| Cohorts | Correlation with age | MAE (y) | R2 | RMSE | |||
|---|---|---|---|---|---|---|---|
| R | P-value | ||||||
| Before bias correction | |||||||
| UK Biobank | 0.712 (0.007) | <0.001 | 4.19 (0.07) | 0.51 (0.03) | 5.25 (0.08) | ||
| ALFA+ | 0.448 | <0.001 | 4.31 | 0.20 | 4.18 | ||
| ADNI | 0.587 | <0.001 | 7.21 | 0.34 | 5.47 | ||
| EPAD | 0.629 | <0.001 | 4.63 | 0.40 | 5.62 | ||
| OASIS | 0.733 | <0.001 | 6.99 | 0.54 | 6.42 | ||
-
The Pearson’s correlation coefficient (R) between predicted brain-age and chronological age, R2, root mean square error (RMSE), and mean absolute error (MAE) for UK Biobank and for each of the independent cohorts before bias correction. For UK Biobank, the metrics, given as mean (standard deviation) are computed from 10-fold cross validation repeated 10 times.
Table 4
Relationships between validation variables and brain-age delta for all CU and MCI individuals.
| Model | β | SE | P-Value | [0.025] | [0.975] | N | Effect size | FDR corr P-Value | |
|---|---|---|---|---|---|---|---|---|---|
| CU Individuals | |||||||||
| Amyloid-β pathology (ref: A-) | 0.234 | 0.047 | <0.001 | 0.140 | 0.325 | 1634 | 0.222 | <0.001 | |
| Amyloid-β / Tau pathology (ref: A-T-) | A+T- | 0.2023 | 0.059 | <0.001 | 0.015 | 0.394 | 1162 | 0.275 | <0.001 |
| A+T + | 0.310 | 0.096 | 0.003 | 0.101 | 0.500 | 0.300 | 0.008 | ||
| APOE status (ref: APOE-ε33) | APOE-ε2 | –0.124 | 0.082 | 0.130 | –0.321 | 0.334 | 1634 | 0.122 | 0.227 |
| APOE-ε4 | 0.173 | 0.052 | 0.001 | 0.071 | 0.274 | 0.172 | 0.003 | ||
| APOE-ε24 | 0.012 | 0.144 | 0.936 | –0.271 | 0.294 | 0.011 | 0.999 | ||
| WMH volume* | 0.160 | 0.030 | <0.001 | 0.111 | 0.231 | 972 | 0.028 | <0.001 | |
| CSF NfL† | 0.079 | 0.049 | 0.112 | –0.019 | 0.176 | 378 | 0.006 | 0.209 | |
| Plasma NfL† | 0.154 | 0.045 | 0.001 | 0.066 | 0.242 | 508 | 0.024 | 0.003 | |
| Brain Atrophy† | 0.053 | 0.048 | 0.272 | –0.041 | 0.146 | 152 | 0.003 | 0.415 | |
| MCI Individuals | |||||||||
| Amyloid-β pathology | 0.640 | 0.089 | <0.001 | 0.465 | 0.816 | 218 | 0.665 | <0.001 | |
| Amyloid-β / Tau pathology (ref: A-T-) | A+T- | 0.564 | 0.109 | <0.001 | 0.350 | 0.778 | 218 | 0.592 | <0.001 |
| A+T + | 0.720 | 0.102 | <0.001 | 0.519 | 0.920 | 0.720 | <0.001 | ||
| APOE status (ref: APOE-ε33) | APOE-ε2 | 0.007 | 0.167 | 0.968 | –0.273 | 0.978 | 218 | 0.001 | 0.999 |
| APOE-ε4 | 0.273 | 0.093 | 0.003 | 0.091 | 0.456 | 0.281 | 0.008 | ||
| APOE-ε24 | 0.352 | 0.319 | 0.269 | –0.273 | 0.978 | 0.359 | 0.415 | ||
| WMH volume | 0.222 | 0.054 | <0.001 | 0.117 | 0.327 | 191 | 0.040 | <0.001 | |
| Plasma NfL‡ | 0.242 | 0.067 | <0.001 | 0.110 | 0.374 | 134 | 0.046 | <0.001 | |
-
Notes: Relationships between validation variables and Brain-Age delta from all CU pooled subjects (including ALFA+, ADNI, EPAD and OASIS) and all MCI pooled subjects (including ADNI and EPAD). Results given by the linear model: brain-age delta ~each variable +chronological age+sex. The regression coefficients (β), standard errors (SE), P-value, 95% Confidence Interval, number of individuals (N) and effect size are depicted for each variable.
-
Significant values after FDR correction (P<0.05) are marked in bold.
-
Effect size in categorical variables was calculated as Cohen’s D, while Cohens f2 was calculated for continuous measurements. Amyloid-β status was defined by CSF (ALFA+, ADNI, and EPAD) or amyloid PET (OASIS). MCI individuals only contained individuals from ADNI and EPAD.
-
APOE, apolipoprotein E; WMH, White Matter Hyperintensities; CSF, cerebrospinal fluid; NfL, neurofilament light; ref, reference.
-
*
Contains data from ALFA+, ADNI and EPAD.
-
†
Contains data from ALFA +and ADNI.
-
‡
Contains data from ADNI.
Table 5
Relationships between validation variables and brain-age delta stratified by sex for all CU and MCI individuals.
| Females | Males | |||||||||||||
|---|---|---|---|---|---|---|---|---|---|---|---|---|---|---|
| Model | β (SE) | P-Value | [0.025, 0.075] | N | Effect size | FDR corr P-Value corr | β | P-Value | [0.025, 0.075] | N | Effect size | FDR corr P-Value | ||
| CU Individuals | ||||||||||||||
| Amyloid-β pathology (ref: A-) | 0.286 (0.065) | <0.001 | [0.160, 0.413] | 966 | 0.288 | <0.001 | 0.341 (0.076) | <0.001 | [0.192, 0.490] | 668 | 0.344 | <0.001 | ||
| Amyloid-β / Tau pathology (ref: A-T-) | A+T- | 0.250 (0.082) | 0.003 | [0.088, 0.411] | 688 | 0.252 | 0.008 | 0.2978 (0.096) | 0.002 | [0.110, 0.486] | 474 | 0.301 | 0.006 | |
| A+T + | 0.391 (0.131) | 0.003 | [0.134, 0.648] | 0.385 | 0.008 | 0.173 (0.163) | 0.290 | [–0.148, 0.494] | 0.175 | 0.424 | ||||
| APOE status (ref: APOE-ε33) | APOE-ε2 | –0.175 (0.110) | 0.112 | [–0.391, 0.041] | 966 | 0.172 | 0.209 | –0.061 (0.122) | 0.615 | [–0.301, 0.178] | 668 | 0.062 | 0.766 | |
| APOE-ε4 | 0.117 (0.067) | 0.081 | [–0.014, 0.248] | 0.116 | 0.162 | 0.249 (0.082) | 0.003 | [0.087, 0.410] | 0.249 | 0.008 | ||||
| APOE-ε24 | –0.011 (0.197) | 0.958 | [–0.337, 0.358] | 0.011 | 0.999 | 0.044 (0.212) | 0.836 | [–0.372, 0.461] | 0.045 | 0.976 | ||||
| WMH volume* | 0.263 (0.041) | <0.001 | [0.183, 0.342] | 580 | 0.072 | <0.001 | 0.179 (0.050) | <0.001 | [0.790, 0.278] | 392 | 0.032 | <0.001 | ||
| CSF NfL ¥ | 0.129 (0.064) | 0.046 | [0.002, 0.256] | 228 | 0.019 | 0.102 | 0.006 (0.078) | 0.939 | [–0.149, 0.161] | 150 | 0.000 | 0.999 | ||
| Plasma NfL† | 0.191 (0.059) | 0.001 | [0.076, 0.306] | 298 | 0.037 | 0.003 | 0.110 (0.069) | 0.119 | [–0.029, 0.248] | 210 | 0.012 | 0.217 | ||
| Brain Atrophy† | 0.045 (0.063) | 0.475 | [–0.079, 0.169] | 171 | 0.002 | 0.635 | 0.082 (0.074) | 0.268 | [–0.064, 0.228] | 102 | 0.007 | 0.418 | ||
| MCI Individuals | ||||||||||||||
| Amyloid-β pathology | 0.713 (0.131) | <0.001 | [0.455, 0.970] | 217 | 0.751 | <0.001 | 0.581 (0.124) | <0.001 | [0.337, 0.824] | 286 | 0.597 | <0.001 | ||
| Amyloid-β / Tau pathology (ref: A-T-) | A+T- | 0.556 (0.176) | 0.002 | [0.210, 0.903] | 214 | 0.590 | 0.006 | 0.543 (0.144) | <0.001 | [0.260, 0.827] | 284 | 0.558 | <0.001 | |
| A+T + | 0.809 (0.146) | <0.001 | [0.52, 1.098] | 0.812 | <0.001 | 0.626 (0.145) | <0.001 | [0.342, 0.911] | 0.633 | <0.001 | ||||
| APOE status (ref: APOE-ε33) | APOE-ε2 | 0.034 (0.295) | 0.908 | [–0.546, 0.614] | 217 | 0.033 | 0.999 | –0.008 (0.206) | 0.992 | [–0.408, 0.404] | 286 | 0.002 | 0.999 | |
| APOE-ε4 | 0.254 (0.142) | 0.0676 | [–0.026, 0.535] | 0.267 | 0.155 | 0.287 (0.125) | 0.023 | [0.040, 0.534] | 0.289 | 0.052 | ||||
| APOE-ε24 | 0.290 (0.418) | 0.489 | [–0.535,1.115] | 0.309 | 0.649 | 0.399 (0.507) | 0.431 | [–0.598, 1.398] | 0.389 | 0.584 | ||||
| WMH volume | 0.158 (0.085) | 0.063 | [–0.009, 0.325] | 181 | 0.020 | 0.133 | 0.300 (0.069) | <0.001 | [0.164, 0.437] | 252 | 0.075 | <0.001 | ||
| Plasma NfL‡ | 0.342 (0.098) | 0.001 | [0.147, 0.536] | 128 | 0.097 | 0.003 | 0.164 (0.091) | 0.068 | [–0.012, 0.341] | 173 | 0.020 | 0.137 | ||
-
Notes: Relationships between validation variables and Brain-Age delta from all CU pooled subjects (including ALFA+, ADNI, EPAD and OASIS) and all MCI pooled subjects (including ADNI and EPAD). Results given by the linear model: brain-age delta ~each variable +chronological age+sex. The standardized regression coefficients (β), standard errors (SE), P-value, 95% Confidence Interval, number of individuals (N) and effect size are depicted for each variable.
-
Significant values after FDR correction (p<0.05) are marked in bold. Effect size in categorical variables was calculated as Cohen’s D, while Cohens f2 was calculated for continuous measurements. Amyloid-β status was defined by CSF (ALFA+, ADNI, and EPAD) or amyloid PET (OASIS).
-
APOE, apolipoprotein E; WMH, White Matter Hyperintensities; CSF, cerebrospinal fluid; NfL, neurofilament light; ref, reference.
-
*
Contains data from ALFA+, ADNI and EPAD.
-
†
Contains data from ALFA +and ADNI.
-
‡
Contains data from ADNI.
Appendix 1—table 1
Correlations between validation variables and chronological age.
| Aging signature | Amyloid-β | Log WMH | Log Plasma NfL | Log CSF NfL | ||||||
|---|---|---|---|---|---|---|---|---|---|---|
| R | P-value | R | P-value | R | P-value | R | P-value | R | P-value | |
| ALFA+ | –0.23 | <0.001 | –0.12 | 0.026 | 0.25 | <0.001 | 0.322 | <0.001 | 0.403 | 0.352 |
| ADNI | –0.256 | <0.001 | –0.100 | 0.123 | 0.370 | <0.001 | 0.441 | <0.001 | - | - |
| EPAD | –0.412 | <0.001 | –0.04 | 0.278 | 0.401 | <0.001 | - | - | - | - |
| OASIS | –0.455 | <0.001 | 0.278 | <0.001 | - | - | - | - | - | - |
-
The Pearson’s correlation coefficient (R) between different validation variables (aging signature, amyloid-β, WMH, plasma NfL, CSF NfL) and chronological age for the independent cohorts used: ALFA+, ADNI, EPAD and OASIS.
-
Significant values (P<0.05) are marked in bold.
-
WMH, White Matter Hyperintensities; NfL, neurofilament light, CSF, cerebrospinal fluid.
Appendix 1—table 2
Comparison of prediction’s metrics across cohorts.
| Fisher’s z | P-Value | |
|---|---|---|
| ALFA +vs ADNI | –2.446 | 0.993 |
| ALFA +vs_EPAD | –5.291 | 1 |
| ALFA +vs OASIS | –8.630 | 1 |
| ADNI vs EPAD | –1.817 | 0.965 |
| ADNI vs OASIS | –4.955 | 1 |
| EPAD vs OASIS | –4.166 | 0.999 |
-
Testing whether the Pearson’s correlation coefficients from the brain-age prediction against the chronological age is similar across all cohorts, via Fisher’s transformation.
Appendix 1—table 3
Prediction metrics for different diagnostic groups in the different cohorts.
| Cohorts | Correlation with age | MAE (y) | R2 | RMSE | |||
|---|---|---|---|---|---|---|---|
| R | P-value | ||||||
| CU individuals | |||||||
| ADNI | 0.575 | <0.001 | 8.153 | 0.331 | 4.953 | ||
| EPAD | 0.634 | <0.001 | 4.494 | 0.402 | 5.456 | ||
| MCI individuals | |||||||
| ADNI | 0.599 | <0.001 | 6.739 | 0.358 | 5.760 | ||
| EPAD | 0.557 | <0.001 | 5.22 | 0.311 | 5.871 | ||
-
The Pearson’s correlation coefficient (R) between predicted brain-age and chronological age, R2 , root mean square error (RMSE), and mean absolute error (MAE) for CU and MCI individuals from ADNI and EPAD.
Appendix 1—table 4
Prediction metrics for females and males in training set.
| MAEorig | RMSEorig | R2orig | MAEcorr | RMSEcorr | R2corr | |
|---|---|---|---|---|---|---|
| Female | 4.221 (0.059) | 5.291 (0.062) | 0.696 (0.006) | 2.871 (0.062) | 3.554 (0.066) | 0.900 (0.004) |
| Male | 4.175 (0.069) | 5.222 (0.070) | 0.728 (0.016) | 3.029 (0.069) | 3.764 (0.077) | 0.897 (0.004) |
-
The prediction metrics between predicted brain-age and chronological age for UK Biobank: R2, root mean square error (RMSE), and mean absolute error (MAE) for the train data using 10-fold cross validation with 10 repetitions per fold, given as mean (standard deviation).
-
Subindex orig refers to values before bias correction.
-
Subindex corr refers to values after bias correction.
Appendix 1—table 5
Prediction metrics for females and males in testing set.
| Pooled cohorts | |||
|---|---|---|---|
| MAE | RMSE | R2 | |
| Female | 5.481 | 6.013 | 0.316 |
| Male | 6.201 | 6.217 | 0.364 |
-
The prediction metrics before bias correction between predicted brain-age and chronological age for the testing cohorts pooled together: R2, root mean square error (RMSE), and mean absolute error (MAE) for females and males.
Appendix 1—table 6
Comparison of prediction’s metrics between females and males.
| Fisher’s z | P-Value | |
|---|---|---|
| Females vs males | 1.542 | 0.123 |
-
Testing whether the Pearson’s correlation coefficients from the brain-age prediction against the chronological age is similar between males and females pooled from all independent cohorts, via Fisher transformation.
Appendix 1—table 7
Prediction metrics for all independent cohorts using aging signature.
| Aging Signature – performance for brain age prediction | |||||
|---|---|---|---|---|---|
| Correlation with age | MAE (y) | R2 | RMSE | ||
| Cohorts | |||||
| ALFA+ | –0.230 | <0.001 | 3.83 | 0.06 | 4.61 |
| ADNI | –0.256 | <0.001 | 4.60 | 0.07 | 5.85 |
| EPAD | –0.412 | <0.001 | 5.26 | 0.17 | 6.43 |
| OASIS | –0.455 | <0.001 | 6.64 | 0.21 | 8.41 |
-
We tested the linear association of the widely-used neuroanatomical aging signature (Bakkour et al., 2013) with chronological age, to compare its performance with the XGboost brain-age prediction. The aging signature is a map of specific brain regions that undergo cortical atrophy in normal aging. Our brain-age estimation outperformed the aging signature (Pearson’s r [William’s test], P<0.001; RMSE [F-test] P<0.001, for all cohorts). These analyses were computed on the Pearson’s correlation coefficient (R) between predicted brain-age and chronological age, R2, root mean square error (RMSE), and mean absolute error (MAE) for each of the independent cohorts after bias correction.
Appendix 1—table 8
Interaction affects between age and sex effects for each signiciant SHAP-selected ROI.
| Cortical thickness | Subcortical Volumes | Cortical Volumes | |||
|---|---|---|---|---|---|
| ROI | P>|t| | ROI | P>|t| | ROI | P>|t| |
| L_frontalpole | <0.0001 | 3rd-Ventricle | <0.0001 | L_entorhinal | 0,019 |
| L_inferiorparietal | 0,104 | 4th-Ventricle | 0,976 | L_insula | <0.0001 |
| L_isthmuscingulate | <0.0001 | Brain-Stem | <0.0001 | L_isthmuscingulate | <0.0001 |
| L_lateraloccipital | 0,235 | CC_Anterior | <0.0001 | L_middletemporal | <0.0001 |
| L_lateralorbitofrontal | <0.0001 | CC_Central | 0,828 | L_parsopercularis | <0.0001 |
| L_middletemporal | 0,285 | CC_Mid_Posterior | 0,685 | L_parsorbitalis | <0.0001 |
| L_paracentral | 0,08 | CC_Posterior | 0,024 | L_parstriangularis | <0.0001 |
| L_parstriangularis | 0,014 | CSF | 0,136 | L_pericalcarine | 0,007 |
| L_precentral | <0.0001 | Left-Accumbens-area | <0.0001 | L_rostralmiddlefrontal | <0.0001 |
| L_precuneus | 0,007 | Left-Amygdala | <0.0001 | L_superiorfrontal | <0.0001 |
| L_superiorfrontal | <0.0001 | Left-Caudate | <0.0001 | R_entorhinal | 0,006 |
| L_superiortemporal | 0,071 | Left-Cerebellum-Cortex | <0.0001 | R_fusiform | <0.0001 |
| L_transversetemporal | <0.0001 | Left-Cerebellum-White-Matter | <0.0001 | R_insula | <0.0001 |
| R_caudalanteriorcingulate | 0,452 | Left-Hippocampus | <0.0001 | R_middletemporal | <0.0001 |
| R_cuneus | 0,235 | Left-Inf-Lat-Vent | <0.0001 | R_parsorbitalis | <0.0001 |
| R_frontalpole | <0.0001 | Left-Lateral-Ventricle | <0.0001 | R_parstriangularis | <0.0001 |
| R_inferiorparietal | 0,379 | Left-Putamen | <0.0001 | R_pericalcarine | 0,258 |
| R_lateraloccipital | 0,212 | Left-Thalamus-Proper | <0.0001 | R_postcentral | <0.0001 |
| R_lateralorbitofrontal | <0.0001 | Left-VentralDC | <0.0001 | R_rostralmiddlefrontal | <0.0001 |
| R_lingual | 0,789 | Left-choroid-plexus | <0.0001 | R_superiorfrontal | <0.0001 |
| R_middletemporal | 0,205 | Optic-Chiasm | <0.0001 | R_supramarginal | <0.0001 |
| R_paracentral | 0,301 | Right-Amygdala | <0.0001 | R_transversetemporal | <0.0001 |
| R_parstriangularis | 0,088 | Right-Caudate | <0.0001 | ||
| R_pericalcarine | 0,086 | Right-Cerebellum-Cortex | <0.0001 | ||
| R_posteriorcingulate | 0,003 | Right-Cerebellum-White-Matter | <0.0001 | ||
| R_precentral | <0.0001 | Right-Hippocampus | <0.0001 | ||
| R_precuneus | 0,215 | Right-Inf-Lat-Vent | <0.0001 | ||
| R_rostralmiddlefrontal | <0.0001 | Right-Lateral-Ventricle | <0.0001 | ||
| R_superiorfrontal | 0,003 | Right-Pallidum | <0.0001 | ||
| R_superiortemporal | 0,183 | Right-Putamen | <0.0001 | ||
| R_transversetemporal | <0.0001 | Right-Thalamus-Proper | <0.0001 | ||
| Right-VentralDC | <0.0001 | ||||
| Right-choroid-plexus | <0.0001 | ||||
Appendix 1—table 9
Comparison of brain-age deltas for the different amyloid-β, AT and APOE status.
| Mean square | F | P-Value | |
|---|---|---|---|
| CU | |||
| Amyloid-β status | 35.787 | 39.369 | <0.001 |
| AT Stage | 21.550 | 11.626 | <0.001 |
| APOE status | 16.218 | 5.862 | <0.001 |
| MCI | |||
| Amyloid-β status | 47.166 | 52.412 | <0.001 |
| AT Stage | 50.064 | 27.701 | <0.001 |
| APOE status | 10.049 | 3.425 | 0.017 |
-
Brain-age deltas for pooled CU and MCI individuals were compared for the different amyloid-β, AT and APOE status with ANCOVA models adjusted by age and sex.
-
Amyloid-β status was defined by CSF (ALFA+, ADNI and EPAD) or amyloid PET (OASIS).
-
Significant values (P<0.05) are marked in bold.
-
APOE, apolipoprotein E; ANCOVA, analysis of covariance.
Appendix 1—table 10
Mean brain-age delta values for the different amyloid-β, AT and APOE status.
| CU brain-age delta, M (95% CI) | MCI brain-age delta, M (95% CI) | ||
|---|---|---|---|
| Amyloid-β status | Aβ- | –0.468 (-0.708,–0.228) | –1.618 (-2.231,–1.005) |
| Aβ+ | 0.802 (0.485, 1.119) | 1.033 (0.577, 1.490) | |
| AT Stage | A-T- | –0.214 (-0.507, 0.078) | –1.623 (-2.239,–1.007) |
| A+T- | 0.916 (0.506, 1.325) | 0.561 (-0.066, 1.188) | |
| A+T + | 0.945 (0.140, 1.750) | 1.410 (-0.753, 2.066) | |
| APOE status | APOE-ε2 | –0.726 (-1.298,–0.153) | –0.660 (-2.234, 0.914) |
| APOE-ε33 | –0.225 (-0.506, 0.056) | –0.522 (-1.0750, 0.031) | |
| APOE-ε4 | 0.503 (0.193, 0.813) | 0.617 (0.050, 1.184) | |
| APOE-ε24 | –0.092 (-1.109, 0.924) | 1.257 (-1.067, 3.581) | |
-
Notes: brain-age delta are expressed as mean (M) and 95% confidence interval (CI).
-
Amyloid-β status was defined by CSF (ALFA+, ADNI and EPAD) or amyloid PET (OASIS). Abbreviations: APOE, apolipoprotein E.
Appendix 1—table 11
Relationships between validation variables and brain-age delta across independent cohorts.
| Model | β | SE | P-Value | [0.025] | [0.975] | N | Effect size | |||
|---|---|---|---|---|---|---|---|---|---|---|
| ALFA+ | ||||||||||
| Amyloid-β pathology | 0.796 | 0.377 | 0.035 | 0.056 | 1.537 | 355 | 0.217 | |||
| Amyloid-β / Tau pathology (ref: A-T-) | A+T- | 1.028 | 0.409 | 0.013 | 0.222 | 1.832 | 355 | 0.225 | ||
| A+T + | 0.855 | 0.929 | 0.358 | –0.973 | 2.682 | 355 | 0.225 | |||
| APOE status (ref: APOE-e33) | APOE-ε2 | –1.278 | 0.780 | 0.102 | –2.811 | 0.255 | 355 | 0.325 | ||
| APOE-ε4 | 0.002 | 0.397 | 0.996 | –0.231 | 0.817 | 0.001 | ||||
| APOE-ε24 | –0.294 | 1.273 | 0.817 | –2.797 | 2.797 | 0.075 | ||||
| WMH | 0.724 | 0.236 | 0.002 | 0.260 | 1.187 | 337 | 0.028 | |||
| CSF NfL | 0.106 | 0.199 | 0.593 | –0.284 | 0.497 | 357 | 0.001 | |||
| Plasma NfL | 0.116 | 0.217 | 0.594 | –0.311 | 0.543 | 343 | 0.001 | |||
| Aging signature change | 0.082 | 0.234 | 0.728 | –0.378 | 0.542 | 236 | 0.001 | |||
| ADNI | ||||||||||
| Amyloid-β | 0.182 | 0.525 | 0.730 | –0.852 | 1.216 | 233 | 0.047 | |||
| Amyloid-β / Tau pathology (ref: A-T-) | A+T- | –0.375 | 0.620 | 0.546 | –1.597 | 0.847 | 232 | 0.096 | ||
| A+T + | 0.855 | 0.711 | 0.230 | –0.546 | 2.255 | 232 | 0.225 | |||
| APOE status (ref: APOE-e33) | APOE-ε2 | 0.525 | 0.801 | 0.513 | –1.055 | 2.104 | 233 | 0.142 | ||
| APOE-ε4 | 0.137 | 0.579 | 0.813 | –1.003 | 1.278 | 0.034 | ||||
| APOE-ε24 | –1.183 | 2.811 | 0.674 | –6.722 | 4.356 | 0.000 | ||||
| WMH | 0.483 | 0.243 | 0.040 | 0.004 | 0.963 | 218 | 0.018 | |||
| CSF NfL | 0.707 | 0.784 | 0.380 | –0.947 | 2.361 | 0.048 | ||||
| Plasma NfL | 0.195 | 0.331 | 0.557 | –0.459 | 0.849 | 165 | 0.002 | |||
| Aging signature change | 0.343 | 0.713 | 0.634 | –1.108 | 1.794 | 0.007 | ||||
| EPAD | ||||||||||
| Amyloid-β | 1.410 | 0.311 | <0.001 | 0.800 | 2.020 | 601 | 0.377 | |||
| Amyloid-β / Tau pathology (ref: A-T-) | A+T- | 1.109 | 0.348 | 0.002 | 0.474 | 2.719 | 575 | 0.298 | ||
| A+T + | 1.59 | 0.572 | 0.005 | 0.474 | 2.719 | 575 | 0.417 | |||
| APOE status (ref: APOE-e33) | APOE-ε2 | –0.318 | 0.573 | 0.573 | –1.555 | 0.579 | 601 | 0.008 | ||
| APOE-ε4 | 0.292 | 0.340 | 0.390 | –0.375 | 0.959 | 0.076 | ||||
| APOE-ε24 | –0.506 | 0.807 | 0.531 | –2.090 | 1.078 | 0.131 | ||||
| WMH | 0.783 | 0.182 | <0.001 | 0.426 | 1.140 | 417 | 0.045 | |||
| OASIS | ||||||||||
| Amyloid-β | 0.917 | 0.441 | 0.038 | 0.051 | 1.784 | 407 | 0.246 | |||
| APOE status (ref: APOE-e33) | APOE-ε2 | –0.228 | 0.532 | 0.668 | –1.272 | 0.817 | 407 | 0.060 | ||
| APOE-ε4 | 1.238 | 0.419 | 0.003 | 0.415 | 2.061 | 0.335 | ||||
| APOE-ε24 | 0.412 | 1.086 | 0.702 | –1.719 | 2.550 | 0.111 | ||||
-
Notes: Relationships between validation variables and brain-age delta for all CU subjects from each cohort. Results given by the linear model: brain-age delta ~each variable +chronological age+sex. The regression coefficients (β), standard errors (SE), P-value, 95% Confidence Interval, number of individuals (N) and effect size are depicted for each variable.
-
Significant values (P<0.05) are marked in bold.
-
Effect size in categorical variables was calculated as Cohen’s D, while Cohens f2 was calculated for continuous measurements.
-
Amyloid-β status was defined by CSF (ALFA+, ADNI and EPAD) or amyloid PET (OASIS).
-
APOE, apolipoprotein E; WMH, White Matter Hyperintensities; CSF, cerebrospinal fluid; NfL, neurofilament light.
Additional files
Download links
A two-part list of links to download the article, or parts of the article, in various formats.
Downloads (link to download the article as PDF)
Open citations (links to open the citations from this article in various online reference manager services)
Cite this article (links to download the citations from this article in formats compatible with various reference manager tools)
Biological brain age prediction using machine learning on structural neuroimaging data: Multi-cohort validation against biomarkers of Alzheimer’s disease and neurodegeneration stratified by sex
eLife 12:e81067.
https://doi.org/10.7554/eLife.81067


