GCN2 eIF2 kinase promotes prostate cancer by maintaining amino acid homeostasis
- Department of Biochemistry and Molecular Biology, Indiana University School of Medicine, United States
- Indiana University Melvin and Bren Simon Comprehensive Cancer Center, United States
- Department of Neurological Surgery, Indiana University School of Medicine, United States
- Department of Nutritional Sciences, Rutgers University, United States
- Department of Comparative Pathology, Purdue University, United States
- Department of Urology, Indiana University School of Medicine, United States
- Department of Medical and Molecular Genetics, Indiana University School of Medicine, United States
- Department of Pathology and Laboratory Medicine, Indiana University School of Medicine, United States
- Jacobs School of Medicine and Biomedical Sciences, University at Buffalo, United States
Figures
Figure 1 with 6 supplements
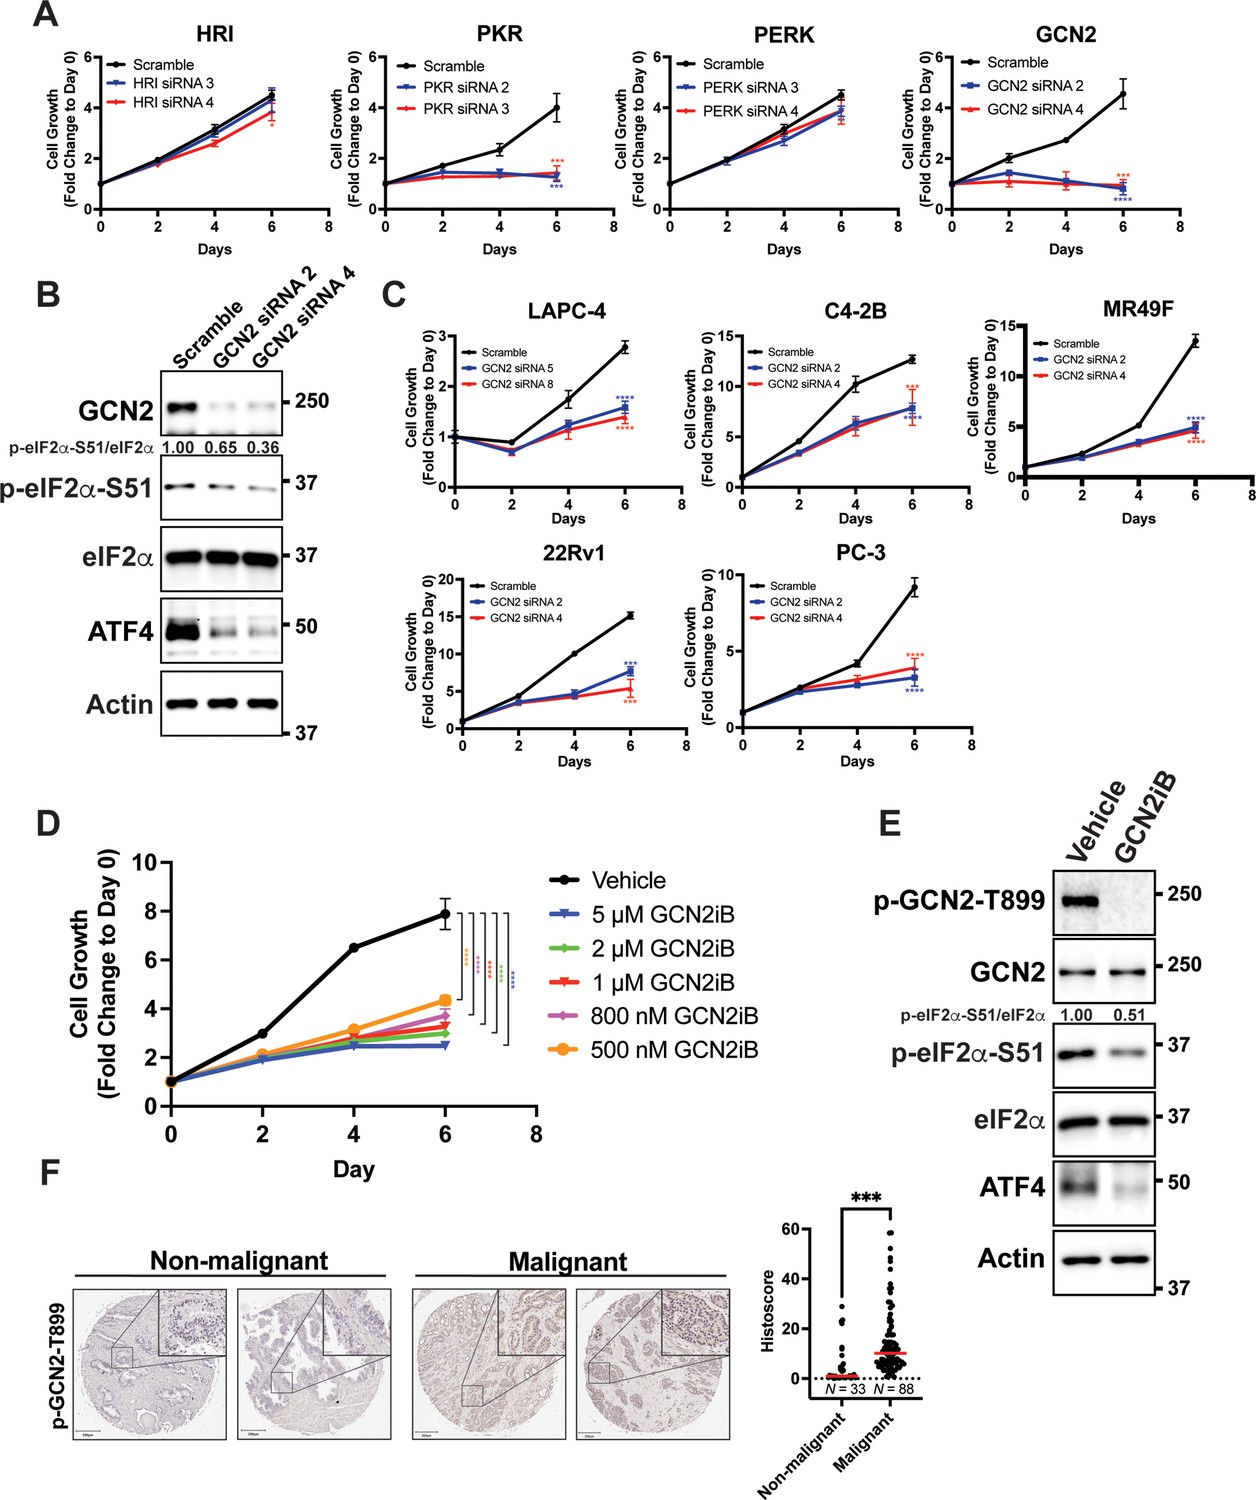
GCN2 promotes growth of prostate cancer (PCa) cells.
(A) Expression of the indicated eIF2α kinase was reduced in LNCaP cells using gene-specific siRNAs. Two different siRNAs were used for knockdown of each eIF2α kinase and compared to scrambled siRNA control. Cell growth was measured in replicate wells (N = 5) for up to 6 days and is plotted as fold change (mean ± standard deviation [SD]) relative to day 0. Statistical significance was determined using a two-way analysis of variance (ANOVA) as described in Supplementary file 1; *p ≤ 0.05, ***p ≤ 0.001, ****p ≤ 0.0001. (B) LNCaP cells were transfected with two different siRNAs targeting GCN2 or a scramble siRNA control and cell lysates were prepared and immunoblotted for the indicated proteins. Molecular weight markers are shown in kilodaltons. The relative levels of p-eIF2α normalized to total eIF2α compared to scramble siRNA control are indicated. (C) Expression of GCN2 was knocked-down in LAPC-4, C4-2B, MR49F, 22Rv1, or PC-3 cells using two different siRNAs and compared to scrambled siRNA control. Cell growth was measured for up to 6 days in replicate wells (N = 5) as described in A. Statistical significance was determined using a two-way ANOVA as described in Supplementary file 1; ***p ≤ 0.001, ****p ≤ 0.0001. (D) LNCaP cells were treated with indicated concentrations of GCN2iB and cell growth was measured for up to 6 days in replicate wells (N = 5) as described in A. Statistical significance was determined using a two-way ANOVA as described in Supplementary file 1; ****p ≤0.0001. (E) LNCaP cells were treated with GCN2iB (2 µM) or DMSO control for 24 hr and protein lysates were analyzed by immunoblot using antibodies that recognize total or phosphorylated GCN2-T899, total or phosphorylated eIF2α−S51, ATF4, or actin as indicated. Relative levels of p-eIF2α normalized to total eIF2α are shown. (F) Levels of p-GCN2 were measured in prostate tumor microarrays (Biomax PR1921b and PR807c) using immunohistochemistry (IHC). Staining for p-GCN2-T899 from non-malignant (N = 33) and malignant PCa tissue (N = 88) from patients >50 years old was analyzed and quantified using QuPath to determine the histoscore and is represented as a scatterplot. Statistical significance was determined using an unpaired two-tailed t-test; *p ≤ 0.05. Representative images showing p-GCN2-T899 staining of normal and malignant prostate tissues are shown. Scale bars shown are 200 µm (main image) and 20 µm (insert).
Figure 1—figure supplement 1
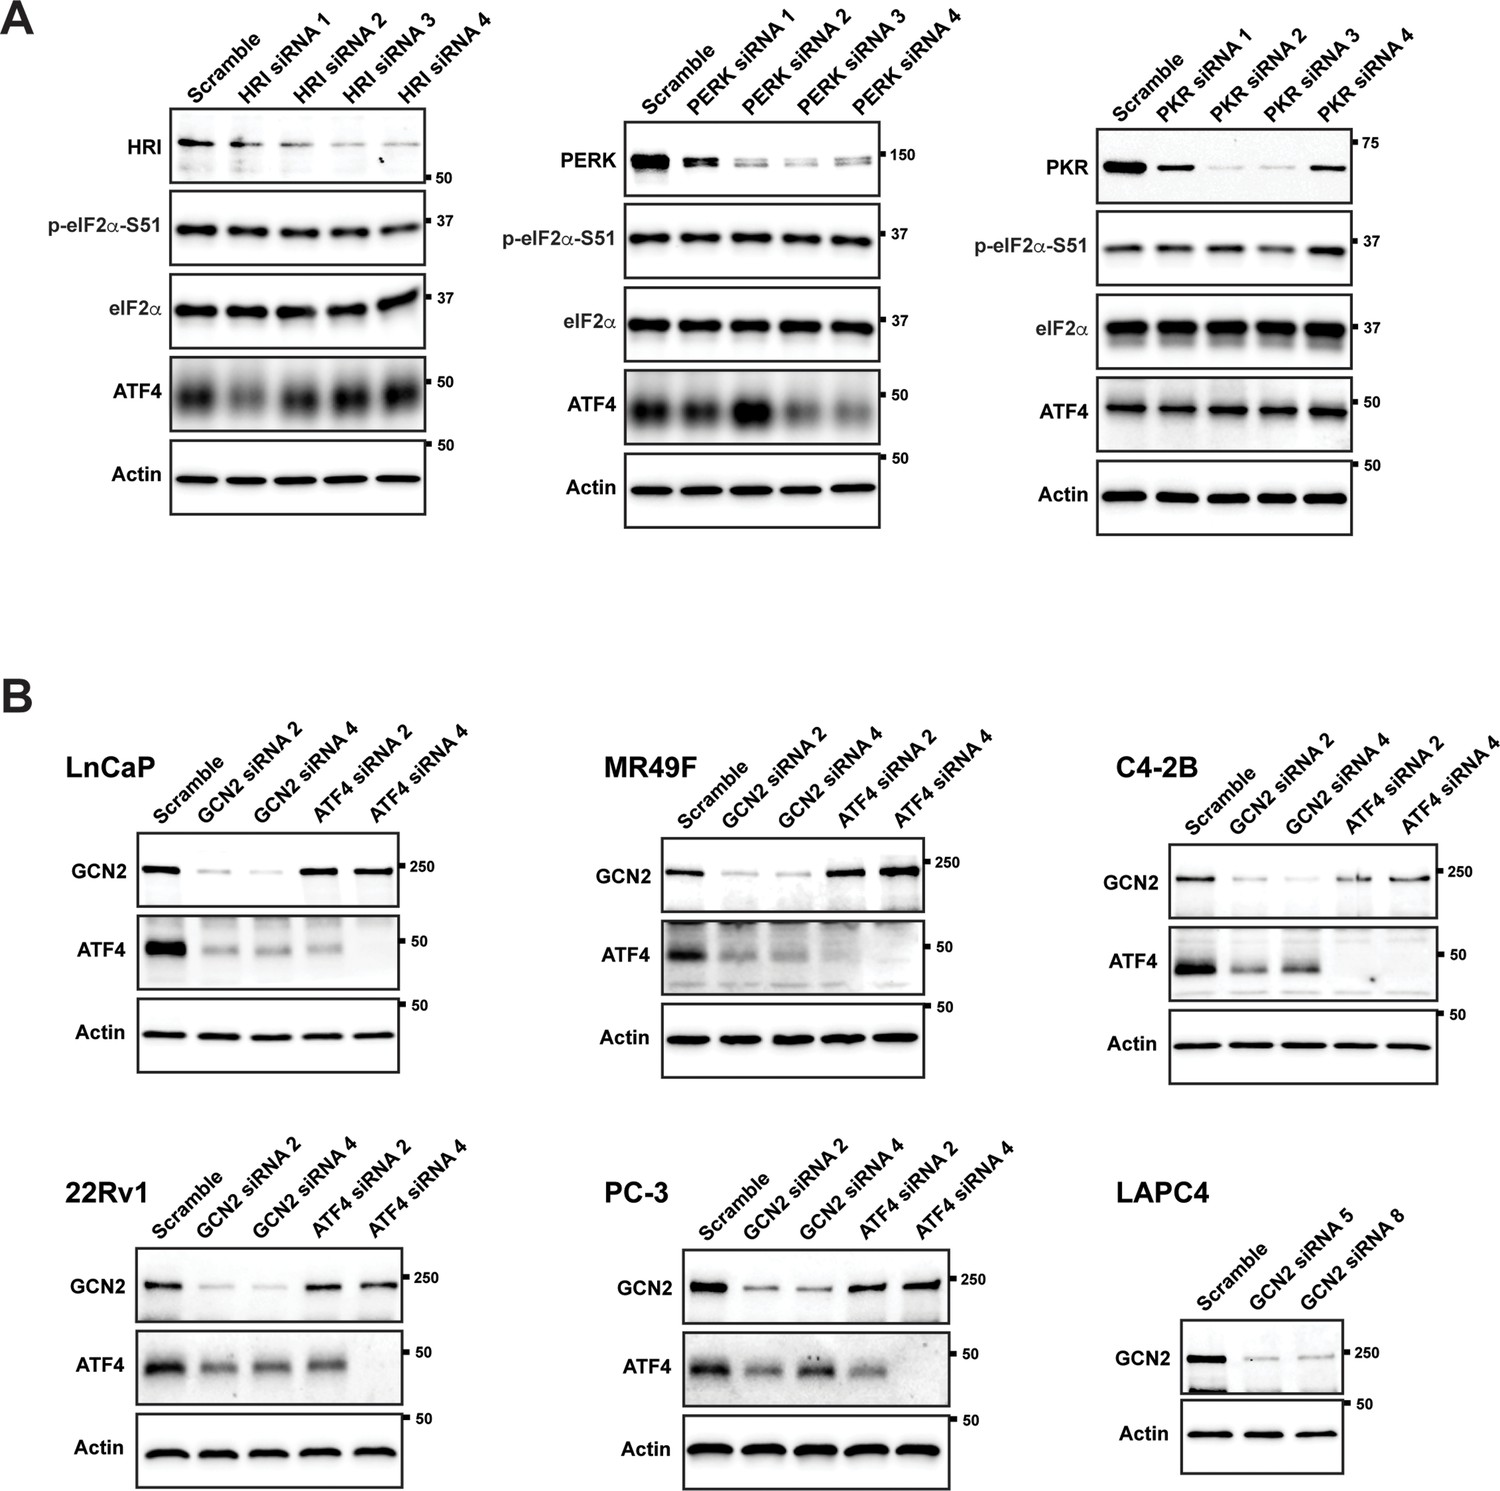
Knockdown of eIF2α kinases and ATF4 in prostate cancer (PCa) cell lines.
(A) LNCaP cells were transfected with the indicated gene-specific siRNAs or a scramble control and the protein levels of HRI, PERK, or PKR and p-eIF2α, total eIF2α, and ATF4 were measured by immunoblot. Measurements of actin were used as a protein loading control in the immunoblot experiments. Molecular weight markers are shown in kilodaltons. (B) The indicated PCa cell lines were transfected with siRNAs targeting GCN2 or ATF4. Protein lysates were prepared and analyzed by immunoblot to determine the levels of GCN2, ATF4, or actin as indicated. ATF4 was not detected in the LAPC-4 cells.
Figure 1—figure supplement 2
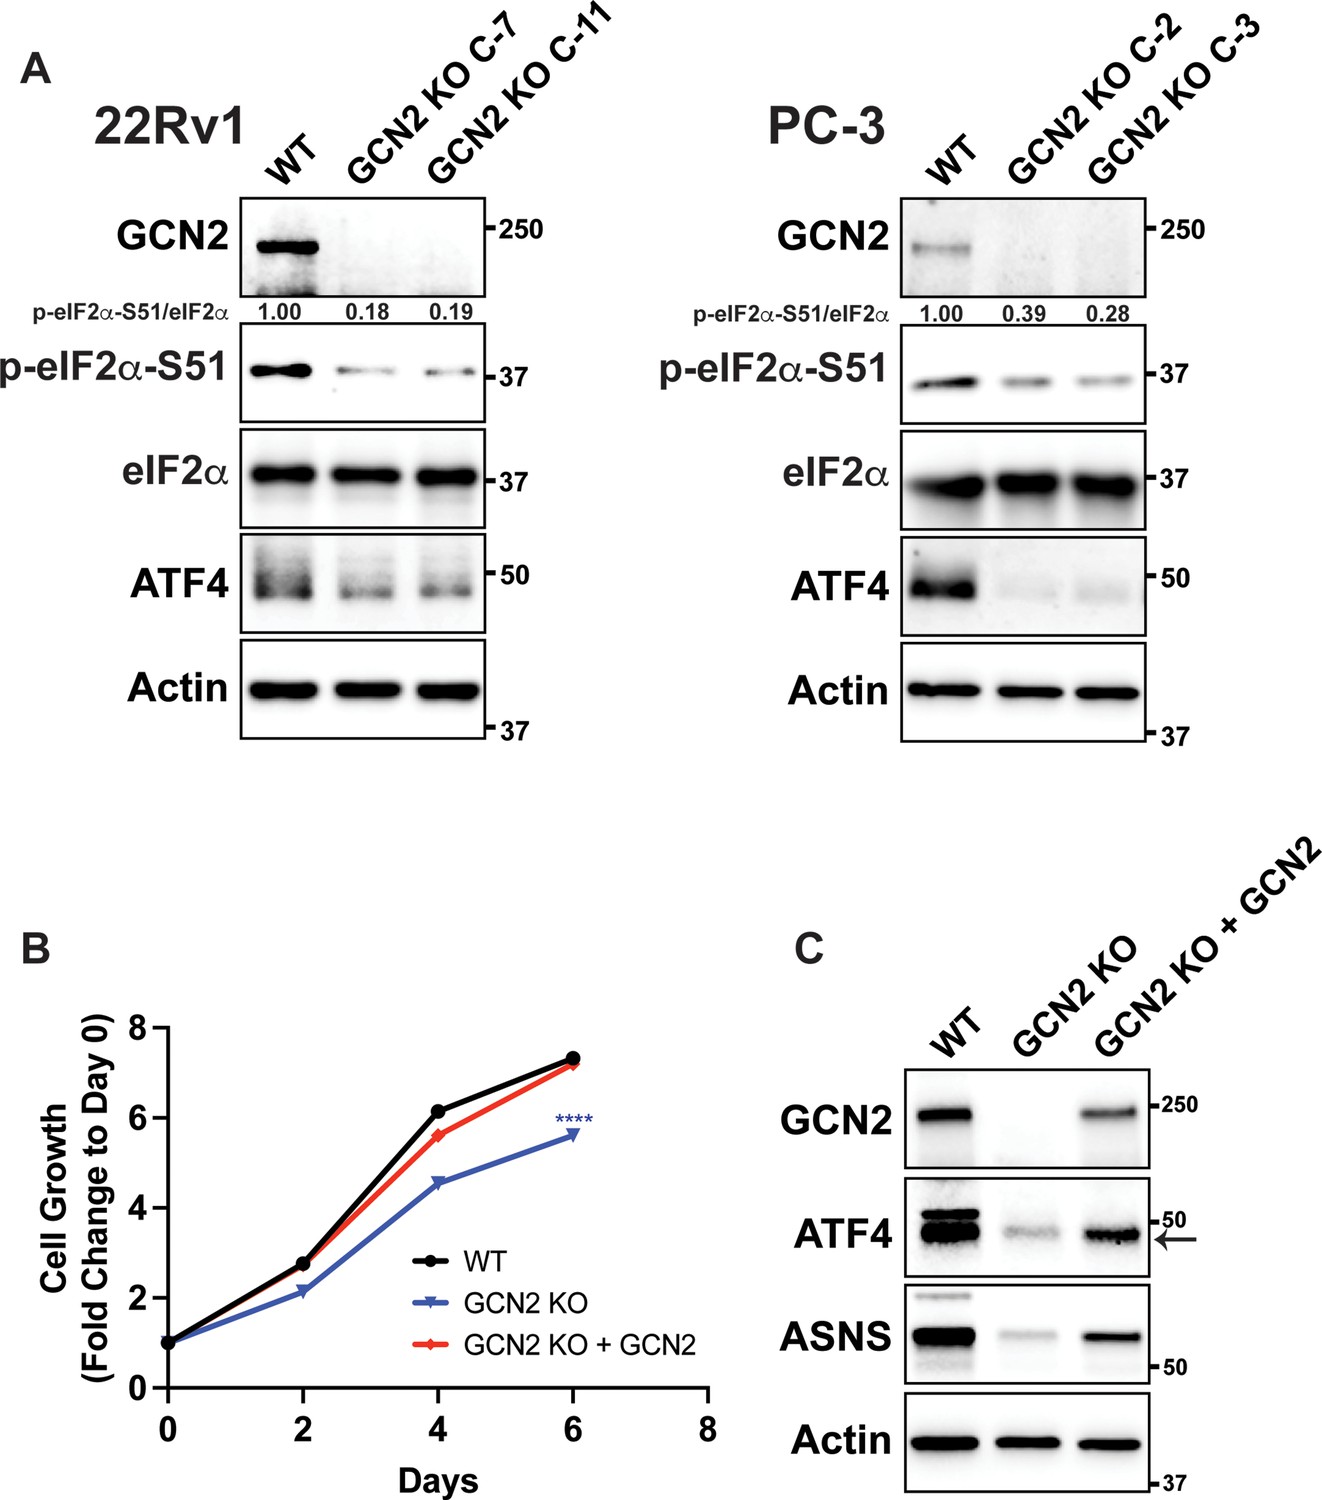
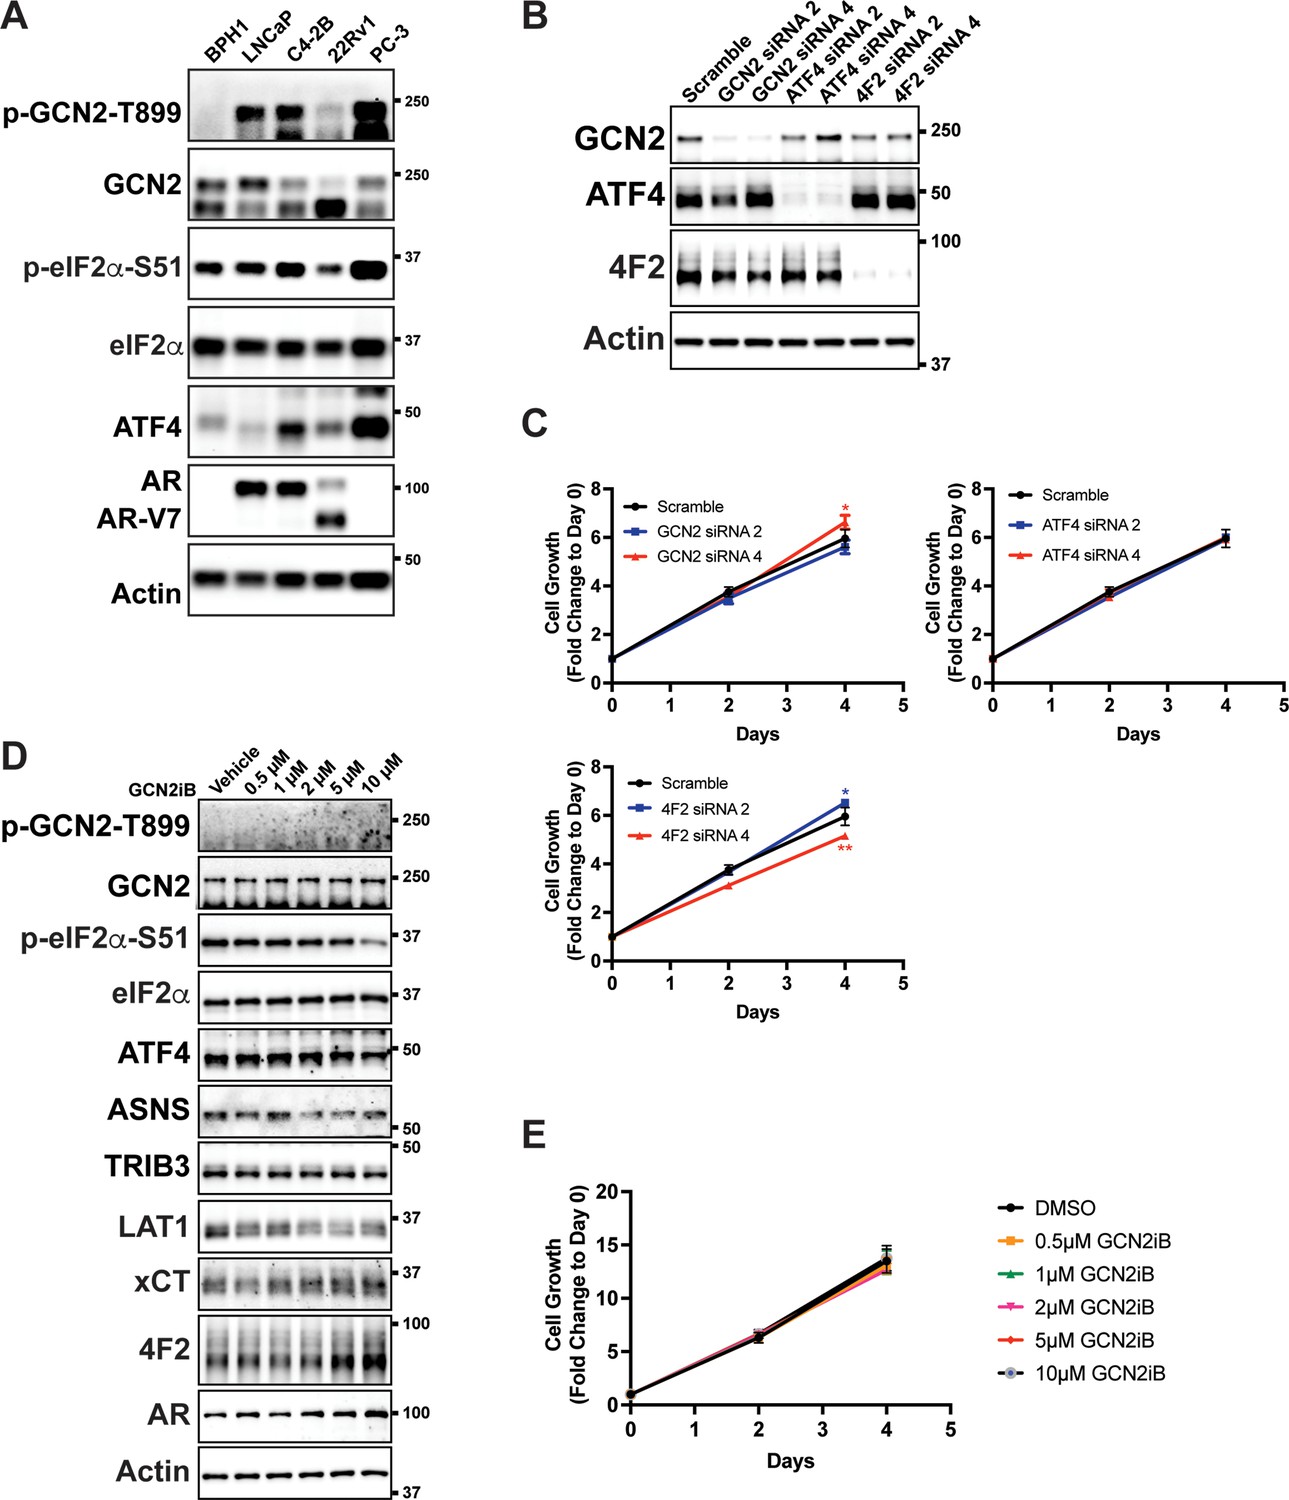
CRISPR/Cas9 knockout of GCN2 in 22Rv1 and PC-3 cells.
(A) Immunoblot analyses for 22Rv1, PC-3, and GCN2 KO clones. Protein lysates were analyzed by immunoblot to measure the levels of GCN2, ATF4, p-eIF2α, total eIF2α, or actin. Molecular weight markers are shown in kilodaltons. The relative levels of p-eIF2α normalized to total eIF2α compared to wild-type (WT) parental control are indicated. (B) Growth curve of 22Rv1 WT, 22Rv1 GCN2 KO (clone 7), or 22Rv1 GCN2 KO (clone 7) cells overexpressing GCN2. Data from replicate wells (N = 5) are shown as fold change (mean ± standard deviation [SD]) relative to day 0. Statistical significance was determined using a two-way analysis of variance (ANOVA) as described in Supplementary file 1; ****p ≤ 0.0001. (C) Protein lysates prepared from the 22Rv1 WT, 22Rv1 GCN2 KO (clone 7), or 22Rv1 GCN2 KO (clone 7) cells expressing GCN2 were analyzed by immunoblot for GCN2, ATF4, ASNS, or actin.
Figure 1—figure supplement 3
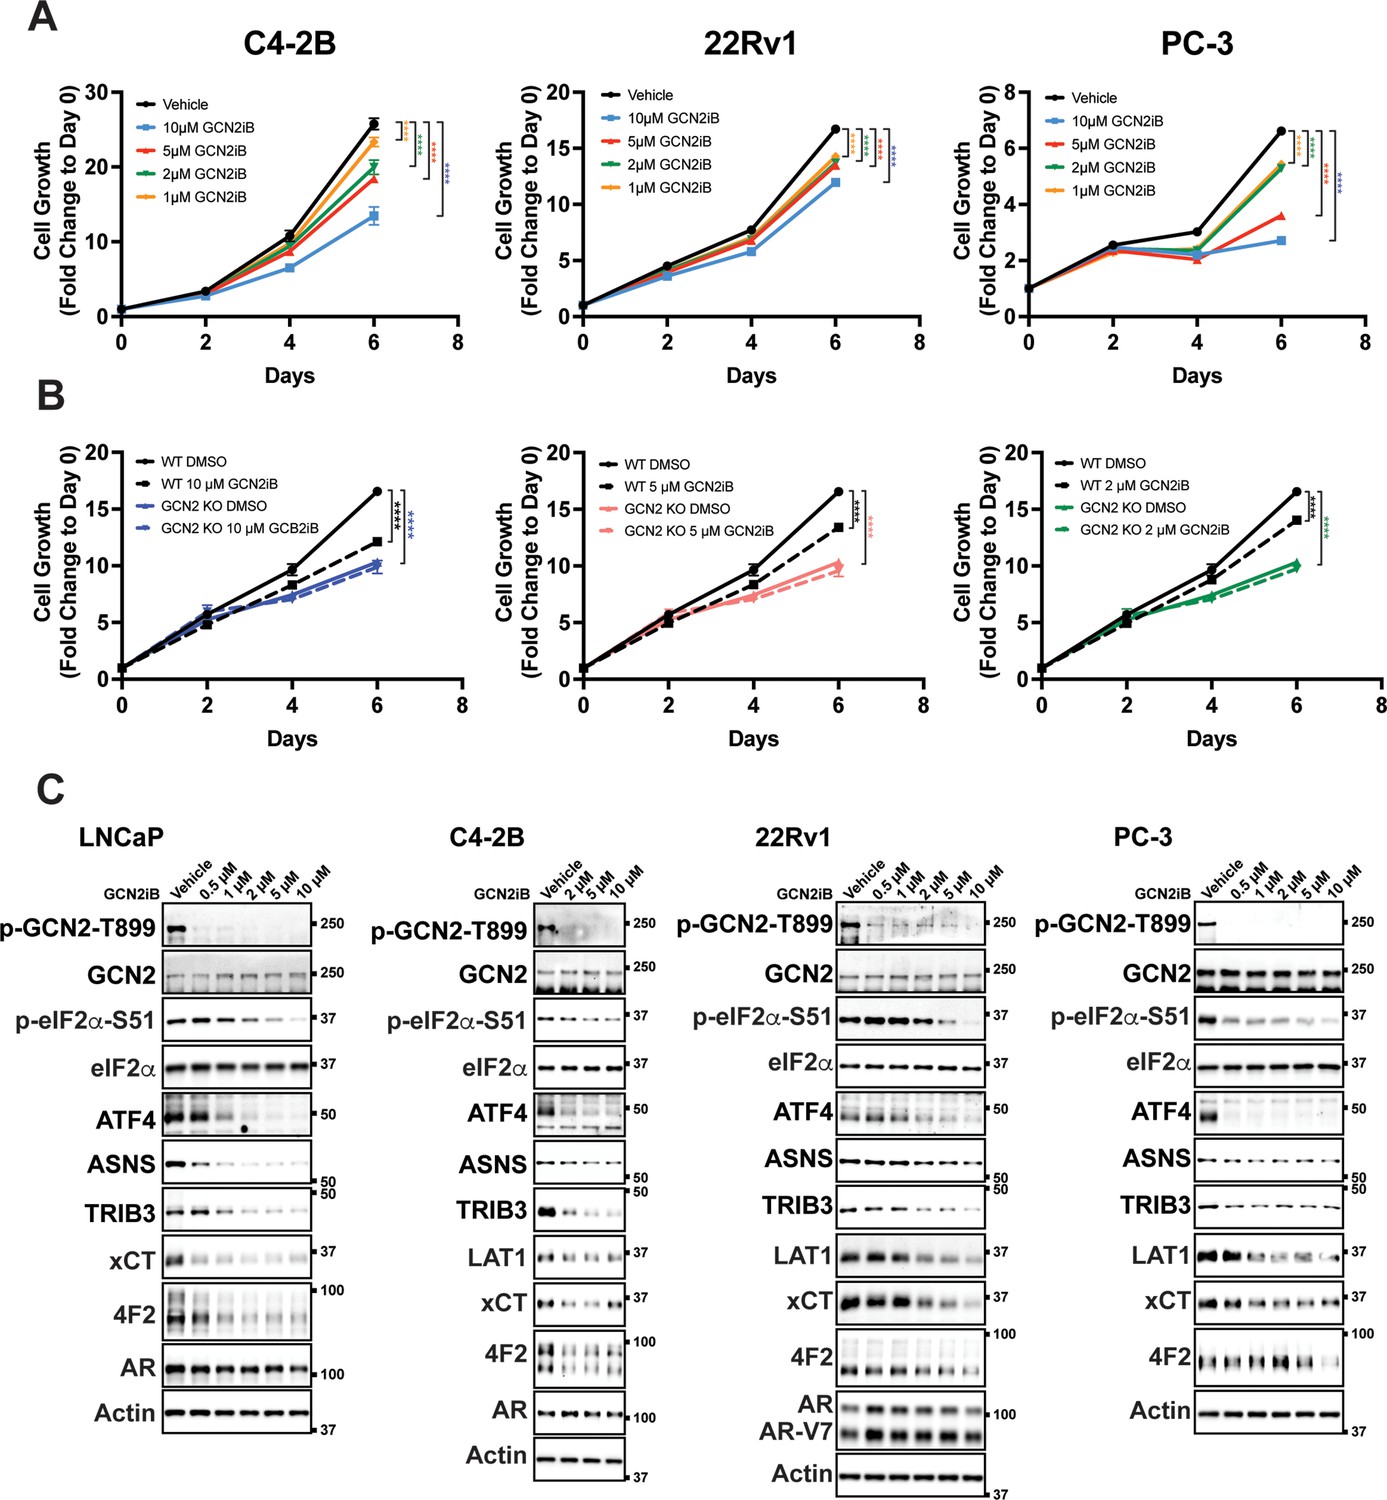
Inhibition of the integrated stress response (ISR) by GCN2iB in prostate cancer (PCa) cell lines.
(A) C4-2B or 22Rv1 cells, cultured as indicated in the Materials and methods, or PC-3 cells cultured in HPLM media were treated with GCN2iB as indicated for up to 6 days. Cell growth was measured (N = 5) and plotted as fold change (mean ± standard deviation [SD]) relative to day 0. Statistical significance was determined using a two-way analysis of variance (ANOVA) as described in Supplementary file 1; ****p ≤ 0.0001. (B) 22Rv1 WT and 22Rv1 GCN2 KO (clone 7) cells were treated with GCN2iB as indicated for up to 6 days. Cell growth was measured (N = 5) and plotted as fold change (mean ± SD) relative to day 0. Statistical significance was determined using a two-way ANOVA as described in Supplementary file 1; ****p ≤ 0.0001. (C) Lysates were prepared from C4-2B, 22Rv1, or PC-3 cells treated with GCN2iB at the indicated concentrations or vehicle control (dimethyl sulfoxide, DMSO) for 48 hr and immunoblot analysis was carried out using antibodies that recognize p-GCN2-T899, total GCN2, p-eIF2α-S51, total eIF2α, ATF4, ASNS, TRIB3, LAT1 (SLC7A5), xCT (SLC7A11), 4F2 (SLC3A2) AR, or actin. Molecular weight markers are indicated in kilodaltons.
Figure 1—figure supplement 4
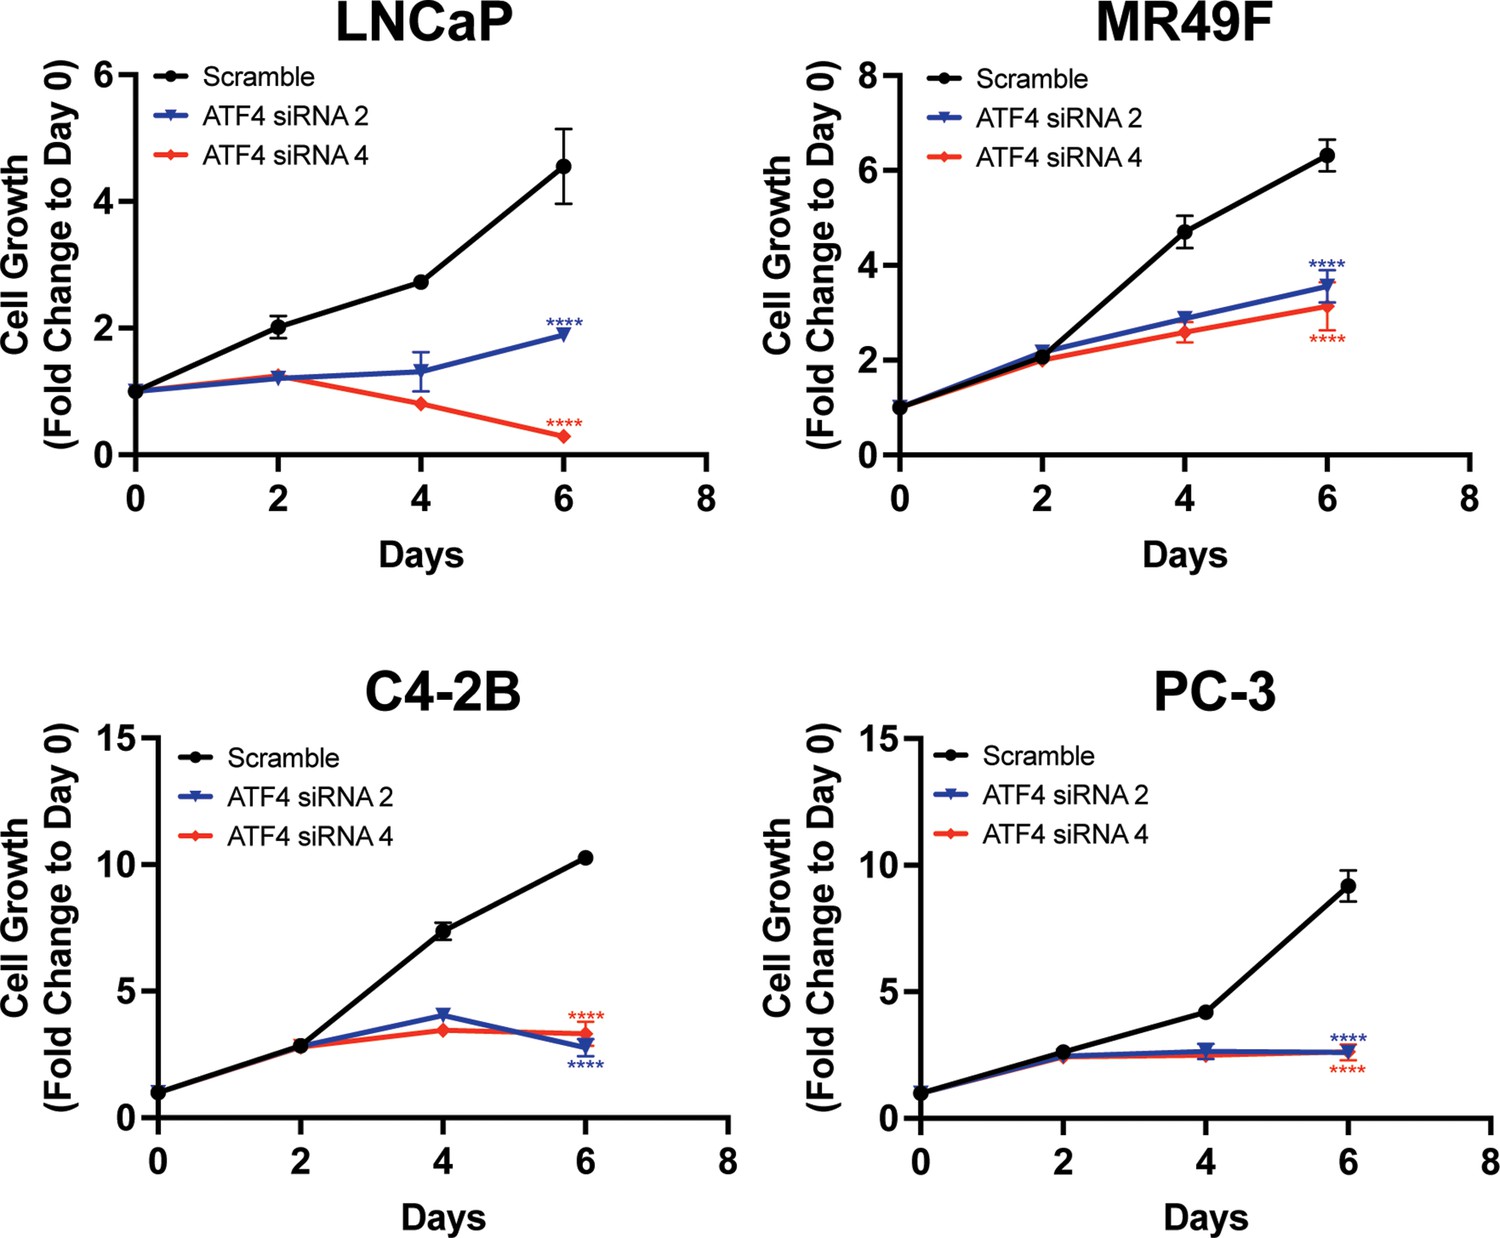
Knockdown of ATF4 reduces growth in prostate cancer (PCa) cell lines.
ATF4 expression was reduced in LNCaP, MR49F, C4-2B, or PC-3 cells using ATF4-specific siRNAs. Cell growth was measured in replicate wells (N = 5) for up to 6 days and is plotted as fold change (mean ± standard deviation [SD]) relative to day 0. Statistical significance was determined using a two-way analysis of variance (ANOVA) as described in Supplementary file 1; ****p ≤ 0.0001.
Figure 1—figure supplement 5
Inhibition of GCN2 in non-cancerous prostate cell line BPH-1.
(A) Lysates were prepared from BPH-1, LNCaP C4-2B, 22Rv1, or PC-3 cells and immunoblot analysis was carried out using antibodies that recognize p-GCN2-T899, total GCN2, p-eIF2α-S51, total eIF2α, ATF4, AR, or actin. Molecular weight markers are indicated in kilodaltons. (B) BPH-1 cells were transfected with siRNAs targeting GCN2, ATF4, or 4F2 (SLC3A2). Protein lysates were prepared and analyzed by immunoblot to determine the levels of GCN2, ATF4, 4F2 (SLC3A2), or actin as indicated. Molecular weight markers are indicated in kilodaltons. (C) Expression of GCN2, ATF4, or 4F2 (SLC3A2) was reduced in BPH-1 cells using two different gene-specific siRNAs as indicated and compared to a scramble siRNA control. Cell growth was measured for up to 6 days in replicate wells (N = 5) as described in A. Statistical significance was determined using a two-way analysis of variance (ANOVA) as described in Supplementary file 1; *p ≤ 0.05, **p ≤ 0.01. (D) Lysates were prepared from BPH-1 cells treated with GCN2iB at the indicated concentrations or vehicle control (DMSO) for 48 hr and immunoblot analysis was carried out using antibodies that recognize p-GCN2-T899, total GCN2, p-eIF2α-S51, total eIF2α, ATF4, ASNS, TRIB3, LAT1 (SLC7A5), xCT (SLC7A11), 4F2 (SLC3A2), AR, or actin. Molecular weight markers are indicated in kilodaltons. (E) BPH-1 cells were treated with 0.5–10 µM GCN2iB or vehicle (DMSO) control as indicated for up to 6 days. Cell growth was measured (N = 5) and plotted as fold change (mean ± standard deviation [SD]) relative to day 0. Statistical significance was determined using a two-way ANOVA is shown in Supplementary file 1.
Figure 1—figure supplement 6
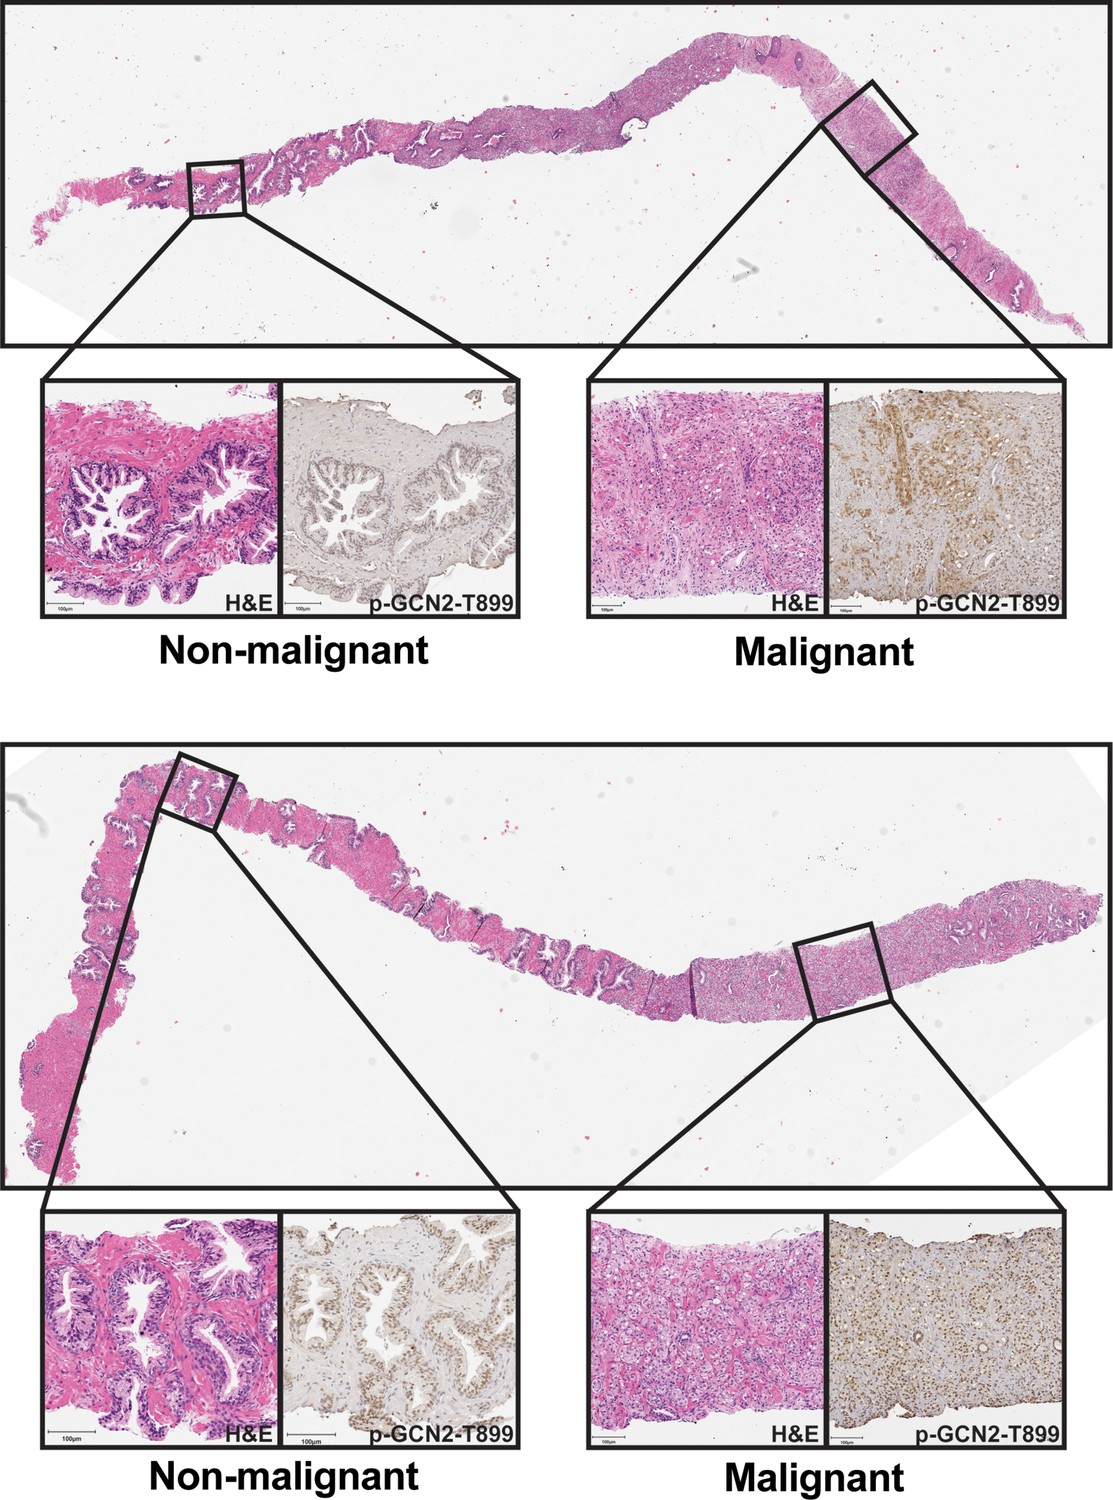
p-GCN2 staining of prostate core needle specimens.
H&E and IHC staining using p-GCN2-T899 antibody in prostatic needle biopsy specimens from patients with prostate cancer with Gleason scores 4 + 4 = 8 (top) or 4 + 5 = 9 (bottom). Non-malignant (left) and malignant (right) prostate tissues are highlighted for both cases.
Figure 2 with 1 supplement
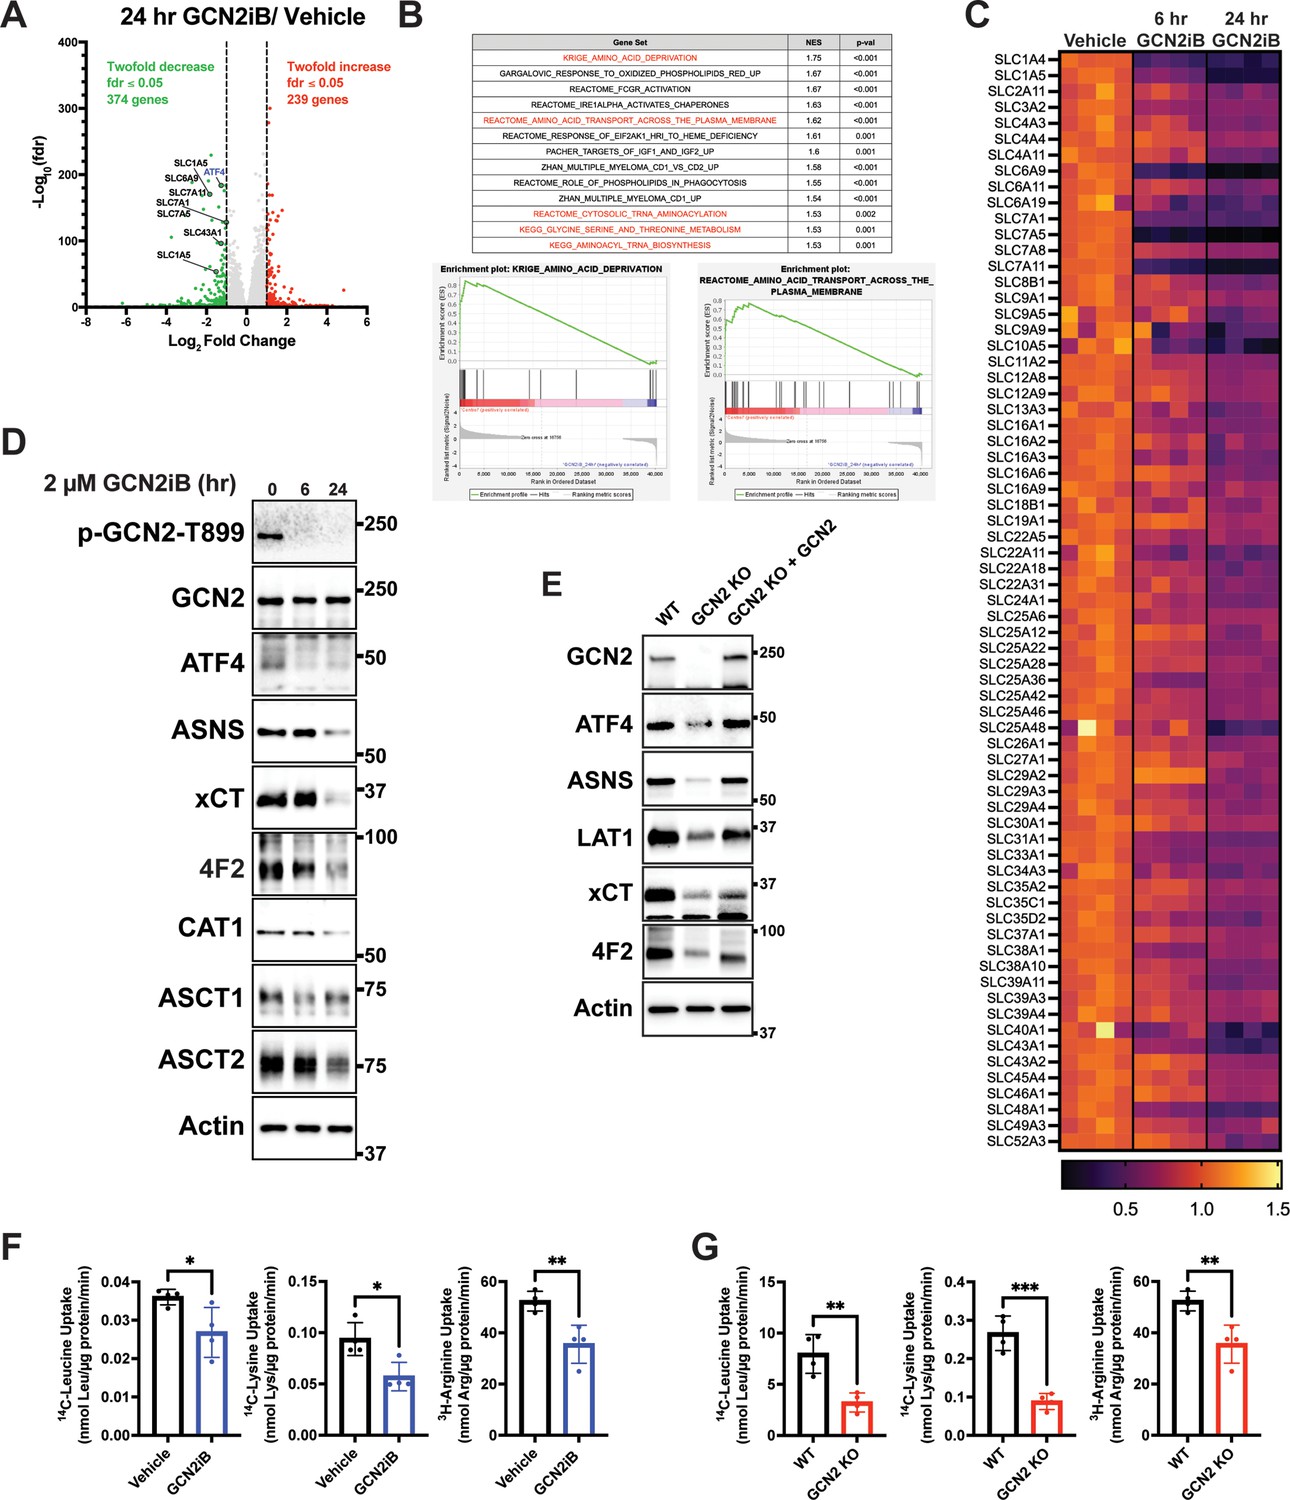
GCN2 induces integrated stress response (ISR) transcriptome featuring expression of amino acid transporters.
(A) Volcano plot illustrating log2 fold change in gene transcript levels with adjusted p value (−log10) comparing LNCaP cells treated with GCN2iB (2 µM) versus vehicle control (DMSO) for 24 hr. Several amino acid transporters reduced by GCN2iB treatment are highlighted. (B) Plots from gene set enrichment analysis (GSEA) of gene expression in LNCaP cells treated with GCN2iB (2 µM) for 24 hr versus vehicle control. (C) Heat map displaying significantly downregulated SLC genes as indicated in panel A. The heat map compares gene transcript levels from LNCaP cells treated with vehicle (DMSO), or GCN2iB (2 µM) for 6 or 24 hr. Four biological replicates were measured for each treatment group. Transcript levels (normalized read counts) are shown relative to the average of the vehicle control samples for each gene. (D) Lysates were prepared from LNCaP cells treated with 2 µM GCN2iB or vehicle control (DMSO) for 6 or 24 hr and immunoblot analysis were carried out using antibodies that recognize ATF4, ASNS, xCT (SLC7A11), 4F2 (SLC3A2), CAT1 (SLC7A1), ASCT1 (SLC1A4), ASCT2 (SLC1A5), or actin. Molecular weight markers are indicated in kilodaltons. (E) 22Rv1 WT cells, 22Rv1 GCN2 KO cells, and 22Rv1 GCN2 KO complemented with GCN2 cells were cultured for 24 hr. Lysates were prepared and analyzed by immunoblot for the indicated proteins. (F) Amino acid uptake measurements in LNCaP and 22Rv1 cells treated with vehicle (DMSO) or GCN2iB (2 µM) for 24 hr. (G) Amino acid uptake measurements for 22Rv1 WT or 22Rv1 GCN2 KO cells cultured for 24 hr. Statistical significance was determined using an unpaired two-tailed t-test (N = 4); *p ≤ 0.05, **p ≤ 0.01, ***p ≤ 0.001.
Figure 2—figure supplement 1
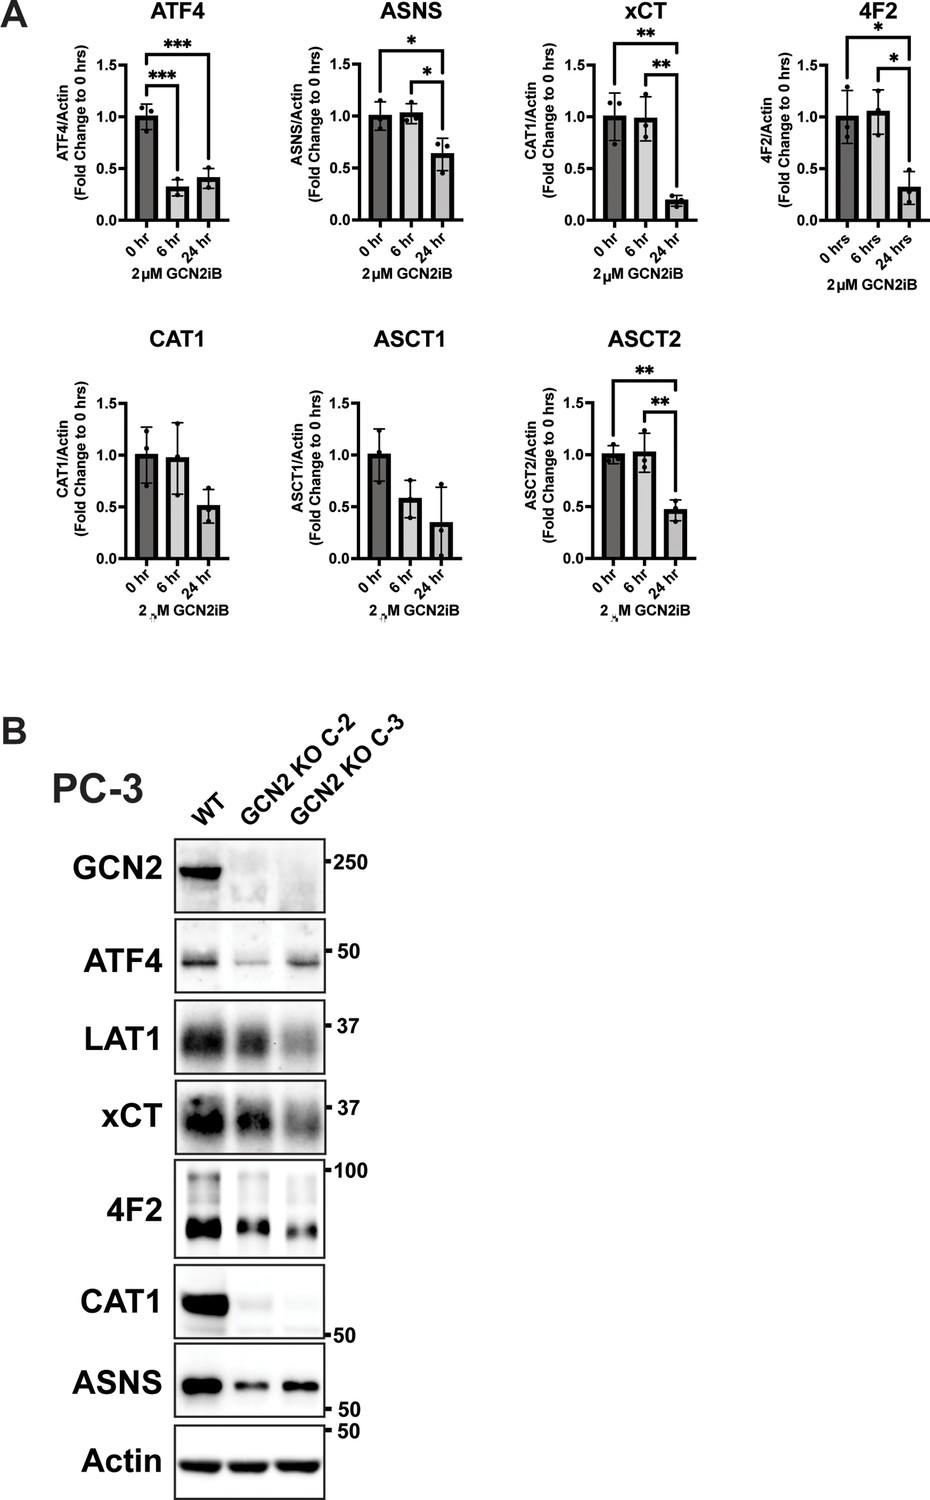
Inhibition of GCN2 in prostate cancer (PCa) cells reduces expression of SLC genes involved in amino acid transport.
(A) LNCaP cells were treated with 2 µM GCN2iB or vehicle control (DMSO) for 6 or 24 hr, protein lysates were prepared, and immunoblotted for the indicated proteins. The bar graphs show the relative levels of the indicated proteins normalized to actin. Statistical significance was determined using an unpaired two-tailed t-test. Error bars indicate standard deviation (SD) (N = 3); *p ≤ 0.05, **p ≤ 0.01, ***p ≤ 0.001. (B) Immunoblot analysis of PC-3 WT, PC-3 GCN2 KO (clone C-2), and PC-3 GCN2 KO (clone C-3) lysates using antibodies that recognize GCN2, ATF4, ASNS, LAT1 (SLC7A5), xCT (SLC7A11), 4F2 (SLC3A2), ASNS, or actin.
Figure 3 with 5 supplements
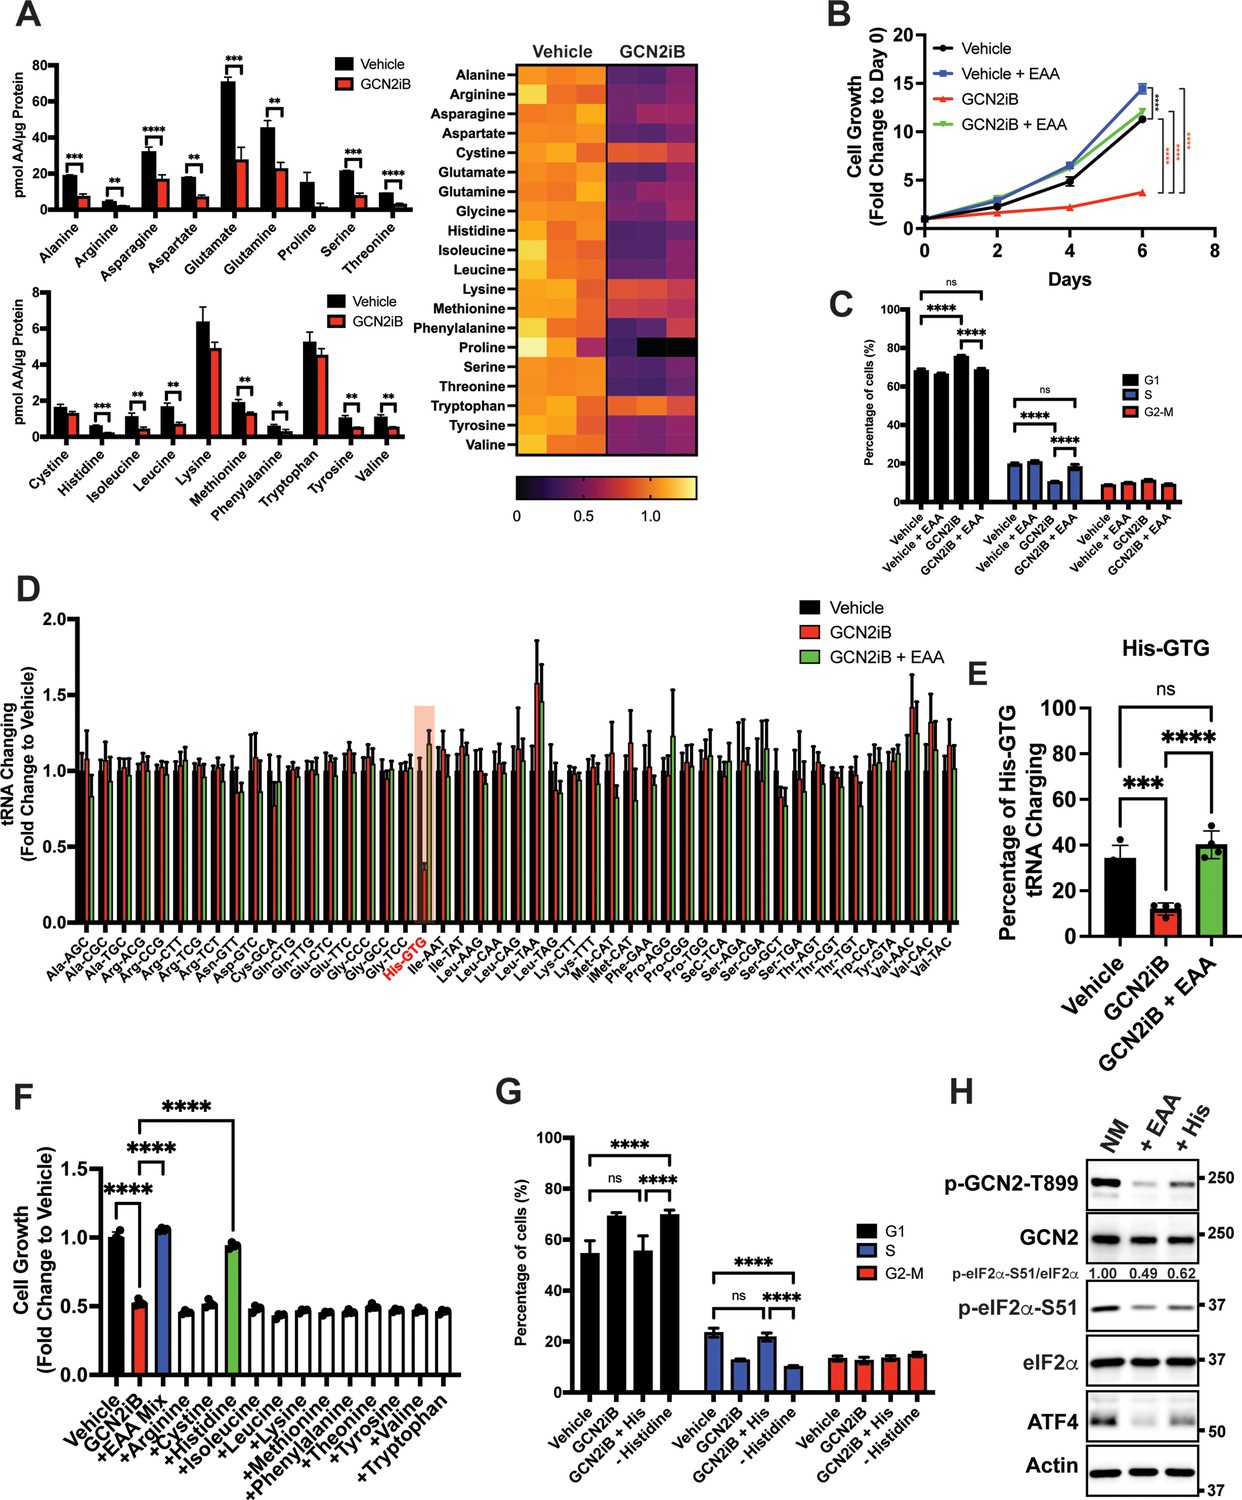
GCN2 is critical for maintenance of free amino acids.
(A) Amino acid measurements of LNCaP cells treated with 2 µM GCN2iB or vehicle control (DMSO) for 8 hr. Bar graphs in the top panel show high abundance amino acids and the lower panel those with lower levels. The heat map on the right shows fold change in amino acid abundance for each biological replicate of GCN2iB-treated LNCaP cells versus the vehicle with the scale showing the highest fold change in yellow and lowest in purple. Statistical significance was determined using an unpaired two-tailed t-test. Error bars indicate standard deviation (SD) (N = 3); *p ≤ 0.05, **p ≤ 0.01, ***p ≤ 0.001, ****p ≤ 0.0001. (B) LNCaP cells were treated with vehicle, GCN2iB (2 µM), vehicle + essential amino acids (EAA), or GCN2iB (2 µM) + EAA, and cell growth was measured for up to 6 days. Error bars indicate SD (N = 5). Statistical significance was determined using a two-way analysis of variance (ANOVA) as described in Supplementary file 1; ****p ≤ 0.0001. (C) Cell cycle analyses of LNCaP cells treated with vehicle, GCN2iB (2 µM), vehicle + EAA, or GCN2iB (2 µM) + EAA for 48 hr. Statistical significance was determined using a one-way ANOVA with Tukey’s multiple comparisons. Error bars indicate SD (N = 3); ***p ≤ 0.001, ****p ≤ 0.0001. (D) Genome-wide tRNA charging analysis (CHARGE-seq) of LNCaP cells treated with vehicle (DMSO), GCN2iB (2 µM), or GCN2iB (2 µM) + EAA for 8 hr. The tRNA charging ratio is shown as a bar graph with fold change compared to vehicle. Only tRNA isoacceptors measured in LNCaP cells are shown. Error bars indicate SD (N = 4). (E) tRNA charging percentage for tRNAHis in LNCaP cells treated with vehicle, GCN2iB, or GCN2iB + EAA. Statistical significance was determine using a one-way ANOVA with Tukey’s multiple comparisons (N = 4); ***p ≤ 0.001, ****p ≤ 0.0001. (F) LNCaP cells were treated with vehicle, GCN2iB (2 µM), GCN2iB (2 µM) + EAA, or GCN2iB (2 µM) combined with the indicated individual amino acids. Cell growth was measured at 4 days in triplicate wells (N = 3). Statistical significance was determined using a one-way ANOVA with Tukey’s multiple comparisons. Error bars indicate SD; ****p ≤ 0.0001. (G) Cell cycle analysis of LNCaP cells were treated with vehicle, GCN2iB (2 µM), GCN2iB (2 µM) + histidine (200 µM), or with media lacking histidine for 48 hr. Statistical significance was determined using a one-way ANOVA with Tukey’s multiple comparisons. Error bars indicate SD (N = 3); ***p ≤ 0.001, ****p ≤ 0.0001. (H) LNCaP cells were cultured in normal media, media supplemented with EAA mix, or media supplemented with histidine (200 µM) for 24 hr. Lysates were analyzed by Immunoblot using antibodies that recognize total or phosphorylated GCN2-T899, total or phosphorylated eIF2α−S51, ATF4, or actin. Molecular weight markers are presented in kilodaltons for each immunoblot panel. The relative levels of p-eIF2α normalized to total eIF2α compared to normal media (NM) control are indicated.
Figure 3—figure supplement 1
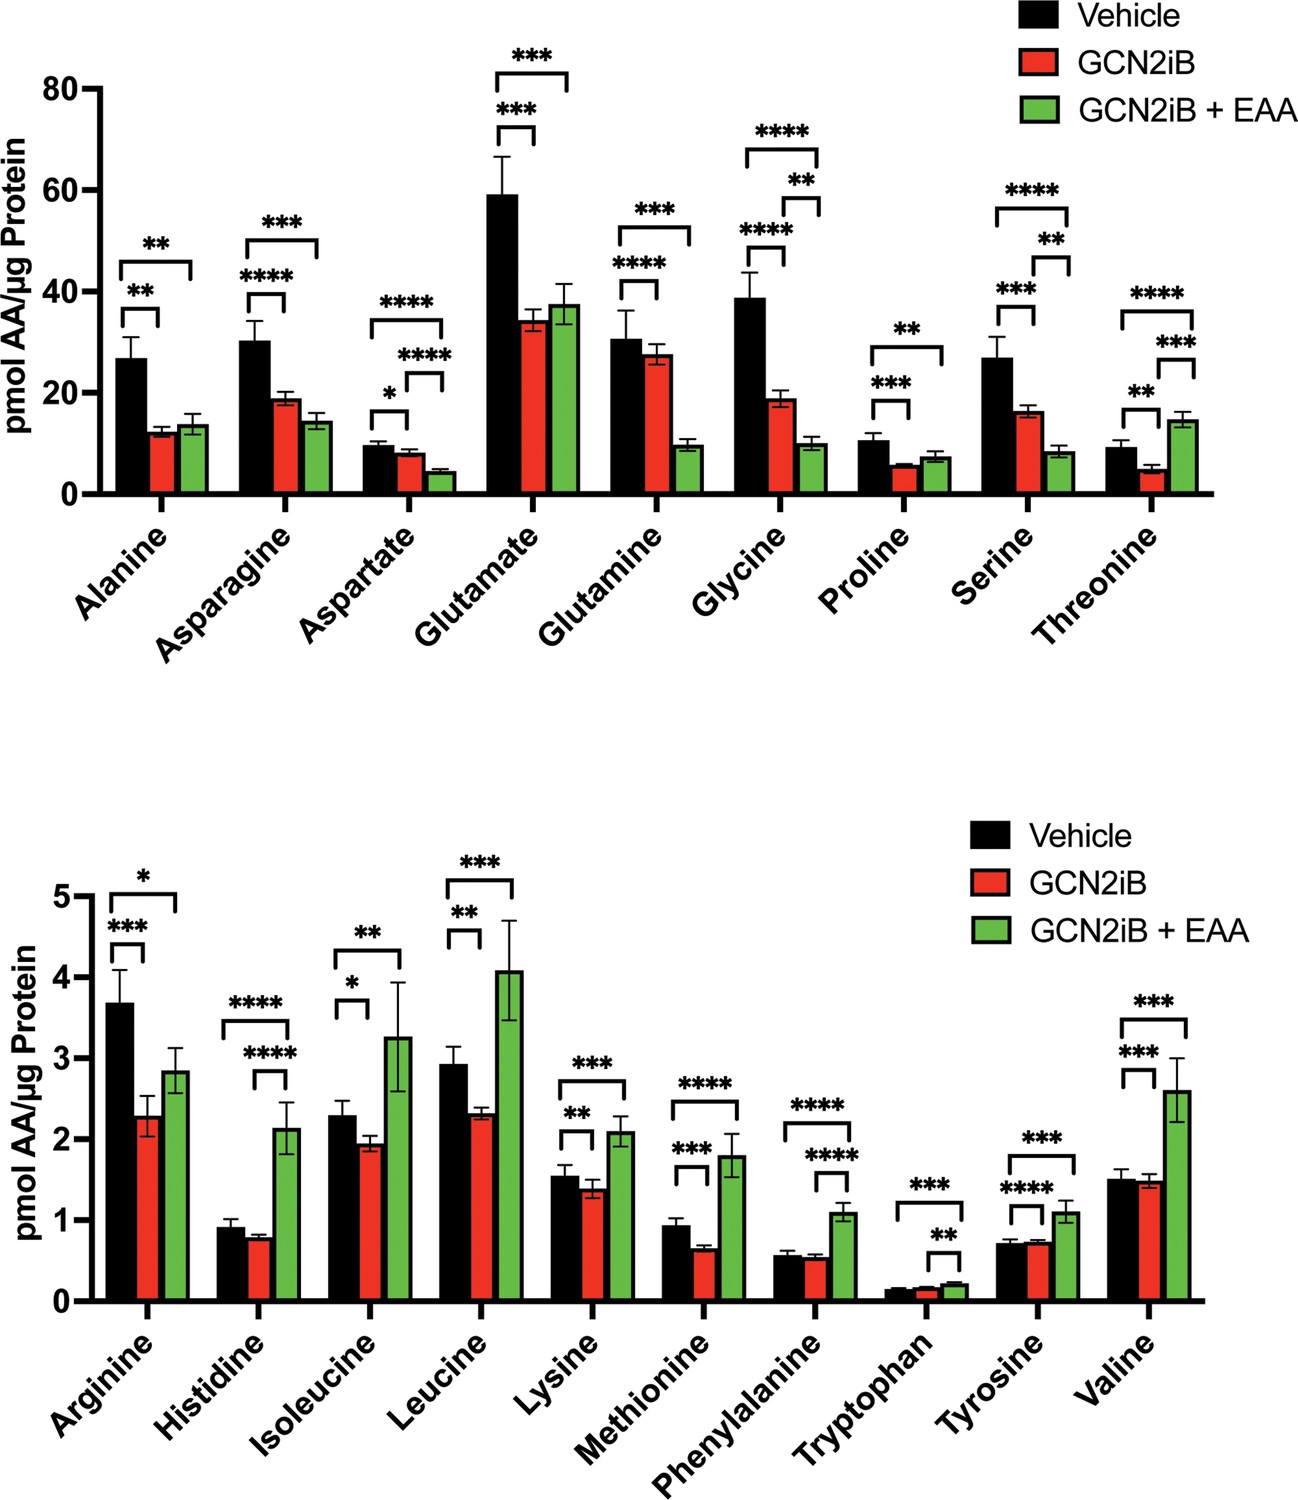
Amino acid measurements of LNCaP cells treated with vehicle (DMSO), 2 µM GCN2iB, or 2 µM GCN2iB + essential amino acid (EAA) for 48 hr.
Bar graphs in the top panel show high abundance amino acids and the lower panel highlights those with lower levels. Statistical significance was determined using an unpaired two-tailed t-test. Error bars indicate standard deviation (SD) (N = 4); *p ≤ 0.05, **p ≤ 0.01, ***p ≤ 0.001, ****p ≤ 0.0001.
Figure 3—figure supplement 2
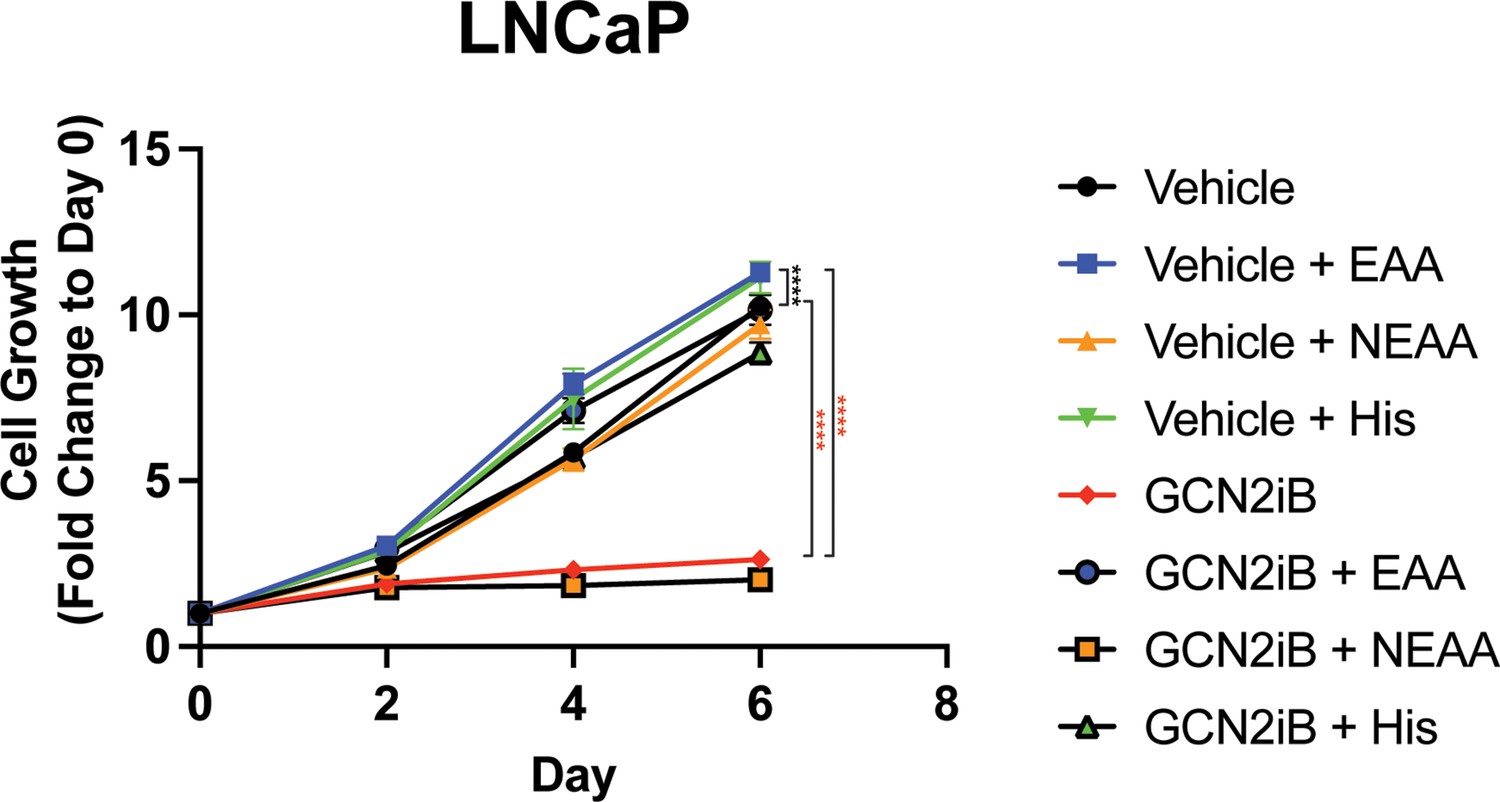
Effect of AA supplementation on growth of LNCaP cells.
LNCaP cells were treated with GCN2iB (2 µM) or vehicle control (DMSO) in standard growth media, media supplemented with non-essential amino acids (NEAA), supplemented with essential amino acids (EAA), or supplemented with histidine (200 µM), and cultured for up to 6 days. Cell growth was quantitated using CellTiter-Glo as described in the Materials and methods and is presented as fold change (mean ± standard deviation [SD]) relative to day 0. Statistical significance was determined using a two-way analysis of variance (ANOVA) as described in Supplementary file 1; ****p ≤ 0.0001.
Figure 3—figure supplement 3
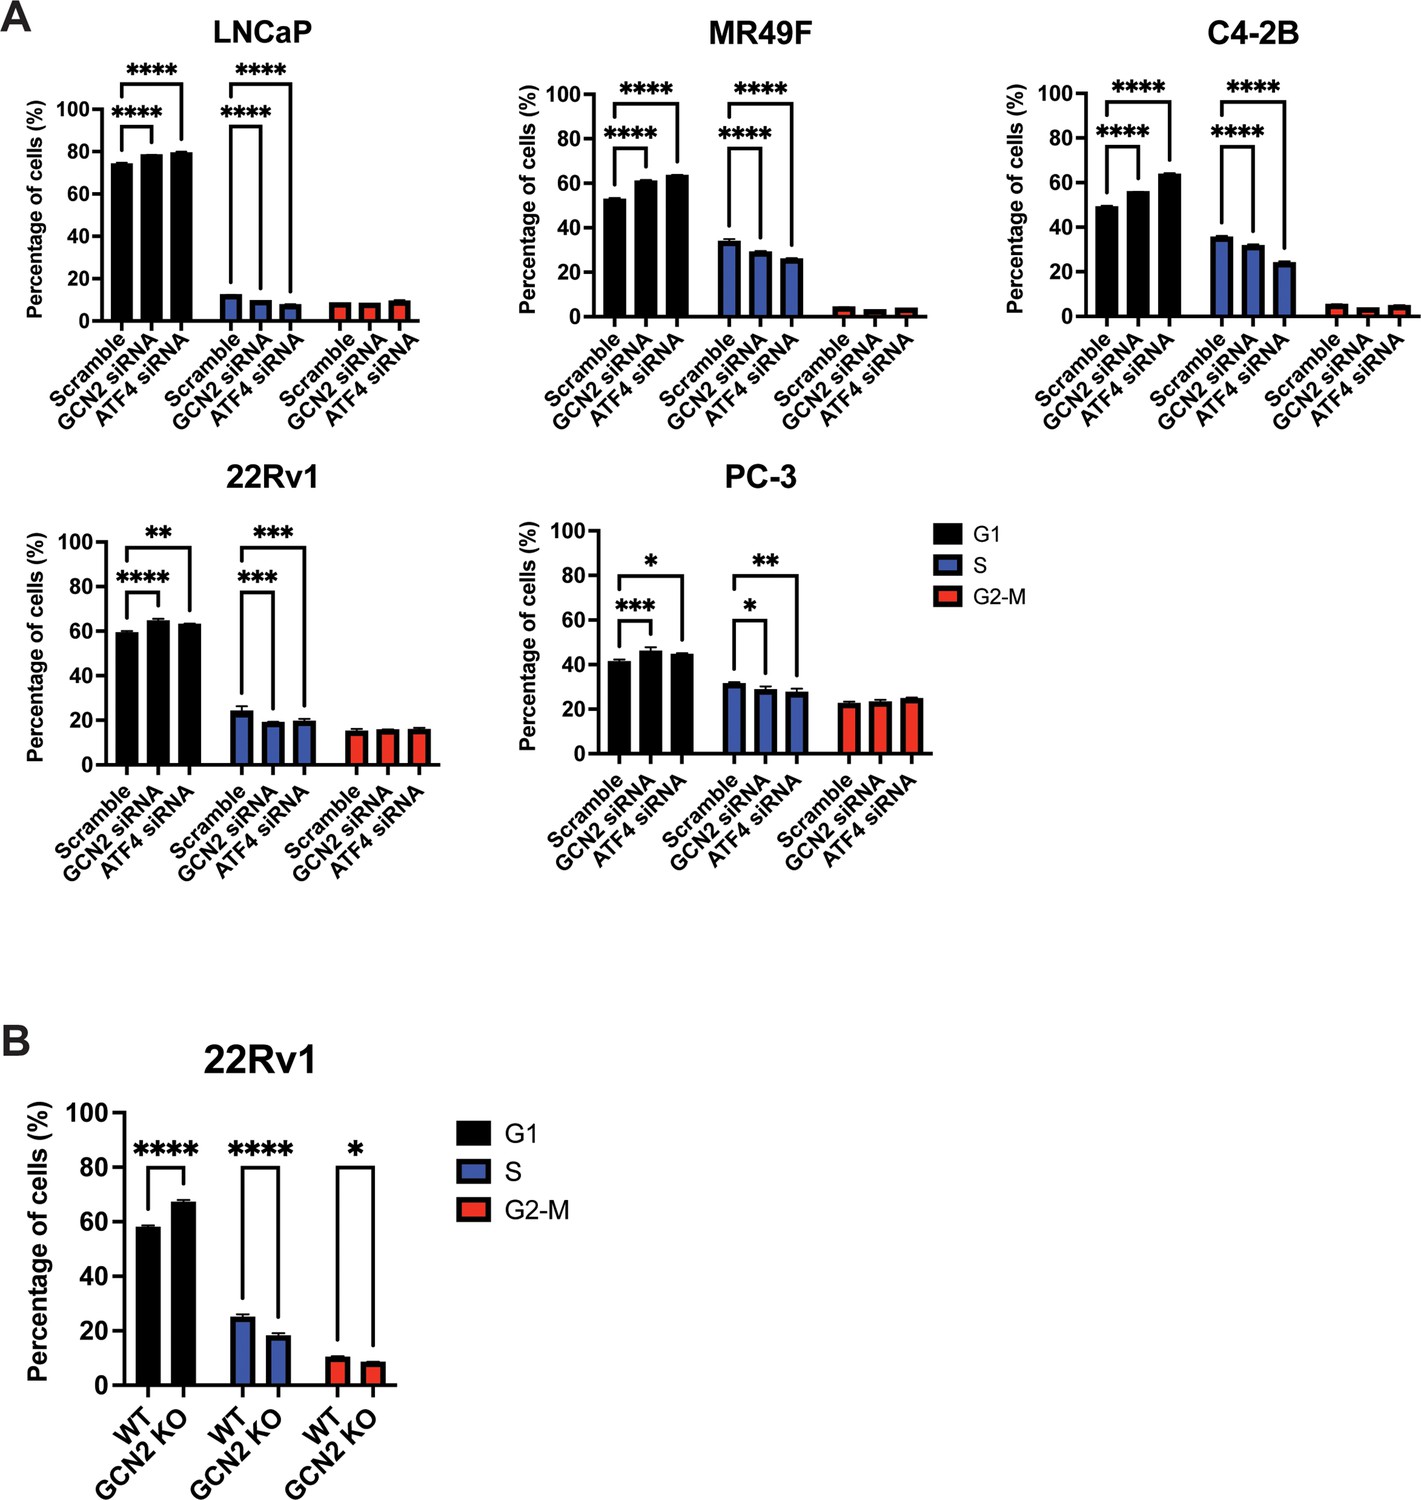
Loss of GCN2 or ATF4 expression in prostate cancer (PCa) cell lines induces cell cycle arrest.
(A) LNCaP, MR49F, C4-2B, 22Rv1, or PC-3 cells were transfected with GCN2 siRNA, ATF4 siRNA, or scrambled siRNA control for 48 hr and subjected to cell cycle analysis as described in the Materials and methods. The percentage of cells in G1, S, and G2-M are shown in the bar graphs. (B) 22Rv1 GCN2 KO and the parental WT were analyzed for cell cycle arrest. Statistical significance was determined using a one-way analysis of variance (ANOVA) with Tukey’s multiple comparisons. Error bars indicate standard deviation (SD) (N = 3); *p ≤ 0.05, **p ≤ 0.01, ***p ≤ 0.001,****p ≤ 0.0001.
Figure 3—figure supplement 4
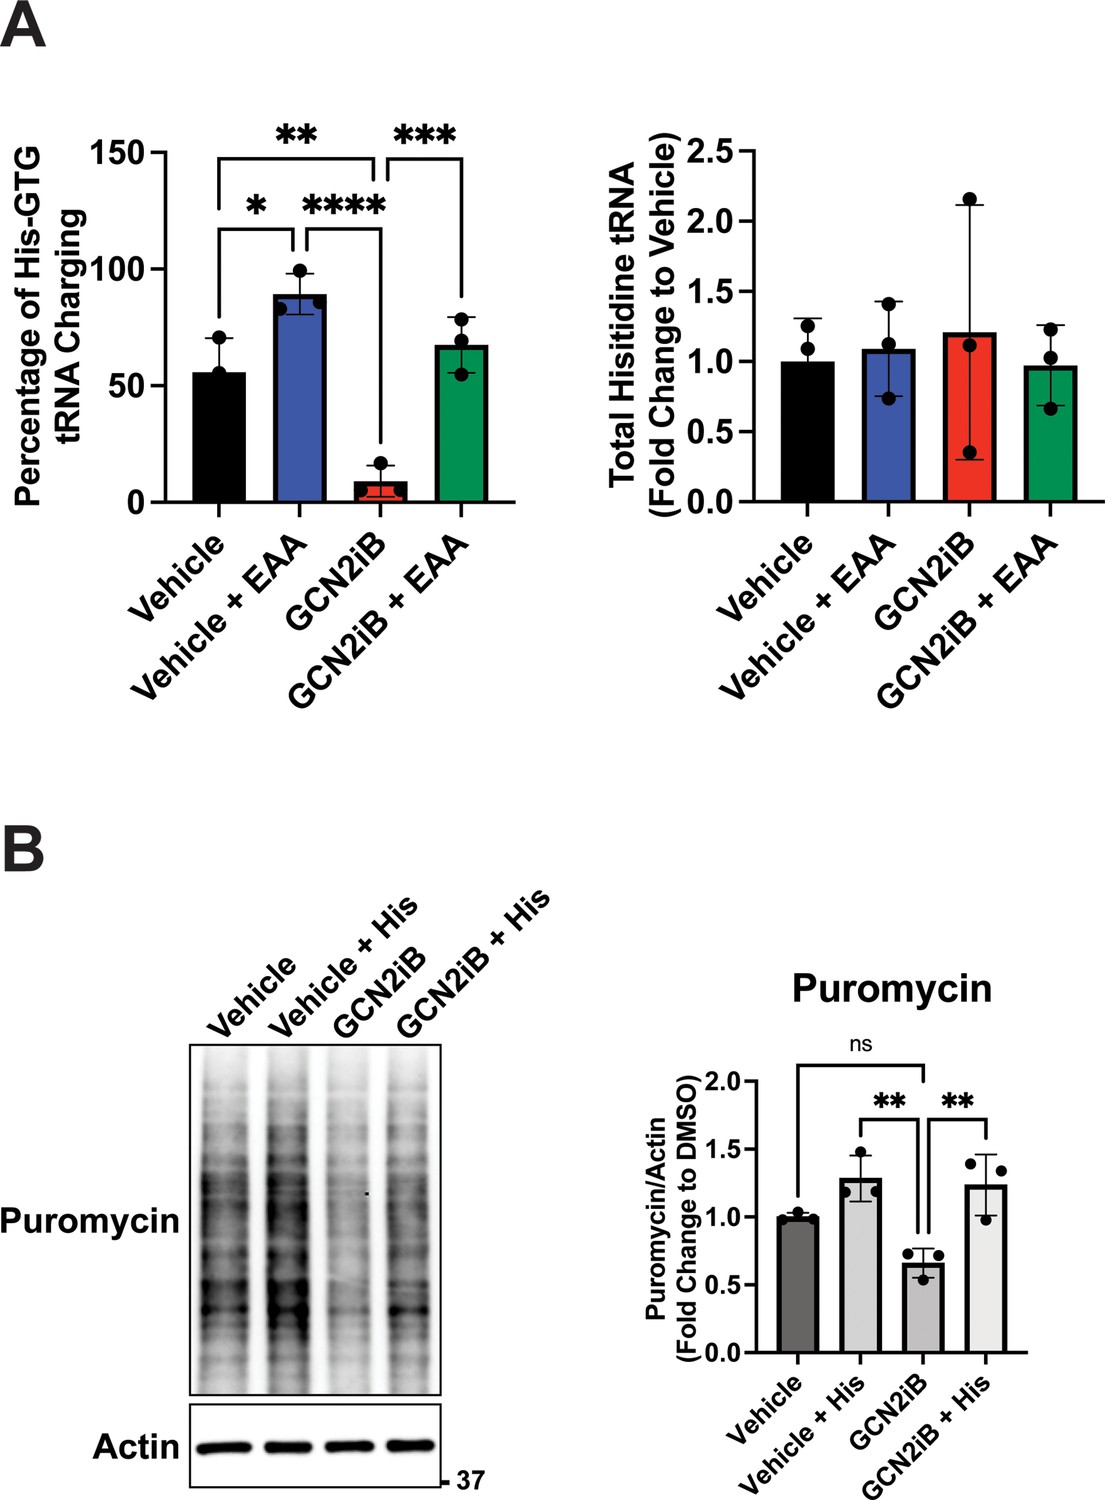
GCN2 inhibition and supplementation with essential amino acids (EAA) affect charging of tRNAHIS and global translation.
(A) LNCaP cells were treated with 2 µM GCN2iB or vehicle (DMSO) control in the absence or presence of EAA for 8 hr and tRNAHis charging levels were determined by qRT-PCR as described in the Materials and methods. (B) LNCaP cells were treated with GCN2iB (2 µM) or vehicle (DMSO) control in the absence or presence of histidine supplementation. Puromycin (1 µM) was added to culture media 15 min prior to lysate preparation and puromycin incorporation was measured by immunoblot analysis using anti-puromycin antibody. Puromycin incorporation was quantified from replicate samples and is shown normalized to the vehicle control levels. Statistical significance was determined using a one-way analysis of variance (ANOVA) with Tukey’s multiple comparisons. Error bars indicate standard deviation (SD) (N = 3); ns, p > 0.05, *p ≤ 0.05, **p ≤ 0.01, ***p ≤ 0.001, ****p ≤ 0.0001.
Figure 3—figure supplement 5
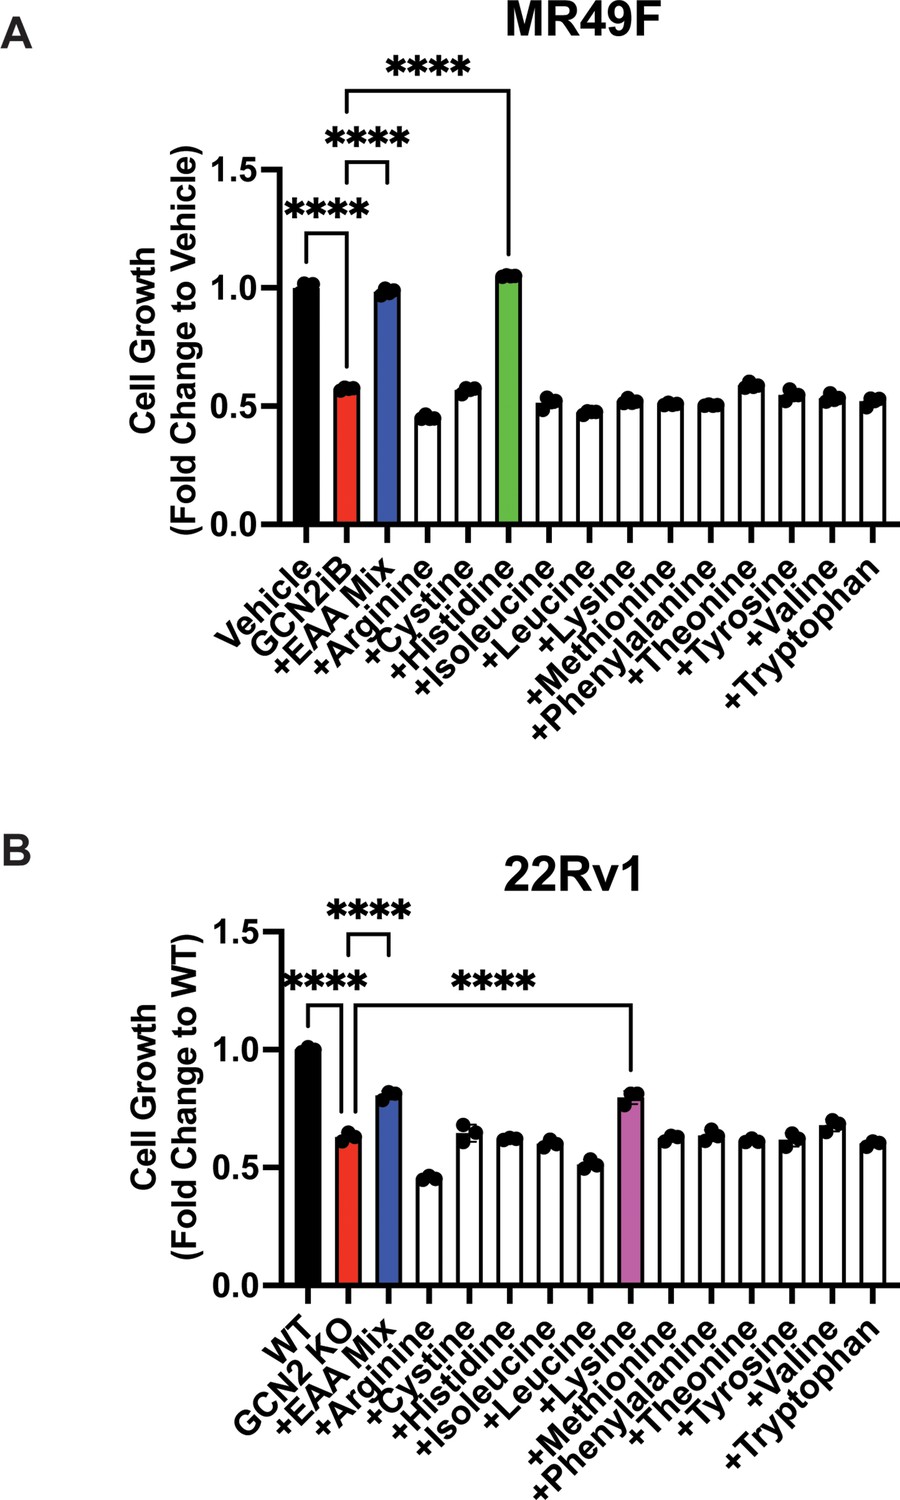
Growth of MR49F and 22Rv1 can be rescued with amino acid supplements.
(A) MR49F cells were treated with GCN2iB (2 µM) or vehicle control (DMSO) for 96 hr in normal growth media, growth media supplemented with essential amino acid (EAA), or growth media supplemented with individual amino acids as indicated. Cell growth was quantified using CellTiter-Glo as described in the Materials and methods and is presented normalized to the vehicle control group. (B) 22Rv1 WT and 22Rv1 GCN2 KO cells were cultured for 96 hr in normal growth media, growth media supplemented with EAA, or growth media supplemented with individual amino acids as indicated and cell growth was similarly measured as described in A. Statistical significance in panels A and B was determined using a one-way analysis of variance (ANOVA) with Tukey’s multiple comparisons. Error bars indicate standard deviation (SD) (N = 3); ****p ≤ 0.0001.
Figure 4 with 3 supplements
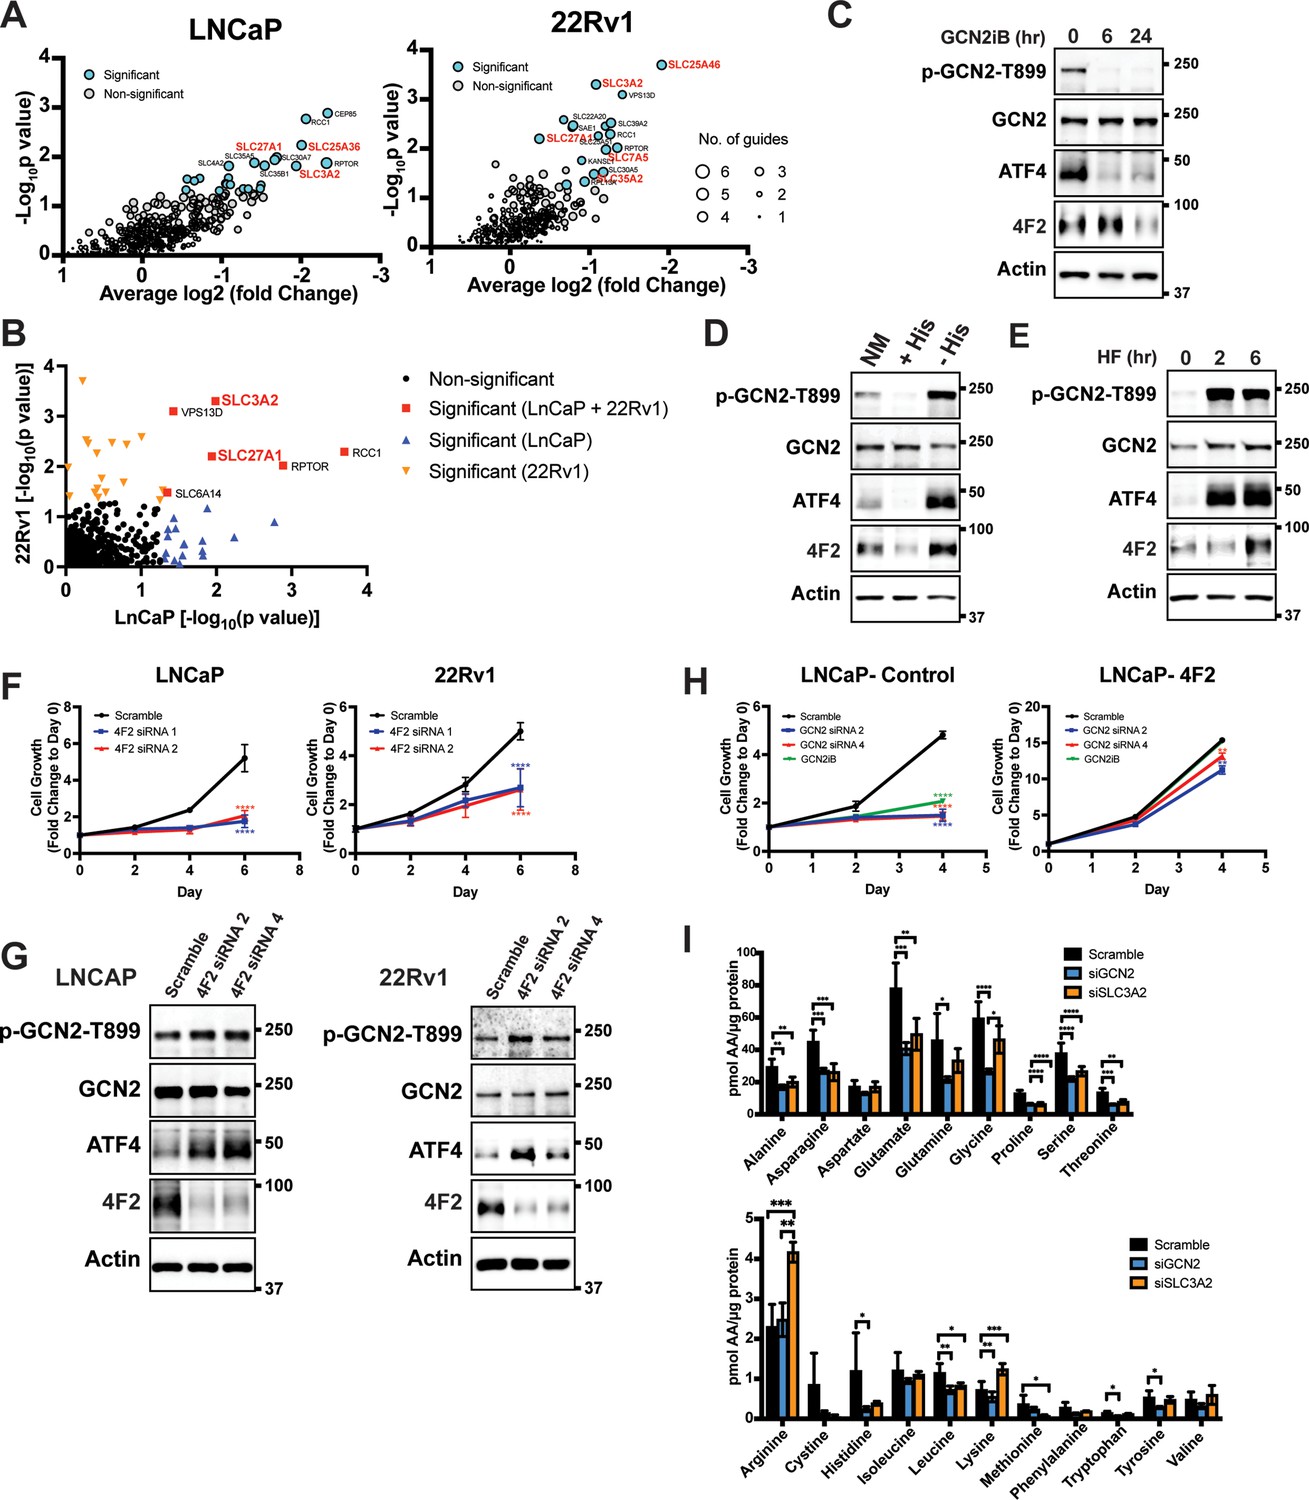
GCN2 is critical for expression of 4F2 (SLC3A2) and facilitates amino acid transport.
(A) Gene-level depletion for LNCaP and 22Rv1 cells. The average log2 fold change for the single guide RNAs (sgRNAs) for each gene is shown on the x-axis. Significantly depleted genes (p ≤ 0.05) in LNCaP or 22Rv1 are indicated. Circle size indicates the number of significant sgRNAs. SLC genes in red are dependent on GCN2 for expression. (B) Plot of −Log10(p value) for depleted genes identified in CRISPR screen for LNCaP versus 22Rv1 cells. Significantly depleted genes (p ≤ 0.05) in LNCaP, 22Rv1 or both cell lines are indicated. SLC genes in red are GCN2 dependent. (C) Lysates from LNCaP cells were treated with 2 µM GCN2iB for 6 or 24 hr, or with vehicle (DMSO) were analyzed by immunoblot analyses using antibodies that recognize total or phosphorylated GCN2-T899, ATF4, 4F2 (SLC3A2), or actin. Molecular weight markers are indicated in kilodaltons for the panels. (D) LNCaP cells were cultured in standard culture conditions (NM: normal media), media supplemented with 200 µM histidine (+His), or media depleted of histidine (−His) for 24 hr. Lysates were analyzed by immunoblot analyses using antibodies that recognize total or phosphorylated GCN2-T899, ATF4, 4F2 (SLC3A2), or actin. (E) LNCaP cells were treated with 100 nM halofuginone (HF) for 2 and 6 hr or vehicle (DMSO). Lysates were analyzed by Immunoblot using antibodies that recognize the indicated proteins. (F) 4F2 (SLC3A2) expression was reduced in LNCaP or 22Rv1 cells using two different siRNAs or scramble siRNA as a control. Cell growth was measured in replicate wells (N = 5) for up to 6 days and are plotted relative to day 0 (mean ± standard deviation [SD]). Statistical significance was determined using a two-way analysis of variance (ANOVA) as described in Supplementary file 1; ****p ≤ 0.0001. (G) LNCaP cells transfected with two different siRNAs targeting 4F2 (SLC3A2) or scramble siRNA for 48 hr. Lysate was prepared and analyzed by immunoblot using antibodies that recognize total or phosphorylated GCN2-T899, total or phosphorylated eIF2α−S51, ATF4, 4F2 (SLC3A2), or actin. (H) LNCaP cells stably overexpressing SLC3CA2 or vector control were transfected with two different siRNAs targeting GCN2 or scrambled control. Cells were then treated with GCN2iB (2 µM) or vehicle and growth was measured in replicate wells (N = 5) and is plotted relative to day 0 (mean ± SD). Statistical significance was determined using a two-way ANOVA as described in Supplementary file 1; **p ≤ 0.01, ****p ≤ 0.0001. (I) Amino acid measurements of LNCaP cells transfected siRNA targeting GCN2 (N = 4), 4F2 (SLC3A2, N = 4), or scramble control (N = 8). Two separate bar graphs show high abundance (top) and low abundance (bottom) amino acids. Statistical significance was determined using a two-way ANOVA as described in Supplementary file 1. Error bars indicate SD; *p ≤ 0.05; **p ≤ 0.01; ***p ≤ 0.001; ****p ≤ 0.0001.
Figure 4—figure supplement 1
SLC-specific CRISPR/Cas9 KO library reveals that 4F2 (SLC3A2) is critical for cell fitness in LNCaP and 22Rv1 cells.
LNCaP and 22Rv1 cells were transduced with a SLC KO CRISPR/Cas9 library targeting 394 human SLC genes and pseudogenes. Transduced cells were cultured for 3–4 weeks and single guide RNA (sgRNA) sequences were amplified by PCR and sequenced to determine the composition of the sgRNA library compared to Control (day 0). Scatterplot of sgRNA counts (log10, normalized) for control (N = 3) versus LNCaP (N = 3) and control (N = 3) versus 22Rv1 (N = 3). Non-targeting sgRNAs (red), significant depleted sgRNAs (blue) (p ≤ 0.05), and 4F2 (SLC3A2) sgRNAs (orange) are indicated.
Figure 4—figure supplement 2
GCN2 regulates 4F2 (SLC3A2) mRNA levels in LNCaP cells.
(A) 4F2 (SLC3A2) and ATF4 mRNA were measured by qRT-PCR as described in the Materials and methods in LNCaP cells treated with 2 µM GCN2iB for 6 or 24 hr or vehicle control (DMSO), (B) cultured in standard culture conditions (NM: normal media), media supplemented with 200 µM histidine (+His), or media depleted of histidine (− His) for 24 hr, or (C) treated with 100 nM halofuginone (HF) for 2 or 6 hr or untreated (DMSO control). Error bars indicate standard deviation (SD) (N = 3). An unpaired two-tailed t-test was used to determine statistical significance; *p ≤ 0.05, **p ≤ 0.01, ***p ≤ 0.001, ****p ≤ 0.0001.
Figure 4—figure supplement 3
GCN2 and the integrated stress response (ISR) control expression of 4F2 (SLC3A2) which provides a growth advantage in prostate cancer (PCa) cell lines.
(A) LNCaP cells were treated with GCN2iB (2 µM) or vehicle (DMSO) control in the presence or absence of salubrinal (50 µM) for 48 hr. Protein lysates were prepared and analyzed by immunoblot using antibodies that recognize total or phosphorylated GCN2, total or phosphorylated eIF2α, ATF4, 4F2 (SLC3A2), or actin as indicated. (B) LNCaP cells transfected with empty vector (EV) control or pMSCV-GADD34-puro expression plasmid encoding the human GADD34 gene were analyzed by immunoblot as indicated in panel A. (C) Protein lysates prepared from LNCaP or 22Rv1 stably expressing empty vector (EV) control or 4F2 (SLC3A2) were analyzed by immunoblot using antibodies that recognize total or phosphorylated GCN2, total or phosphorylated eIF2α(S-51), ATF4, or actin as indicated. (D) Growth of LNCaP and 22Rv1 cells stably expressing empty vector (EV) control or 4F2 (SLC3A2) was measured in replicate wells (N = 5) for up to 4 days and plotted as fold change (mean ± standard deviation [SD]) relative to day 0. Statistical significance was determined using a two-way analysis of variance (ANOVA) as described in Supplementary file 1; ****p ≤ 0.0001.
Figure 5
Model for GCN2 regulation of amino acid homeostasis in prostate cancer.
Model depicting the role of GCN2 in regulating SLC amino acid transporters. Enhanced translation and altered metabolism driven by oncogenes deplete amino acid pools resulting in accumulation of uncharged tRNAs, leading to activation of GCN2. Active GCN2 results in increased expression of SLC amino acid transporters, including 4F2 (SLC3A2), to increase uptake of amino acids. Loss of GCN2 function disrupts amino acid homeostasis decreasing proliferation of prostate cancer cells.
Figure 6 with 4 supplements
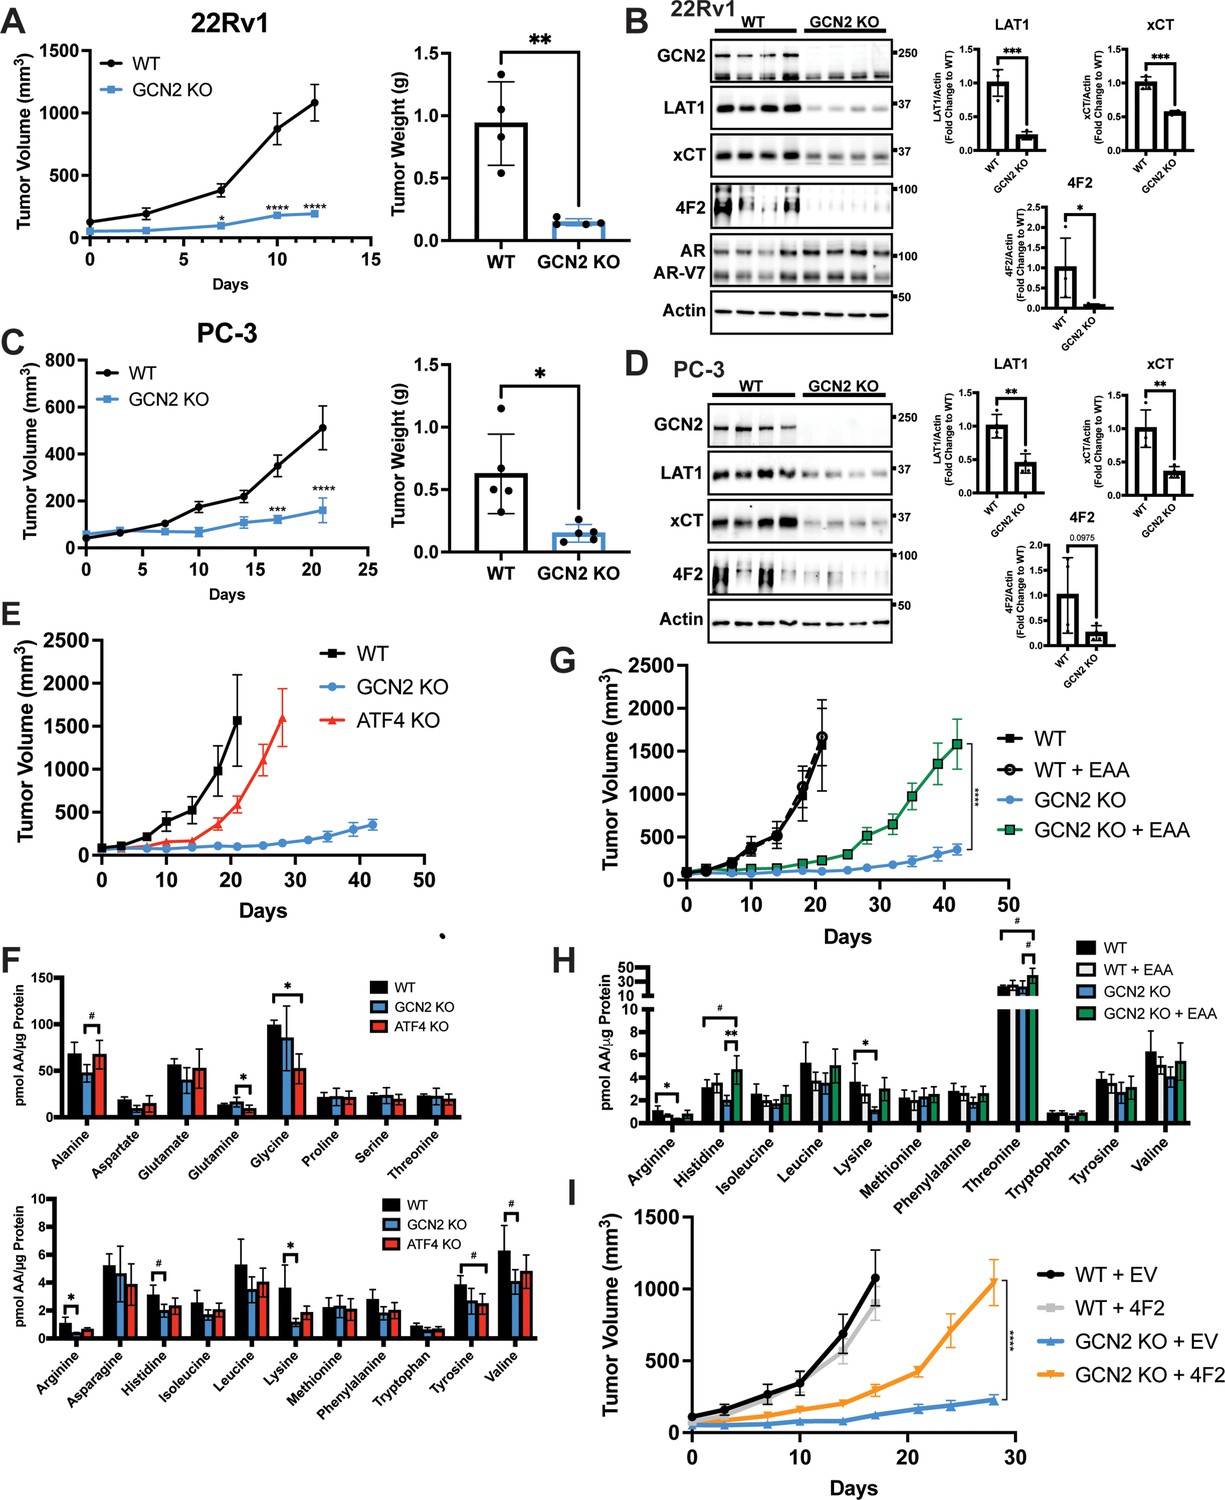
GCN2 regulates amino acid transporters ensuring sufficient amino acids for tumor growth in mouse prostate cancer (PCa) xenograft models.
(A) WT or GCN2 KO 22Rv1 (clone 7) cells were injected subcutaneously into the dorsal flank of mice as described in the Materials and methods. Tumor volume (TV) was measured on indicated days and is plotted as average TV ± standard error of the mean (SEM) (N = 4). Statistical significance was determined using a two-way analysis of variance (ANOVA) with Sidak’s multiple comparison; *p ≤ 0.05; ****p ≤ 0.0001. On the right bar graph, the final tumor weight was measured at endpoint and statistical significance was determined using an unpaired two-tailed t-test. Error bars indicate standard deviation (SD); **p ≤ 0.01. (B) Protein lysates were prepared from WT and GCN2 KO 22Rv1 tumors and analyzed by immunoblot to measure total GCN2, ATF4, LAT1 (SLC7A5), xCT (SLC7A11), 4F2 (SLC3A2), androgen receptor (AR), AR splice variant 7 (AR-V7), or actin. Molecular weight markers are indicated in kilodaltons for each immunoblot panel. The levels of the SLC proteins normalized to actin are shown in the bar graph (right panels). Statistical significance was determined using an unpaired two-tailed t-test. Error bars indicate SD (N = 4); *p ≤ 0.05; ***p ≤ 0.001. (C) Tumor growth of PC-3 WT and PC-3 GCN2 KO (clone 3) cells was analyzed in a mouse xenograft study as in A. Statistical significance was determined using a two-way ANOVA with Sidak’s multiple comparison. Error bars indicate SEM (N = 5); ***p ≤ 0.001; ****p ≤ 0.0001. On the right bar graph, the final tumor weight was measured at endpoint. Statistical significance was determined using an unpaired two-tailed t-test. Error bars indicate SD (N = 5); *p ≤ 0.01. (D) Protein lysates were prepared from the PC-3 WT and PC-3 GCN2 KO tumors and analyzed by immunoblot for the indicated proteins. (Right panels) Quantification of protein levels of LAT1 (SLC7A5), xCT (SLC7A11), and 4F2 (SLC3A2) normalized to actin are shown in the bar graphs. Statistical significance was determined using an unpaired two-tailed t-test. Error bars indicate SD (N = 4); **p ≤ 0.01. (E) 22Rv1 WT (N = 4), 22Rv1 GCN2 KO (clone 7, N = 5), and 22Rv1 ATF4 KO (N = 5) were evaluated in the mouse xenograft model. Tumor volumes were measured on the indicated days. Error bars indicated SEM. (F) Amino acid measurements of 22Rv1 WT, 22Rv1 GCN2 KO, and 22Rv1 ATF4 KO tumors. Two separate bar graphs show high abundance (top) and low abundance (bottom) amino acids. Statistical significance was determined one-way ANOVA with Tukey’s multiple comparisons. Error bars indicate SD (N = 4); #p ≤ 0.1, *p ≤ 0.05. (G) 22Rv1 WT and 22Rv1 GCN2 KO (clone 7) cells were analyzed in a xenograft model as described for (A), with or without supplementation of essential amino acid (EAA) in the drinking water. Tumor volume was measured on indicated days. 22Rv1 WT (N = 4) and 22Rv1 KO (N = 5) are the same tumor growth curves shown in (E). 22Rv1 WT + EAA (N = 5), 22Rv1 GCN2 KO + EAA (N = 5). Statistical significance was determined using a two-way ANOVA with Sidak’s multiple comparison; ****p ≤ 0.0001. (H) Amino acid measurements for 22Rv1 WT, 22Rv1 GCN2, and 22Rv1 GCN2 KO + EAA tumors. Bar graphs show only amino acids present in EAA supplemented water. Statistical significance was determined using a one-way ANOVA with Tukey’s multiple comparisons. Error bars indicated SD (N = 4); #p ≤ 0.1; *p ≤ 0.05; **p ≤ 0.01. (I) Tumor growth curves for 22Rv1 WT or 22Rv1 GCN2 KO (clone 11) transduced with 4F2 (SLC3A2) lentivirus (WT + 4F2 and GCN2 KO + 4F2) or empty vector (WT + EV and GCN2 KO + EV). Tumor volumes were measured on indicated days. Error bars indicate SEM (N = 5). Statistical significance was determined using a two-way ANOVA with Sidak’s multiple comparison; ****p ≤ 0.0001.
Figure 6—figure supplement 1
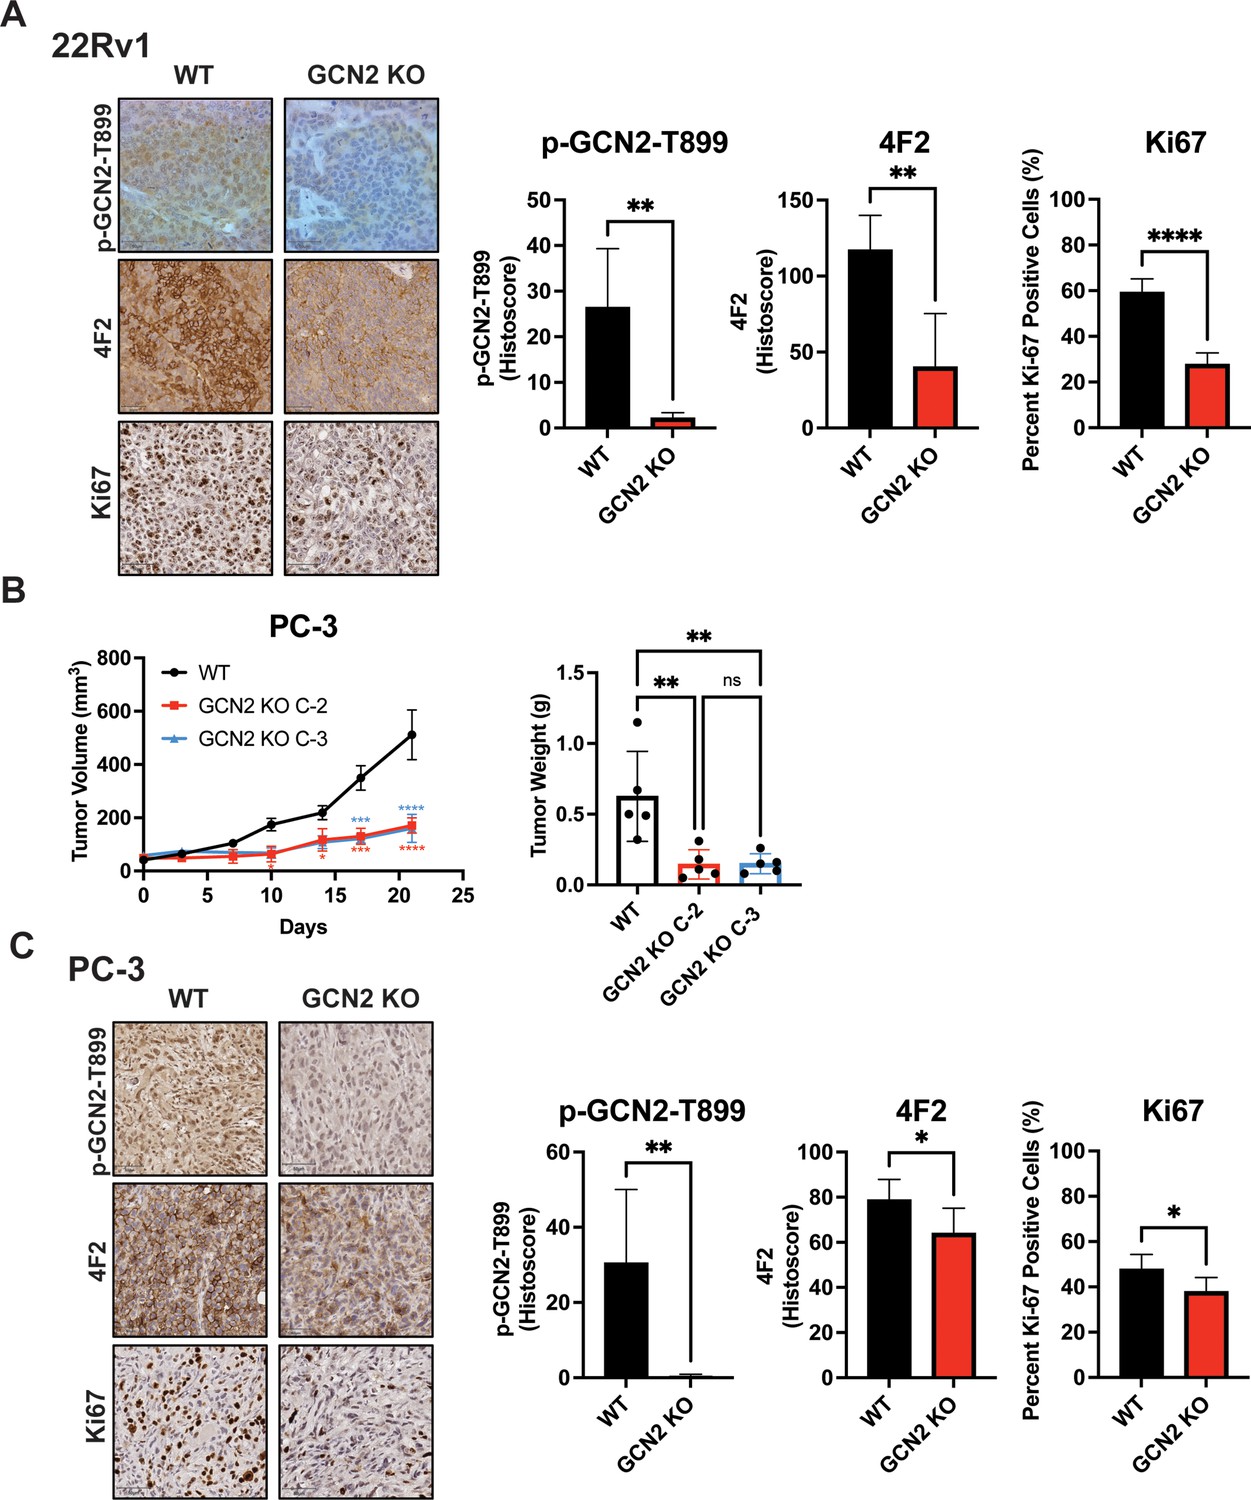
Deletion of GCN2 reduces tumor growth and proliferation in 22Rv1 and PC-3 tumors.
(A) Representative images for Ki-67, p-GCN2-T899, or 4F2 (SLC3A2) staining of 22Rv1 WT and 22Rv1 GCN2 KO tumors are shown. Bar graph shows quantification for percent positive nuclear staining (Ki67) or Histoscore (p-GCN2-T899 and 4F2). Statistical significance was determined using an unpaired two-tailed t-test. Error bars indicate standard deviation (SD) (N = 4); **p ≤ 0.01, ****p ≤ 0.0001. (B) PC-3 WT, and PC-3 GCN2 KO clone 2 (C-2), or PC-3 GCN2 KO clone 3 (C-3) cells were injected subcutaneously into the dorsal flank of mice as described in the Materials and methods. Tumor volumes were measured on the indicated days. Statistical significance was determined using a two-way analysis of variance (ANOVA) with Sidak’s multiple comparison. Error bars indicate standard error of the mean (SEM) (N = 5); *p ≤ 0.05; ***p ≤ 0.001; ****p ≤ 0.0001. Bar graph indicates final tumor weight measured at endpoint. Statistical significance was determined using a one-way ANOVA with Tukey’s multiple comparisons. Error bars indicate SD (N = 5); **p ≤ 0.01. (C) Representative images for Ki-67, p-GCN2-T899, or 4F2 (SLC3A2) staining of PC-3 WT and PC-3 GCN2 KO tumors are shown. Bar graph shows quantification for percent positive nuclear staining (Ki67) or Histoscore (p-GCN2-T899 and 4F2). Statistical significance was determined using an unpaired two-tailed t-test. Error bars indicate SD (N = 5); *p ≤ 0.05; **p ≤ 0.01.
Figure 6—figure supplement 2
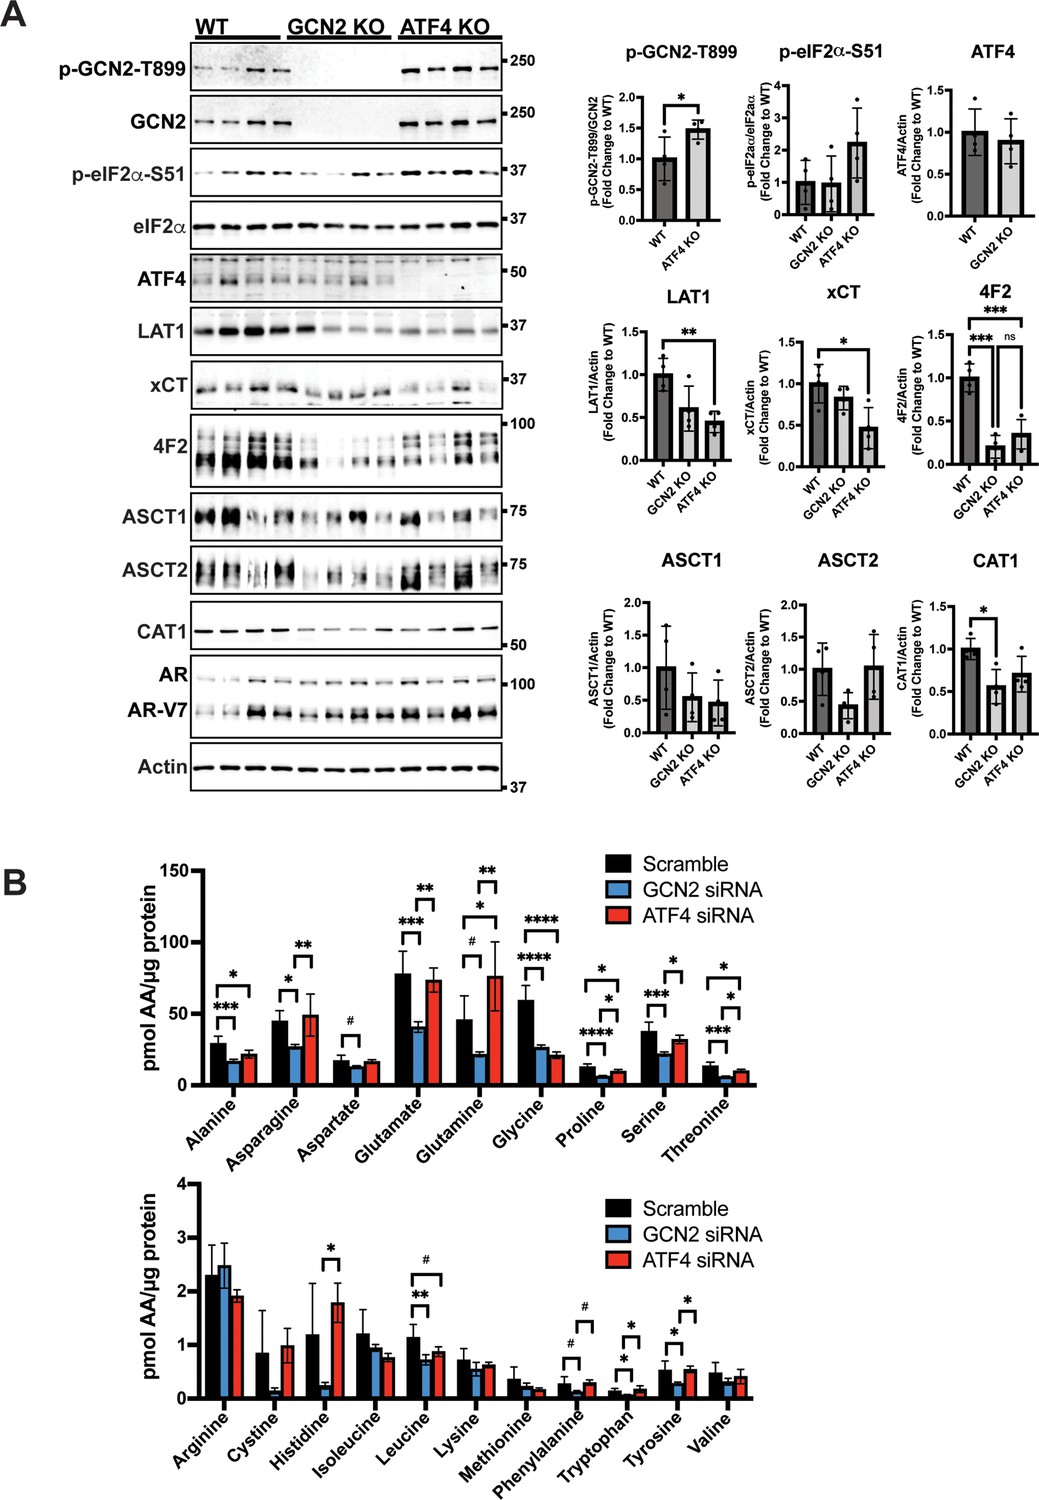
Deletion of GCN2 or ATF4 reduces the expression of SLC genes associated with amino acid transport in 22Rv1 tumors.
(A) Lysates from 22Rv1 WT, 22Rv1 GCN2 KO, and 22Rv1 ATF4 KO tumors were subjected to immunoblot analyses to measure total or phosphorylated GCN2, total or phosphorylated eIF2α, ATF4, LAT1 (SLC7A5), xCT (SLC7A11), 4F2 (SLC3A2), CAT1 (SLC7A1), ASCT1 (SLC1A4), ASCT2 (SLC1A5), androgen receptor (AR), AR splice variant 7 (AR-V7), or actin. Molecular weight markers are indicated in kilodaltons for each immunoblot panel. Levels of the indicated proteins normalized to appropriate control are shown in the bar graph on the right. Statistical significance was determined using a one-way analysis of variance (ANOVA) with Tukey’s multiple comparisons. Error bars indicate standard deviation (SD) (N = 4); ns, p > 0.05; *p ≤ 0.05, **p ≤ 0.01, ***p ≤0.001. (B) LNCaP cells were transfected with siRNAs targeting GCN2 (N = 4), ATF4 (N = 4), or scramble control (N = 8) for 48 hr. Amino acid levels were determined as described in the Materials and methods. Error bars indicate SD. Statistical significance was determined using a one-way ANOVA with Tukey’s multiple comparisons; #p ≤ 0.1, *p ≤ 0.05, **p ≤ 0.01, ***p ≤0.001, ****p ≤0.0001. Scramble control and GCN2 knockdown samples are the same as in Figure 4I.
Figure 6—figure supplement 3
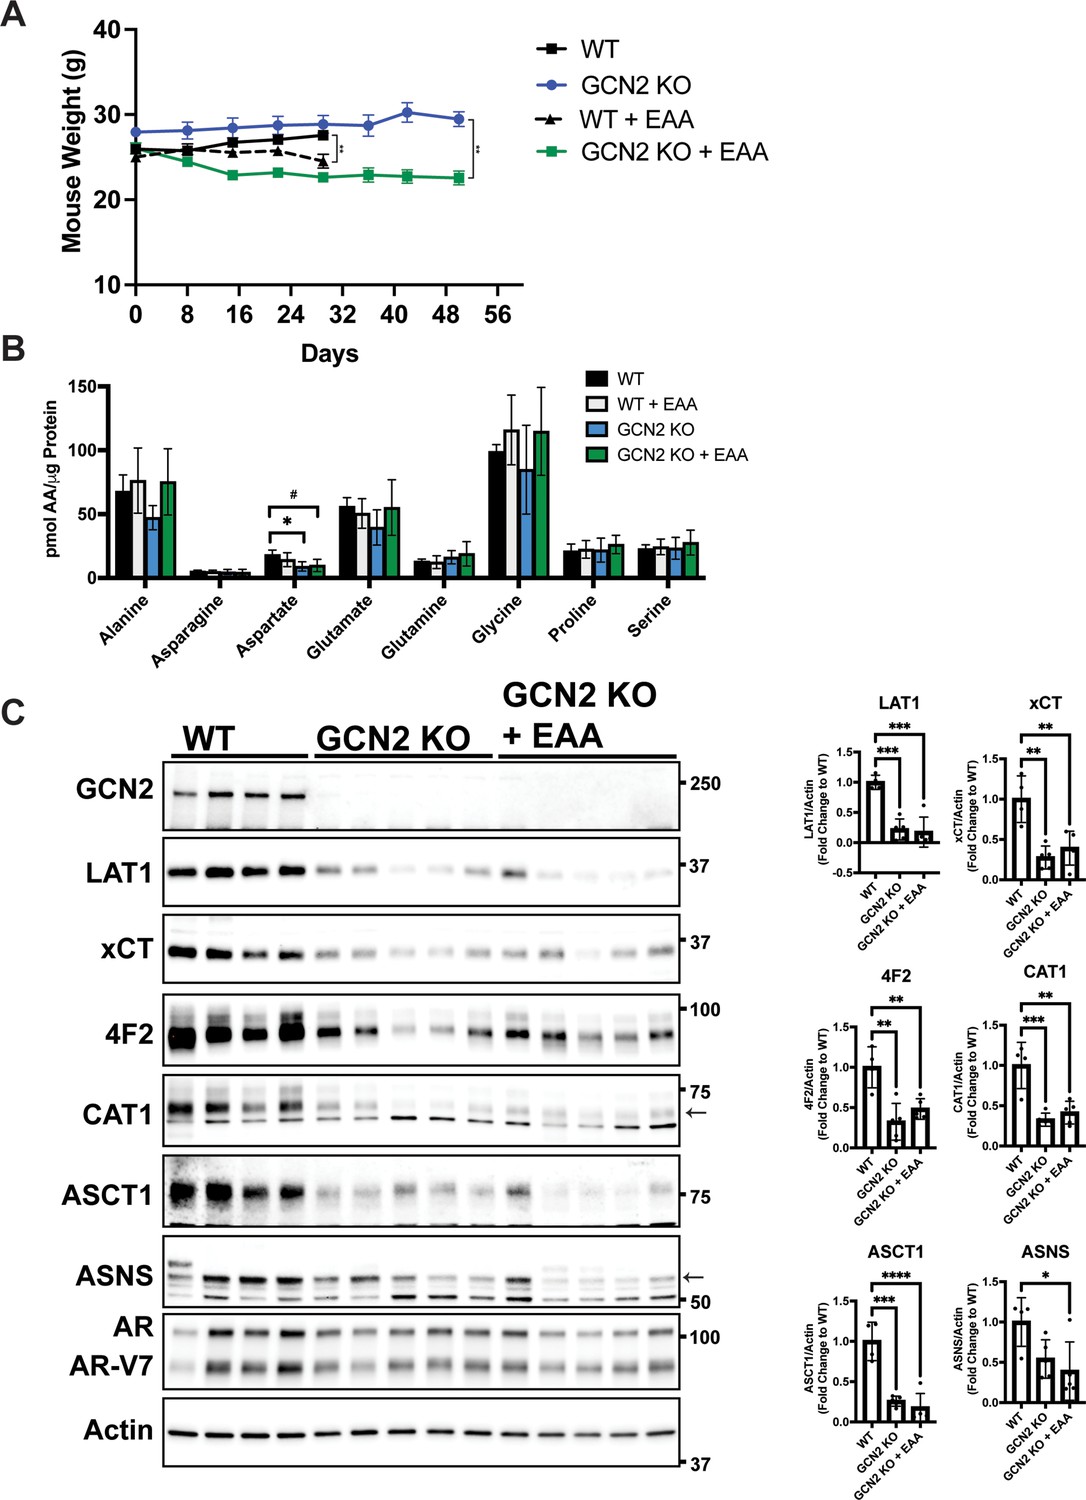
Effect of essential amino acid (EAA) supplementation on mouse weight, amino acid levels, and expression of SLC genes associated with amino acid transport in 22Rv1 WT and GCN2 KO tumors.
(A) Body weight measurements from mice bearing 22Rv1 WT or 22Rv1 GCN2 KO tumors with or without EAA supplementation in the drinking water as described in Figure 6G. Statistical significance was determined using a two-way analysis of variance (ANOVA) with Sidak’s multiple comparison, **p ≤ 0.01. (B) Amino acid measurements for 22Rv1 WT, 22Rv1 GCN2 KO, or 22Rv1 GCN2 KO + EAA tumors. Bar graphs show only amino acids not present in EAA supplemented water. Error bars indicate standard deviation (SD) (N = 4). Statistical significance was determined using a one-way ANOVA with Tukey’s multiple comparisons; #p ≤ 0.1; *p ≤ 0.05. (C) Protein lysates were prepared from tumors described in Figure 6G and analyzed by immunoblot to measure total GCN2, LAT1 (SLC7A5), xCT (SLC7A11), 4F2 (SLC3A2), CAT1 (SLC7A1), ASCT1 (SLC1A4), ASNS, androgen receptor (AR), AR splice variant 7 (ARv7), or actin. Molecular weight markers are indicated in kilodaltons for each immunoblot panel. The levels of the indicated proteins normalized to actin are shown in the bar graphs. Statistical significance was determined using a one-way ANOVA with Tukey’s multiple comparisons. Error bars indicate SD (N = 4); ns, p > 0.05; *p ≤ 0.05, **,p ≤ 0.01, ***p ≤ 0.001, ****p ≤ 0.0001.
Figure 6—figure supplement 4
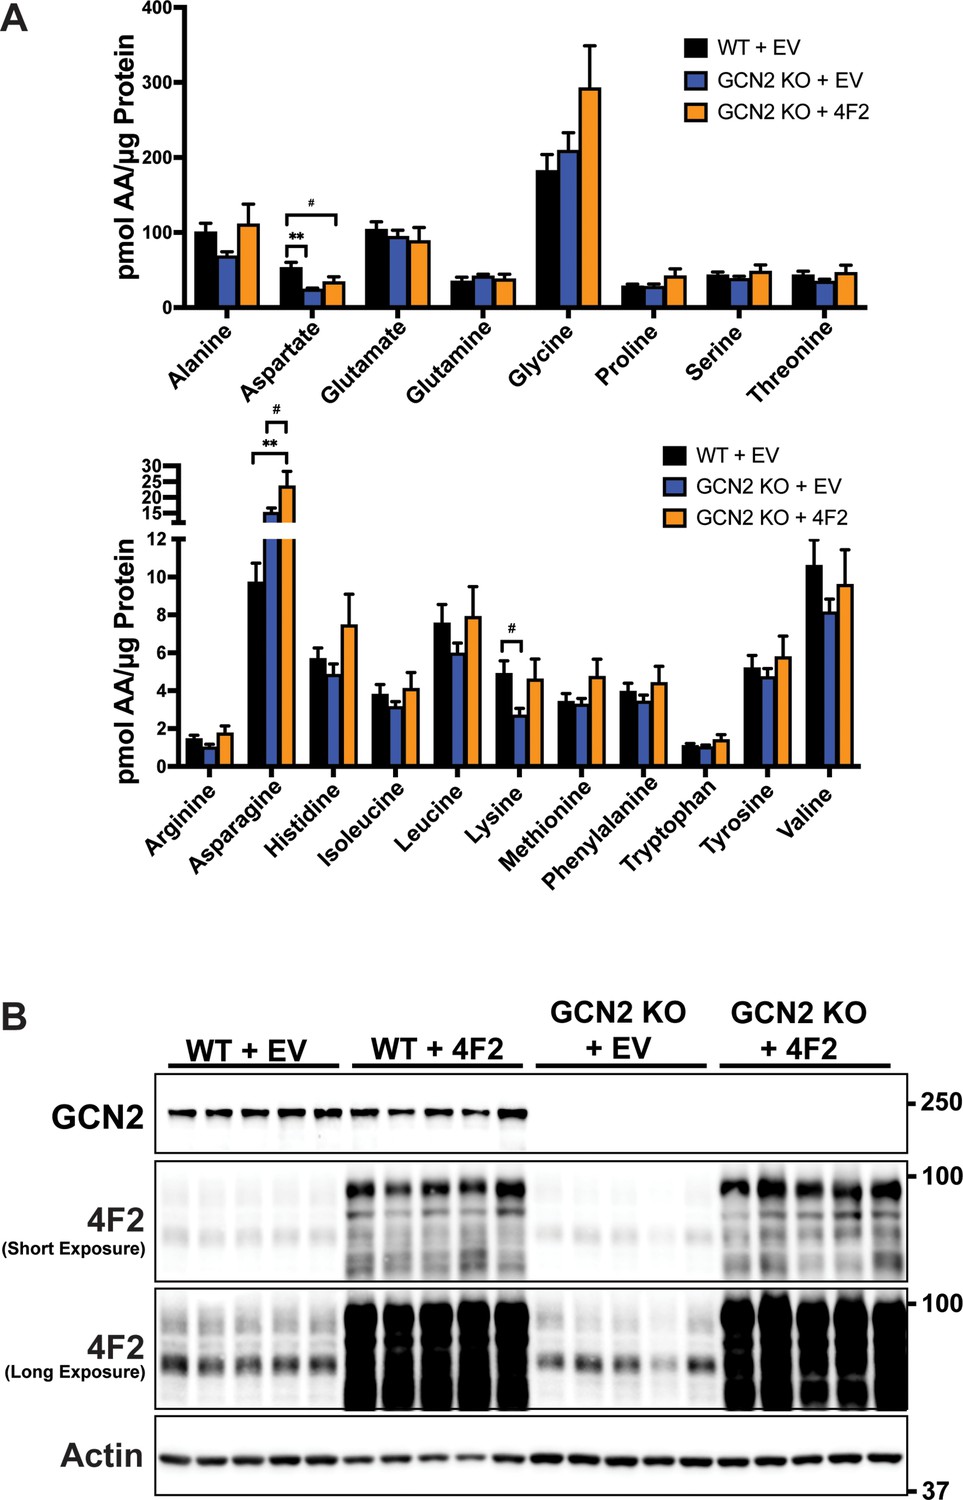
Effect of overexpression of 4F2 (SLC3A2) on amino acid levels in 22Rv1 WT and GCN2 KO tumors.
(A) Amino acid measurements from 22Rv1 WT + EV, 22Rv1 GCN2 KO + EV, and 22Rv1 GCN2 KO + 4F2 (SLC3A2) tumors. Two separate bar graphs show high abundance (top) and low abundance (bottom) amino acids. Statistical significance was determined using a one-way analysis of variance (ANOVA) with Tukey’s multiple comparisons. Error bars indicate standard deviation (SD) (N = 4); #p ≤ 0.1, **p ≤ 0.01. (B) Lysates were prepared from these tumors in A were analyzed by immunoblot to measure total GCN2, 4F2 (SLC3A2), or actin. A long and short exposure for the 4F2 (SLC3A2) immunoblot is shown. Molecular weight markers are indicated in kilodaltons for each immunoblot panel.
Figure 7 with 3 supplements
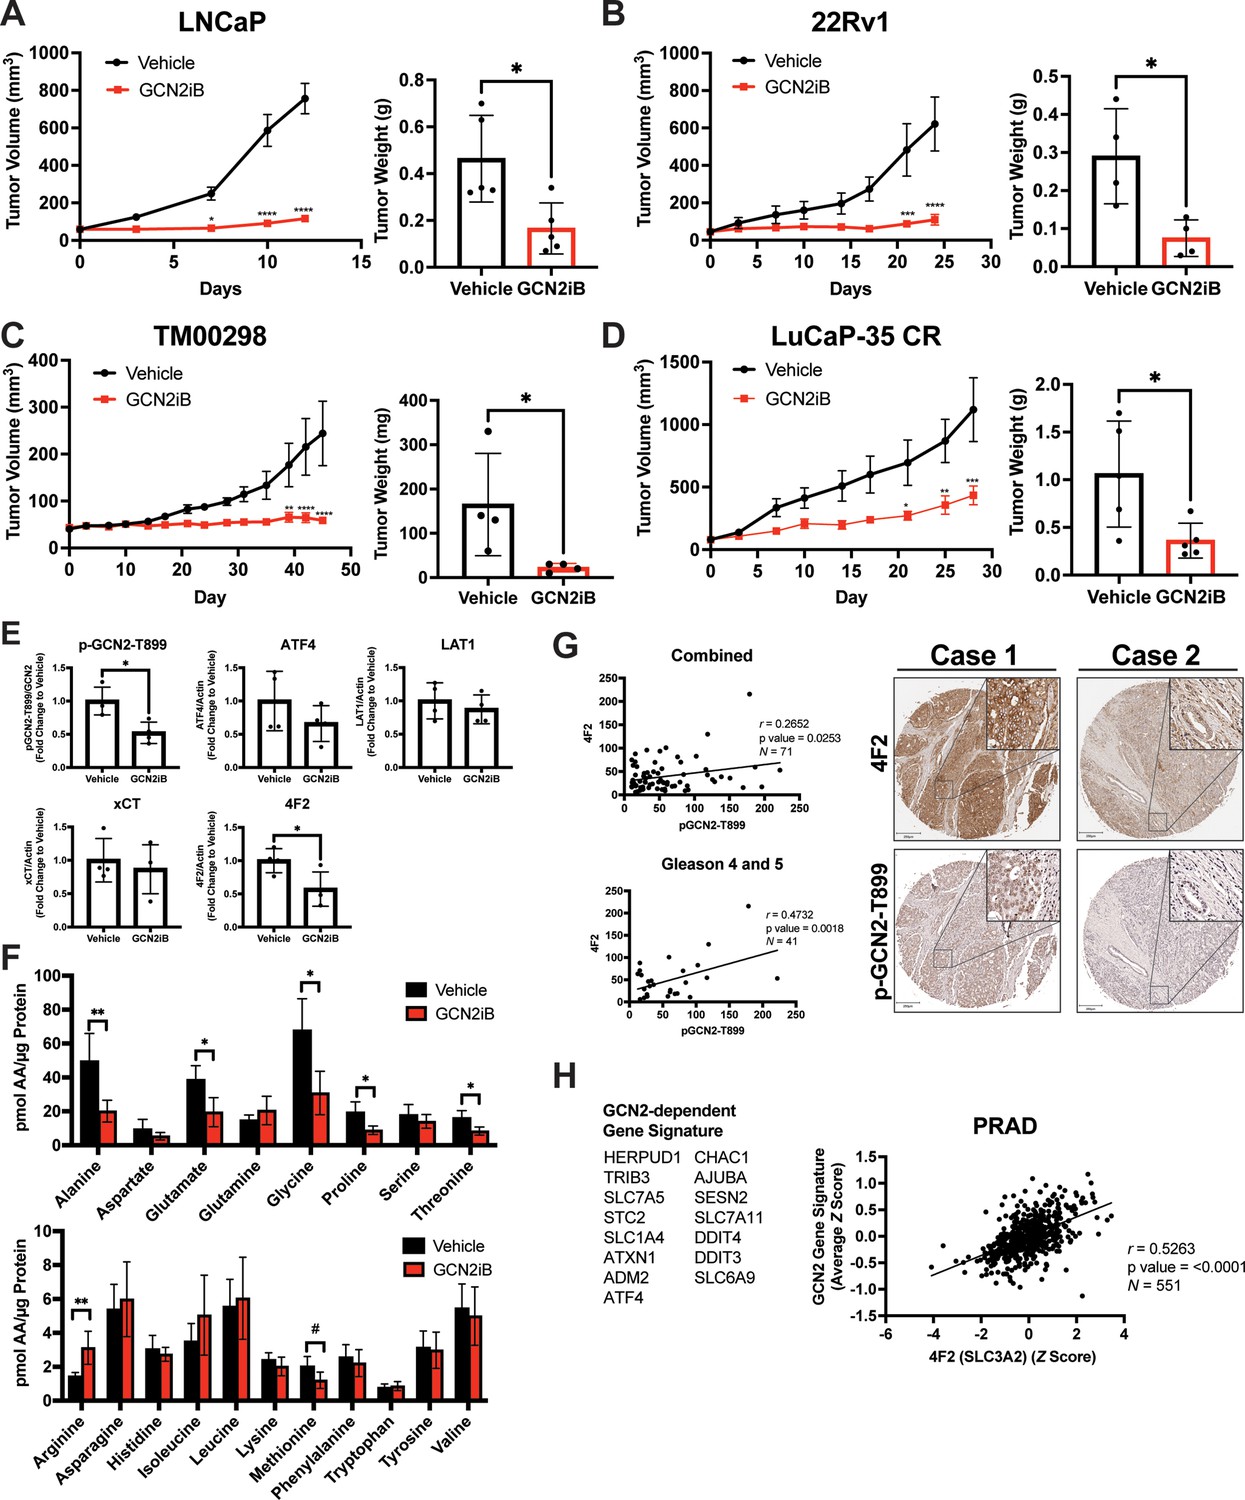
Pharmacological inhibition of GCN2 reduces tumor growth in cell line-derived and patient-derived xenograft models.
Male NSG mice were injected subcutaneously with LNCaP (N = 5) (A) or 22Rv1 (N = 4) (B) cells, or alternatively implanted with tumor fragments from an androgen-sensitive tumor TM00298 (N = 5) (C). Male castrated NSG mice were implanted with tumor fragments from LuCaP-35 CR tumors (N = 5) (D). Mice were treated with vehicle or 30 mg/kg GCN2iB twice daily for 5 days/week and tumor volumes were measured on indicated days. Statistical significance was determined using a two-way analysis of variance (ANOVA) with Sidak’s multiple comparison. Error bars indicate standard error of the mean (SEM); *p ≤ 0.05, **p ≤ 0.01, ***p ≤ 0.001, ****p ≤ 0.0001. Final tumor weight was measured at endpoint and is represented in bar graphs (right panels). Statistical significance was determined using an unpaired two-tailed t-test. Error bars indicate standard deviation (SD); *p ≤ 0.05. (E) Protein lysates were prepared from 22Rv1 tumors treated with vehicle or GCN2iB and analyzed by immunoblot for phosphorylated GCN2-T899, ATF4, LAT1 (SLC7A5), xCT (SLC7A11), and 4F2 (SLC3A2), and actin. The levels of the SLC proteins normalized to actin are shown. Phosphorylated GCN2-T899 was normalized to total GCN2. Statistical significance was determined using an unpaired two-tailed t-test. Error bars indicate SD (N = 4); *p ≤ 0.05. (F) Amino acid measurements of 22Rv1 tumors treated with vehicle or GCN2iB. Bar graphs show high abundance (top) and low abundance (bottom) amino acids. Statistical significance was determined using an unpaired two-tailed t-test. Error bars indicate SD (N = 4); #p ≤ 0.1; *p ≤ 0.05; **p ≤ 0.01. (G) Pearson correlation between p-GCN2-T899 and 4F2 (SLC3A2) histoscores calculated from IHC staining from a prostate tumor microarray (Biomax PR807c) containing normal (N = 10), hyperplasia (N = 20), and malignant (N = 50) for all tissues (combined) or Gleason scores 4 and 5. The center lines depict linear regression (95% confidence intervals). Not all samples were analyzed due to damaged/quality of tissue samples. Levels of p-GCN2-T899 and 4F2 (SLC3A2) were measured by IHC staining and QuPath was used to determine the histoscore. Two representative cases are shown for high (Case 1) and low (Case 2) p-GCN2-T899 and 4F2 (SLC3A2) staining. Scale bar indicates 200 µm (main image) and 20 µm (insert). (H) Correlation of expression of 4F2 (SLC3A2) and a GCN2-dependent gene signature in prostate adenocarcinoma (PRAD, N = 551) from the Cancer Genome Atlas (TCGA). The GCN2-dependepent gene signature was derived from RNA-seq data as described in the Materials and methods.
Figure 7—figure supplement 1
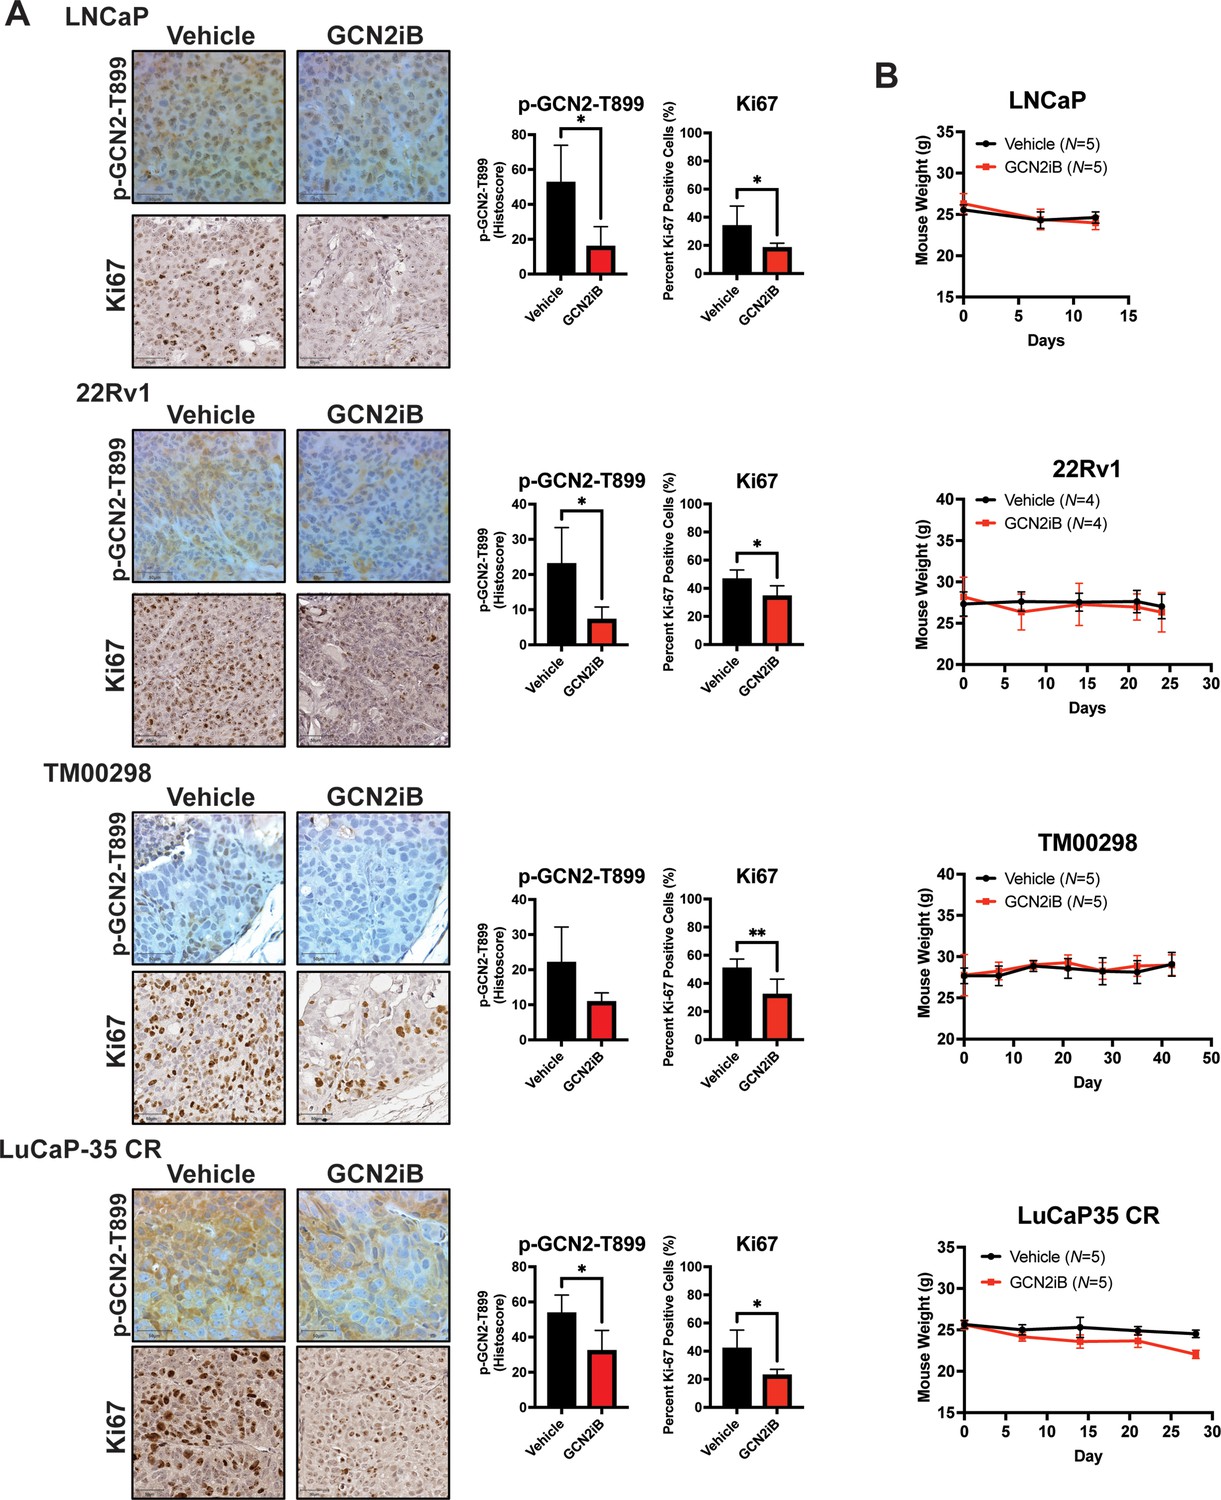
GCN2iB reduces proliferation in prostate cancer (PCa) cell line-derived and patient-derived xenograft models and has no effect on mouse body weight.
Male NSG mice were injected subcutaneously with LNCaP (N = 5) or 22Rv1 (N = 4) cells, or implanted with tumor fragments from an androgen-sensitive tumor TM00298 (N = 5) or the castration-resistant LuCaP-35 CR (N = 5) tumor and treated as described in Figure 7. (A) Representative images showing IHC staining for Ki-67 or p-GCN2-T899 from tumor described above. Bar graphs show quantification of percent positive nuclear staining (Ki67) or Histoscore (p-GCN2-T899). Error bars indicate standard deviation (SD). Statistical significance was determined using an unpaired two-tailed t-test; *p ≤0.05; **p ≤ 0.01. (B) Mouse body weight was measured on indicated days for mice bearing LNCaP, 22Rv1, TM00298, or LuCaP-35 CR tumors treated with vehicle or GCN2iB as described in Figure 7.
Figure 7—figure supplement 2
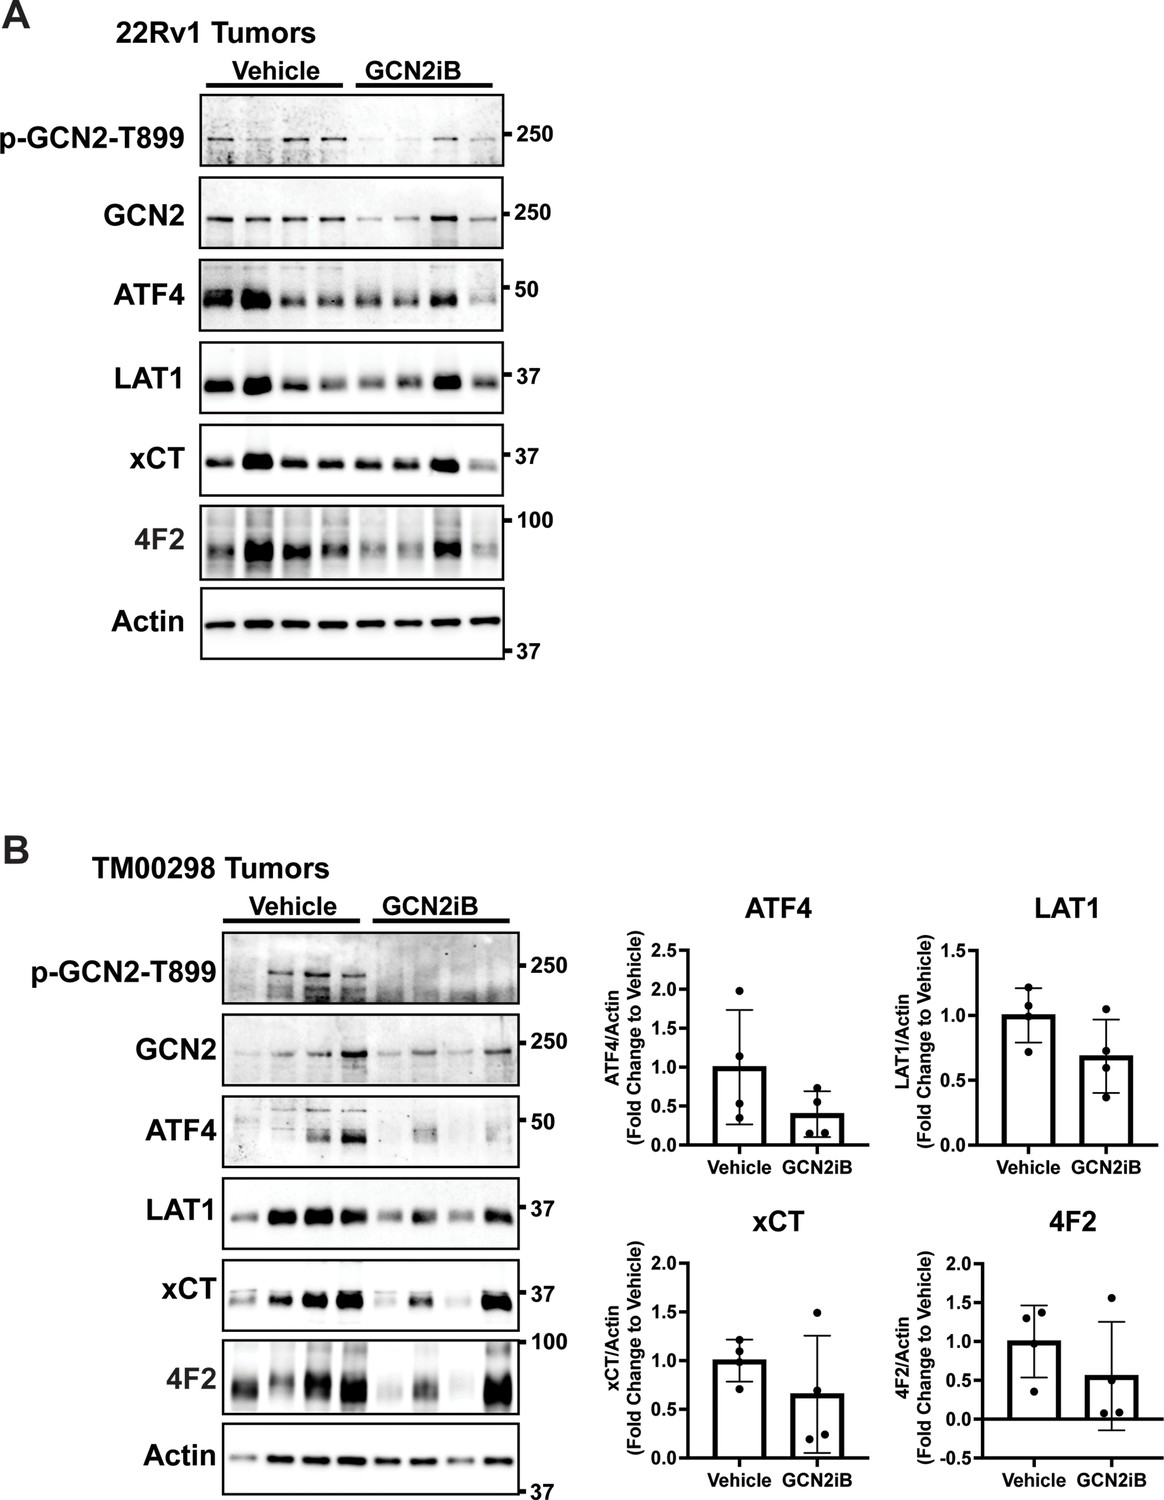
Treatment with GCN2 inhibitor, GCN2iB, reduces the expression of SLC genes associated with amino acid transport in 22Rv1 and TM00298 tumors.
Immunoblot analysis of 22Rv1 (A) or TM00298 (B) tumors from mice treated with GCN2iB as described in Figure 7. Molecular weight markers are indicated in kilodaltons for each immunoblot panel. The levels of the indicated proteins from TM00298 tumors normalized to appropriate control are shown in the bar graph (N = 4).
Figure 7—figure supplement 3
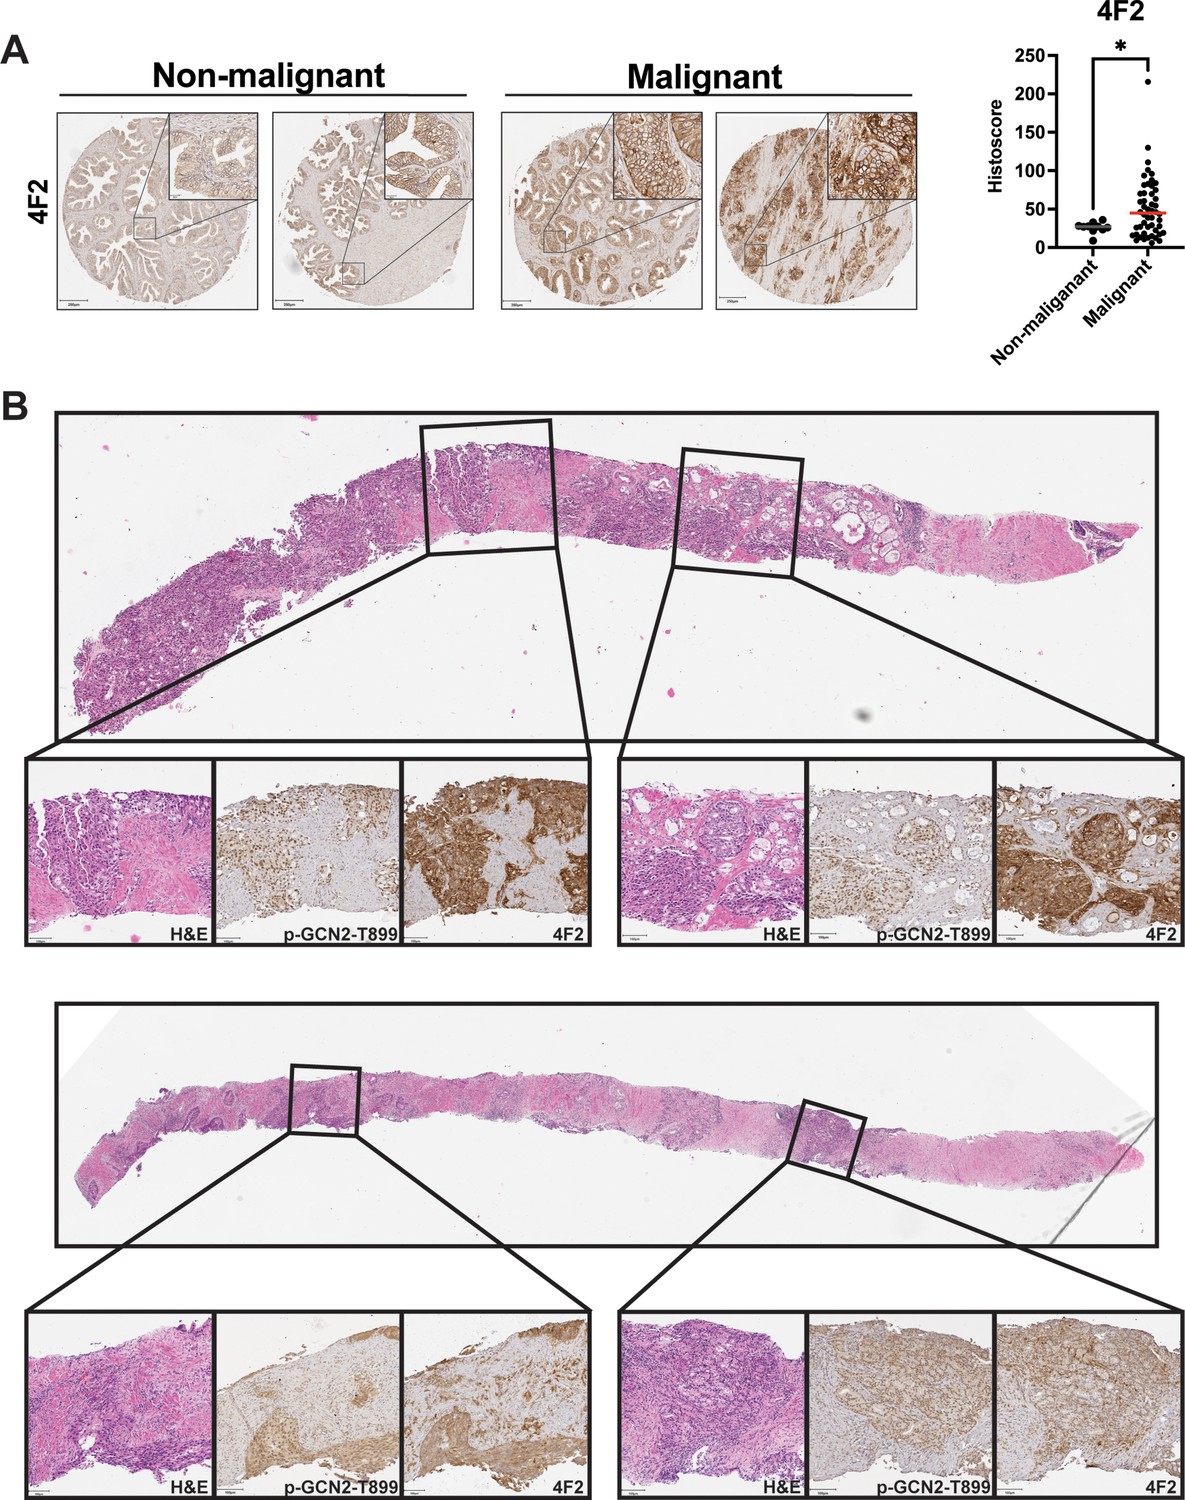
4F2 (SLC3A2) protein levels are higher in malignant prostate cancer tissue compared to normal prostate tissue.
(A) The protein levels of 4F2 (SLC3A2) were measured in a prostate tumor microarray (Biomax PR807c) using immunohistochemistry (IHC). Staining for 4F2 (SLC3A2) from normal prostate tissue (N = 10) and malignant prostate cancer tissue (N = 50) was analyzed and quantified using QuPath to determine the histoscore and is represented as a scatterplot. Statistical significance was determined using an unpaired two-tailed t-test; *p ≤ 0.05. Representative images showing 4F2 (SLC3A2) staining of normal and malignant prostate tissues are shown. Scale bars: 200 µm (main image) and 20 µm (insert). (B) H&E and IHC staining using p-GCN2-T899 or 4F2 (SLC3A2) antibody in prostate needle biopsy specimens from patients with high grade prostate cancer with Gleason scores 5 + 4 = 9 (top) or 4 + 5 = 9 (bottom).
Additional files
-
Supplementary file 1
Statistical analysis for growth assays.
- https://cdn.elifesciences.org/articles/81083/elife-81083-supp1-v2.xlsx
-
Supplementary file 2
Normalized read counts and analysis of RNA-seq data.
- https://cdn.elifesciences.org/articles/81083/elife-81083-supp2-v2.xlsx
-
Supplementary file 3
Normalized read counts and analysis of Charge-seq data.
- https://cdn.elifesciences.org/articles/81083/elife-81083-supp3-v2.xlsx
-
Supplementary file 4
CRISPR screen analysis of depleted genes and single guide RNAs (sgRNAs).
- https://cdn.elifesciences.org/articles/81083/elife-81083-supp4-v2.xlsx
-
Supplementary file 5
Supplementary tables.
- https://cdn.elifesciences.org/articles/81083/elife-81083-supp5-v2.docx
-
MDAR checklist
- https://cdn.elifesciences.org/articles/81083/elife-81083-mdarchecklist1-v2.docx
-
Source data 1
Western blot source data for main figures, including all individual uncropped western blot images.
- https://cdn.elifesciences.org/articles/81083/elife-81083-data1-v2.zip
-
Source data 2
Western blot source data for Figure 1—figure supplement 1 and Figure 1—figure supplement 2, including all individual uncropped western blot images.
- https://cdn.elifesciences.org/articles/81083/elife-81083-data2-v2.zip
-
Source data 3
Western blot source data for Figure 1—figure supplement 3, including all individual uncropped western blot images.
- https://cdn.elifesciences.org/articles/81083/elife-81083-data3-v2.zip
-
Source data 4
Western blot source data for Figure 1—figure supplement 5, Figure 3—figure supplement 2, Figure 3—figure supplement 4, Figure 4—figure supplement 3, and Figure 6—figure supplement 2, including all individual uncropped western blot images.
- https://cdn.elifesciences.org/articles/81083/elife-81083-data4-v2.zip
-
Source data 5
Western blot source data for Figure 6—figure supplement 3, Figure 6—figure supplement 4, and Figure 7—figure supplement 2, including all individual uncropped western blot images.
- https://cdn.elifesciences.org/articles/81083/elife-81083-data5-v2.zip
Download links
A two-part list of links to download the article, or parts of the article, in various formats.
Downloads (link to download the article as PDF)
Open citations (links to open the citations from this article in various online reference manager services)
Cite this article (links to download the citations from this article in formats compatible with various reference manager tools)
GCN2 eIF2 kinase promotes prostate cancer by maintaining amino acid homeostasis
eLife 11:e81083.
https://doi.org/10.7554/eLife.81083


