Structure of Dunaliella photosystem II reveals conformational flexibility of stacked and unstacked supercomplexes
- Department of Biochemistry and Molecular Biology, The George S. Wise Faculty of Life Sciences, Tel Aviv University, Israel
- School of Molecular Sciences, Arizona State University, United States
- Biodesign Center for Applied Structural Discovery, Arizona State University, United States
Figures
Figure 1 with 9 supplements
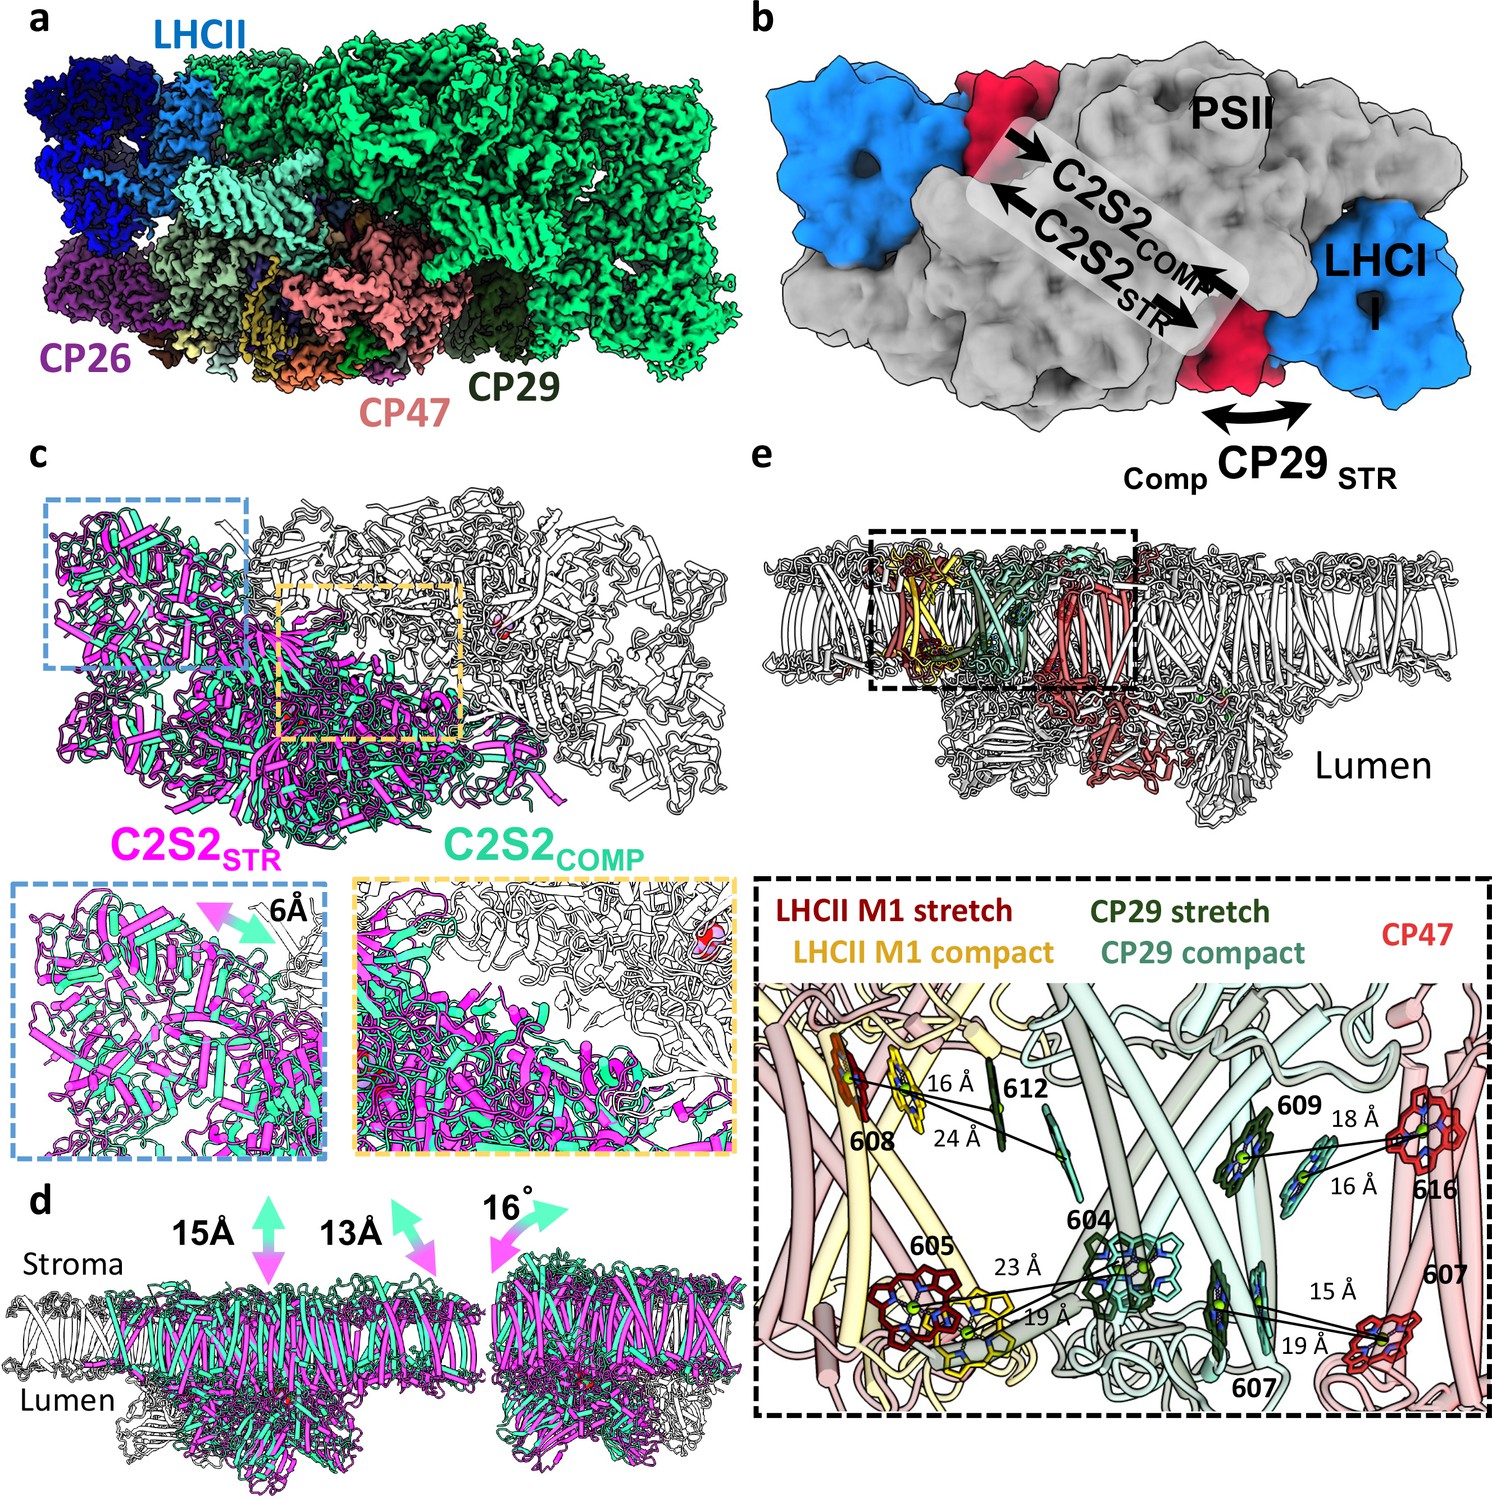
Two conformations of the eukaryotic photosystem II (PSII).
(a) Overall view of the PSII C2S2 map in the compact conformation. One asymmetric unit is coloured in green, and in the other, each chain is coloured individually. PSII is shown from a luminal view in panels a–c. (b) Low-resolution model depicting the overall shifts in subunits between the two PSII conformations. CP29 in red, light-harvesting complex II (LHCII) in blue, and the two PSII cores in grey. (c) The two PSII conformations were superposed on one asymmetric unit (coloured in grey). The second asymmetric unit is coloured in magenta for the stretched conformation (C2S2STR) and green for the compact conformation (C2S2COMP). A close up showing a 6 Å shift in the position of LHCII and the lateral displacement between the two cores. (d) The stretched PSII conformation shows substantial drop in the membrane plane (13–15 Å, depending on the precise location), contributing to a larger inward curve (compared to the luminal space) of the entire supercomplex. Large deformations in the position of CP26 subunit which rotates by 16° between the two conformations. PSII is shown from a membrane plane view in panels d–e. (e) Considerable changes in the position of CP29 affect the transfer rates between LHCII and CP47. CP47 of both conformations (in red) is superposed, and distances between key chlorophylls (Chls) of CP29COMP (light turquoise) and CP29STR (dark green) show increased transfer distances in the stretched conformation. The distances between LHCII and CP29 follow an opposite trend, decreasing in the stretched conformation (LHCIISTR in dark red) and increasing in the compact conformation (LHCIICOMP in yellow). Distances were measured from the central manganese (Mg) atoms.
Figure 1—figure supplement 1
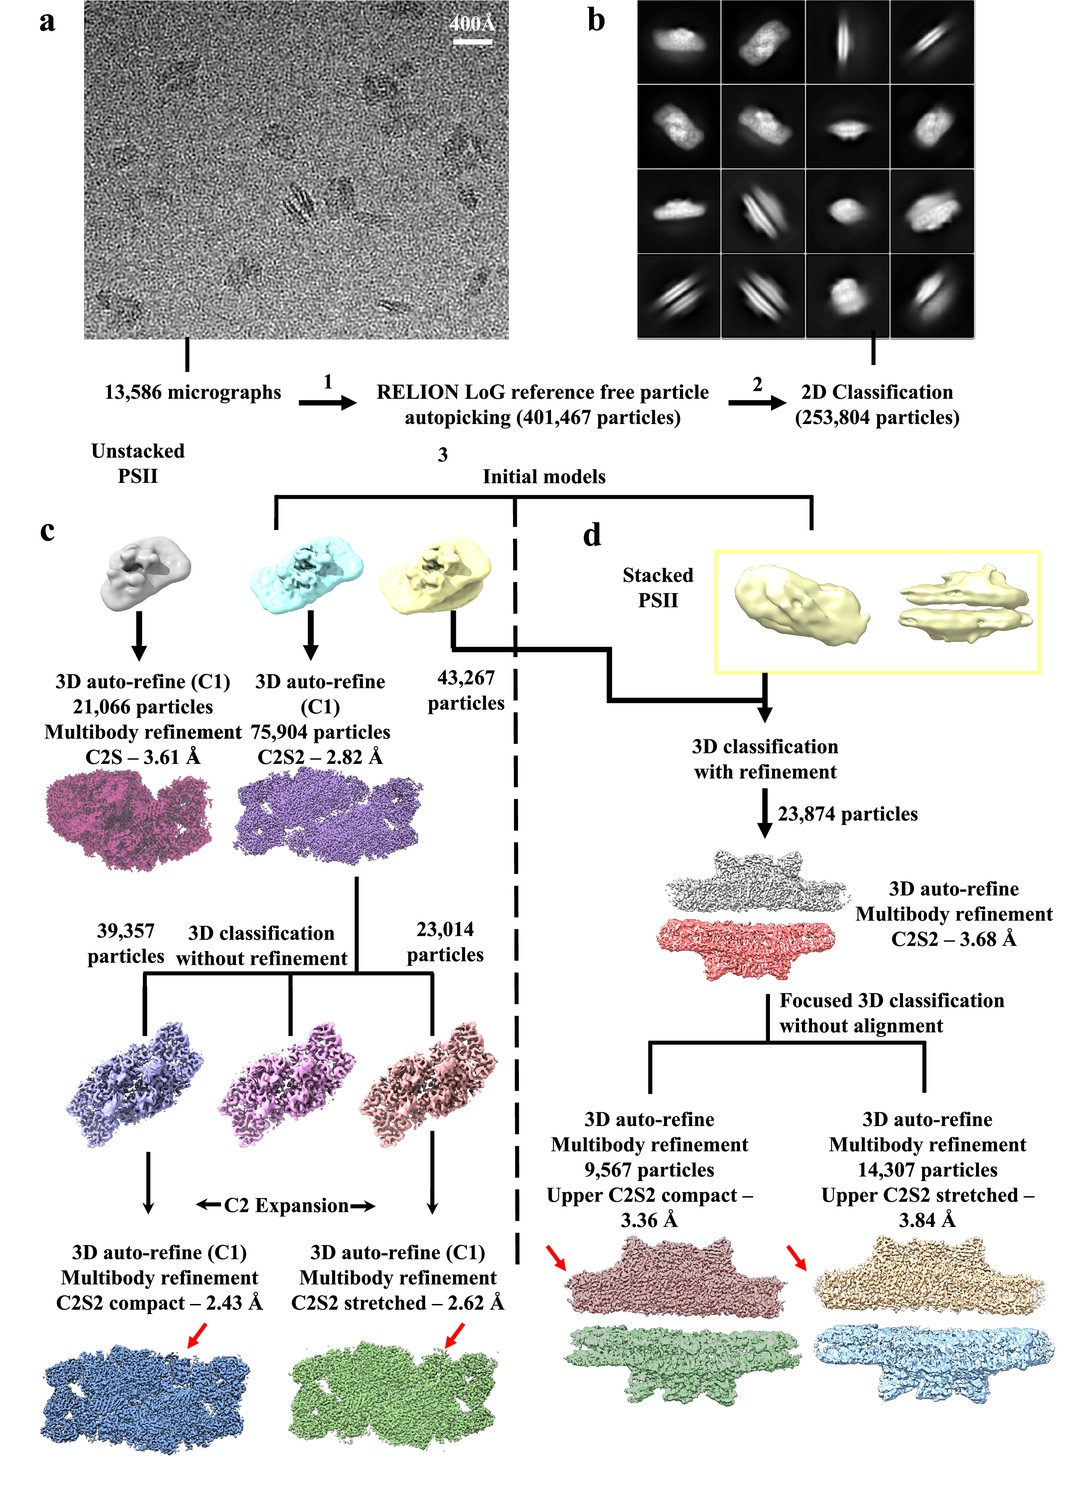
Cryo-EM data collection and processing scheme for unstacked and stacked photosystem II (PSII) complexes.
(a) Sample micrograph collected for the Dunaliella PSII dataset displaying stacked and unstacked PSII particles from multiple views. (b) 2D classes showing stacked and unstacked PSII complexes. (c) Unstacked PSII data processing workflow after 2D classification. An Ab-initio model (coloured cyan) was created in RELION, followed by 3D classification and refinement, resulted in two distinct configuration – C2S (coloured brown-red) with a global resolution of 3.61 Å, and C2S2 (coloured purple) with a global resolution of 2.82 Å. Next, 3D classification (without orientation refinement) was applied to the C2S2 set, and the dataset was separated to two conformations – C2S2 compact (coloured blue) with a global resolution of 2.43 Å, and C2S2 stretched (coloured green) with a global resolution of 2.62 Å. Red arrows show the different CP29 conformation. Particle numbers before C2 expansion are listed, see method section for full details. (d) Stacked PSII data processing workflow after 2D classification. An Ab-initio model (coloured yellow) was created in RELION, followed by 3D classification and refinement, resulting in a stacked PSII (coloured grey and red) with a global resolution of 3.68 Å. Next, focused 3D classification was applied on the stacked PSII, and the dataset was separated to two conformations according to the upper PSII dimer – stacked C2S2 compact (coloured chocolate and yellow-green) with a global resolution of 3.36 Å, and stacked C2S2 stretched (coloured wheat and sky-blue) with a global resolution of 3.84 Å. Red arrows show the difference between the compact and stretched conformations.
Figure 1—figure supplement 2
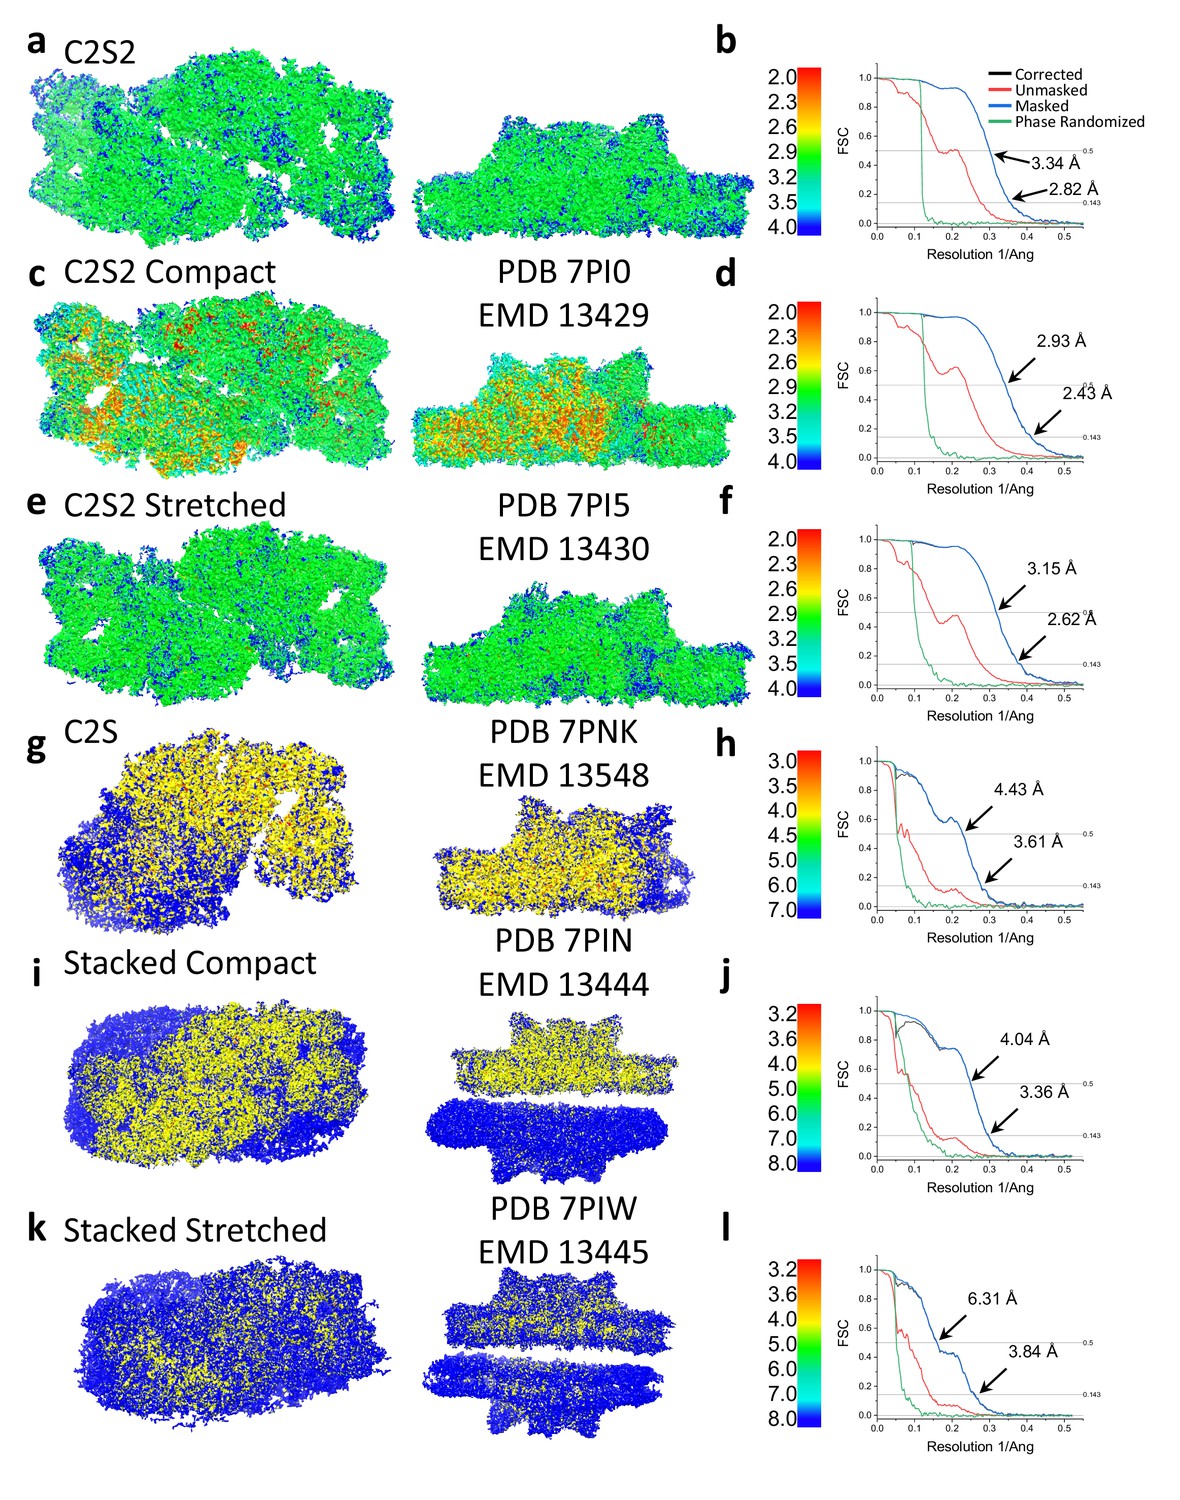
Local resolution and Fourier shell correlation (FSC) of Dunaliella photosystem II (PSII) supercomplexes.
C2S2 local resolution (a) and FSC (b). C2S2 compact local resolution (c) and FSC (d). C2S2 stretched local resolution (e) and FSC (f). C2S local resolution (g) and FSC (h). Stacked C2S2 compact local resolution (i) and FSC (j). C2S2 local resolution (a) and FSC (b). Stacked C2S2 stretched local resolution (k) and FSC (l).
Figure 1—figure supplement 3
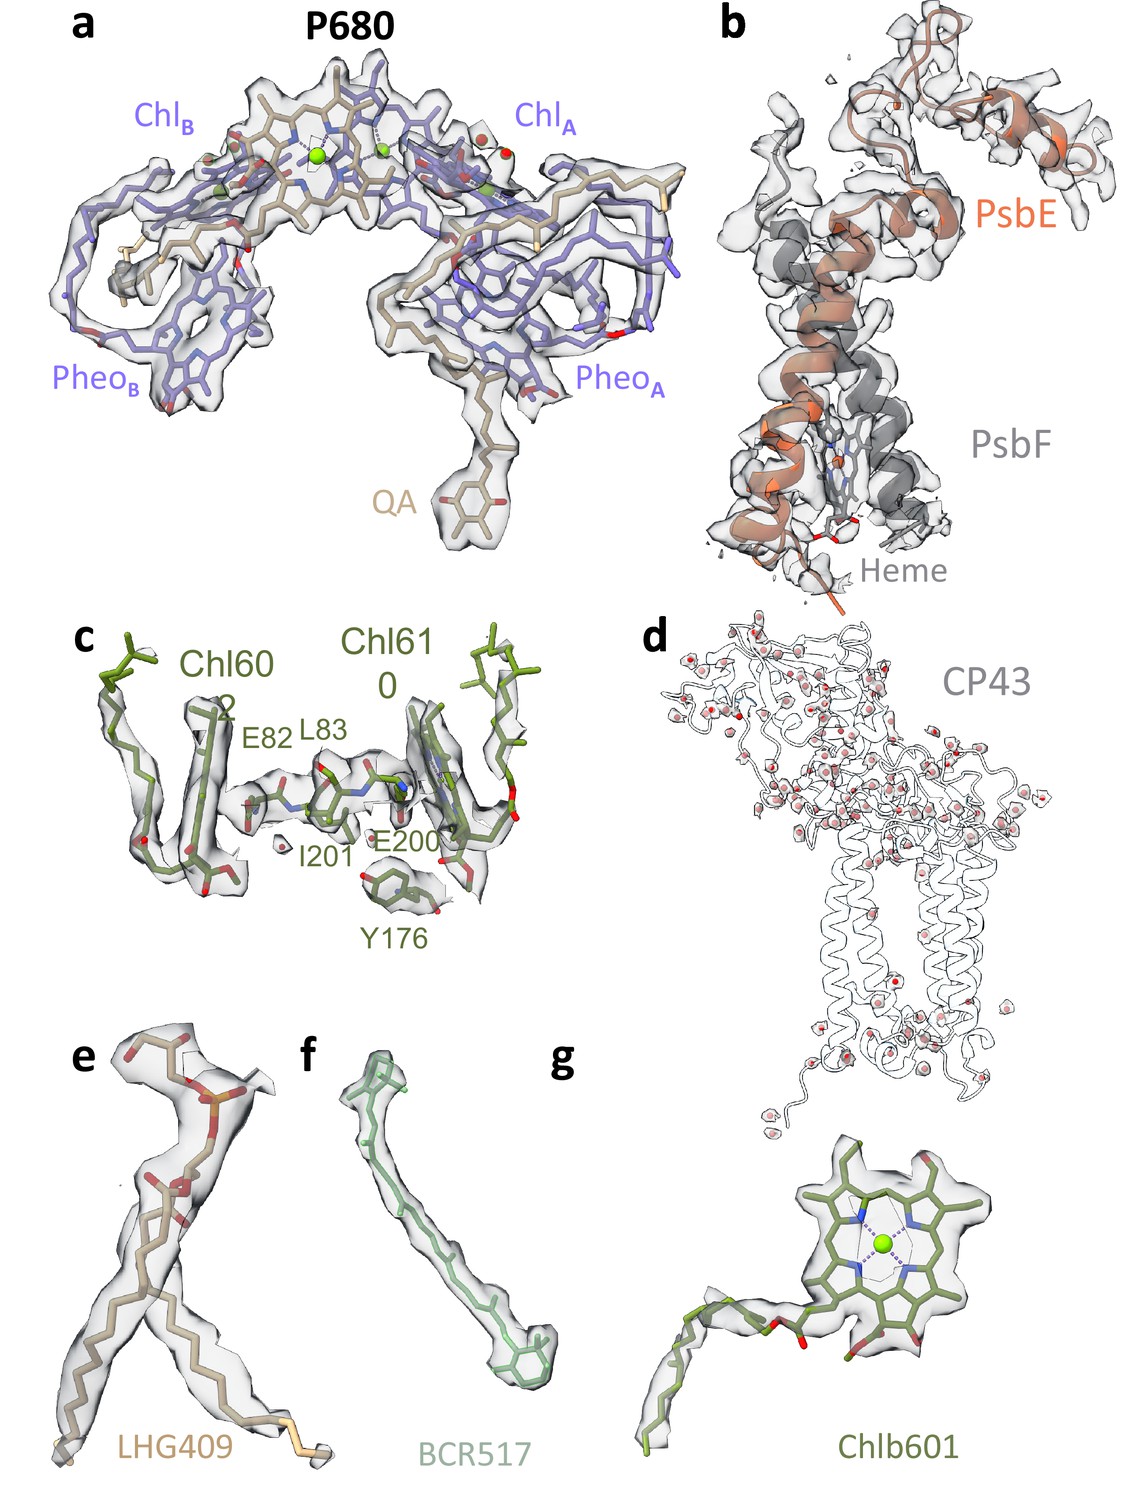
Map densities of unstacked Dunaliella photosystem II (PSII).
(a) PSII reaction centre chlorophylls (Chls), pheophytins, and quinone. Cryo-EM map shown in panels a–h at is contoured at 4σ unless mentioned otherwise. (b) Cytochrome b559 heme, alpha, and beta subunits. (c) Light-harvesting complex II (LHCII) M2 Chls 602 and 610 alongside coordinating Glu82 and Glu200, Tyr176, Leu83, and Ile201. Water molecules located between a charged and hydrophobic amino acid are shown as red spheres. (d) Water molecules coordinated by the CP43 subunit shown as red spheres with their surrounding map. (e) D2 1,2-dipalmitoyl-phosphatidyl-glycerole 409. (f) CP43 β-carotene 517. (g) LHCII M2 Chl b 601. Map shown in 3.5σ contour.
Figure 1—figure supplement 4
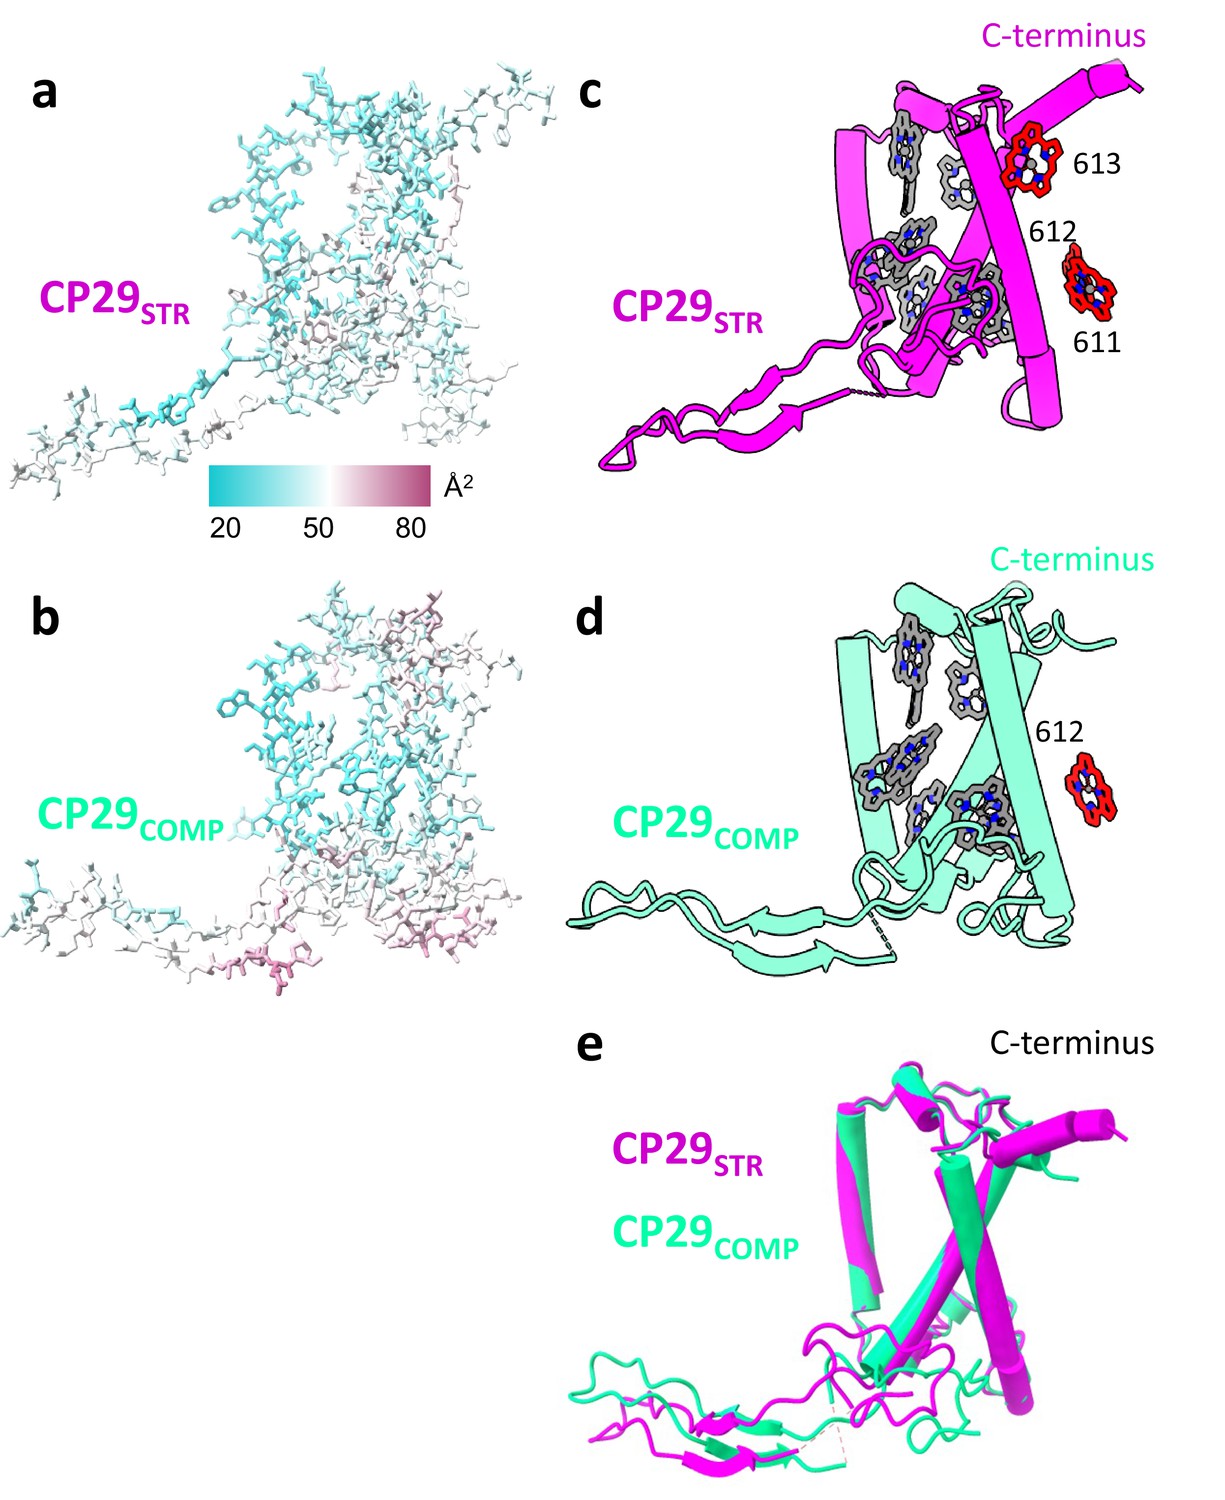
Comparing CP29STR and CP29COMP.
(a and b) CP29STR and CP29COMP backbone, side chains and carotenes, coloured according to their b-factor values, displaying a similar distribution of b-factors in both conformations. (c and d) CP29STR and CP29COMP showing chlorophyll (Chl) differences between the two structures (Chl 611 and 613 missing in CP29COMP). (e) Superposition of CP29STR and CP29COMP showing that overall, the structures are similar. The two structures were superposed along their trans-membrane helices which leads to positional shifts in their N-terminal loop. Within photosystem II (PSII) the N-terminal loop binds to the same site on the PSII core (mostly CP47) while the core of CP29 is rotated (Figure 1—figure supplement 5). The structure of the C-terminus is disturbed in CP29COMP.
Figure 1—figure supplement 5
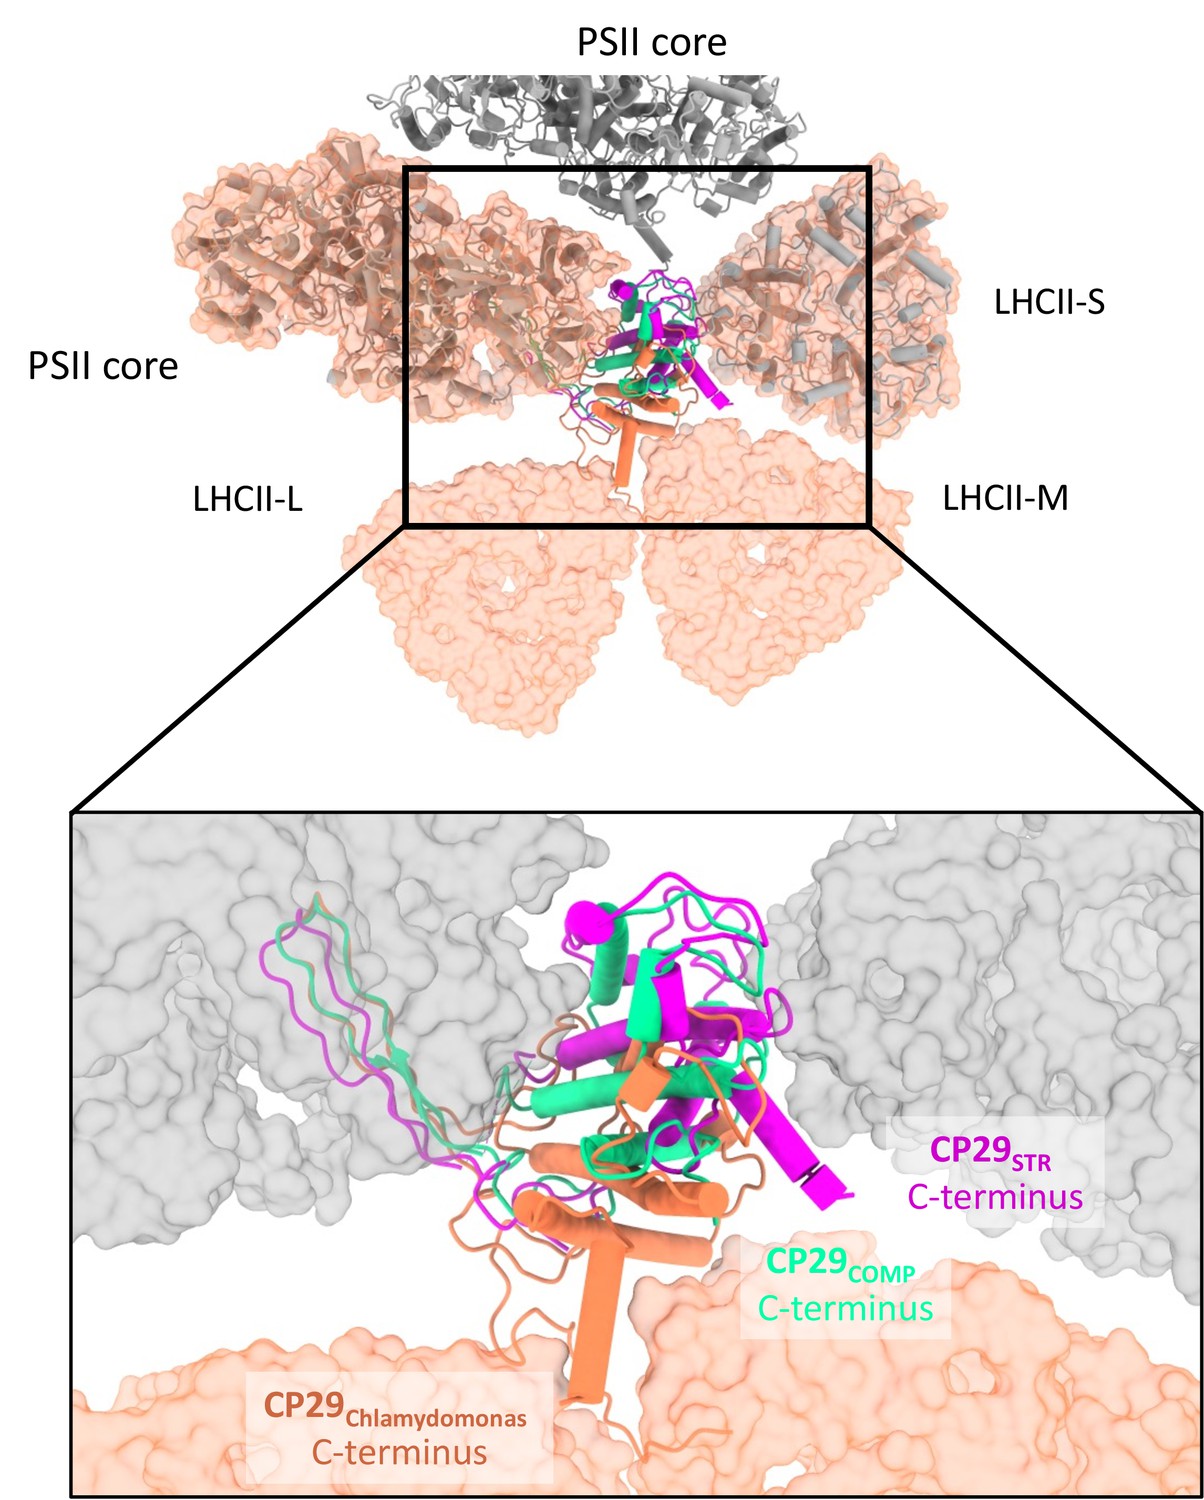
Comparing CP29 positions between Dunaliella and Chlamydomonas reinhardtii (Cr).
Photosystem II (PSII) from Cr is shown as a molecular surface coloured orange and was superposed on PSIICOMP and PSIISTR using the core subunits (grey tubes). The different orientations of CP29 are clearly visible, with the position of CP29COMP as a possible intermediate between C2S2 and C2S2M2L2. The orientation and folding of the C-terminus seems to be associated with light-harvesting complex II (LHCII) binding.
Figure 1—figure supplement 6
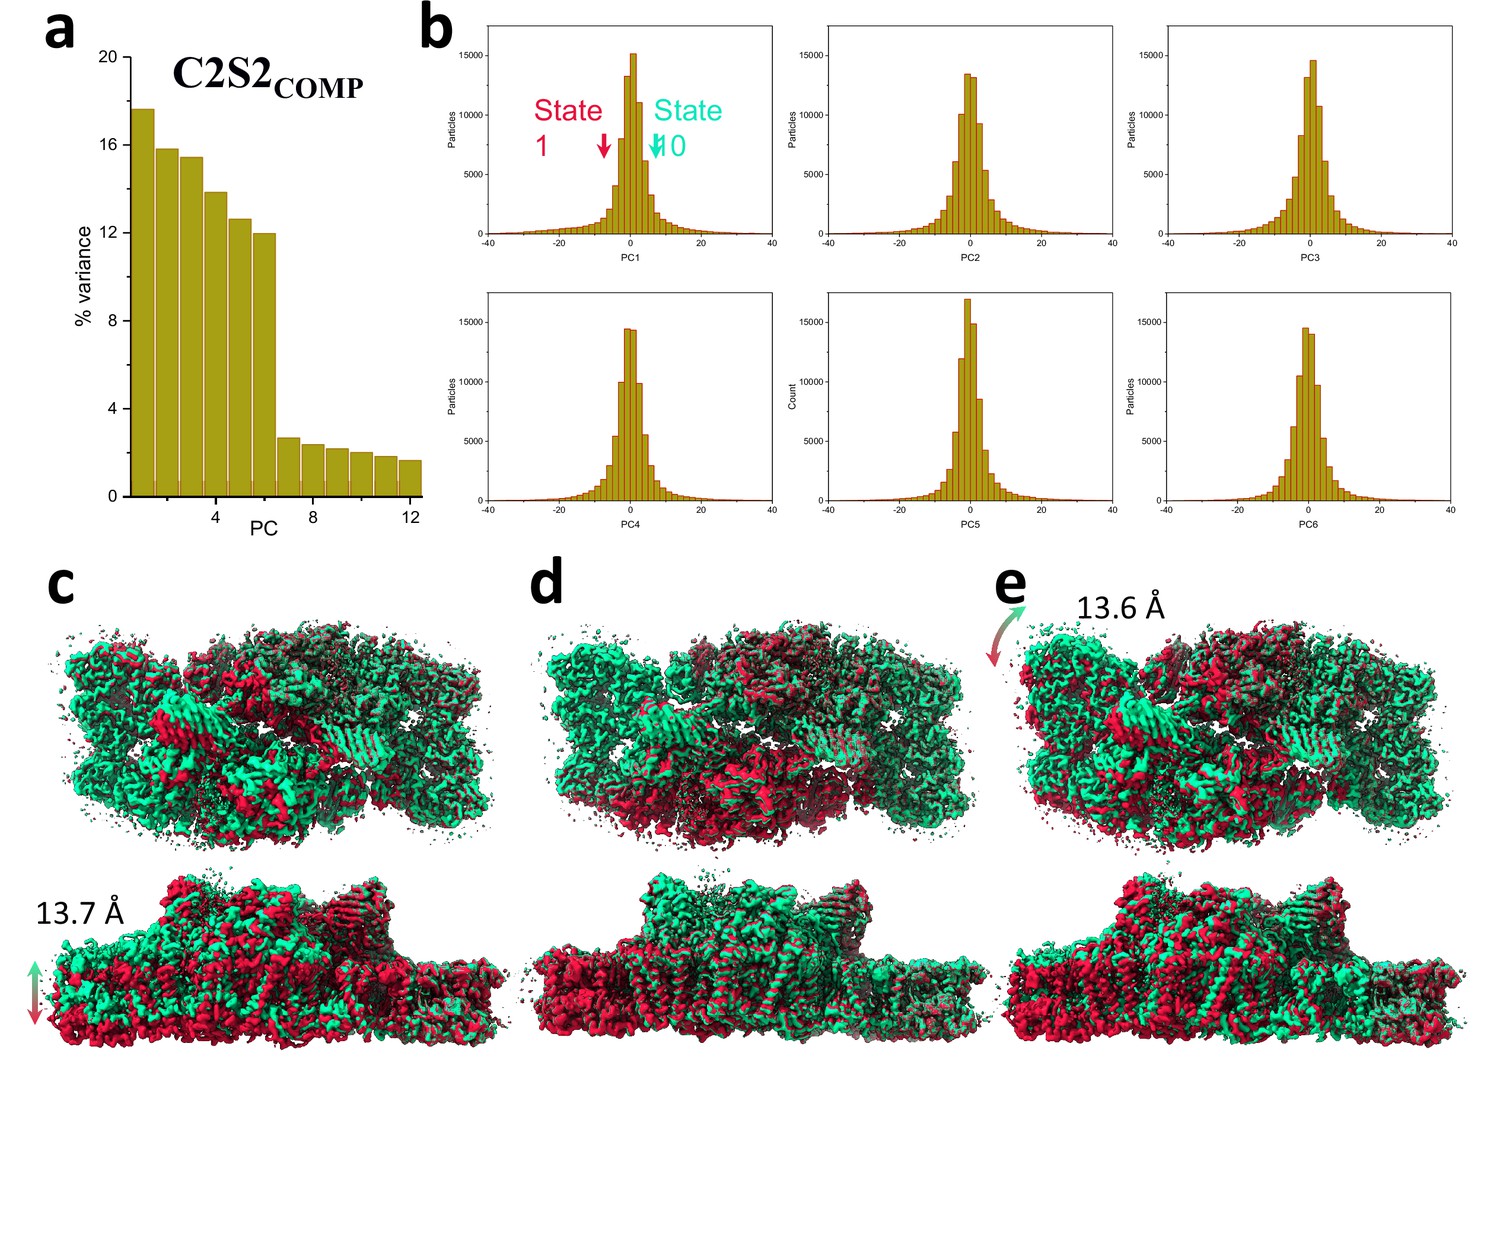
Principal component (PC) analysis of C2S2COMP.
(a) Percent of the variance explained by each of the 12 PCs. (b) The particle distribution along the first six PCs shows continuous heterogeneity in the C2S2COMP. States 1 and 10 are marked with a red and green arrow, respectively. (c) To visualize the state differences, one photosystem II (PSII) monomer was superposed, and the other monomer was used to visualize the differences. Luminal view (top), membrane plane view along the long axis (middle), and short axis (bottom) show the shift in position of C2S2COMP in the first PC. (d) Luminal view (top), membrane plane view along the long axis (middle), and short axis (bottom) show the shift in position of C2S2COMP in the second PC. (e) Luminal view (top), membrane plane view along the long axis (middle), and short axis (bottom) show the shift in position of C2S2COMP in the third PC.
Figure 1—figure supplement 7
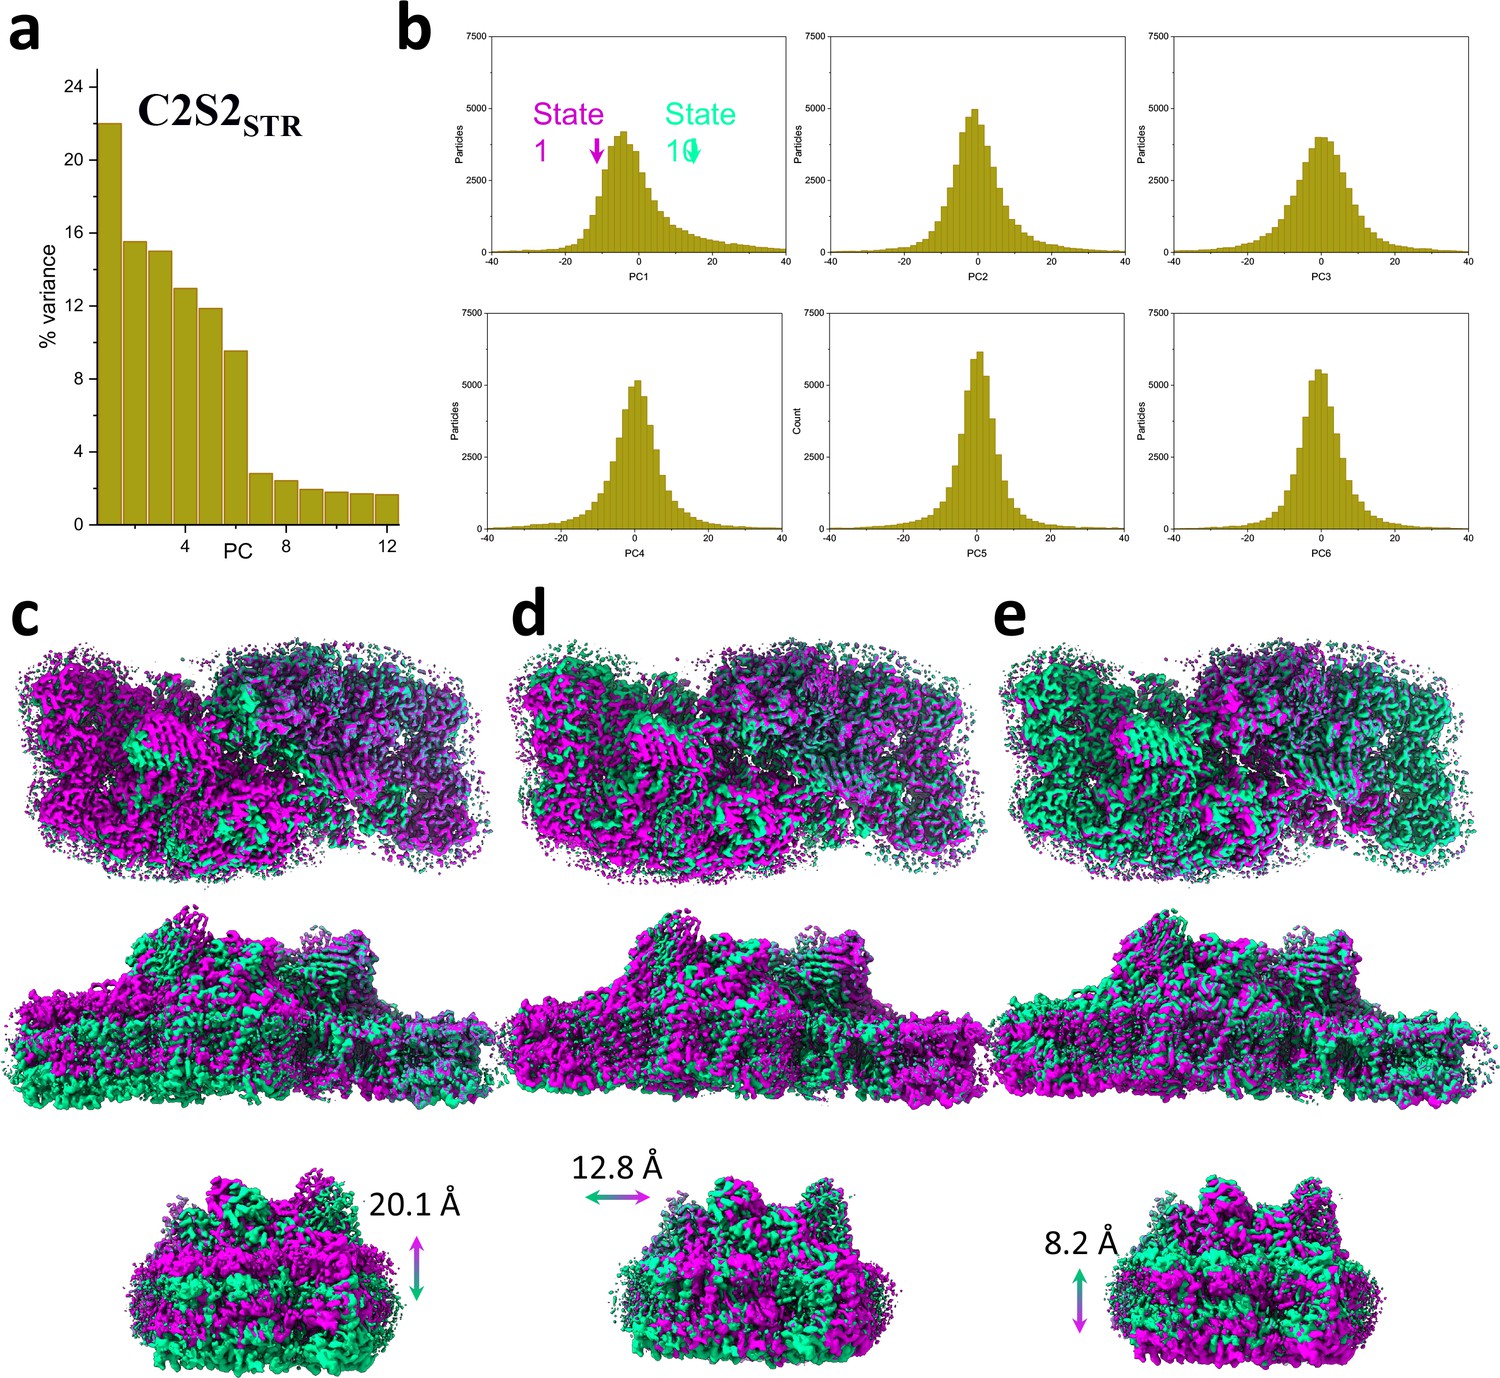
Principal component (PC) analysis of C2S2STR.
(a) Percent of the variance explained by each of the 12 PCs. (b) The particle distribution along the first six PCs shows continuous heterogeneity in the C2S2STR. States 1 and 10 are marked with a magenta and teal arrow, respectively. (c) Luminal view (top), membrane plane view along the long axis (middle), and short axis (bottom) show the shift in position of C2S2STR in the first PC. (d) Luminal view (top), membrane plane view along the long axis (middle), and short axis (bottom) show the shift in position of C2S2STR in the second PC. (e) Luminal view (top), membrane plane view along the long axis (middle), and short axis (bottom) show the shift in position of C2S2STR in the third PC.
Figure 1—figure supplement 8
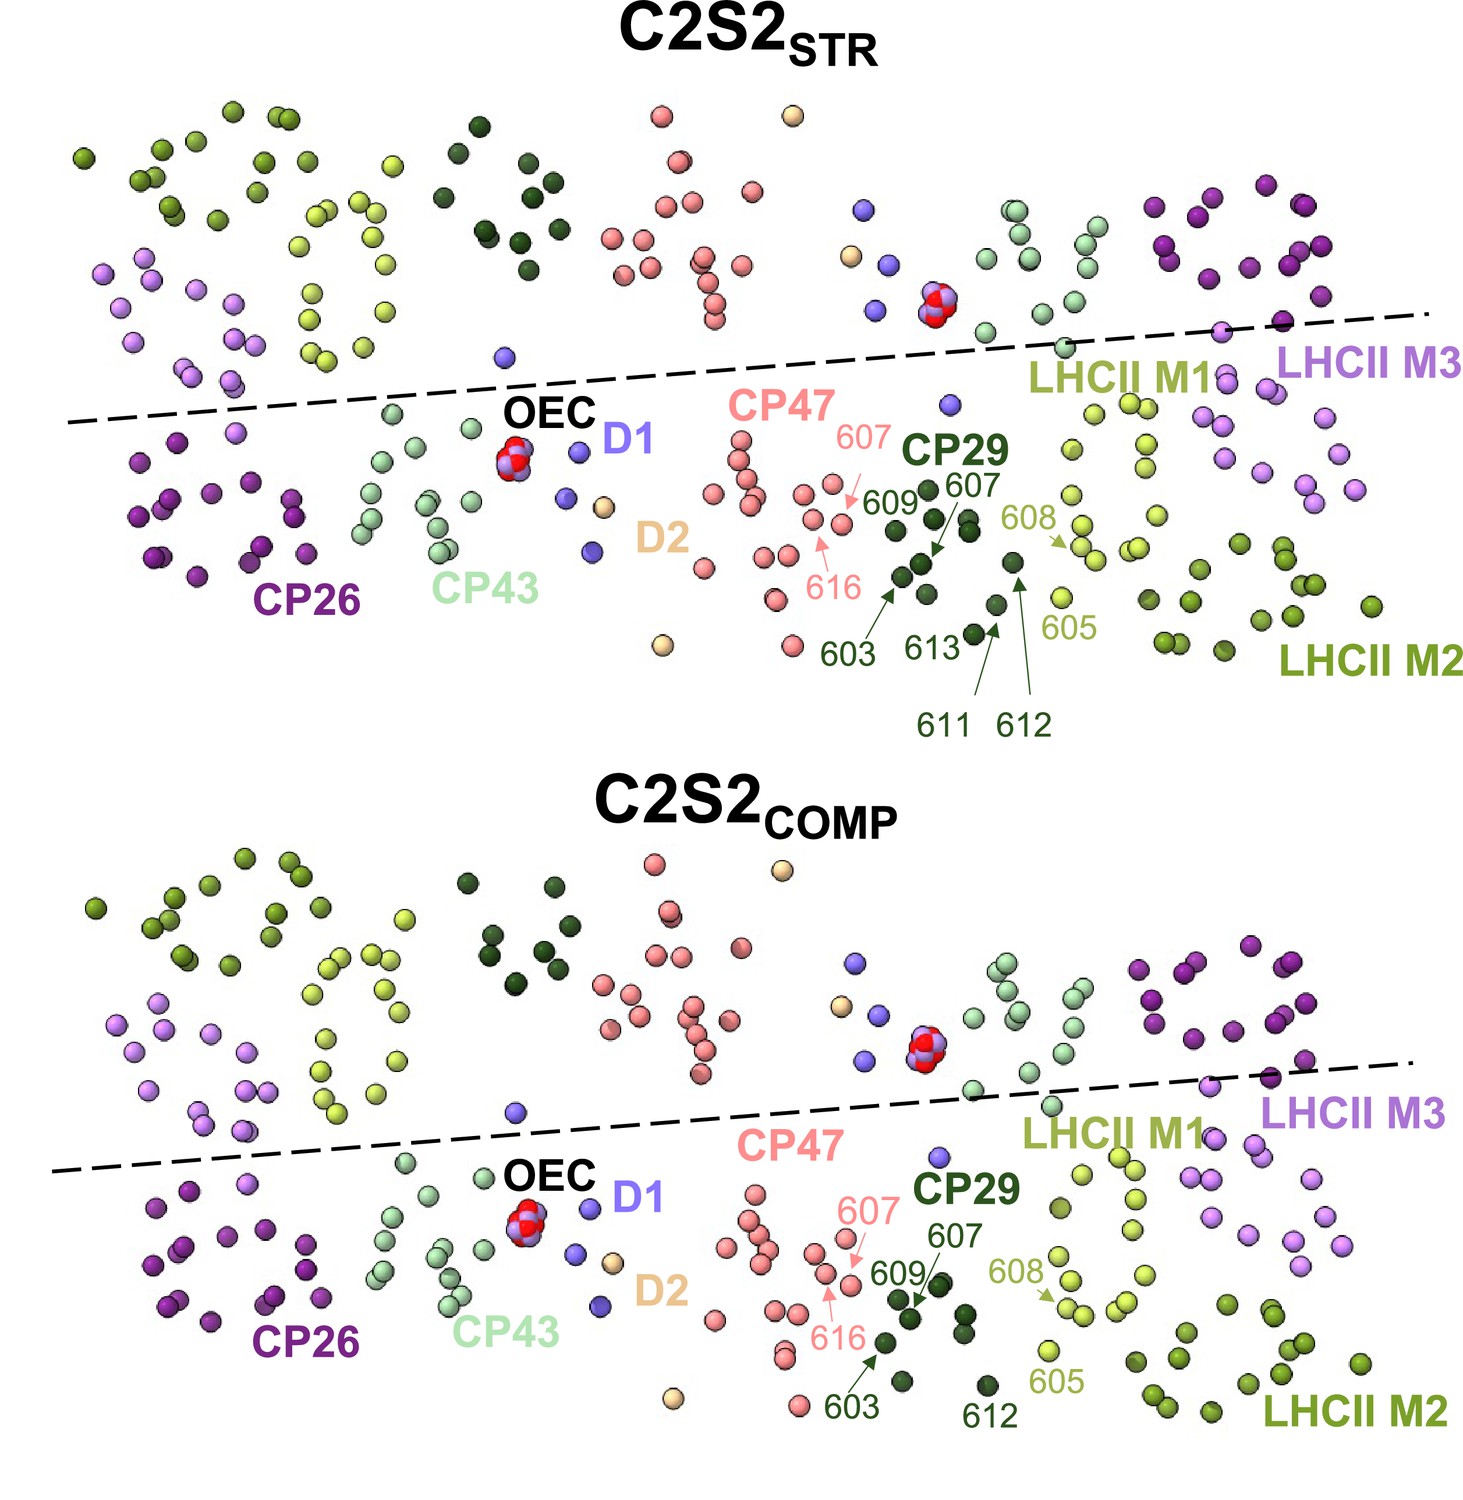
Changes in CP29 chlorophyll (Chl) positions between C2S2COMP and C2S2STR.
Several CP29 Chl molecules in C2S2STR are positioned close to light-harvesting complex II (LHCII) and can mediate faster excitation energy transfer (EET) from LHCII to photosystem II (PSII), whereas in C2S2COMP CP29 is positioned closer to CP47 and moves away from LHCII. In the C2S2STR conformation, CP29 stromal Chl 612 and Chl 611 are located 16 and 22 Å, respectively, from LHCII M1 Chl 608, while CP29 luminal Chl 613 is located 20 Å from LHCII M1 Chl 605, and CP29 Chl 604 is positioned 23 Å from both LHCII M1 Chl 604 and Chl b 605 (Figure 1e). On the opposite end of CP29, stromal Chl 609 and Chl 603 are found 18 and 22 Å, respectively, from CP47 Chl 616, while luminal Chl b 607 is found 19 Å from CP47 Chl 607. C2S2COMP presents an opposite connectivity – CP29 Chl 612 is located 24 Å from LHCII M1 Chl 608, and CP29 Chl 604 is located 19 and 23 Å from LHCII M1 Chl b 605 and Chl 604, respectively. On the other hand, the rotation of CP29 into the monomer-monomer interface in C2S2COMP set CP29 Chl 603 and Chl 609 19 and 16 Å, respectively, from CP47 Chl 616, while CP29 Chl b 607 is located 15 Å from CP47 Chl 607 (Figure 1e). Chls are presented as spheres, coloured according to their subunit, and the oxygen-evolving complex (OEC) is shown in red and purple sphere.
Figure 1—figure supplement 9
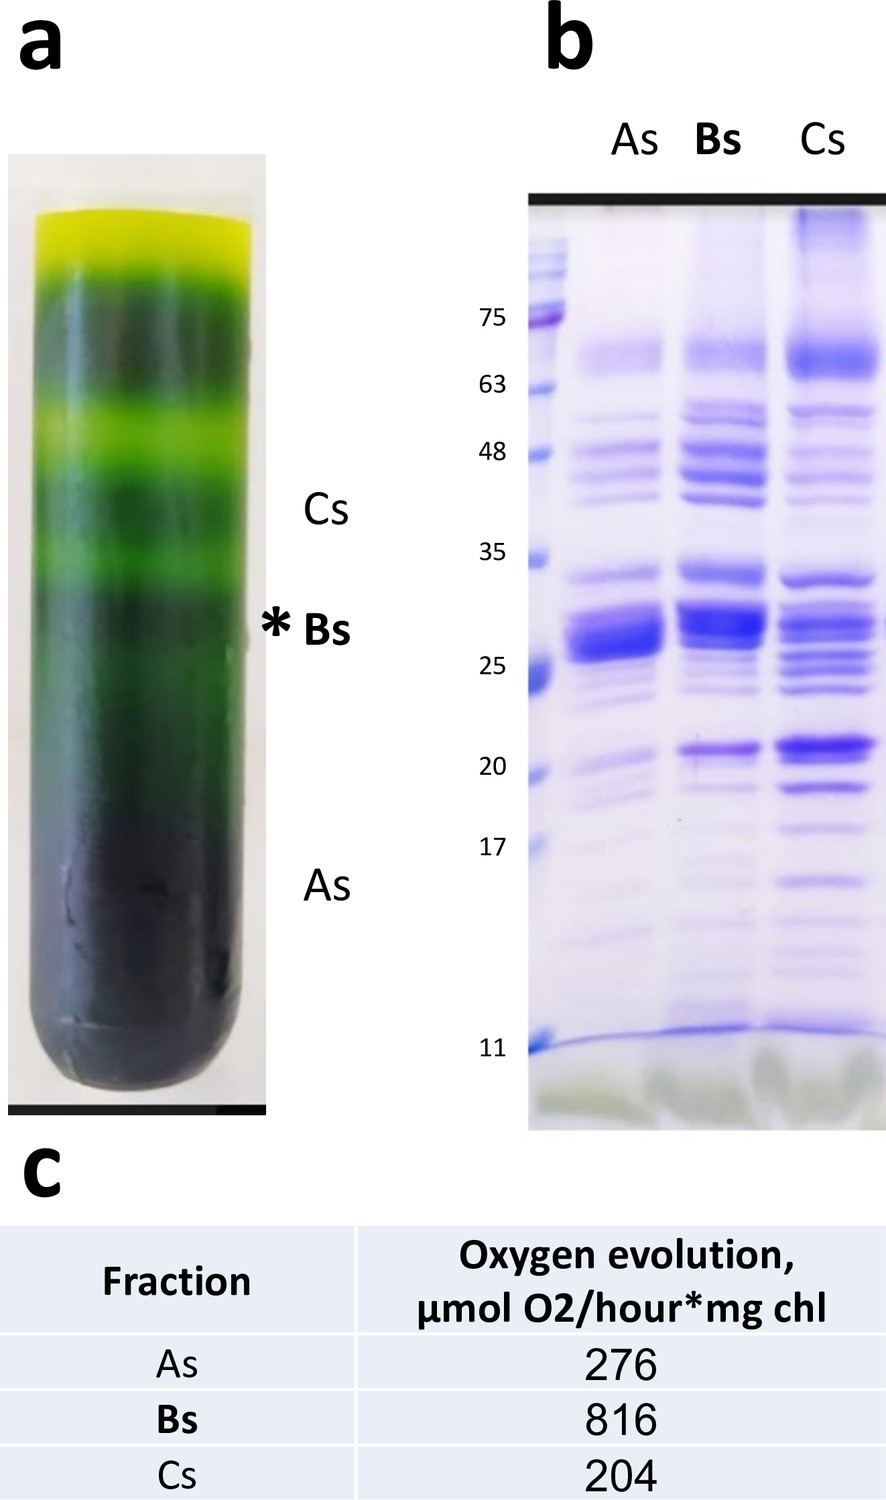
Sucrose gradient and sodium dodecyl sulfate–polyacrylamide gel electrophoresis (SDS-PAGE) of Dunaliella photosystem II (PSII) preparation.
(a) Sucrose density gradient of the final Dunaliella PSII preparation. The three fractions collected are marked As, Bs, and Cs. The Bs fraction was used for cryo-EM data collection. (b) SDS-PAGE of the three fractions. (c) Oxygen evolution rates for the collected fractions.
-
Figure 1—figure supplement 9—source data 1
Uncropped gel image of Figure 1—figure supplement 9b.
- https://cdn.elifesciences.org/articles/81150/elife-81150-fig1-figsupp9-data1-v2.pptx
-
Figure 1—figure supplement 9—source data 2
Oxygen evolution activity from Figure 1—figure supplement 9c in excel format.
- https://cdn.elifesciences.org/articles/81150/elife-81150-fig1-figsupp9-data2-v2.xlsx
Figure 2
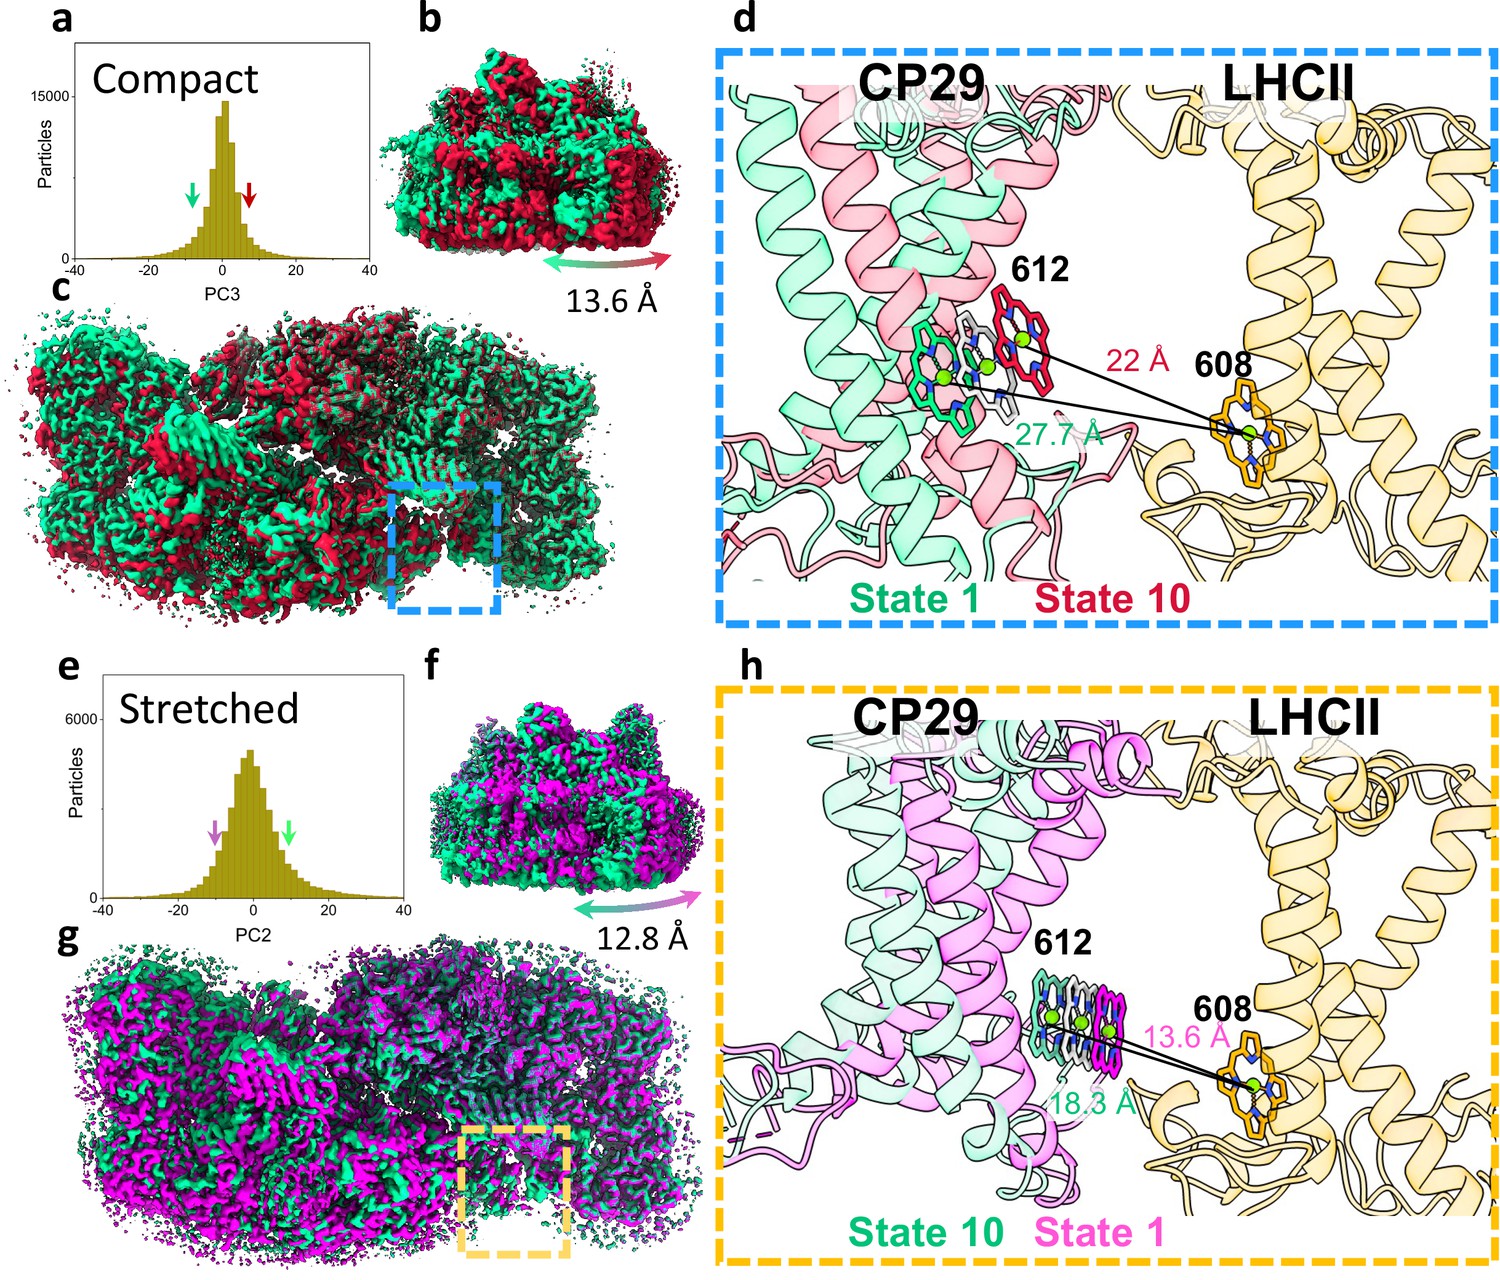
Heterogeneity within photosystem II (PSII) states.
(a) Continuous heterogeneity of C2S2COMP particles distribution along the third principal component (PC) axis. Each PC was divided into 10 states separated by 9% of the particle population along the PC axis. State 1 (corresponding to the position of the ninth percentile on the PC axis) is marked with a green arrow and state 10 (corresponding to the position of the 91st percentile on the PC axis) with a red arrow. States 1 and 10 are coloured in green and red in panels a–d. (b) To maximize the state differences on the left monomer, the maps were superposed along the region of the right PSII monomer. Membrane plane view of the shift in position of C2S2COMP in the third PC. (c) Luminal view of the shift in position of C2S2COMP. CP29 and light-harvesting complex II (LHCII) are marked with a blue rectangle (d) Zoom-in on the change in CP29 position between states 1 and 10. The change in distance between CP29 Chl 612 and LHCII M1 Chl 608 is shown. LHCII M1 (from the superposed PSII monomer) is coloured light orange, and the consensus position of Chl 612 is shown in grey. (e) Continuous heterogeneity of C2S2STR particles distribution in the second PC. State 1 is marked with a magenta arrow and state 10 with a teal arrow. Colours are maintained in panels e–h. (f) Membrane plane view of the shift in position of C2S2STR in the second PC. (g) Luminal view of the shift in position of C2S2STR. CP29 and LHCII are marked with an orange rectangle. (h) Zoom-in on the change in CP29 position between states 1 and 10. The change in distance between CP29 Chl 612 and LHCII M1 Chl 608 is shown. LHCII M1 is coloured orange, and the consensus position of Chl 612 is shown in grey.
Figure 3 with 2 supplements
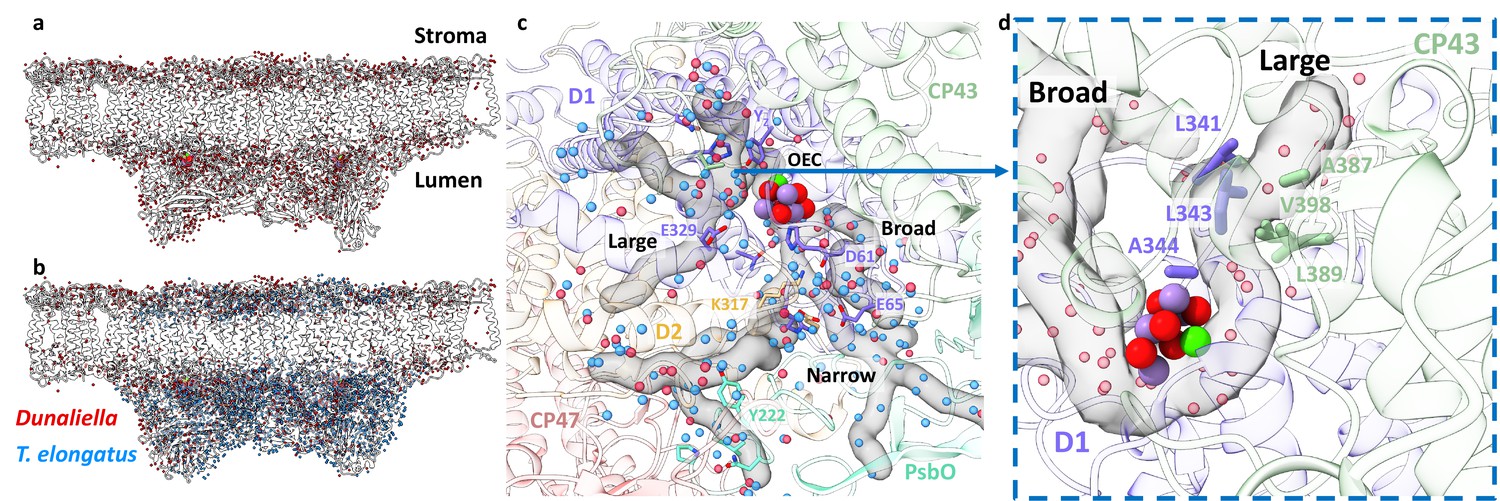
Water distribution and channels in eukaryotic photosystem II (PSII).
(a) Water molecules distribution in Dunaliella C2S2COMP structure. The protein scaffold is coloured grey, and water molecules are shown as red spheres. (b) Water molecules distribution in Dunaliella C2S2COMP compared to Thermosynechococcus elongatus. PSII core (PDBID 3WU2). T. elongatus water molecules are shown as blue spheres. (c) Dunaliella PSII water channels identified by CAVER analysis, shown as grey transparent maps. The Large, Narrow, and Broad channels are annotated along with selected amino acids coloured according to their respective subunits. Water molecules are presented as in panel b. (d) A hydrophobic patch identified in the large channel near the oxygen-evolving complex (OEC), which may serve as an O2 release pathway. The region shown is indicated by the blue arrow, but the orientation is different to improve visualisation.
Figure 3—figure supplement 1
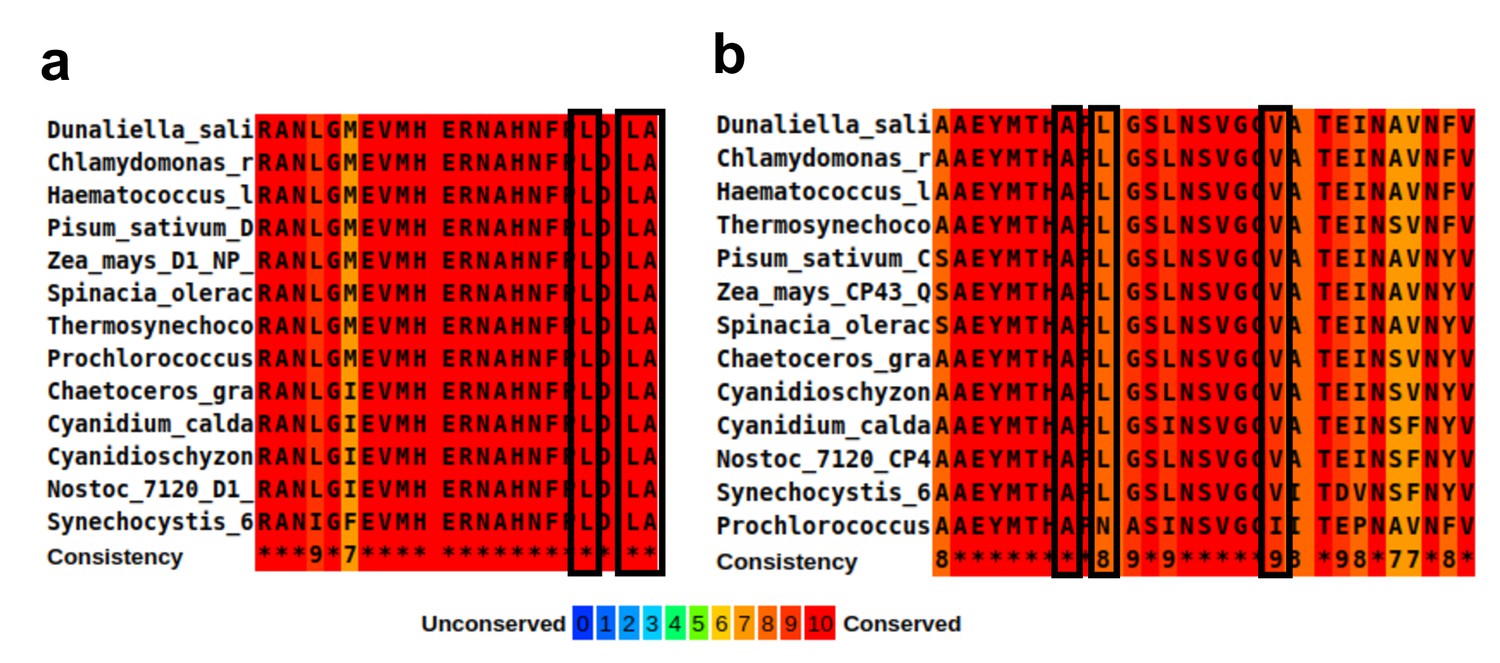
Sequence alignment of the hydrophobic residues lining the large channel cavity near oxygen-evolving complex (OEC).
(a) Alignment of D1 C-terminus domain, residues 323–344. The hydrophobic residues are marked with black rectangles, together with their conservation score. The organisms used for alignment in panels a and b are Synechocystis sp. PCC 6803, Thermosynechococcus elongatus, Nostoc sp. PCC 7120, Prochlorococcus marinus, Cyanidium caldarium, Cyanidischyzon merolae, Chaetoceros gracilis, Dunaliella salina, Chlamydomonas reinhardtii, Haematococcus lacustris, Pisum sativum, Zea mays, and Spinacia oleracea. (b) Alignment of CP43 residues 380–408. The hydrophobic residues are marked with black rectangles, together with their conservation score.
Figure 3—figure supplement 2
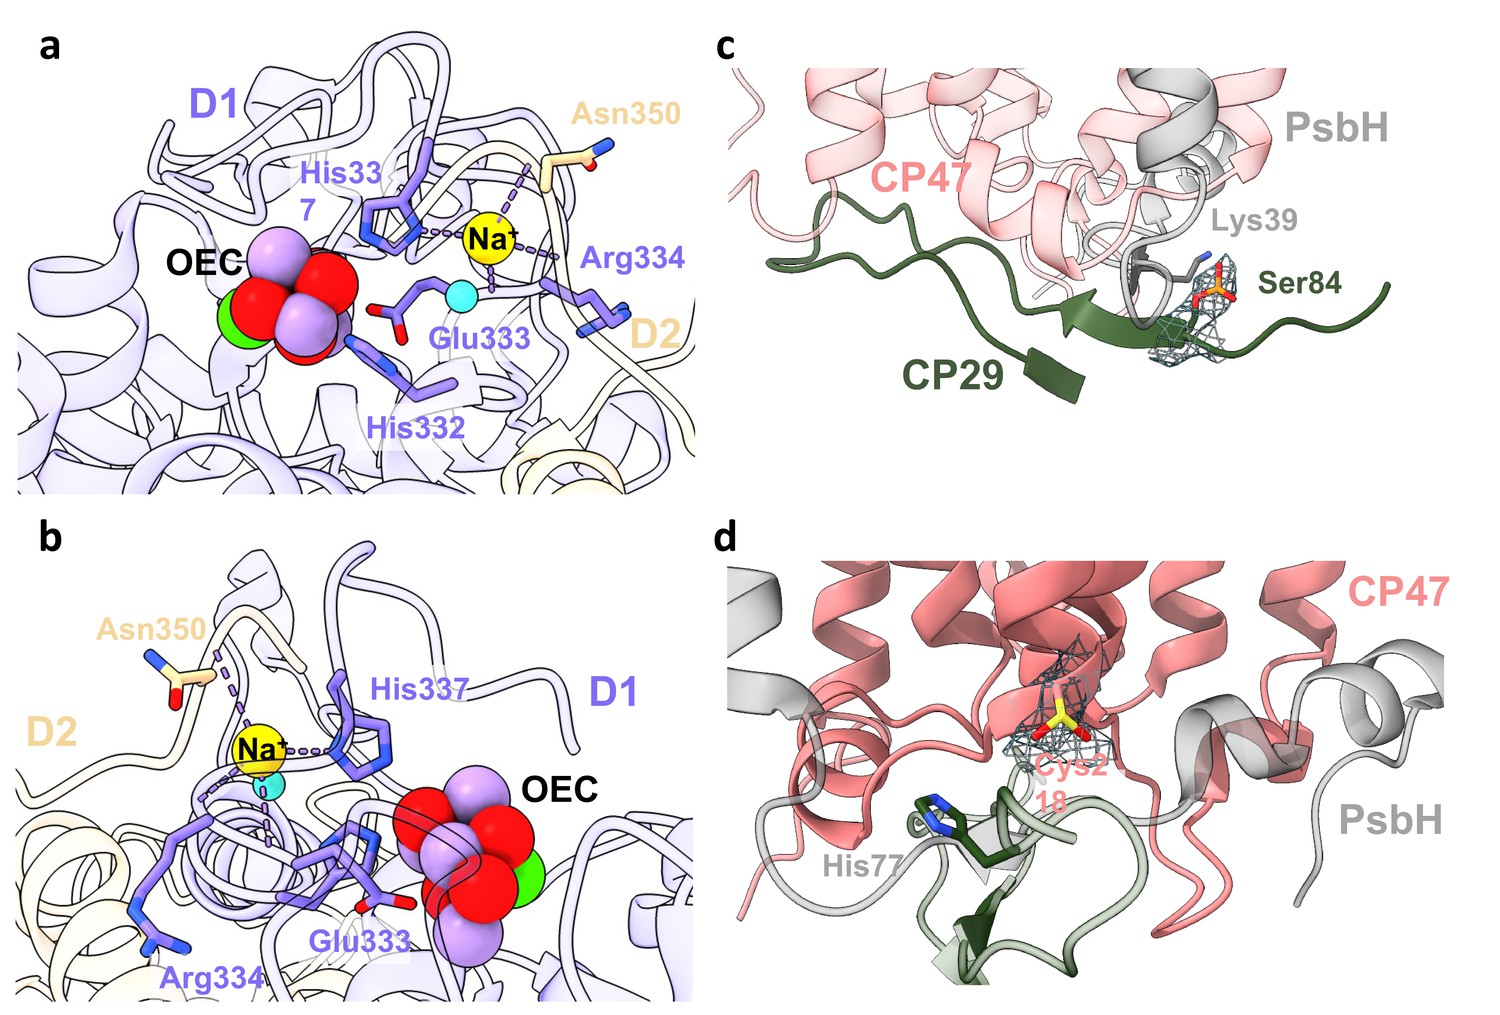
Na+ ion and post-translational modifications (PTMs) in Dunaliella photosystem II (PSII).
(a) Na+ binding site close to the oxygen-evolving complex (OEC). The Na+ ion is coordinated by D1 histidine 337, the backbone carbonyls of D1 glutamic acid 333, arginine 334, D2 asparagine 350, and a water molecule. Amino acids are coloured according to their respective subunits, water molecule as a turquoise sphere, and the OEC coloured red, purple, and green. (b) Rotated view of Na+ binding site. (c) CP29 phosphorylated serine 84 and adjacent subunits at the stromal interface. Map surrounding the phosphorylated serine is shown at 3.5σ contour. PsbH lysine 39 coordinating the phosphate is coloured grey, CP29 N-terminal region in dark-green, and CP47 in coral. (d) CP47 sulfinylated cysteine 218 at the stromal region, along with map density at 4σ contour. PsbH histidine 77 coloured grey and CP47 in coral.
Figure 4 with 5 supplements
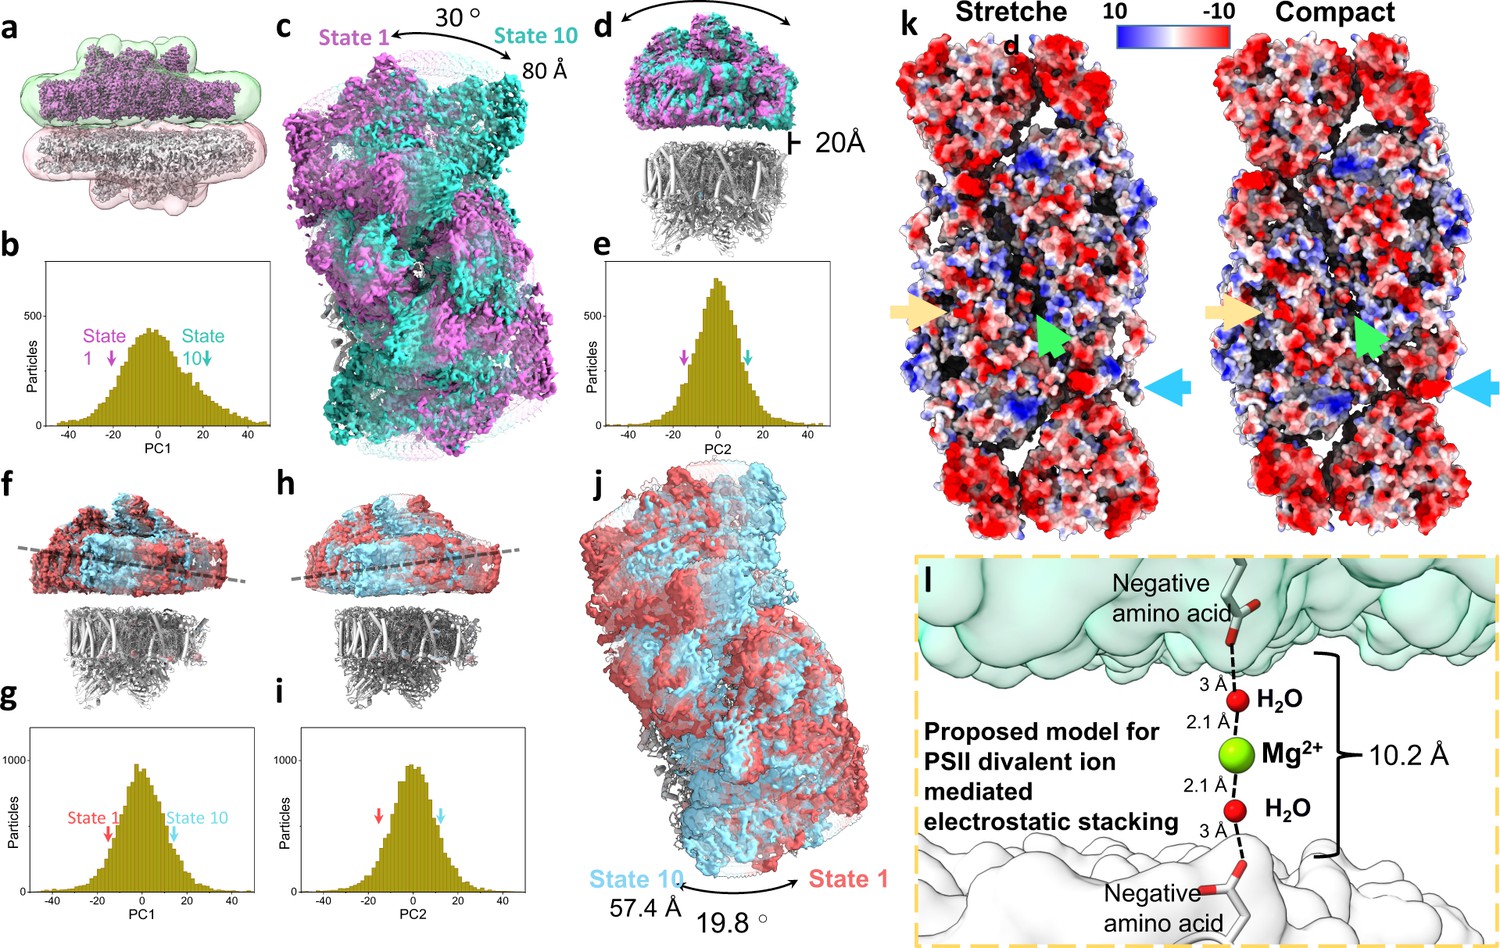
Heterogeneity, electrostatic interactions, and model for photosystem II (PSII) stacking.
(a) Stacked Dunaliella PSII C2S2COMP maps, and the masks used for multibody refinement. Maps are coloured magenta and grey and masks in green and red. (b) The particle distribution along the first principal component (PC) shows continuous heterogeneity in the stacked C2S2COMP. State 1 is marked with a magenta arrow and state 10 with a teal arrow (colours are preserved in panels b–e). (c) Luminal view of the rotation of the upper PSII dimer between state 1 and state 10 (the bottom dimer was kept in a fixed position). (d) Membrane plane view of the shift in position of the upper PSII dimer in C2S2COMP second PC. The distance between the upper and lower PSII is shown. (e) Particle distribution along the second PC of the stacked C2S2COMP shows continuous heterogeneity. (f) Membrane plane view of the tilt in the upper PSII dimer in C2S2STR particle set first PC. The direction of the tilt is marked with a dashed line. State 1 is coloured red and state 10 in cyan (colours are preserved in panels f–j). (g) Continuous heterogeneity in the stacked C2S2STR particles distribution along the first PC. (h) Membrane plane view of the tilt in orientation of the upper PSII dimer in C2S2STR second PC (with the bottom dimer kept fixed). The dashed line shows the tilt axis is opposite to that shown in panel f. (i) Continuous heterogeneity of stacked C2S2STR particles distribution in the second PC. (j) Luminal view of the rotation of the upper PSII dimer between state 1 and state 10. (k) Coulombic electrostatic potential of the stromal region of the stretched (left) and compact (right) conformations. Differences are marked for CP47 C-terminus (orange arrow), the intermonomer space (green arrow) and CP29 (blue arrow). The negative potentials (0 kBT/e > Φ > –10 kBT/e) are coloured red, and the positive potentials (0 kBT/e < Φ<10 kBT/e) are coloured blue. (l) Proposed hypothetical model for PSII stacking mediated by negatively charged amino acids and Mg2+ ions (density for Mg2+ ions is not observed in our map). Upper PSII shown as a green surface and the lower PSII as a white surface.
Figure 4—figure supplement 1

Principal component (PC) analysis of stacked C2S2COMP.
(a) Percent of the variance explained by each of the 12 PCs. (b) The particle distribution along the first six PCs shows continuous heterogeneity in the C2S2COMP. States 1 and 10 are marked with a magenta and teal arrow, respectively. (c) Membrane plane view along the long axis (top), the short axis (middle), and luminal view (bottom) show the shift in position of stacked C2S2COMP in the first PC. (d) Membrane plane view along the long axis (top), the short axis (middle), and luminal view (bottom) show the shift in position of stacked C2S2COMP in the second PC. (e) Membrane plane view along the long axis (top), the short axis (middle), and luminal view (bottom) show the shift in position of stacked C2S2COMP in the third PC.
Figure 4—figure supplement 2
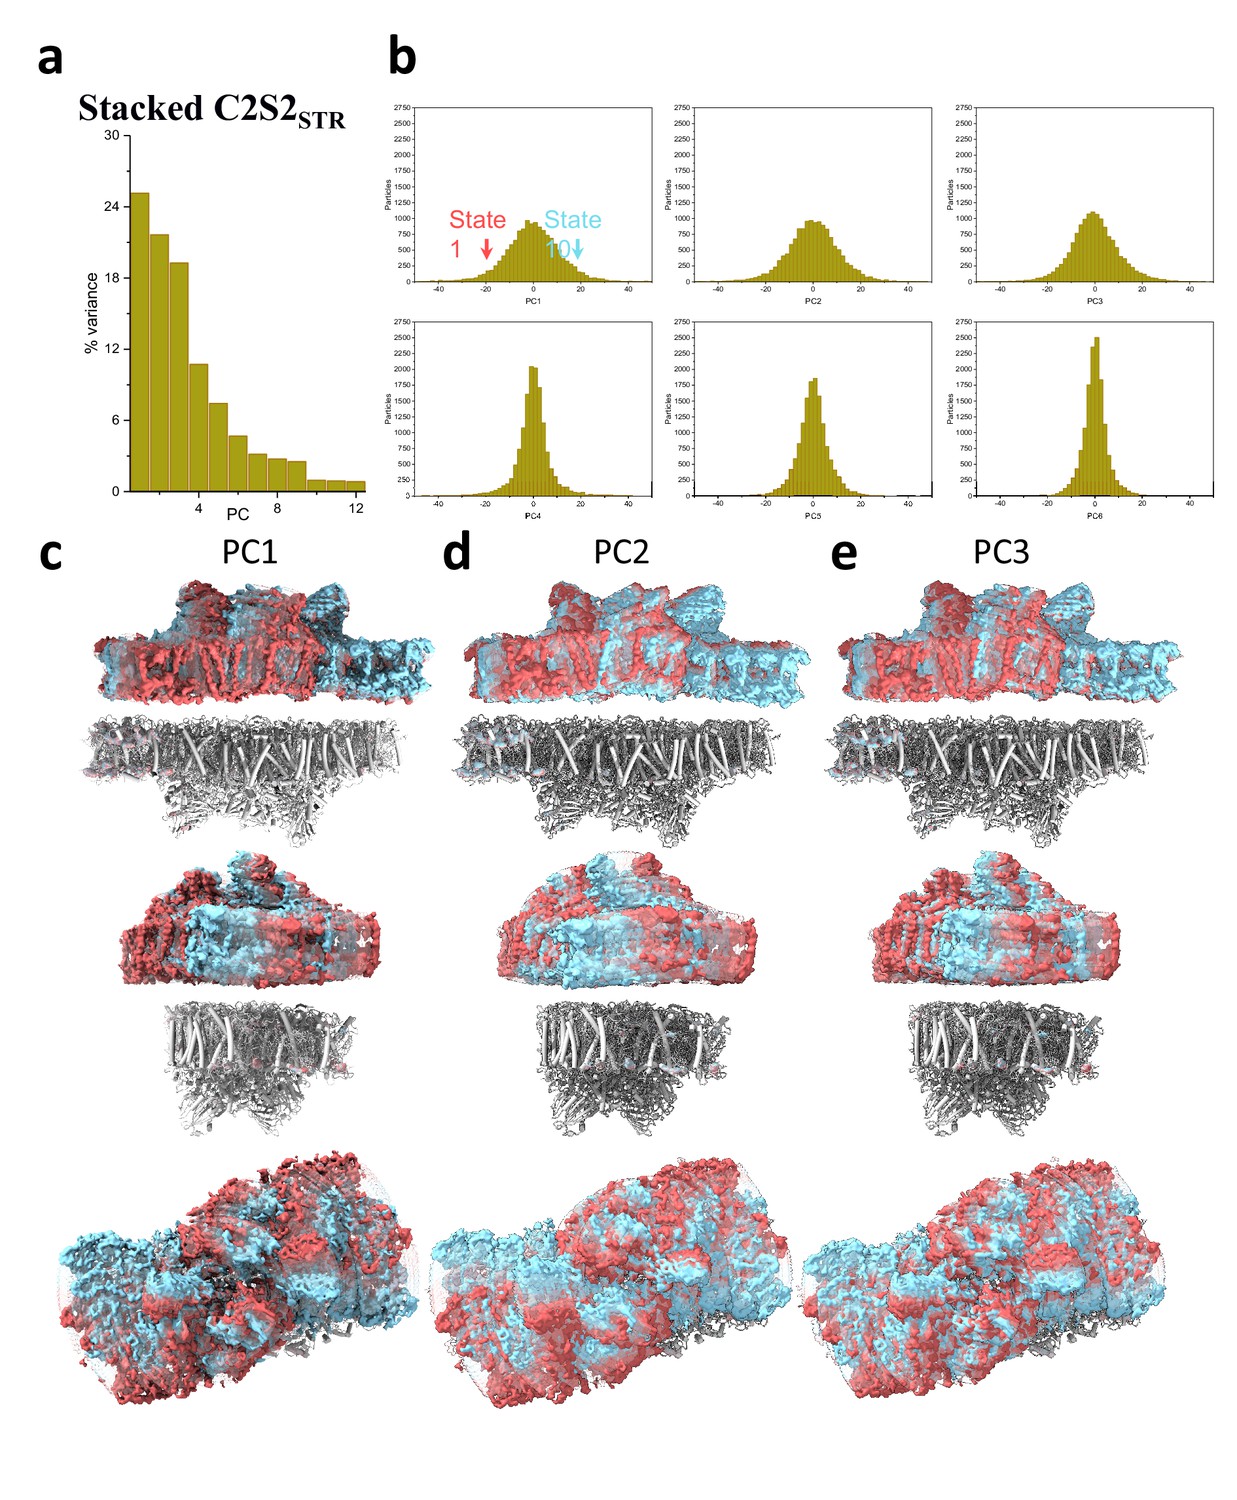
Principal component (PC) analysis of stacked C2S2STR.
(a) Percent of the variance explained by each of the 12 PCs. (b) The particle distribution along the first six PCs shows continuous heterogeneity in the C2S2STR. States 1 and 10 are marked with a red and cyan arrow, respectively. (c) Membrane plane view along the long axis (top), the short axis (middle), and luminal view (bottom) show the shift in position of stacked C2S2STR in the first PC. (d) Membrane plane view along the long axis (top), the short axis (middle), and luminal view (bottom) show the shift in position of stacked C2S2STR in the second PC. (e) Membrane plane view along the long axis (top), the short axis (middle), and luminal view (bottom) show the shift in position of stacked C2S2STR in the third PC.
Figure 4—figure supplement 3
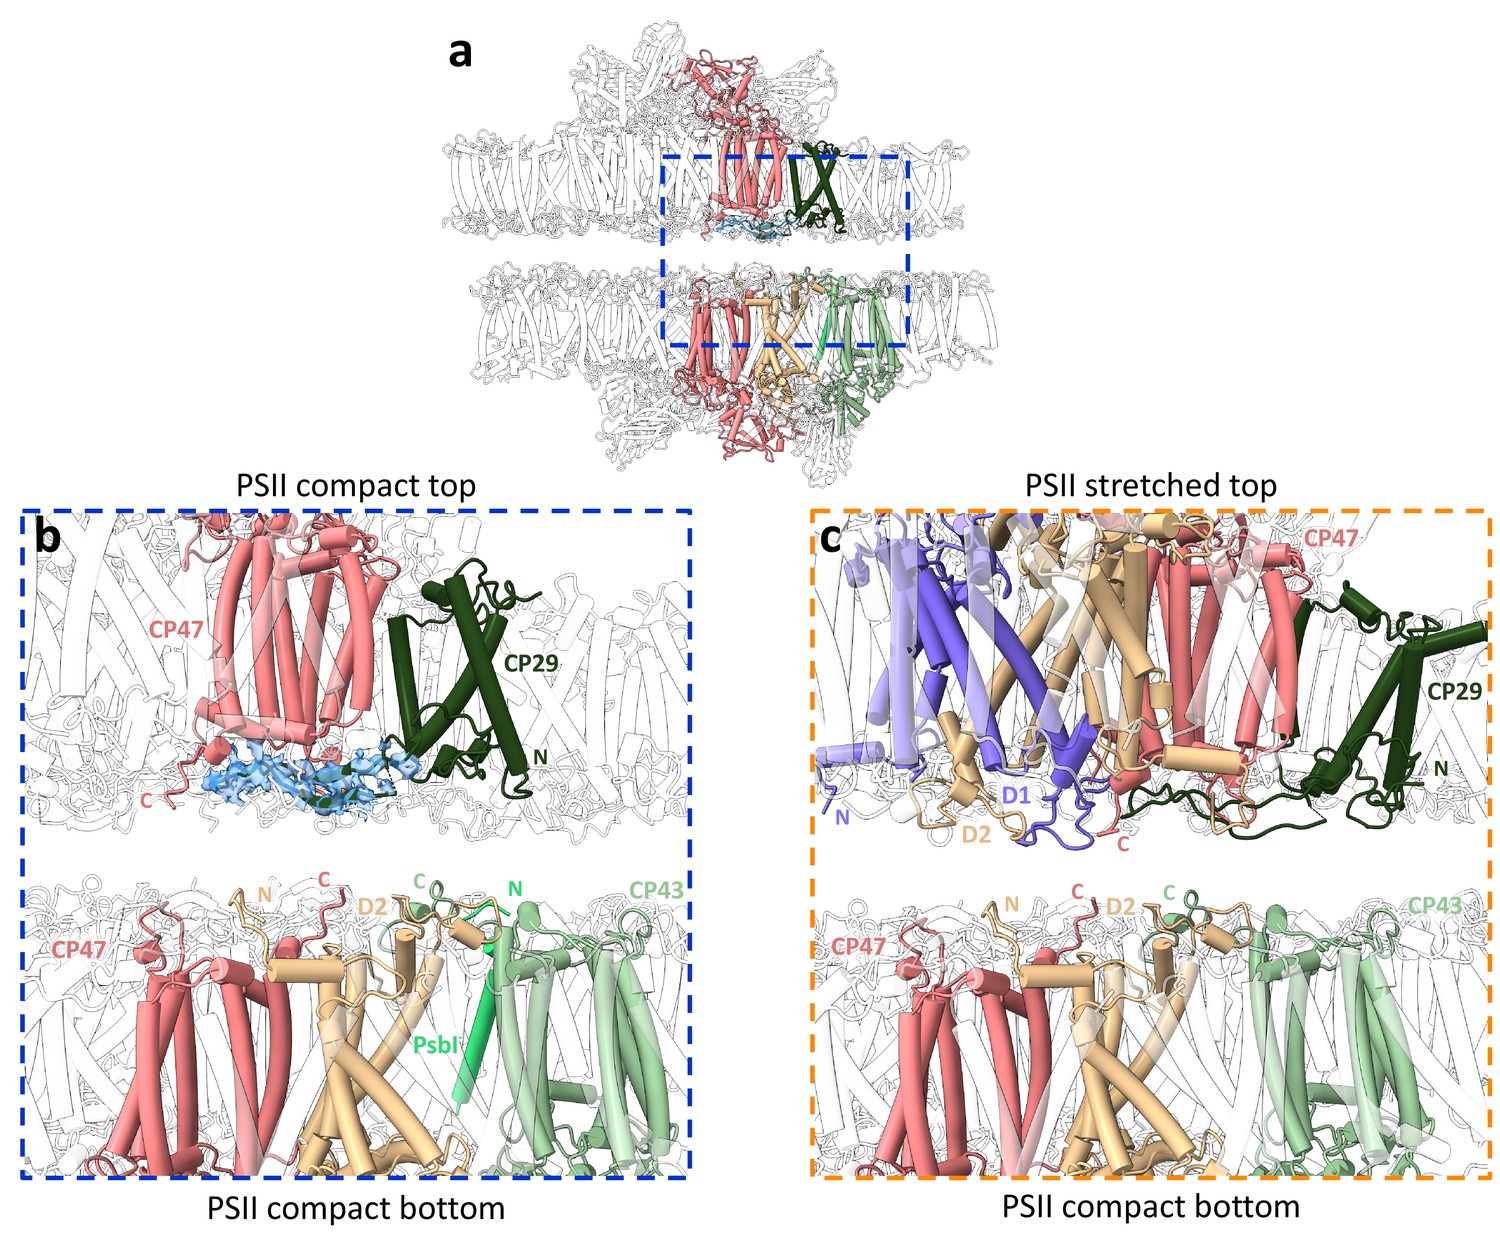
Stromal interactions between photosystem II (PSII) subunits in the stacked configurations.
(a) Structure of stacked Dunaliella C2S2COMP showing a shift in position of each PSII dimer. The region where PSII core subunits are nearest is marked with a blue rectangle. (b) Zoom-in on the stromal interactions between PSIICOMP dimers, displaying close subunits from both dimers. The map density near CP29 is shown at 2σ, coloured in transparent blue. Subunits are colour coded, and the C- and N-termini are marked as C and N, respectively. (c) Zoom-in on the stromal interactions between PSIISTR dimers, displaying close subunits from both dimers.
Figure 4—figure supplement 4
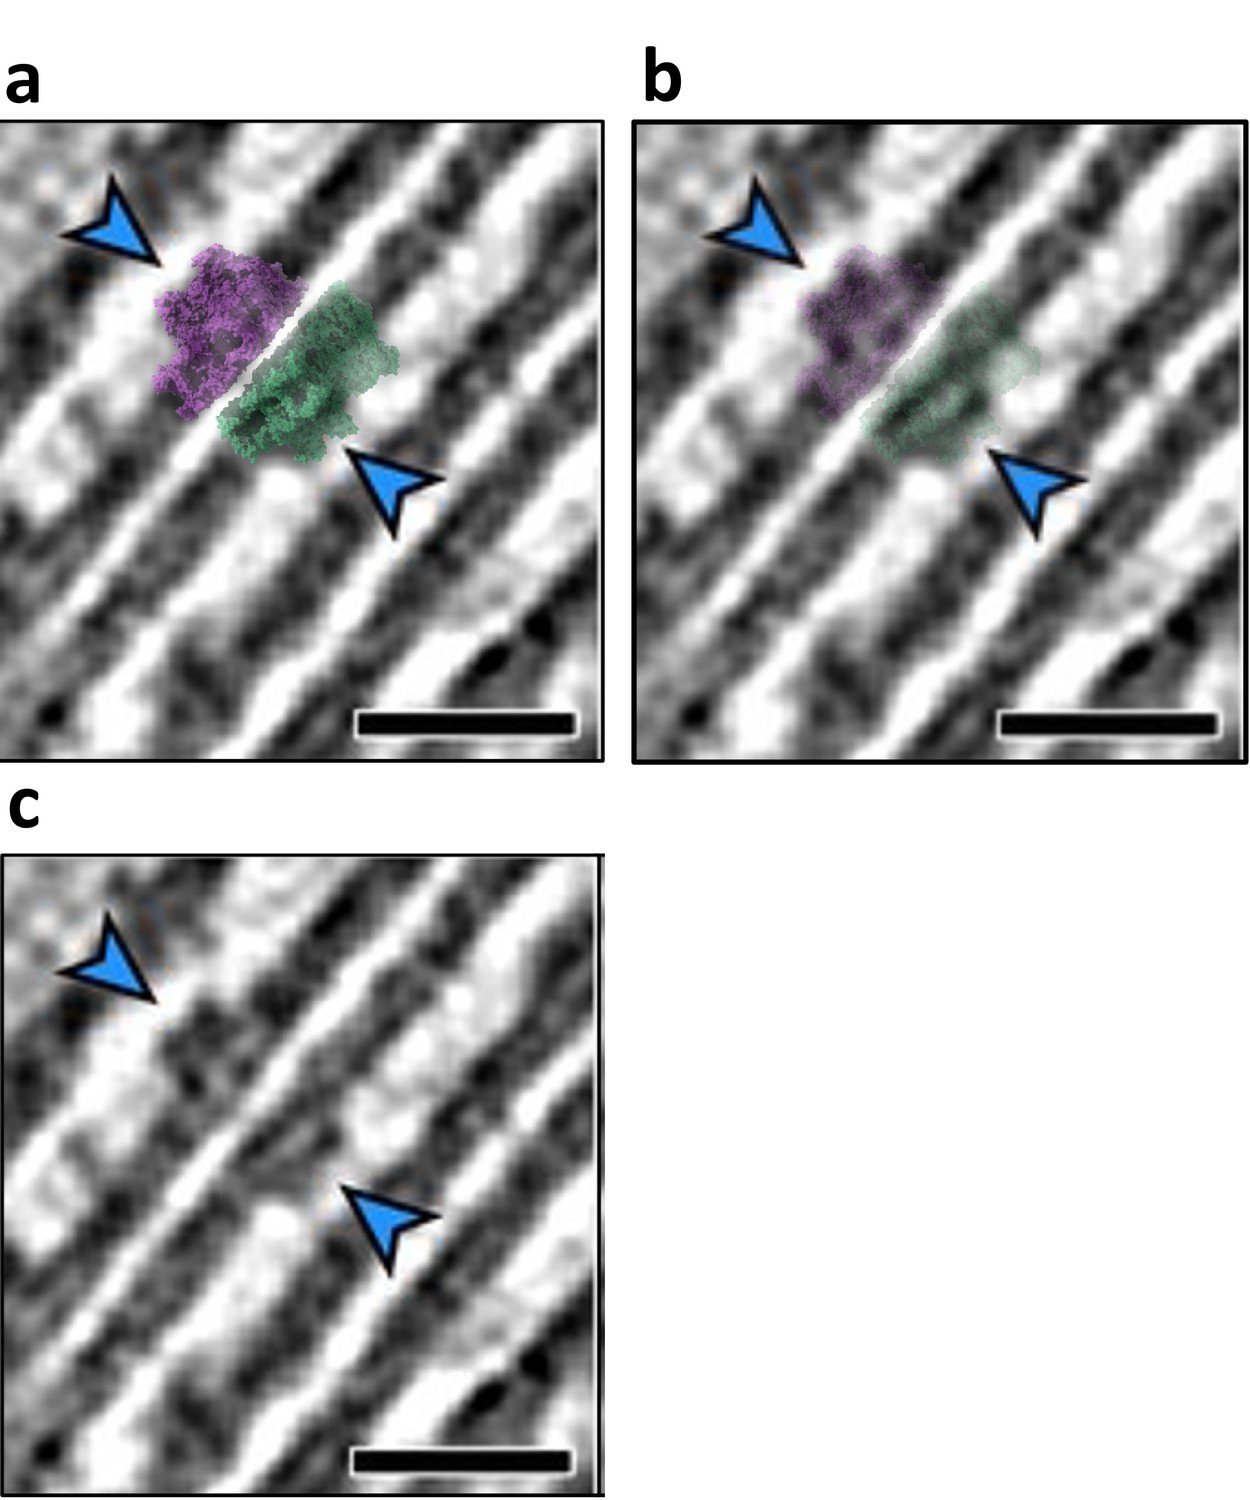
Similar membrane separation in purified and in-vivo detected stacked photosystem II (PSII) complexes.
Panels a, b, and c show Figure 1D from Wietrzynski et al. showing appressed thylakoid membranes in a native state. The stacked PSII dimer (PDBID 7PIN) was back-projected onto the tomogram and is shown at two different transparencies (a and b). Panel c is the original, unmodified figure. Scale bar 20 nm.
Figure 4—figure supplement 5

Light-harvesting complex (LHC) interactions limit stacked photosystem II (PSII) rotation.
(a) In stacked C2S2COMP (right), the rotation is confined by LHCII M3 in state 1 (magenta) and 10 (teal). In both conformations, the rotation extends from LHCII M2 (state 1) to CP26 (state 10), shown in light grey. (b) Differences in the extent of PSII rotation are affected by LHC stromal loops. The stacked C2S2STR (left) state 10 (cyan) is tilted compared to the initial position of state 1 (red), bringing the top dimer closer to the lower dimer, resulting in a shorter range of rotations from CP26 in state 1 to LHCII M2 in state 10.
Videos
Video 1
Different conformations of Dunaliella C2S2 photosystem II (PSII).
Morph showing the transition from the stretched (magenta) to the compact (green) conformation from a luminal view.
Video 2
Different conformations of Dunaliella C2S2 photosystem II (PSII).
Morph showing the transition from the stretched (magenta) to the compact (green) conformation from a membrane plane view.
Video 3
Continuous heterogeneity in C2S2COMP PC1.
Transition between all states in C2S2COMP (green) PC1 from a luminal view, showing photosystem II (PSII) monomers change in location and orientation along the intermonomer space.
Video 4
Continuous heterogeneity in C2S2COMP PC3.
Transition between all states in C2S2COMP (green) PC3 from a membrane plane view, showing photosystem II (PSII) monomers change in location and orientation along the membrane plane.
Video 5
Continuous heterogeneity in C2S2STR PC1.
Transition between all states in C2S2STR (magenta) PC1 from a luminal view, showing photosystem II (PSII) monomers change in location and orientation along the intermonomer space.
Video 6
Continuous heterogeneity in C2S2STR PC2.
Transition between all states in C2S2STR (magenta) PC2 from a membrane plane view, showing photosystem II (PSII) monomers change in location and orientation along the membrane plane.
Video 7
Continuous heterogeneity in stacked C2S2COMP PC1.
Transition between all states in stacked C2S2COMP (orchid) PC1 from a luminal view, showing the rotation of the upper photosystem II (PSII) dimer compared to the lower dimer.
Video 8
Continuous heterogeneity in stacked C2S2COMP PC2.
Transition between all states in stacked C2S2COMP (orchid) PC2 from a membrane plane view, showing upper photosystem II (PSII) dimer tilting to and from the lower dimer.
Video 9
Continuous heterogeneity in stacked C2S2STR PC1.
Transition between all states in stacked C2S2STR (red) PC1 from a luminal view, showing the rotation of the upper photosystem II (PSII) dimer compared to the lower dimer.
Video 10
Continuous heterogeneity in stacked C2S2STR PC2.
Transition between all states in stacked C2S2STR (red) PC2 from a membrane plane view, showing upper photosystem II (PSII) dimer tilting to and from the lower dimer.
Additional files
-
Supplementary file 1
Cryo-EM data collection, refinement, and validation statistics.
- https://cdn.elifesciences.org/articles/81150/elife-81150-supp1-v2.docx
-
Supplementary file 2
CP29 chlorophyll composition determined in previous work.
- https://cdn.elifesciences.org/articles/81150/elife-81150-supp2-v2.docx
-
Supplementary file 3
Changes in location of CP29 chlorophylls in the compact and stretched conformations principal components (PCs).
Shift in chlorophyll position between states 1 and 10 in the first three PCs of the compact (Comp) and stretched (Str) unstacked PSII. Distances are in Å. The average shift and SD are presented for each component.
- https://cdn.elifesciences.org/articles/81150/elife-81150-supp3-v2.docx
-
MDAR checklist
- https://cdn.elifesciences.org/articles/81150/elife-81150-mdarchecklist1-v2.docx
Download links
A two-part list of links to download the article, or parts of the article, in various formats.
Downloads (link to download the article as PDF)
Open citations (links to open the citations from this article in various online reference manager services)
Cite this article (links to download the citations from this article in formats compatible with various reference manager tools)
Structure of Dunaliella photosystem II reveals conformational flexibility of stacked and unstacked supercomplexes
eLife 12:e81150.
https://doi.org/10.7554/eLife.81150


