Transcriptional profiling of Hutchinson-Gilford Progeria syndrome fibroblasts reveals deficits in mesenchymal stem cell commitment to differentiation related to early events in endochondral ossification
- Department of Biochemistry & Cellular and Molecular Biology, University of Tennessee at Knoxville, United States
- UT-ORNL Graduate School of Genome Science and Technology, University of Tennessee at Knoxville, United States
- Department of Pathology, University of Texas Southwestern Medical Center, United States
Figures
Figure 1 with 1 supplement
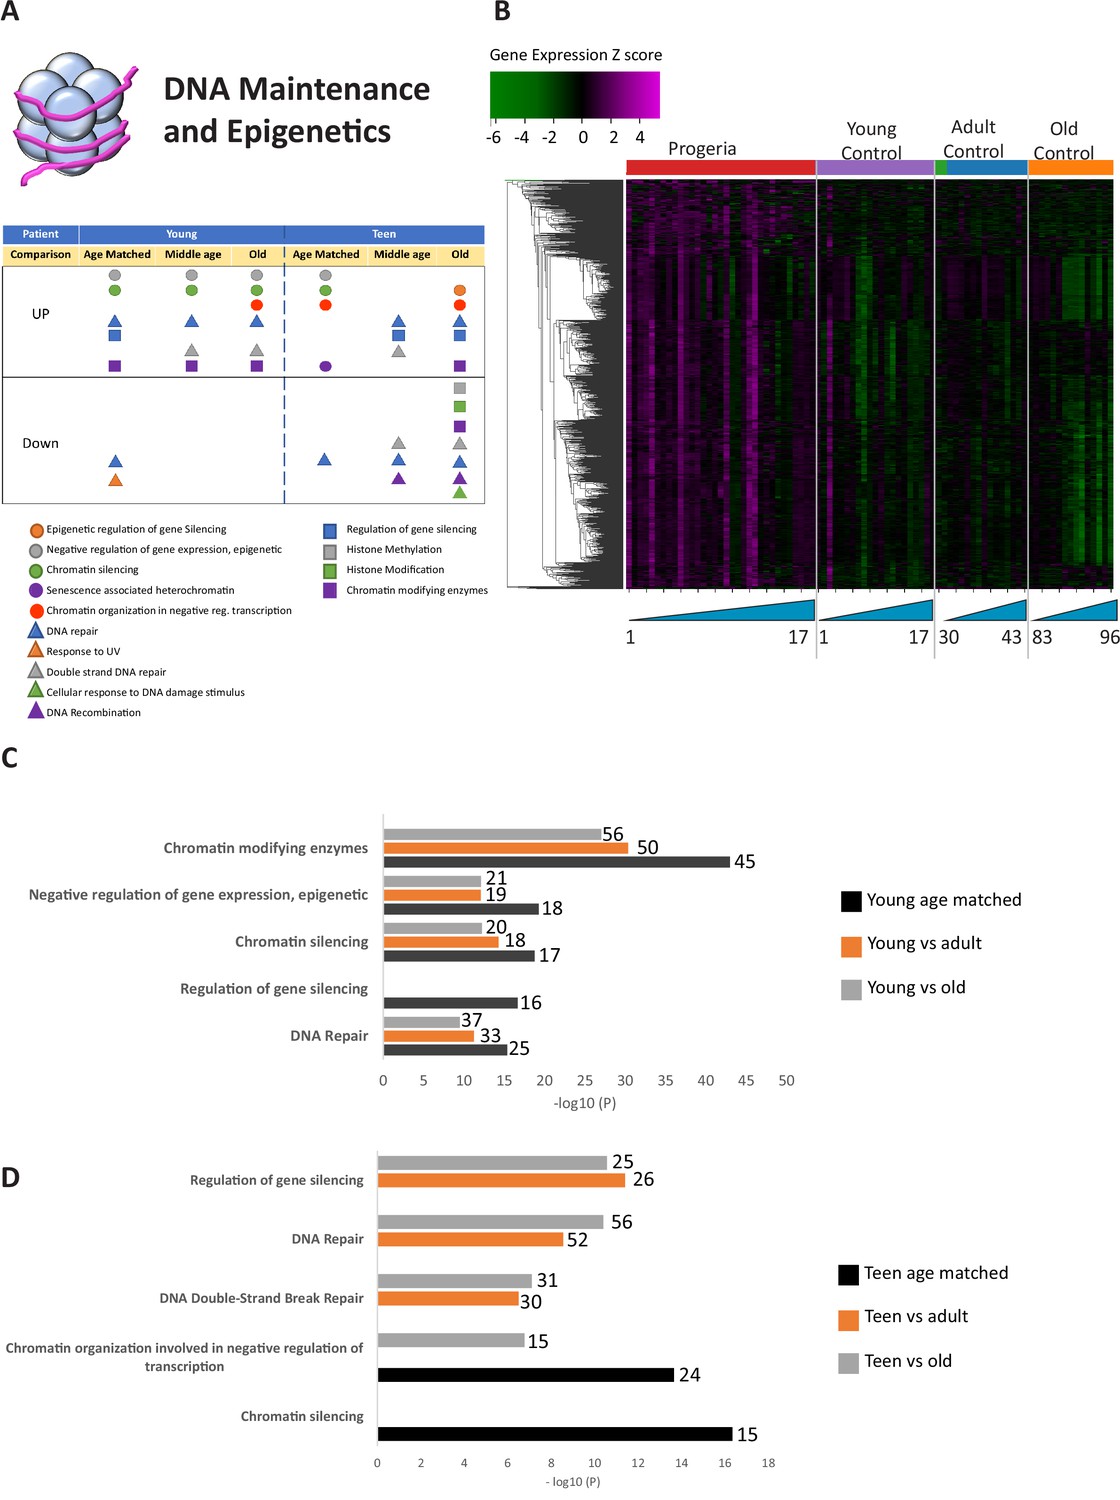
Transcriptional misregulation in the DNA Maintainance and Epigenetics functional categories.
(A) Summary table of processes related to DNA maintenance and epigenetics, represented as transcriptional up or downregulation based on RNA-seq of young/teenager progeria patient derived fibroblasts compared to age matched, middle age or old control patients. (B) Heat map of RNA-seq transcriptome analysis for 976 selected genes related to DNA maintenance and epigenetics. The heat map shows per-gene z-score computed from batch effect corrected log2 read count values, genes in rows and 29 patient samples (progeria and young/adult/old control) organized in columns. Genes were hierarchically clustered based on Euclidean distance and average linkage. Within each cohort, columns are organized by patient age. (C) Comparison of young progeria patients versus middle age or old donor control fibroblasts. Enriched ontology clusters for upregulated genes related DNA maintenance and epigenetics, as characterized by Metascape analysis. Metascape reports p-values calculated based on the hypergeometric distribution. (D) Comparison of teen-aged progeria patient fibroblast versus old donor control fibroblasts. Enriched ontology clusters for up regulated genes related to DNA maintenance and epigenetics, as characterized by Metascape analysis.
-
Figure 1—source data 1
RNA-seq results: normalized and batch corrected sequencing counts for all samples in this study.
- https://cdn.elifesciences.org/articles/81290/elife-81290-fig1-data1-v2.csv
Figure 1—figure supplement 1
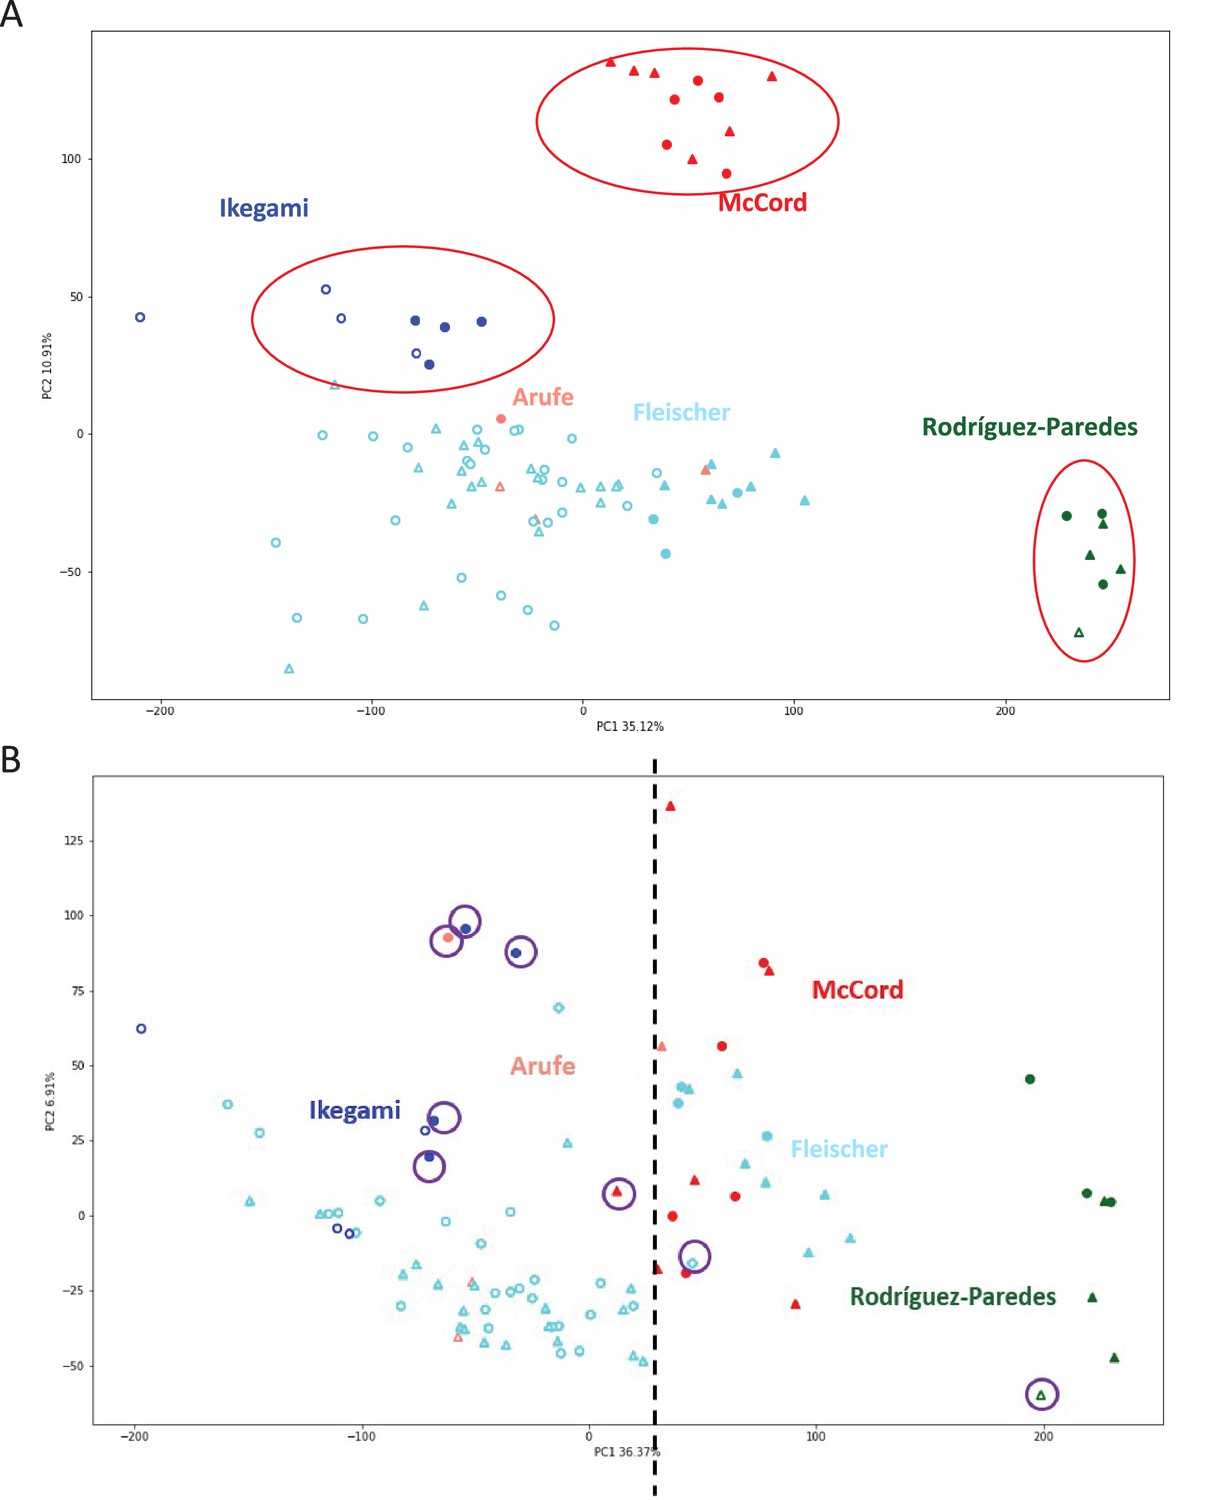
Batch clustering correction.
(A) Principal component analysis (PCA) of the datasets used in this study before batch correction. Samples segregate primarily by lab of origin (red circles). Solid color markers: Progeria, hollow markers: normal controls, triangles: female, circles: male. (B) PCA after batch correction. Samples primarily segregate by progeria/control phenotype. Dotted line denotes an arbitrary margin between cohorts. Solid color markers: Progeria, hollow markers: normal controls, triangles: female, circles: male. Purple circles denote patients that are mismatched from the rest of their respective groups.
Figure 2
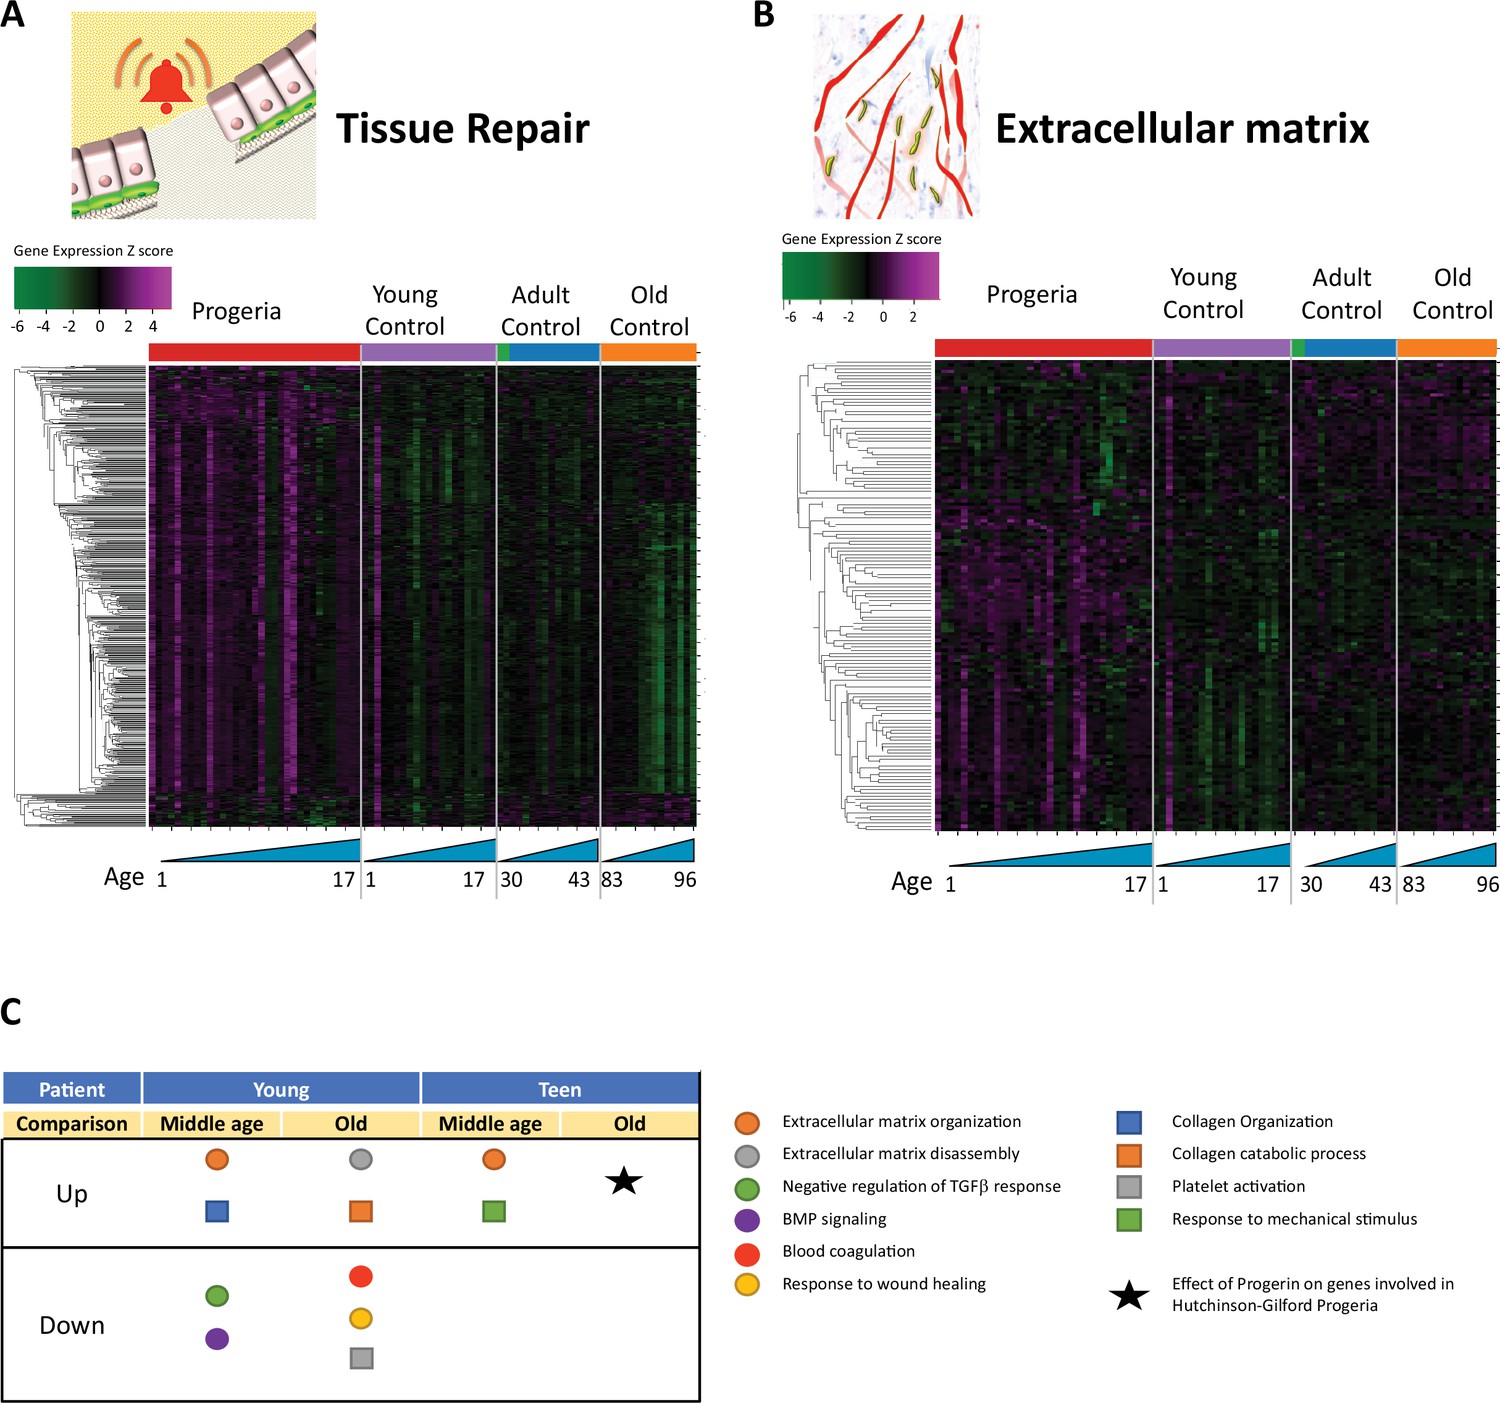
Transcriptional misregulation in tissue repair and extracellular matrix functional categories.
(A) Heat map of RNA-seq transcriptome analysis for 585 selected genes related to repair. Data presented as in Figure 1B. (B) Heat map of RNA-seq transcriptome analysis for 145 selected genes related to extra cellular matrix. Data presented as in Figure 1B. (C) Summary table of processes related to repair and extra cellular matrix organization, represented as up or downregulation in transcription based on RNA-seq of young/teenager progeria patient derived fibroblasts, compared to middle age or old control patients. Age comparisons that yielded no significant results in relevant categories are not shown.
Figure 3

Transcriptional misregulation for genes related to bone development.
(A) Summary table of processes related to bone and cartilage development and homeostasis represented as up or downregulated transcription based on RNA-seq of young progeria patient derived fibroblasts compared to age matched, middle age or old control patients. (B) Heat map of RNA-seq transcriptome analysis for 165 selected genes related to bone and cartilage development. Data presented as in Figure 1B. (C) Comparison of young progeria patients versus old donor control fibroblasts. Enriched ontology clusters for upregulated genes related bone and cartilage development and homeostasis, as characterized by Metascape analysis. (D) Comparison of young progeria patients versus old donor control fibroblasts. Enriched ontology clusters for downregulated genes related to cation homeostasis, as characterized by Metascape analysis. (E) Comparison of young progeria patients versus middle age control fibroblasts. Enriched ontology clusters for downregulated genes related to bone development and homeostasis, as characterized by Metascape analysis.
-
Figure 3—source data 1
Gene expression analysis (Z-scores) for 164 genes related to bone development.
- https://cdn.elifesciences.org/articles/81290/elife-81290-fig3-data1-v2.csv
Figure 4

Transcriptional missregulation in genes related to adipose tissue function and development.
(A) Summary table of processes related to fat cell differentiation and lipid metabolism, represented as up or downregulation in transcription based on RNA-seq of young/teenager progeria patient derived fibroblasts, compared to age matched, middle age, or old control patients. (B) Heat map of RNA-seq transcriptome analysis for 134 selected genes related to fat cell differentiation and lipid metabolism. Data presented as in Figure 1B. (C) Comparison of young progeria patients versus middle age or old donor control fibroblasts. Enriched ontology clusters for upregulated genes related to fat and lipid metabolism, as characterized by Metascape analysis.
Figure 5
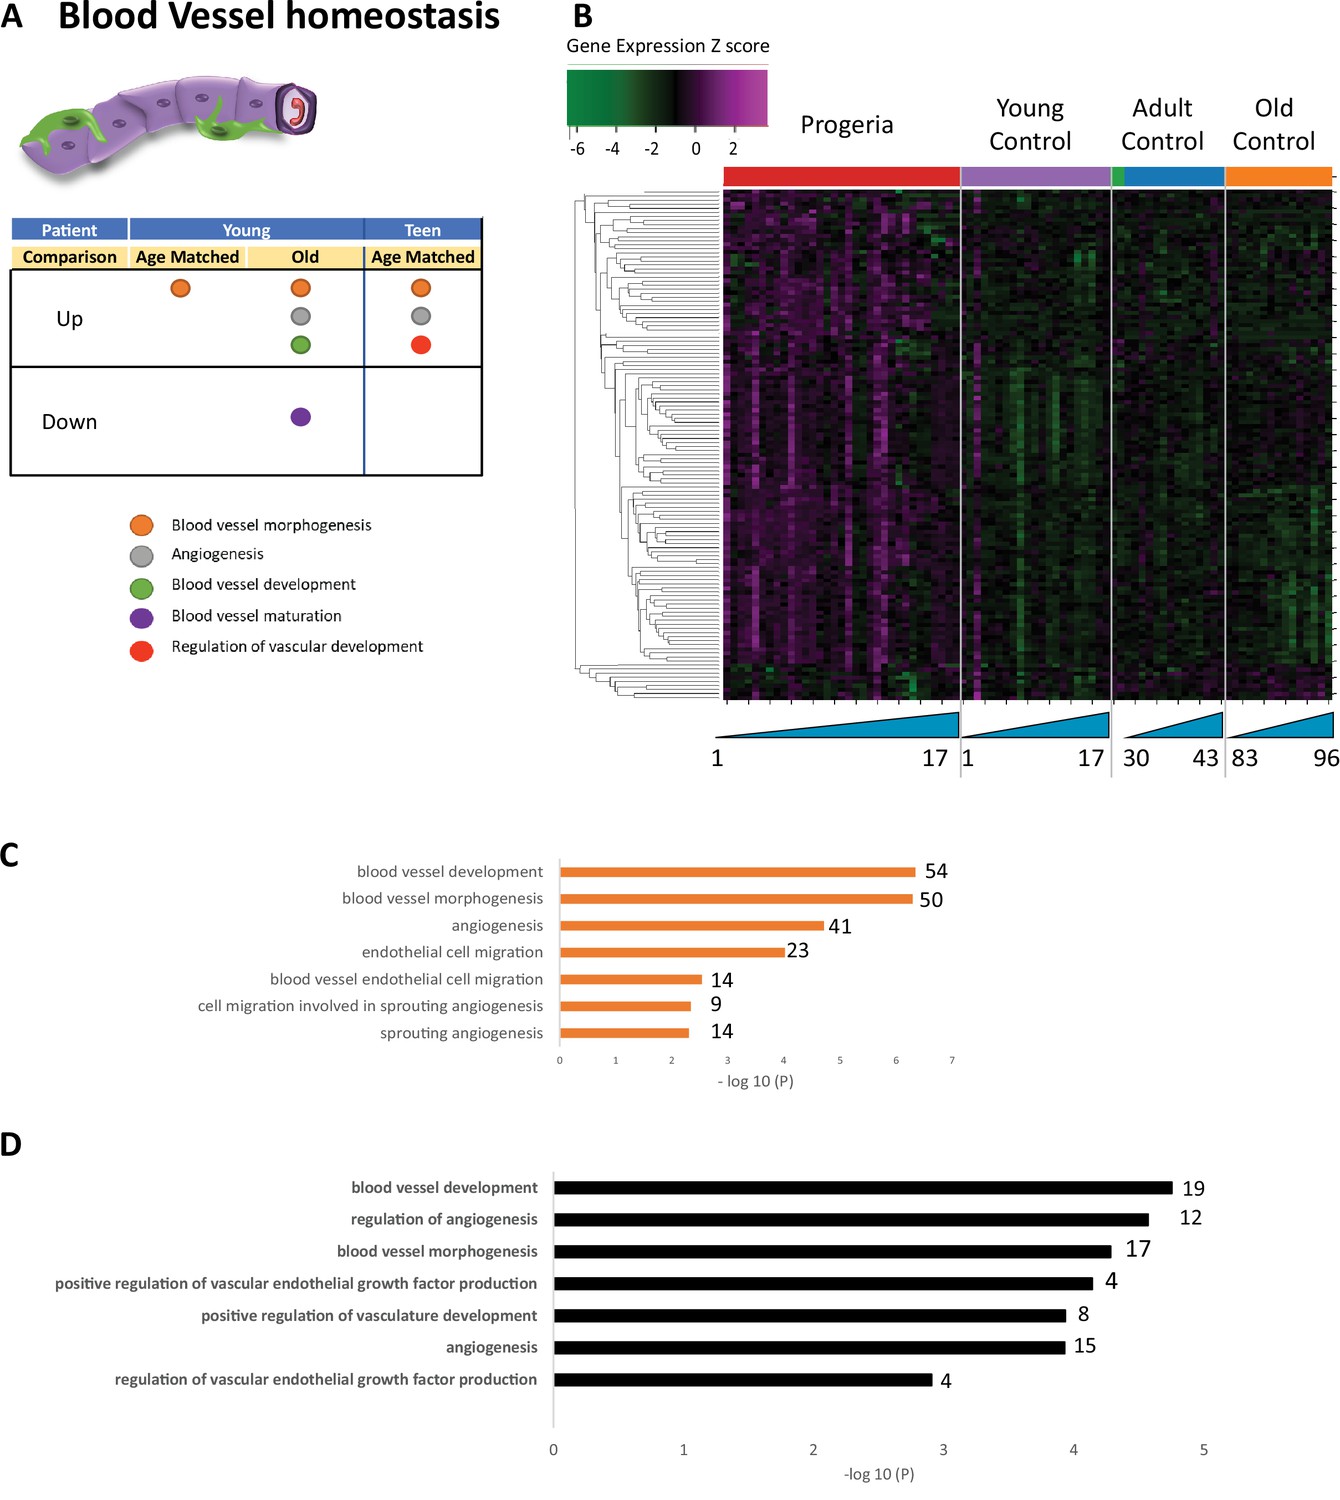
Transcriptional missregulation in genes related to blood vessel homeostasis.
(A) Summary table of processes related to blood vessel homeostasis, represented as up or downregulation in transcription based on RNA-seq of young/teenager progeria patient derived fibroblasts, compared to age matched, middle age, or old control patients. (B) Heat map of RNA-seq transcriptome analysis for 131 selected genes related to blood vessel homeostasis. Data presented as in Figure 1B. (C) Comparison of young progeria patients versus middle-aged donor control fibroblasts. Enriched ontology clusters for upregulated genes related to blood vessel development, as characterized by Metascape analysis. (D) Comparison of teen-aged progeria patient fibroblast versus age-matched control fibroblasts. Enriched ontology clusters for upregulated genes related to blood vessel development, as characterized by Metascape analysis.
Figure 6
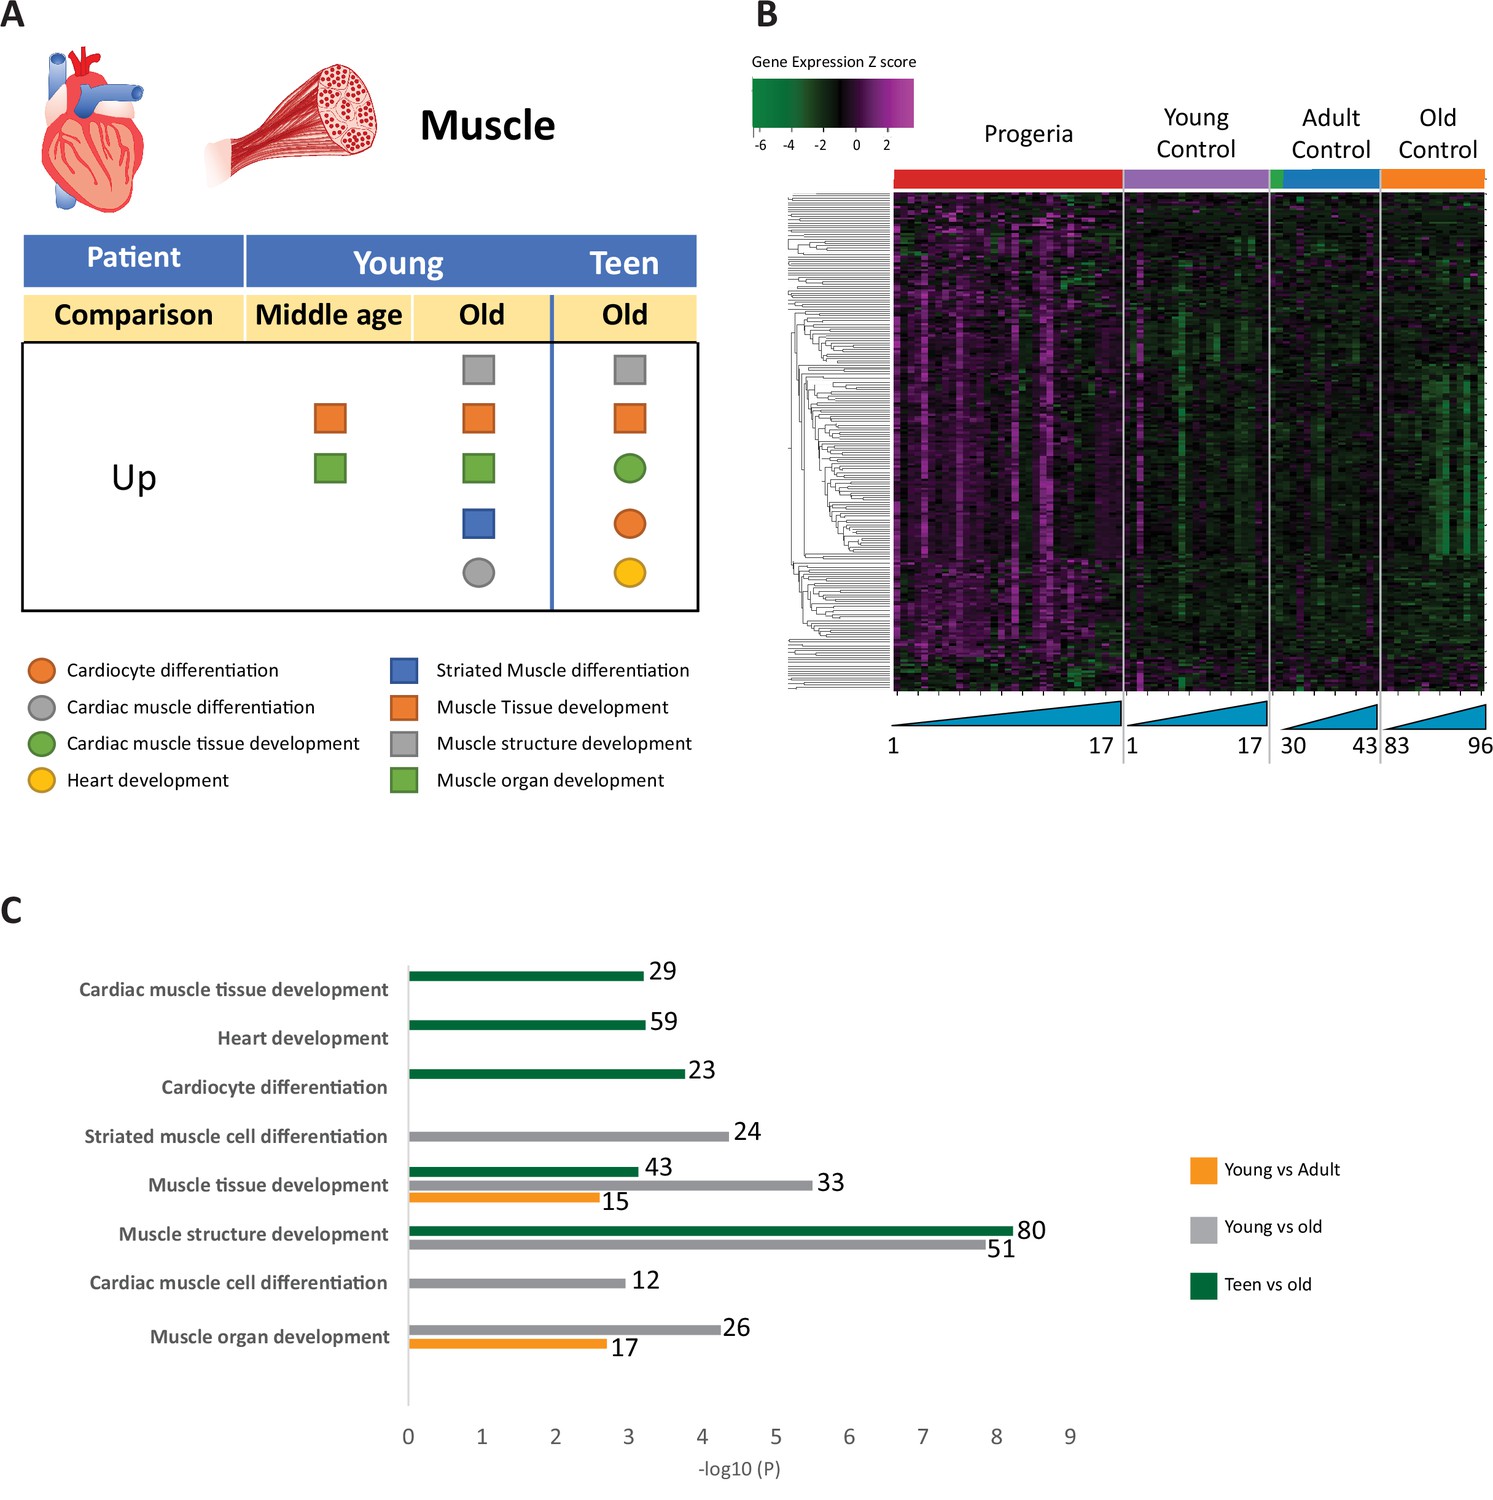
Transcriptional missregulation in genes related to muscle function.
(A) Summary table of processes related to muscle and cardiac muscle development, represented as up or downregulation in transcription based on RNA-seq of young/teenager progeria patient derived fibroblasts, compared to middle age or old control patients. (B) Heat map of RNA-seq transcriptome analysis for 261 selected genes related to muscle development. Data presented as in Figure 1B. (C) Comparison of young progeria patients versus middle-aged and old donor control fibroblasts and of teen-aged progeria patients versus old donor controls. Enriched ontology clusters for upregulated genes related to muscle development, as characterized by Metascape analysis.
Figure 7
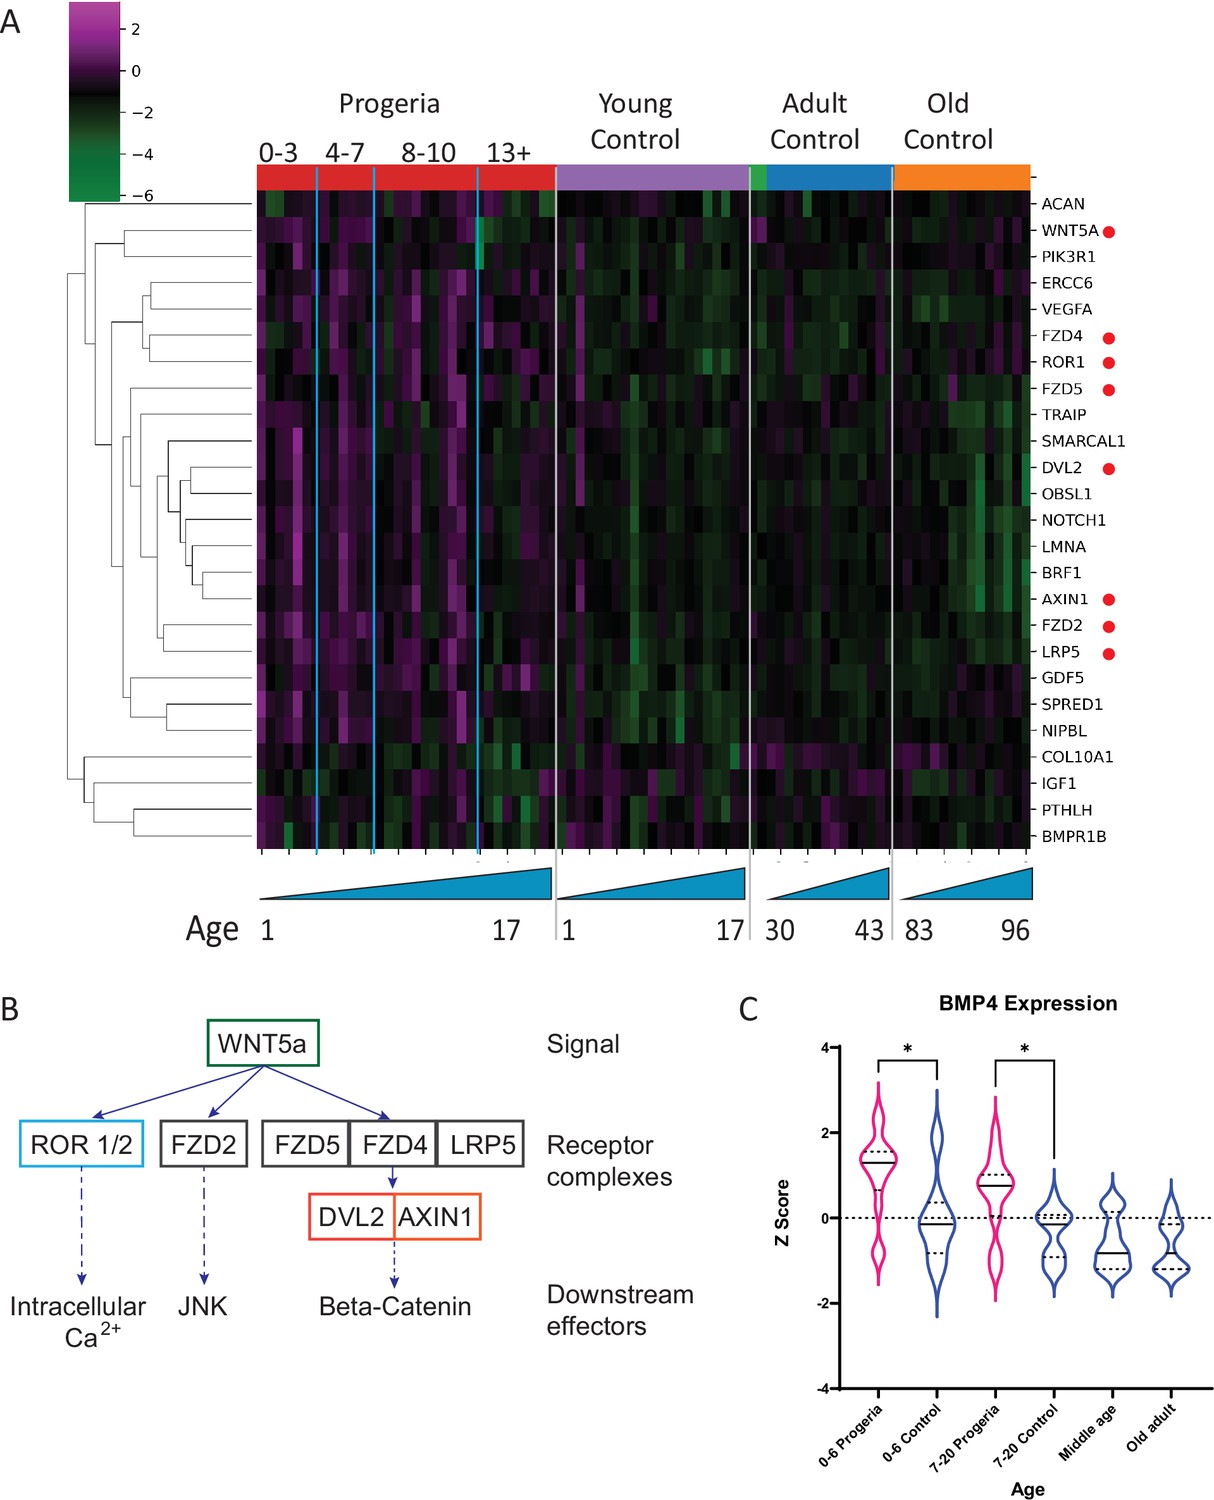
Transcriptional missregulation in genes related to endochondral ossification.
(A) Heat map of RNA-seq transcriptome analysis for 25 selected genes related to endochondral ossification. The heat map shows per-gene z-score computed from batch effect corrected log2 read count values, genes in rows and 29 patient samples (progeria and young/adult/old control) organized in columns. Genes were hierarchically clustered based on Euclidean distance and average linkage. Blue lines separate young infants (0–3 y/o) from children (4–7 y/o) and older children (8–10 y/o). Genes related to WNT5a biology highlighted (red circle). (B) Abridged signaling pathway for WNT5a, highlighting the roles of the genes whose transcription is affected in young HGPS patients compared to their aged-matched controls. (C) BMP4 expression, also identified as significantly upregulated in the analysis of all HGPS patients (Figure 3) differs between Progeria (pink) and control (blue) samples. (* indicates p<0.05 by Kruskal Wallis test; dotted lines within the violin plots indicate 25th, median, and 75th percentiles).
Figure 8 with 1 supplement

Changes in chromatin architecture in HGPS cells: translocations, compartment strength and identity, and correlation to genes of interest.
(A) 2.5 Mb Hi-C heatmaps for AG03257-P7 (Mother, WT), and HGPS patients (HGADFN167-P19 and AG11513-P7) Translocations between chromosomes appear as high interaction frequency regions (red) away from the diagonal. A translocation between chromosomes 3 and 11 is apparent in AG11513 cells (circle). (B) Log ratio of 2.5 Mb contact frequency in Progeria (167-P19) vs. healthy father (168-P16). Loss of telomere interactions is notable as blue patches in the corner of each chromosome. (C) TAD boundary strength boxplots calculated using the InsulationScore approach between early (left) and late (right) passage Progeria cells minus their respective controls. Boxes represent the upper and lower quartiles with the center line as the median. Upper whiskers extend 1.5×IQR beyond the upper quartile, and lower whiskers extend either 1.5×IQR below the lower quartile or to the end of the dataset. (D) Plots of the first eigenvector for a section of chromosome 12, obtained from principal component analysis (PC1) of 250 kb binned Hi-C data for control fibroblasts (Mother AG03257, Father HGADFN168) and HGPS fibroblasts (HGADFN167 and AG11513). Compartment identity remains predominantly unchanged (A compartment: Red, B compartment: Blue). (E) Graphs showing the A-A compartment interaction strength (red) and B-B compartment interaction strength (blue) within each chromosome for related father and child cell lines (HGADFN168, HGADFN167). Samples were collected a both early (left; P12) and late passages (middle; P19 for Progeria and P27 for father). Comparison between the two samples (right) shows that the HPGS cell line shows a marked decrease in A-A compartment interaction strength in late passages in the majority of chromosomes. (F) Eigen 1 values represent the compartment identity (same as plotted in D) for genes identified in this study as upregulated (left) or downregulated (right) in the 0–7 year-old age-matched comparison. While differences between groups are not significant overall (Kruskal-Wallis), a subset of downregulated genes appear to be changing conformation to a B compartment in progeria samples (box). Violin plots for the global distribution of values; median denoted by a thick dashed line, 25th and 75th percentiles highlighted as thin dashed lines. Percentages of genes in the B compartment are indicated in the box below downregulated gene graph. (G) Compartment identity for genes identified in this study as upregulated (left) or downregulated (right) in the 0–7 year-old HGPS samples compared to normal middle-aged controls. (H) Compartment identity for genes identified in this study as upregulated (left) or downregulated (right) in the 0–7 year-old HGPS samples compared to old-aged controls.
Figure 8—figure supplement 1
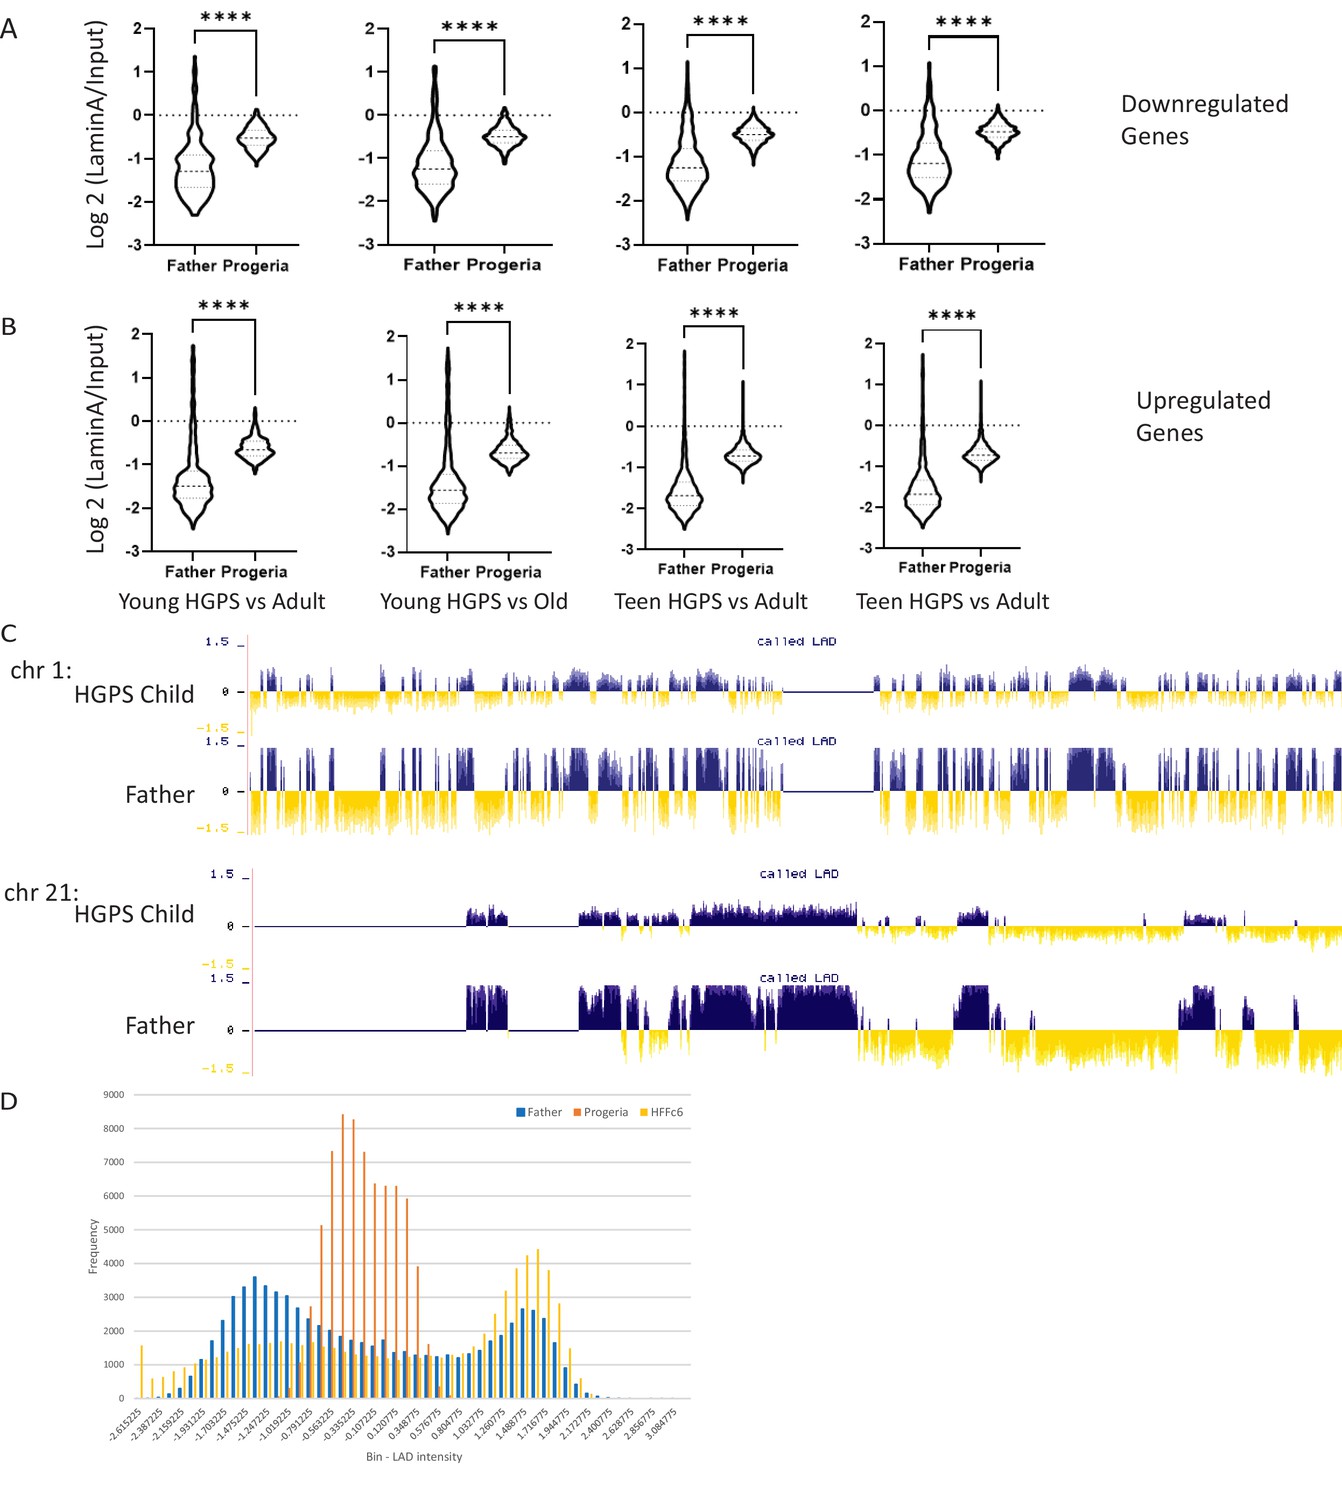
Genes of interest vs LADS.
(A) The genomic regions for downregulated genes identified in our age comparisons were compiled with the LAD identity found in father and HGPS child fibroblasts (HGADFN168 and HGADFN167, respectively). Comparisons are presented as follows, from left to right: Young HGPS (0–7 years old) compared to middle-aged controls, young HGPS patients compared to old controls, teenaged HGPS compared to middle-aged controls and teenaged HGPS compared to old controls. Differences between al groups are significant (Kruskal-Wallis p<0.001) Violin plots for the global distribution of values; median denoted by thick dashed line, 25th and 75th percentiles highlighted as thin dashed lines. (B) The genomic regions for up regulated genes identified in our age comparisons were compiled with the LAD identity found in father and HGPS child fibroblasts (HGADFN168 and HGADFN167, respectively). Comparisons are presented as follows, from left to right: Young HGPS (0–7 years old) compared to middle-aged controls, young HGPS patients compared to old controls, teenaged HGPS compared to middle-aged controls and teenaged HGPS compared to old controls. Differences between al groups are significant (Kruskal-Wallis p<0.001) Violin plots for the global distribution of values; median denoted by thick dashed line, 25th and 75th percentiles highlighted as thin dashed lines. (C) LAD distribution along chromosome 1 and 21. LAD identity remains consistent among samples, with small regional changes in LAD definition in specific areas (highlighted- rectangle). The greatest difference among samples is the strength in LAD definition, as characterized by smaller positive and negative values. (D) The genome-wide distribution of LADs, as characterized by DamID-seq shows that normal fibroblast lines HGADFN168 (belonging to a father of an HGPS patient) and HFFc6 (human foreskin fibroblast), show a characteristic bimodal distribution in LAD intensity around positive (LAD) and negative (non-LAD) values. In contrast, LAD values for the HGPS cell line HGADFN167 distribute normally, around zero.
Figure 9 with 2 supplements
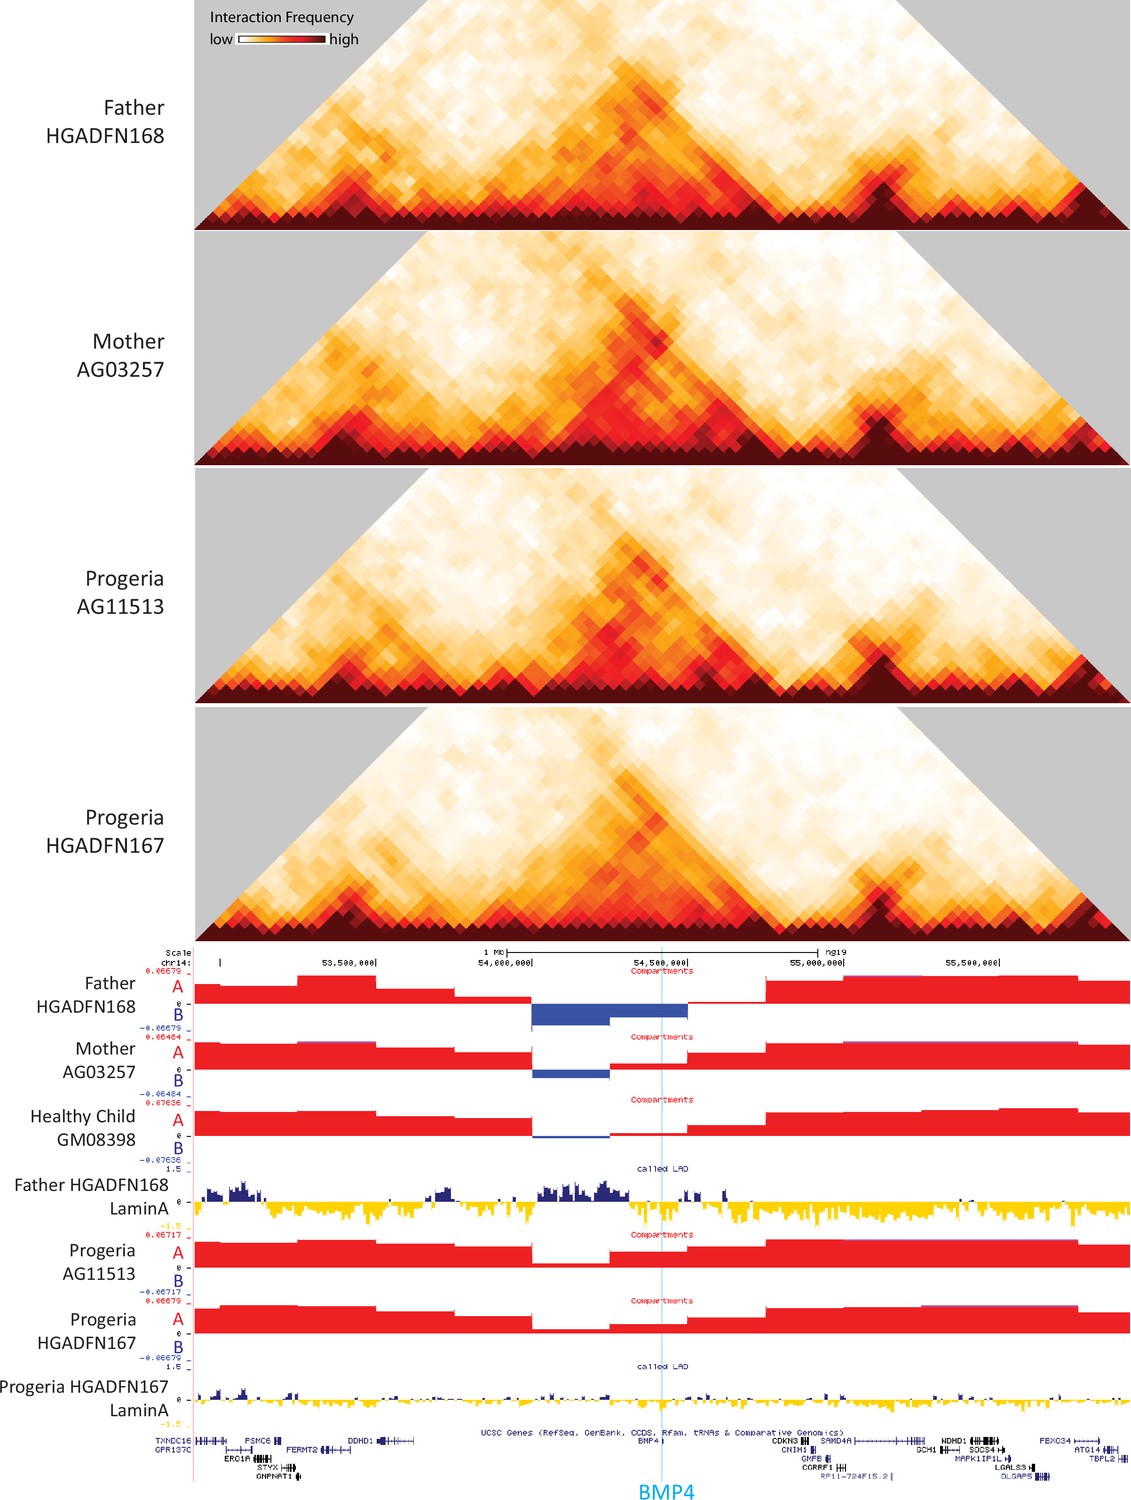
40 kb resolution heatmaps for the parental and HGPS fibroblasts around the BMP4 gene (highlight: blue), aligned to their associated compartment and LAD tracks.
The gene is located in a region that shifts toward the A compartment (red) in HGPS compared to WT parent and healthy child controls.
Figure 9—figure supplement 1
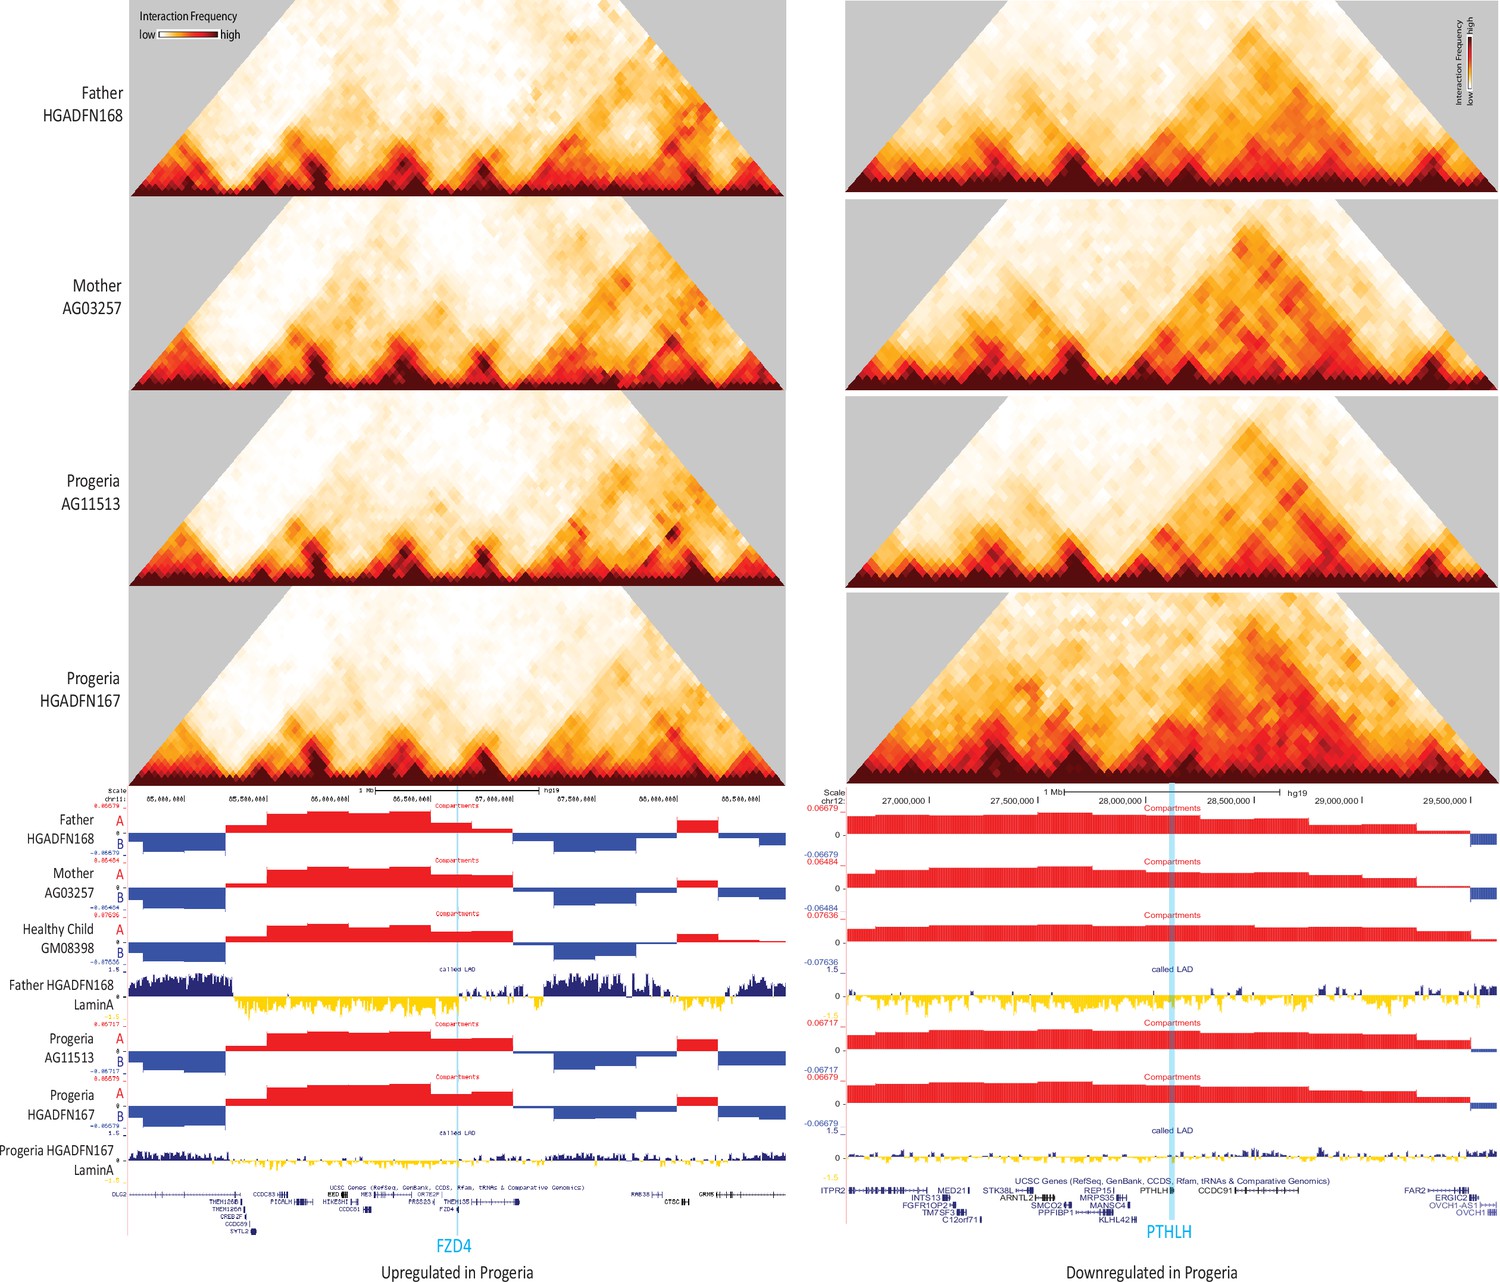
40 kb resolution Hi-C contact maps for the parental and HGPS cell lines, aligned with A/B compartment tracks for parental, healthy child, and HGPS cell lines.
The data is centered on FZD4 (le) and PTHLH (right), as shown in blue highlights. Both genes localize to the A compartment (red, positive values) even though FZD4 is upregulated in Progeria and PTHLH is downregulated (see Figure 7). FZD4 shows erosion of LAD domain (yellow/blue track) in HGPS while PTHLH shows a gain of Lamina contacts in HGPS.
Figure 9—figure supplement 2
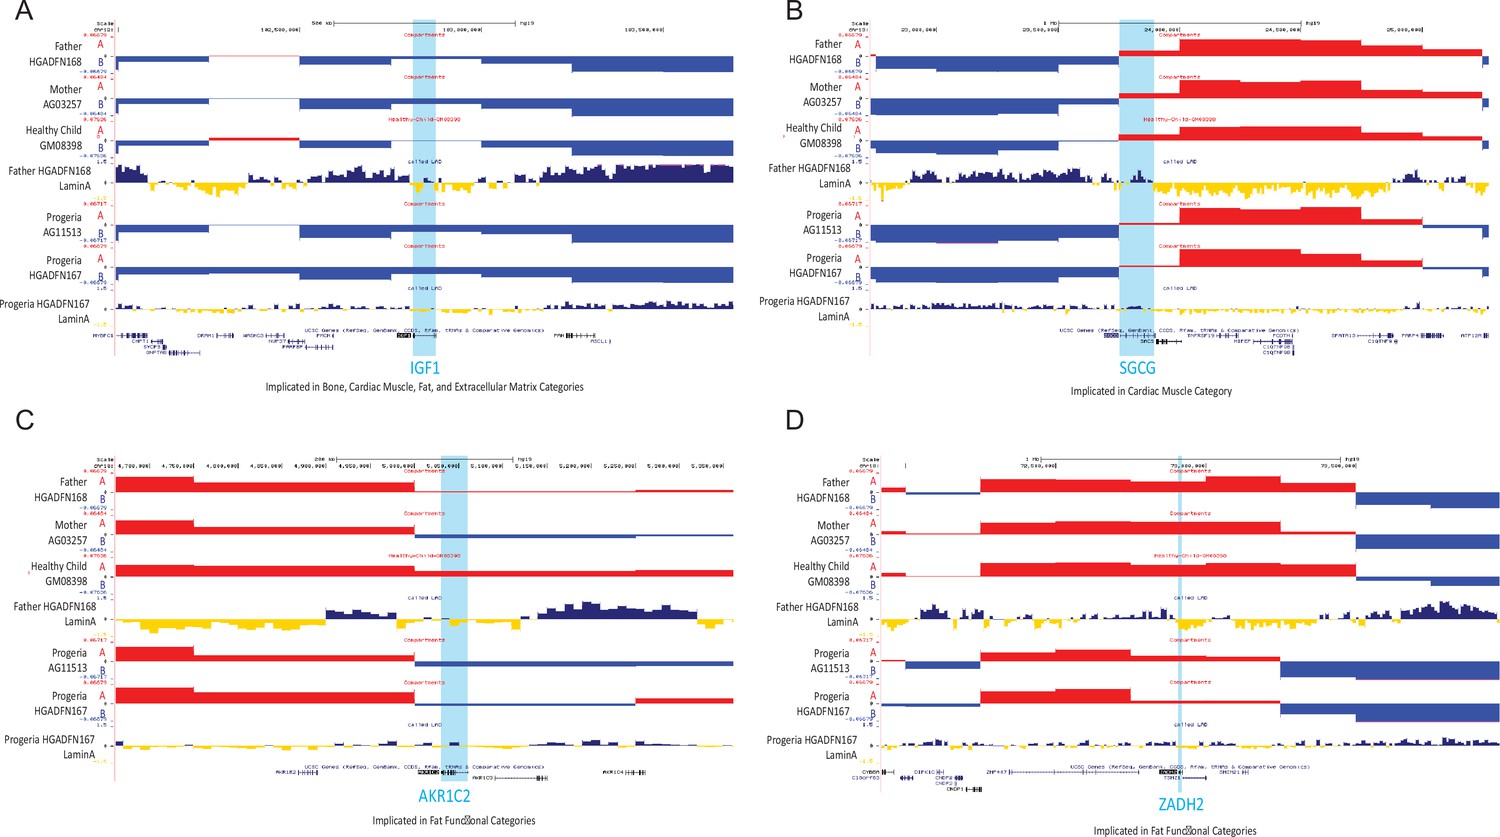
A/B compartment tracks for parental, healthy child, and HGPS cell lines and Lamin A association tracks for healthy father and HGPS patient centered on genes detected as downregulated in Progeria compared to healthy children.
Figure 10
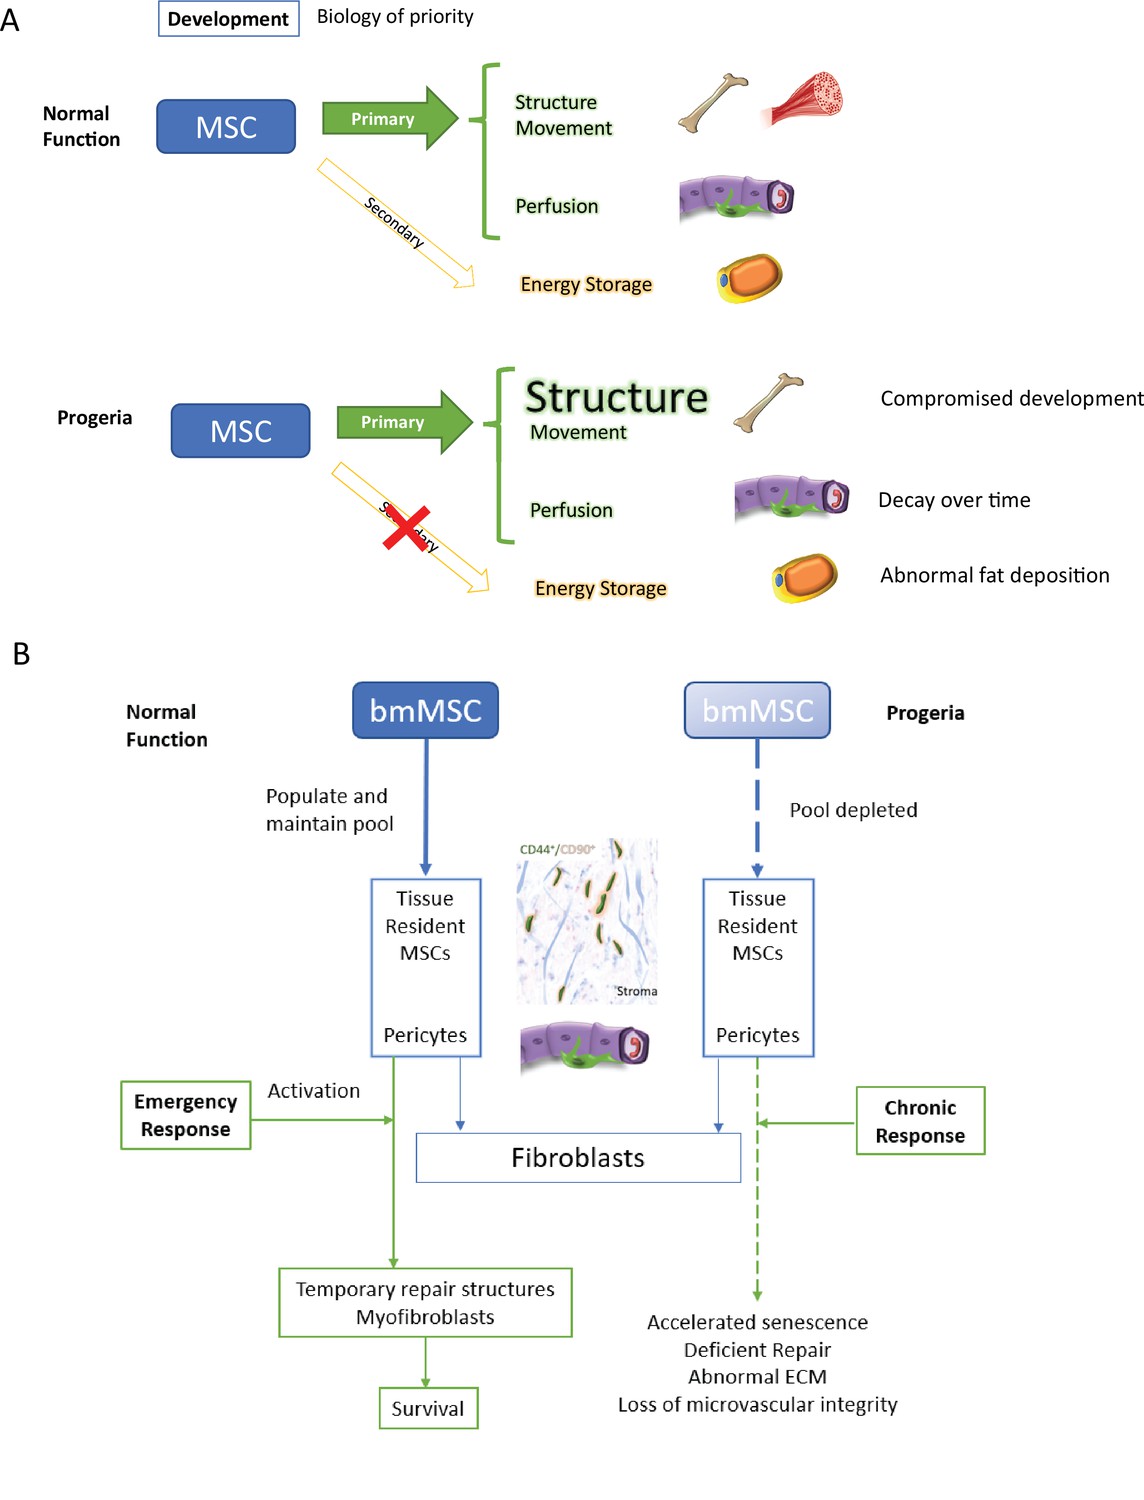
Discussion model.
HGPS affects differentiation commitment and subsequent biology of priority during early development, which results in premature depletion of MSC pools.
Author response image 1
Videos
Video 1
A visual explanation of ideas presented in the Discussion, hypotheses derived from transcriptomics results.
Tables
Table 1
Number of up/down-regulated genes per age comparisons.
| Comparisons | Upregulated genes | Downregulated genes |
|---|---|---|
| Young patients – Age matched | 260 | 63 |
| Young patients – Adult control | 574 | 241 |
| Young patients – Old adult control | 984 | 435 |
| Teenaged patients – Age matched | 237 | 81 |
| Teenaged patients – Adult control | 1873 | 1138 |
| Teenaged patients – Old adult control | 1872 | 1022 |
| Young Control – Adult Control | 28 | 25 |
| Young Control – Old Control | 817 | 421 |
-
Table 1—source data 1
Metascape outputs for gene ontology analysis.
Childhood and teenaged patient samples compared to middle aged and older adults.
- https://cdn.elifesciences.org/articles/81290/elife-81290-table1-data1-v2.zip
Table 2
Number of up/down-regulated genes in young patient cohort comparisons.
| Comparisons | Upregulated genes | Downregulated genes |
|---|---|---|
| Early Infant – Age matched | 113 | 25 |
| Early Infant – Middle aged adult | 540 | 172 |
| Early Infant – Old adult | 646 | 388 |
| Children - Age matched | 203 | 102 |
| Children - Middle aged adult | 173 | 184 |
| Children - Old adult | 305 | 394 |
-
Table 2—source data 1
Metascape outputs for gene ontology analysis.
Early and late childhood patient samples compared to healthy children, middle aged, and older adults.
- https://cdn.elifesciences.org/articles/81290/elife-81290-table2-data1-v2.zip
Key resources table
| Reagent type (species) or resource | Designation | Source or reference | Identifiers | Additional information |
|---|---|---|---|---|
| Biological sample (Homo sapiens) | Purified RNA | Coriell Institute | AG01178 | Male 20 y/o |
| Biological sample (Homo sapiens) | Purified RNA | Coriell Institute | AG03198 | Female 10 y/o |
| Biological sample (Homo sapiens) | Purified RNA | Coriell Institute | AG06917 | Male 3 y/o |
| Biological sample (Homo sapiens) | Purified RNA | Coriell Institute | AG07493 | Female 2 y/o |
| Biological sample (Homo sapiens) | Purified RNA | Coriell Institute | AG08466 | Female 8 y/o |
| Biological sample (Homo sapiens) | Purified RNA | Coriell Institute | AG10578 | Male 17 y/o |
| Biological sample (Homo sapiens) | Purified RNA | Coriell Institute | AG10677 | Male 4 y/o |
| Biological sample (Homo sapiens) | Purified RNA | Coriell Institute | AG11572 | Female 2 y/o |
| Biological sample (Homo sapiens) | Purified RNA | Coriell Institute | GM01178 | Male 20 y/o |
| Biological sample (Homo sapiens) | Purified RNA | Coriell Institute | GM01972 | Female 14 y/o |
| Biological sample (Homo sapiens) | Purified RNA | Coriell Institute | AG11513 | Female 8 y/o |
| Cell line (Homo sapiens) | HGPS human primary dermal fibroblast | Progeria Research Foundation (PRF) Cell and Tissue Bank | HGADFN167 | 8-year-old male progeria patient |
| Cell line (Homo sapiens) | WT human primary dermal fibroblast | Progeria Research Foundation (PRF) Cell and Tissue Bank | HGADFN168 | Father of progeria patient |
| Cell line (Homo sapiens) | HGPS human primary dermal fibroblast | Coriell Institute | AG11513 | 8-year-old female progeria patient |
| Cell line (Homo sapiens) | WT human primary dermal fibroblast | Coriell Institute | AG03257 | Mother of progeria patient |
| Cell line (Homo sapiens) | WT human primary dermal fibroblast | Coriell Institute | GM08398 | 8-year-old male healthy child |
| Peptide, recombinant protein | HindIII | New England Biolabs | R0104L | |
| Peptide, recombinant protein | DpnII | New England Biolabs | R0543L | |
| Peptide, recombinant protein | T4 DNA Ligase | Invitrogen | 15224041 | |
| Peptide, recombinant protein | DNA Polymerase I Klenow Fragment | New England Biolabs | M0210L | |
| Peptide, recombinant protein | T4 DNA Polymerase | New England Biolabs | M0203L | |
| Peptide, recombinant protein | Biotin-dATP | Invitrogen | 19524016 | |
| Commercial assay or kit | Arima-HiC +Kit | Arima Genomics | Mammalian Cell Lines Protocol (A160134 v01) | |
| Commercial assay or kit | NEBNext Ultra II kit | New England Biolabs | E7645S | |
| Commercial assay or kit | NEBNext Multiplex Oligos for Illumina (Index Primers Set 4) | New England Biolabs | E7730S | |
| Commercial assay or kit | NEBNext Multiplex Oligos for Illumina (Index Primers Set 1) | New England Biolabs | E7335S | |
| Software, algorithm | BBDuk | https://github.com/kbaseapps/BBTools | RRID:SCR_016968 | |
| Software, algorithm | STAR aligner | https://github.com/alexdobin/STAR | RRID:SCR_004463 | |
| Software, algorithm | HTSeq-Counts | https://github.com/simon-anders/htseq | RRID:SCR_011867 | |
| Software, algorithm | DESeq2 | https://bioconductor.org/packages/release/bioc/html/DESeq2.html | ||
| Software, algorithm | cMapping | https://github.com/dekkerlab/cMapping (Lajoie et al., 2015; Lajoie and Oomen, 2015) | v1.0.6; Bryan Lajoie | |
| Software, algorithm | cWorld-dekker | https://github.com/dekkerlab/cworld-dekker (Lajoie and Venev, 2019) | v0.41.1; Bryan Lajoie | |
| Software, algorithm | ComBat-seq | https://github.com/zhangyuqing/ComBat-seq (Zhang et al., 2020a; Zhang et al., 2020b) |
Appendix 1—table 1
RNA-seq datasets from progeria patients used in this study.
| Progeria Patient | Age | Sex | Race | RNA-seq approach | Lab | GEO Series |
|---|---|---|---|---|---|---|
| HGADFN155 | 1 yr 2 mo | F | Unknown | polyA (TruSeq RNA Sample Preparation v2 protocol) | Rodríguez-Paredes | GSE150137 |
| NG07493 | 2 yr | F | White | rRNA depletion | McCord | GSE206684 |
| NG11572 | 2 yr | F | White | rRNA depletion | McCord | GSE206684 |
| HGADFN188 | 2 yr 3 mo | F | Unknown | polyA (TruSeq Stranded mRNA) | Fleischer | GSE113957 |
| HGADFN188 | 2 yr 3 mo | F | Unknown | polyA (TruSeq RNA Sample Preparation v2 protocol) | Rodríguez-Paredes | GSE150137 |
| HGADFN367 | 3 yr | F | Unknown | polyA (TruSeq Stranded mRNA) | Fleischer | GSE113957 |
| NG06917 | 3 yr | M | White | rRNA depletion | McCord | GSE206684 |
| HGADFN127 | 3 yr 9 mo | F | Unknown | polyA (TruSeq Stranded mRNA) | Fleischer | GSE113957 |
| NG10677 | 4 yr | M | White | rRNA depletion | McCord | GSE206684 |
| HGADFN164 | 4 yr 8 mo | F | Unknown | polyA (TruSeq Stranded mRNA) | Fleischer | GSE113957 |
| HGADFN164 | 4 yr 8 mo | F | Unknown | polyA (TruSeq RNA Sample Preparation v2 protocol) | Rodríguez-Paredes | GSE150137 |
| HGADFN122 | 5 yr | F | Unknown | polyA (TruSeq Stranded mRNA) | Fleischer | GSE113957 |
| HGADFN178 | 6 yr 11 mo | F | Unknown | polyA (TruSeq Stranded mRNA) | Fleischer | GSE113957 |
| AG11513 | 8 yr | F | White | polyA (TruSeq Stranded mRNA) | Fleischer | GSE113957 |
| NG08466 | 8 yr | F | White | rRNA depletion | McCord | GSE206684 |
| NG11513 | 8 yr | F | White | rRNA depletion | McCord | GSE206684 |
| HGADFN167 | 8 yr 5 mo | M | Unknown | polyA (NEBNext Ultra DNA Library Prep Kit) | Ikegami | GSE113343 |
| HGADFN167-2 | 8 yr 5 mo | M | Unknown | polyA (NEBNext Ultra DNA Library Prep Kit) | Ikegami | GSE113343 |
| HGADFN167 | 8 yr 5 mo | M | Unknown | polyA (TruSeq Stranded mRNA) | Fleischer | GSE113957 |
| HGADFN167 | 8 yr 5 mo | M | Unknown | polyA (TruSeq RNA Sample Preparation v2 protocol) | Rodríguez-Paredes | GSE150137 |
| HGADFN169 | 8 yr 6 mo | M | Unknown | polyA (TruSeq Stranded mRNA) | Fleischer | GSE113957 |
| HGADFN169 | 8 yr 6 mo | M | Unknown | polyA (TruSeq RNA Sample Preparation v2 protocol) | Rodríguez-Paredes | GSE150137 |
| HGADFN143 | 8 yr 10 mo | M | Unknown | polyA (TruSeq Stranded mRNA) | Fleischer | GSE113957 |
| HGADFN143 | 8 yr 10 mo | M | Unknown | polyA (TruSeq RNA Sample Preparation v2 protocol) | Rodríguez-Paredes | GSE150137 |
| AG03199 | 10 yr | F | White | polyA (Illumina SureSelect Strand Specific RNA library Prep) | Arufe | GSE113648 |
| NG03198 | 10 yr | F | White | rRNA depletion | McCord | GSE206684 |
| AG03513 | 13 yr | M | White Mexican | polyA (Illumina SureSelect Strand Specific RNA library Prep) | Arufe | GSE113648 |
| AG11498 | 14 yr | M | African American | polyA (NEBNext Ultra DNA Library Prep Kit) | Ikegami | GSE113343 |
| AG11498-2 | 14 yr | M | African American | polyA (NEBNext Ultra DNA Library Prep Kit) | Ikegami | GSE113343 |
| NA01972 | 14 yr | F | White | rRNA depletion | McCord | GSE206684 |
| NG10578 | 17 yr | M | White | rRNA depletion | McCord | GSE206684 |
| NA01178 | 20 yr | M | Unknown | rRNA depletion | McCord | GSE206684 |
| NG01178 | 20 yr | M | Unknown | rRNA depletion | McCord | GSE206684 |
Appendix 1—table 2
RNA-seq datasets from adult controls used in this study.
| Donor | Age | Sex | Race | RNA-seq approach | Lab | GEO Series |
|---|---|---|---|---|---|---|
| Parent of Progeria Patient | ||||||
| AG03257 | 35 | F | polyA (Illumina SureSelect Strand Specific RNA library Prep) | Arufe | GSE113648 | |
| AG03512 | 41 | F | polyA (Illumina SureSelect Strand Specific RNA library Prep) | Arufe | GSE113648 | |
| Healthy Mid-Age Adult | ||||||
| AG07124 | 26 | F | White | polyA (TruSeq Stranded mRNA) | Fleischer | GSE113957 |
| GM00495 | 29 | M | Unknown | polyA (TruSeq Stranded mRNA) | Fleischer | GSE113957 |
| AG07478 | 29 | M | White | polyA (TruSeq Stranded mRNA) | Fleischer | GSE113957 |
| AG04054 | 29 | M | White | polyA (TruSeq Stranded mRNA) | Fleischer | GSE113957 |
| AG09599 | 30 | F | White | polyA (TruSeq Stranded mRNA) | Fleischer | GSE113957 |
| AG09605 | 30 | M | White | polyA (TruSeq Stranded mRNA) | Fleischer | GSE113957 |
| GM04503 | 31 | F | White | polyA (TruSeq Stranded mRNA) | Fleischer | GSE113957 |
| GM04504 | 31 | F | White | polyA (TruSeq Stranded mRNA) | Fleischer | GSE113957 |
| GM00043 | 32 | F | Black, Puerto Rican | polyA (TruSeq Stranded mRNA) | Fleischer | GSE113957 |
| GM01650 | 37 | F | Unknown | polyA (TruSeq Stranded mRNA) | Fleischer | GSE113957 |
| GM01717 | 39 | M | White | polyA (TruSeq Stranded mRNA) | Fleischer | GSE113957 |
| AG16358 | 41 | F | White | polyA (TruSeq Stranded mRNA) | Fleischer | GSE113957 |
| AG13967 | 41 | M | White | polyA (TruSeq Stranded mRNA) | Fleischer | GSE113957 |
| AG04063 | 43 | M | White | polyA (TruSeq Stranded mRNA) | Fleischer | GSE113957 |
| Older Adult Control | ||||||
| GM03525 | 80 | F | White | polyA (TruSeq Stranded mRNA) | Fleischer | GSE113957 |
| GM01706 | 82 | F | White | polyA (TruSeq Stranded mRNA) | Fleischer | GSE113957 |
| AG04386 | 83 | M | White | polyA (TruSeq Stranded mRNA) | Fleischer | GSE113957 |
| AG11744 | 84 | F | White | polyA (TruSeq Stranded mRNA) | Fleischer | GSE113957 |
| AG11725 | 84 | F | White | polyA (TruSeq Stranded mRNA) | Fleischer | GSE113957 |
| AG05274 | 84 | M | White | polyA (TruSeq Stranded mRNA) | Fleischer | GSE113957 |
| AG05247 | 87 | F | White | polyA (TruSeq Stranded mRNA) | Fleischer | GSE113957 |
| AG04662 | 87 | M | White | polyA (TruSeq Stranded mRNA) | Fleischer | GSE113957 |
| AG13129 | 89 | M | White | polyA (TruSeq Stranded mRNA) | Fleischer | GSE113957 |
| AG12788 | 90 | M | White | polyA (TruSeq Stranded mRNA) | Fleischer | GSE113957 |
| AG07725 | 91 | M | White | polyA (TruSeq Stranded mRNA) | Fleischer | GSE113957 |
| AG09602 | 92 | F | White | polyA (TruSeq Stranded mRNA) | Fleischer | GSE113957 |
| AG04064 | 92 | M | White | polyA (TruSeq Stranded mRNA) | Fleischer | GSE113957 |
| AG08433 | 94 | M | White | polyA (TruSeq Stranded mRNA) | Fleischer | GSE113957 |
| AG04059 | 96 | M | White | polyA (TruSeq Stranded mRNA) | Fleischer | GSE113957 |
Appendix 1—table 3
RNA-seq datasets from children controls used in this study.
| Healthy Child | Age | Sex | Race | RNA-seq approach | Lab | GEO Series |
|---|---|---|---|---|---|---|
| AG08498 | 1 | M | Asian | polyA (TruSeq Stranded mRNA) | Fleischer | GSE113957 |
| GM00969 | 2 | F | Caucasian | polyA (TruSeq Stranded mRNA) | Fleischer | GSE113957 |
| GM00969 | 2 | F | Caucasian | polyA (TruSeq RNA Sample Preparation v2 protocol) | Rodríguez-Paredes | GSE150137 |
| GM05565 | 3 | M | Latino/Hispanic | polyA (TruSeq Stranded mRNA) | Fleischer | GSE113957 |
| GM00498 | 3 | M | Unknown | polyA (TruSeq Stranded mRNA) | Fleischer | GSE113957 |
| GM05400 | 6 | M | Black | polyA (TruSeq Stranded mRNA) | Fleischer | GSE113957 |
| GM00409 | 7 | M | Caucasian | polyA (TruSeq Stranded mRNA) | Fleischer | GSE113957 |
| GM00499 | 8 | M | Caucasian | polyA (TruSeq Stranded mRNA) | Fleischer | GSE113957 |
| GM08398 | 8 | M | Caucasian | polyA (NEBNext Ultra DNA Library Prep Kit) | Ikegami | GSE113343 |
| GM08398-2 | 8 | M | Caucasian | polyA (NEBNext Ultra DNA Library Prep Kit) | Ikegami | GSE113343 |
| GM08398 | 8 | M | Caucasian | polyA (TruSeq Stranded mRNA) | Fleischer | GSE113957 |
| GM00038 | 9 | F | Black | polyA (TruSeq Stranded mRNA) | Fleischer | GSE113957 |
| GM01652 | 11 | F | Caucasian | polyA (TruSeq Stranded mRNA) | Fleischer | GSE113957 |
| GM01582 | 11 | F | Caucasian | polyA (TruSeq Stranded mRNA) | Fleischer | GSE113957 |
| AG16409 | 12 | M | Caucasian | polyA (TruSeq Stranded mRNA) | Fleischer | GSE113957 |
| GM07532 | 16 | F | Unknown | polyA (TruSeq Stranded mRNA) | Fleischer | GSE113957 |
| GM07753 | 17 | M | Caucasian | polyA (TruSeq Stranded mRNA) | Fleischer | GSE113957 |
| GM07492 | 17 | M | Caucasian | polyA (NEBNext Ultra DNA Library Prep Kit) | Ikegami | GSE113343 |
| GM07492-2 | 17 | M | Caucasian | polyA (NEBNext Ultra DNA Library Prep Kit) | Ikegami | GSE113343 |
| GM07492 | 17 | M | Caucasian | polyA (TruSeq Stranded mRNA) | Fleischer | GSE113957 |
| GM08399 | 19 | F | Caucasian | polyA (TruSeq Stranded mRNA) | Fleischer | GSE113957 |
Appendix 1—table 4
Hi-C Data Statistics.
| Sample Name | Enzyme | Genotype | Gender, Age | Raw Reads | Both Sides Mapped | % Map | % Dangling Ends | Valid Pairs | Unique Valid Pairs | %Cis |
|---|---|---|---|---|---|---|---|---|---|---|
| Progeria-167-DpnII-P19-R1 | DpnII | HGPS | Male, 8Y | 364,961,495 | 220,942,665 | 60.5 | 3.05 | 208,963,277 | 152,974,533 | 54.69 |
| Progeria-168-DpnII-P16-R1 | DpnII | WT | Male, 40Y | 358,703,556 | 220,880,406 | 61.6 | 3.48 | 212,152,596 | 148,022,234 | 54.98 |
| Progeria-AG03257-P7-R1 | DpnII | WT | Female, 35Y | 274,364,560 | 177,877,476 | 64.8 | 0.95 | 174,730,268 | 132,694,872 | 49.65 |
| Progeria-AG03257-P7-R3 | DpnII | WT | Female, 35Y | 127,656,906 | 73,190,497 | 57.3 | 2.26 | 70,541,316 | 46,463,429 | 83.56 |
| Progeria-AG11513-P7-R1 | DpnII | HGPS | Female, 8Y | 251,483,696 | 154,772,051 | 61.5 | 0.46 | 153,219,873 | 116,077,671 | 48.77 |
| Progeria-AG11513-P7-R2 | DpnII | HGPS | Female, 8Y | 251,776,055 | 153,160,225 | 60.8 | 0.75 | 151,305,617 | 114,631,955 | 50.22 |
| Progeria-HGADFN167-P12-R1 | HindIII | HGPS | Male, 8Y | 165,040,682 | 116,708,094 | 70.7 | 24.91 | 86,987,628 | 81,047,934 | 67.32 |
| Progeria-HGADFN167-P19-R1 | HindIII | HGPS | Male, 8Y | 202,090,523 | 136,172,100 | 67.4 | 14.12 | 116,222,620 | 95,537,352 | 82.72 |
| Progeria-HGADFN168-P12-R1 | HindIII | WT | Male, 40Y | 194,414,002 | 136,139,915 | 70.0 | 16.61 | 112,990,317 | 77,889,695 | 81.23 |
| Progeria-HGADFN168-P27-R1 | HindIII | WT | Male, 40Y | 157,637,031 | 110,558,519 | 70.1 | 15.06 | 93,504,712 | 86,842,660 | 67.32 |
| Progeria-GM08398-P13-R1 | Arima | WT | Male, 8Y | 475,221,692 | 309,944,409 | 65.2 | 1.59 | 301,485,345 | 182,322,975 | 83.07 |
Additional files
Download links
A two-part list of links to download the article, or parts of the article, in various formats.
Downloads (link to download the article as PDF)
Open citations (links to open the citations from this article in various online reference manager services)
Cite this article (links to download the citations from this article in formats compatible with various reference manager tools)
Transcriptional profiling of Hutchinson-Gilford Progeria syndrome fibroblasts reveals deficits in mesenchymal stem cell commitment to differentiation related to early events in endochondral ossification
eLife 11:e81290.
https://doi.org/10.7554/eLife.81290


