Maternal obesity blunts antimicrobial responses in fetal monocytes
- Institute for Immunology, University of California, Irvine, United States
- Department of Molecular Biology and Biochemistry, University of California, Irvine, United States
- Department of Microbiology, Immunology, and Molecular Genetics, University of Kentucky, United States
- Division of Cardiometabolic Health, Oregon National Primate Research Center, Oregon Health & Science University, United States
- Maternal-Fetal Medicine, Oregon Health & Science University, United States
Figures
Figure 1 with 3 supplements
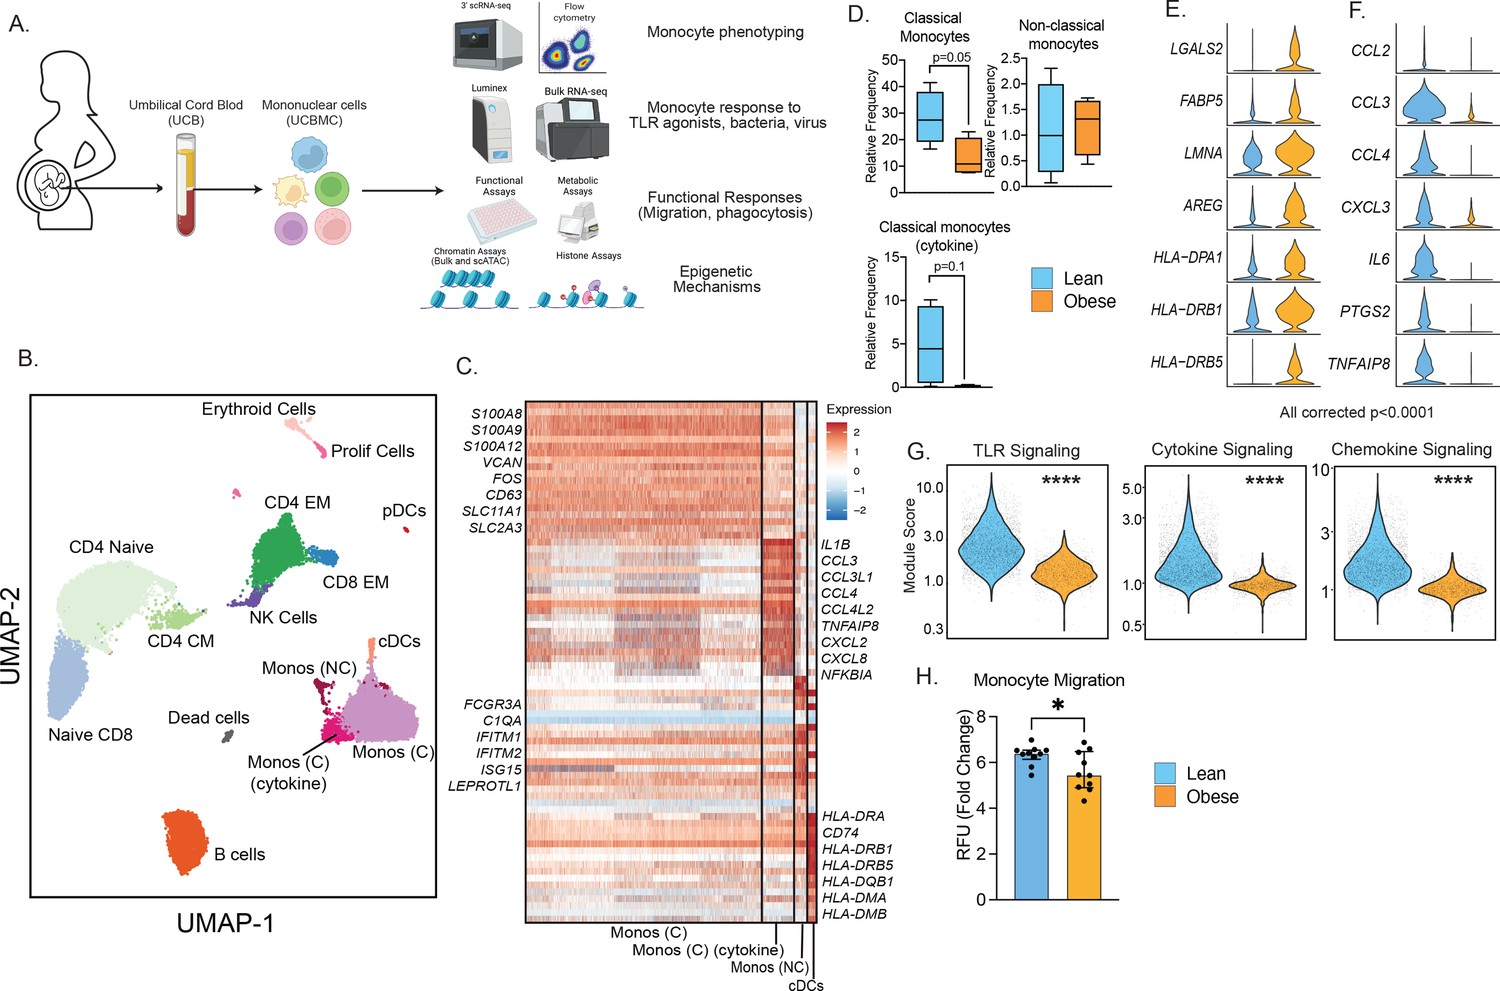
Experimental design and phenotypic changes in UCB monocytes.
(A) Experimental design for the study. Cord blood samples were obtained from neonates born to lean and mothers with obesity (n=43 lean and n=36 obese, Table 1). UCBMC and plasma were isolated and used to assess the impact of pregravid obesity on fetal immunity using genomic (bulk and single-cell RNA and ATAC-Seq, ChIP-Seq) and functional assays (flow cytometry, ex vivo stimulations, phagocytosis, and migration). (B) UMAP of term cord blood mononuclear cells collected from lean mothers and mothers with obesity (n=4/group). Samples were hashed using CellPlex (10 X Genomics), sorted for live cells, and analyzed using a 10 X single-cell 3’ gene expression assay. (C) Heatmap of top 30 markers of monocyte and conventional DC clusters in UCBMC. (D) Box and whisker plots comparing relative frequencies of monocyte subsets (mean and ± SEM). (E–F) Violin plots of the top differentially expressed genes (FDR p<0.0001) in cord blood classical monocytes – (E) upregulated and (F) downregulated with maternal obesity. (G) Violin plots comparing module scores of TLR, cytokine, and chemokine signaling in cord blood classical monocytes with maternal obesity. (H) Bar graph comparing migration potential of UCB monocytes in response to supernatants from PMA-stimulated adult PBMC. Fold changes were calculated relative to no stimulation controls (mean and± SEM). * - p<0.05.
Figure 1—figure supplement 1
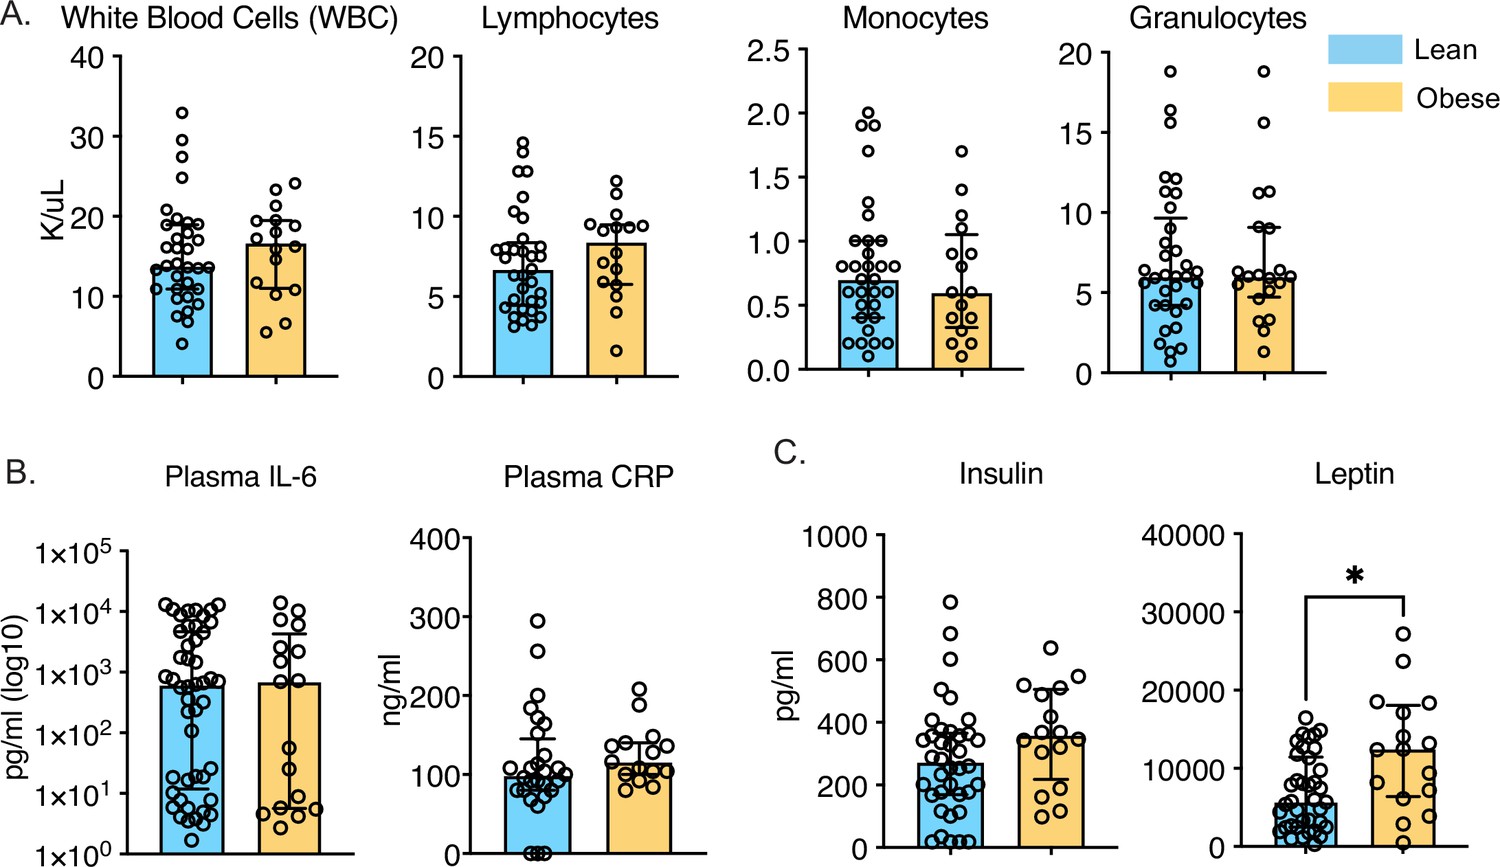
Longitudinal changes in circulating inflammatory environment.
(A) Complete blood cell counts of umbilical cord blood samples obtained from babies born to 34 lean or 26 mothers with obesity. (B) Circulating levels of CRP and IL-6 were measured using an ELISA. (C) Circulating levels of insulin and leptin were measured using a metabolic Luminex panel. * - p<0.05.
Figure 1—figure supplement 2
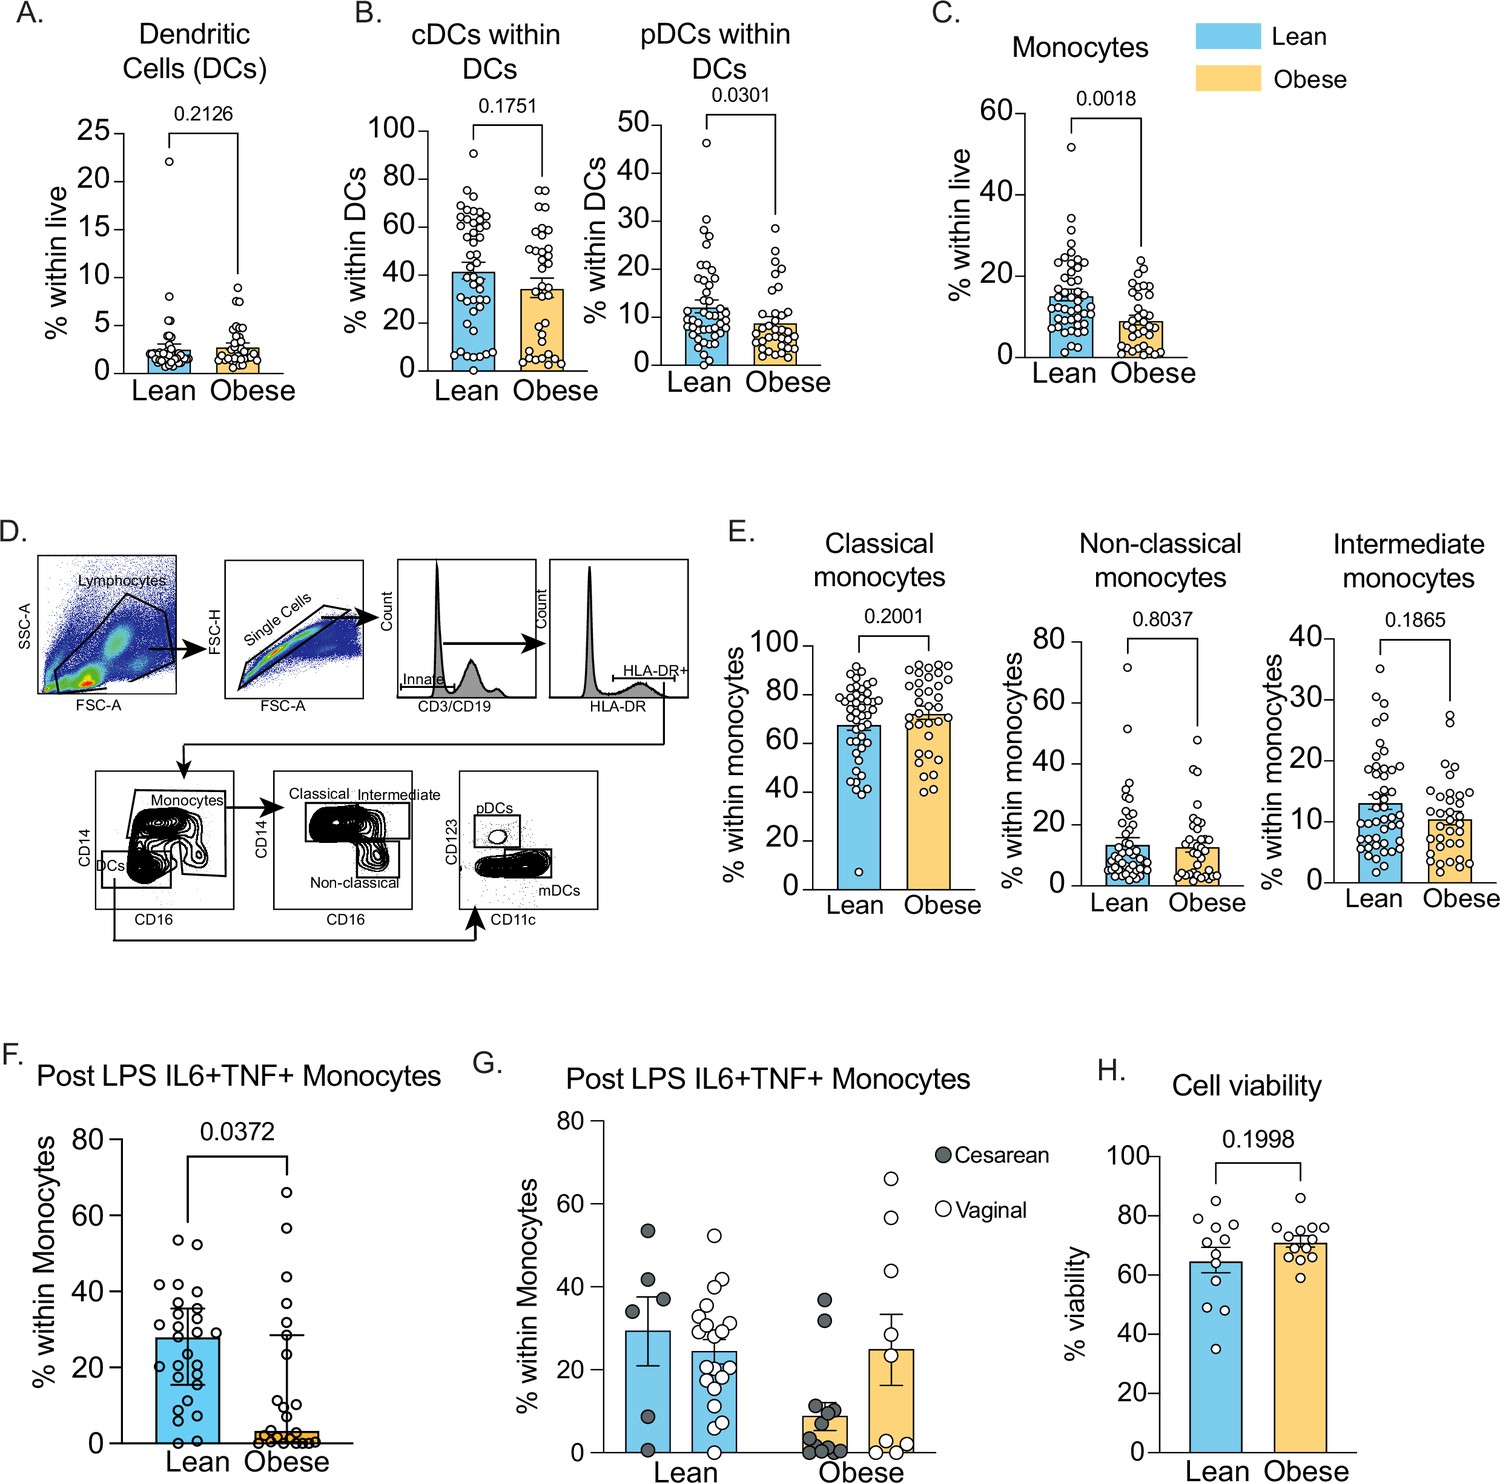
Innate immune cell responses in cord blood.
(A) Gating strategy for identification of dendritic cells and monocyte subsets in cord blood. (B–C) Frequencies of (B) total dendritic cells and its (C) subsets in cord blood. (D) Frequencies of total CD14 + monocytes in cord blood. (E) Proportions of classical (CD14 + + CD16 dim), non-classical (CD14 + CD16++) and intermediate (CD14 +CD16+) monocytes in cord blood with maternal obesity. (F) Frequencies of IL-6 + TNFa + producing monocytes following overnight LPS stimulation measured using intracellular cytokine staining and flow cytometry and (G) stratified by mode of delivery (H) Post thaw viability of UCBMC measured using flow cytometry.
Figure 1—figure supplement 3
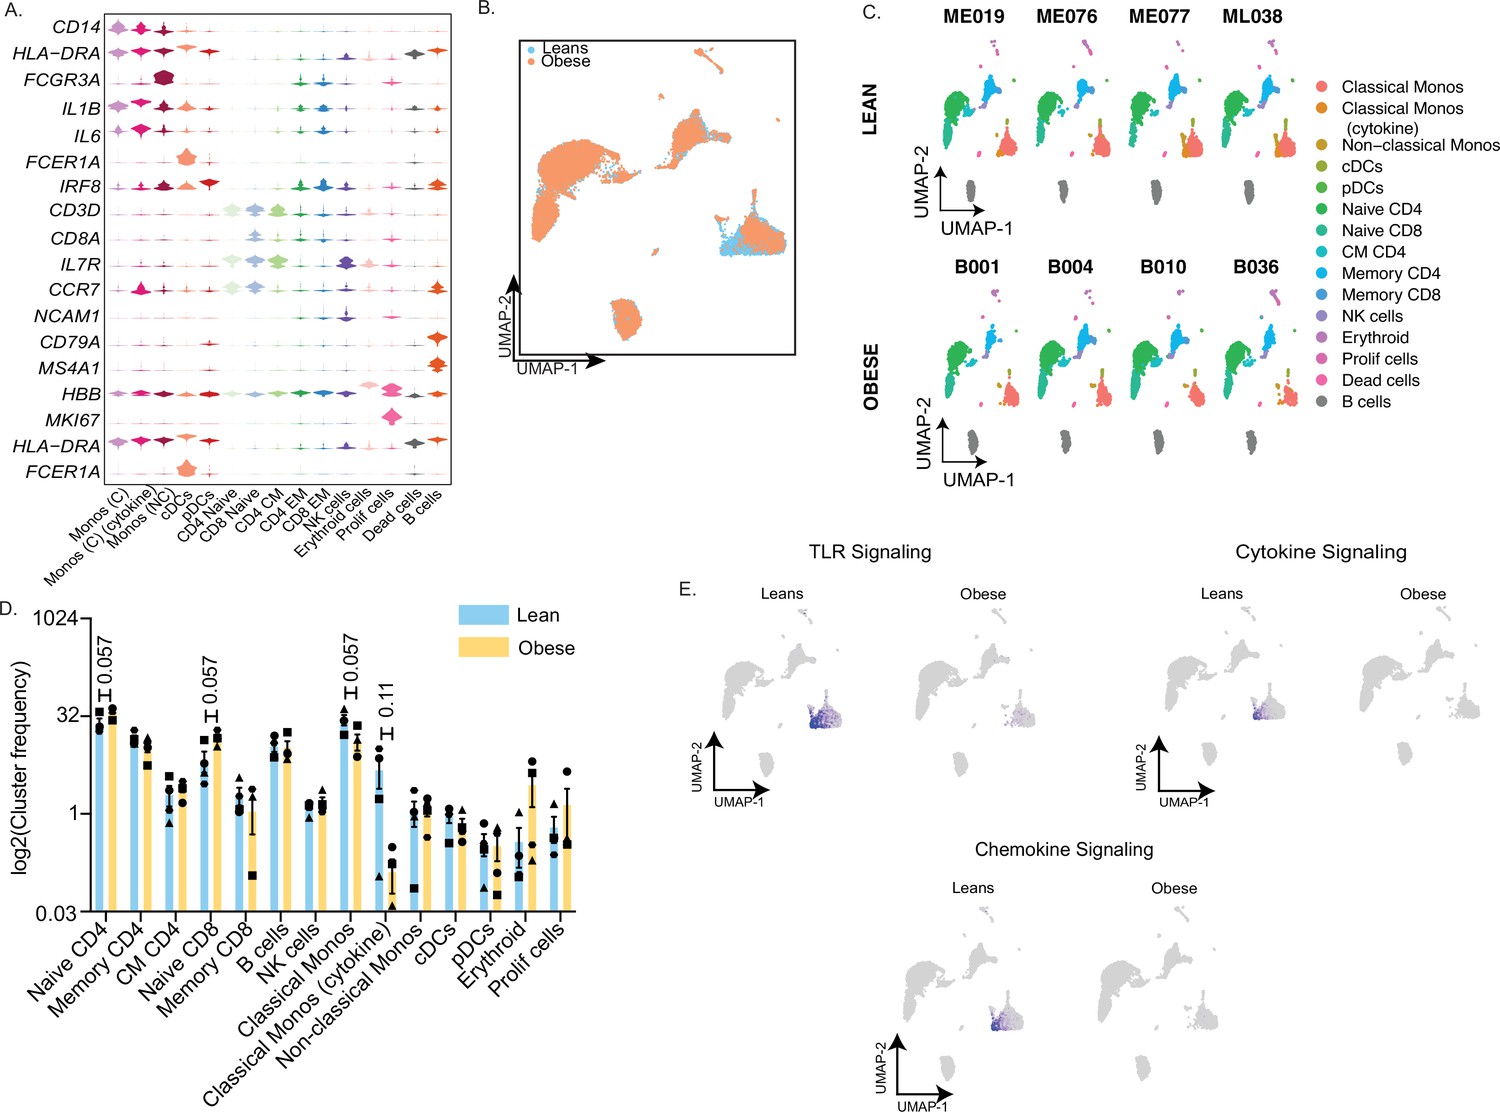
Single cell profiling of umbilical cord blood mononuclear cells.
(A) Violin plot delineating top markers used to define major immune cell subsets in cord blood samples. Candidate genes were selected from the list of top markers predicted by FindAllMarkers function in Seurat (B) UMAP of UCBMC profiles colored by the group – lean (blue) and obese (orange). (C) UMAP of UCBMC profiles split by donor type – lean (top) and obese (bottom). (D) Bar graph comparing relative frequencies of individual immune cell clusters within all cells on the UMAP (E) Feature plot highlighting the relative distribution of module scores in various clusters on the UMAP split by group.
Figure 2 with 1 supplement
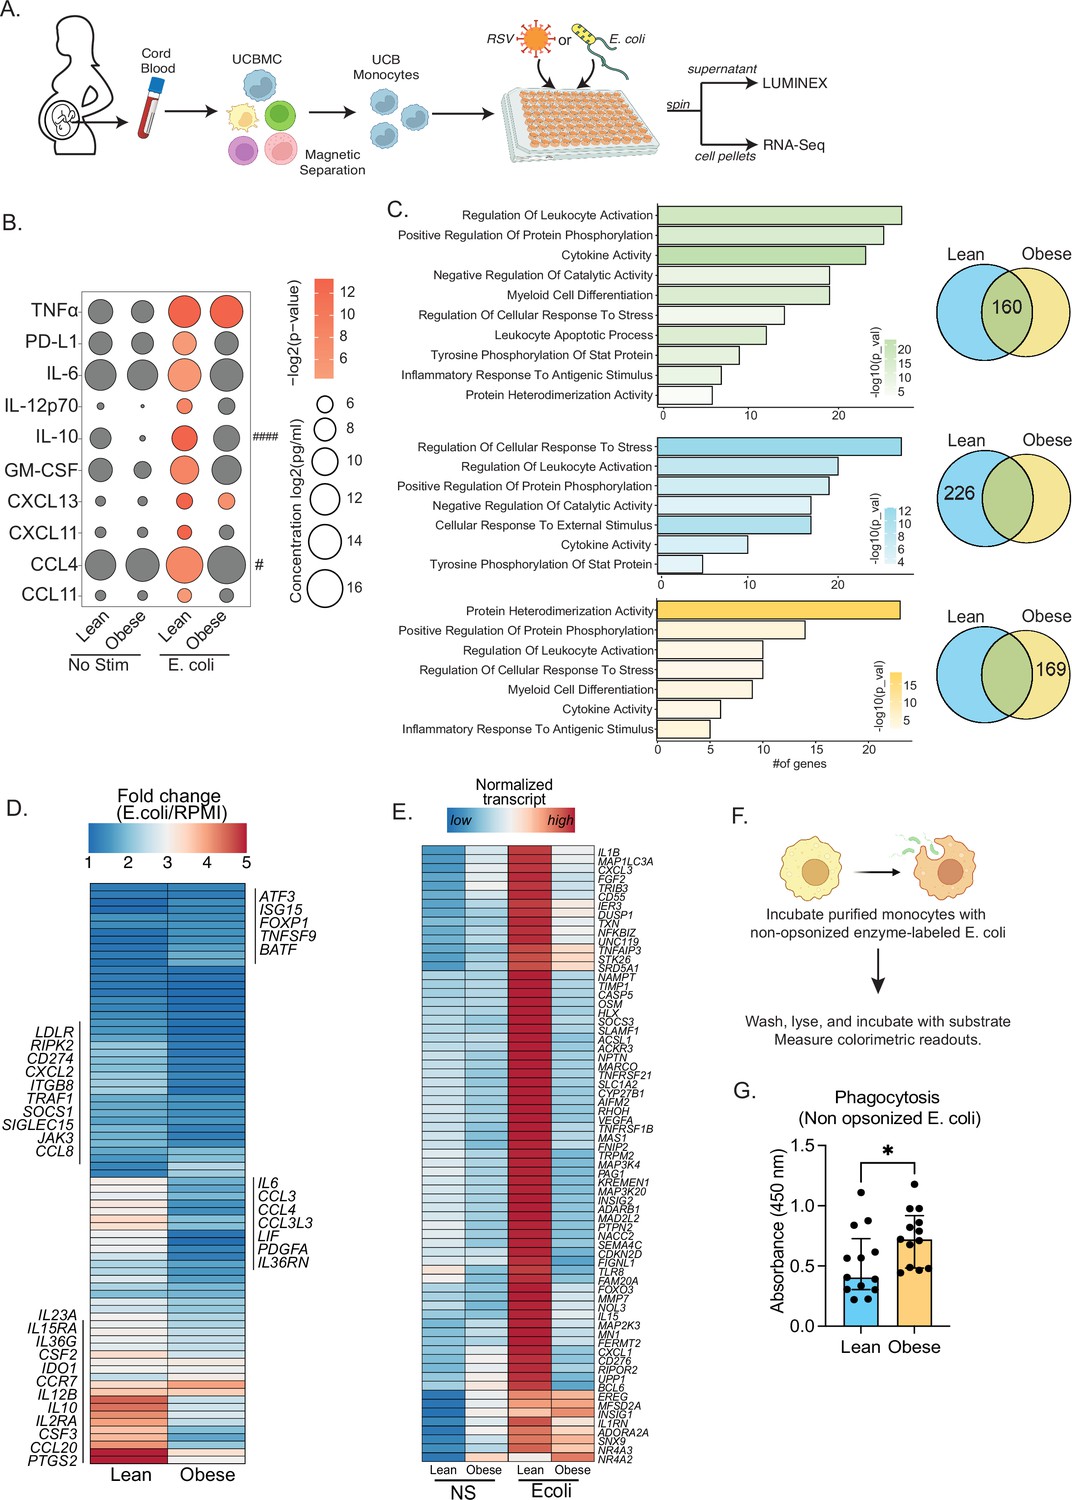
Cord blood monocyte responses to ex vivo E. coli infection are attenuated with maternal obesity.
(A) Experimental design for in vitro bacterial and viral stimulation. Purified monocytes were cultured in the presence/absence of E. coli or RSV for 16 hr. Cell pellets were used for bulk RNA-Seq analyses and supernatants were used for Luminex analyses of secreted cytokines and chemokines. (B) Bubble plot of key secreted factors significantly different following E. coli infection. The size of the bubble represents the quantity of the secreted analyte (log-transformed) whereas color represents statistical significance relative to no stimulation controls. Statistically significant analytes between lean and obese groups are highlighted with # - p<0.05. (C) Venn diagram (right) and corresponding functional enrichment (left) of genes upregulated with E. coli infection in lean and obese groups (Green denotes common DEG, blue DEG unique to lean group, and yellow DEG unique to the obese group) using metascape. The length of the bar indicates the number of genes in each gene ontology (GO) term. Color represents the statistical significance of each GO term. (D) Heatmap comparing fold changes of the genes upregulated in both groups (77 genes) that mapped to GO terms ‘myeloid cell differentiation’, ‘inflammatory response to antigenic stimulus’, ‘leukocyte apoptotic process’, ‘regulation of leukocyte activity’, ‘cytokine activity’, and ‘positive regulation of protein phosphorylation’. (E) Heatmap comparing normalized transcript counts (blue – low to red – high) of genes exclusively upregulated in the lean group following E. coli infection. (F) Experimental design for measuring ex vivo phagocytosis by cord blood monocytes. (G) Bar graph depicting colorimetric readout of phagocytosed E. coli particles by UCB monocyte. * or /#- p<0.05, #### - p<0.0001.
Figure 2—figure supplement 1
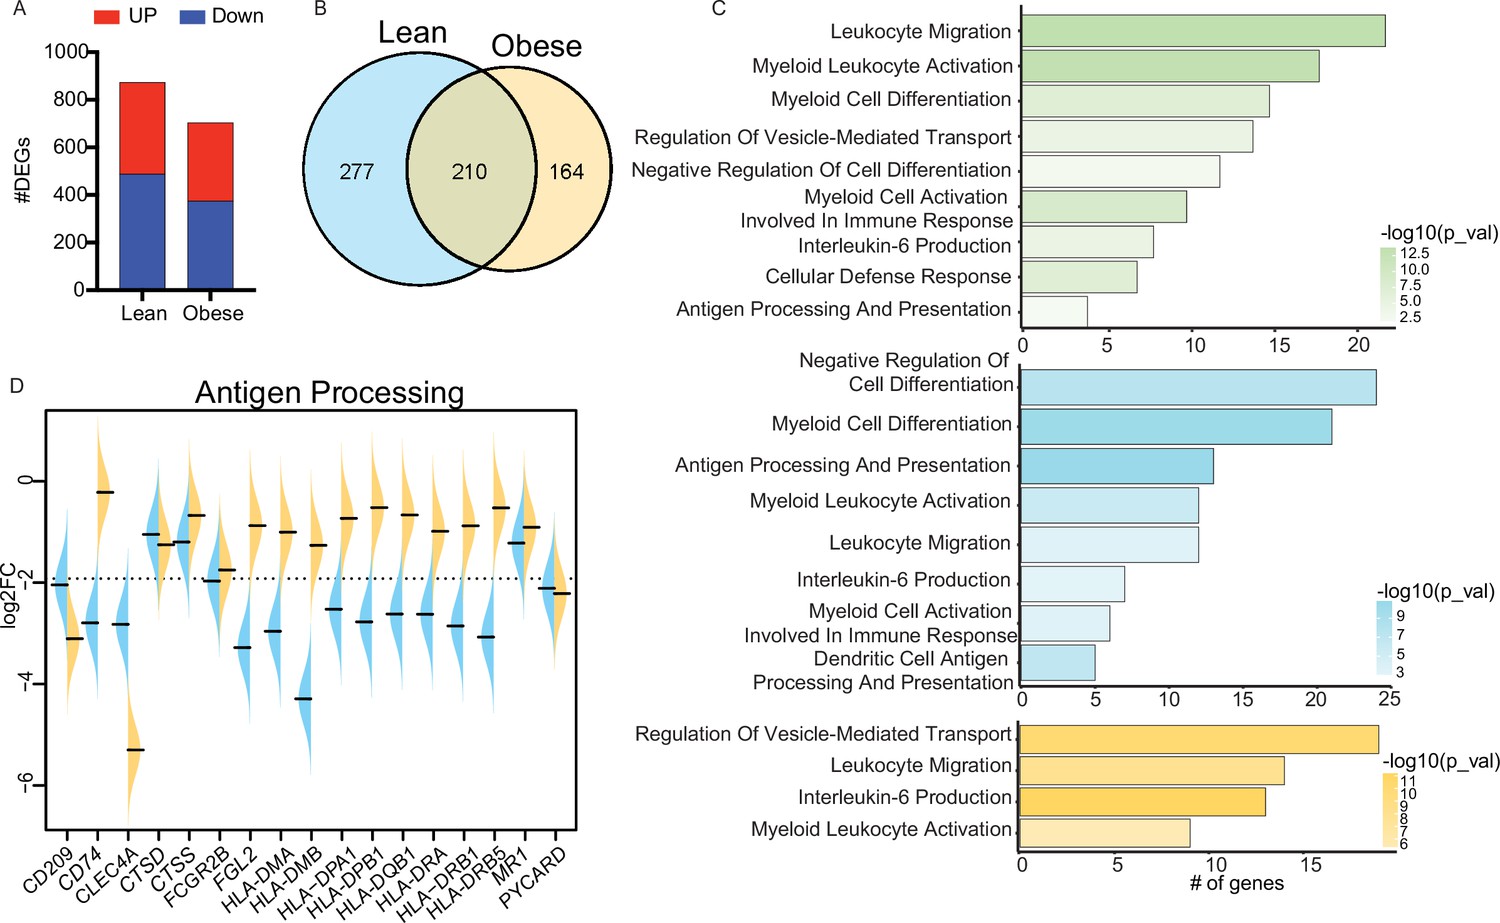
Cord blood monocyte responses to E. coli.
(A) Bar graph representing the number of upregulated (red) or downregulated (blue) differentially expressed genes (DEG) in each group. (B) Venn diagram representing the number of downregulated DEG following E. coli stimulation in each group. (C) Functional enrichment of downregulated DEG detected in both groups (top, green), or exclusively in the lean (middle, blue) and obese (bottom, orange) groups. (D) Violin plots comparing fold changes of DEGs downregulated following E. coli stimulation and involved in antigen presentation.
Figure 3 with 1 supplement
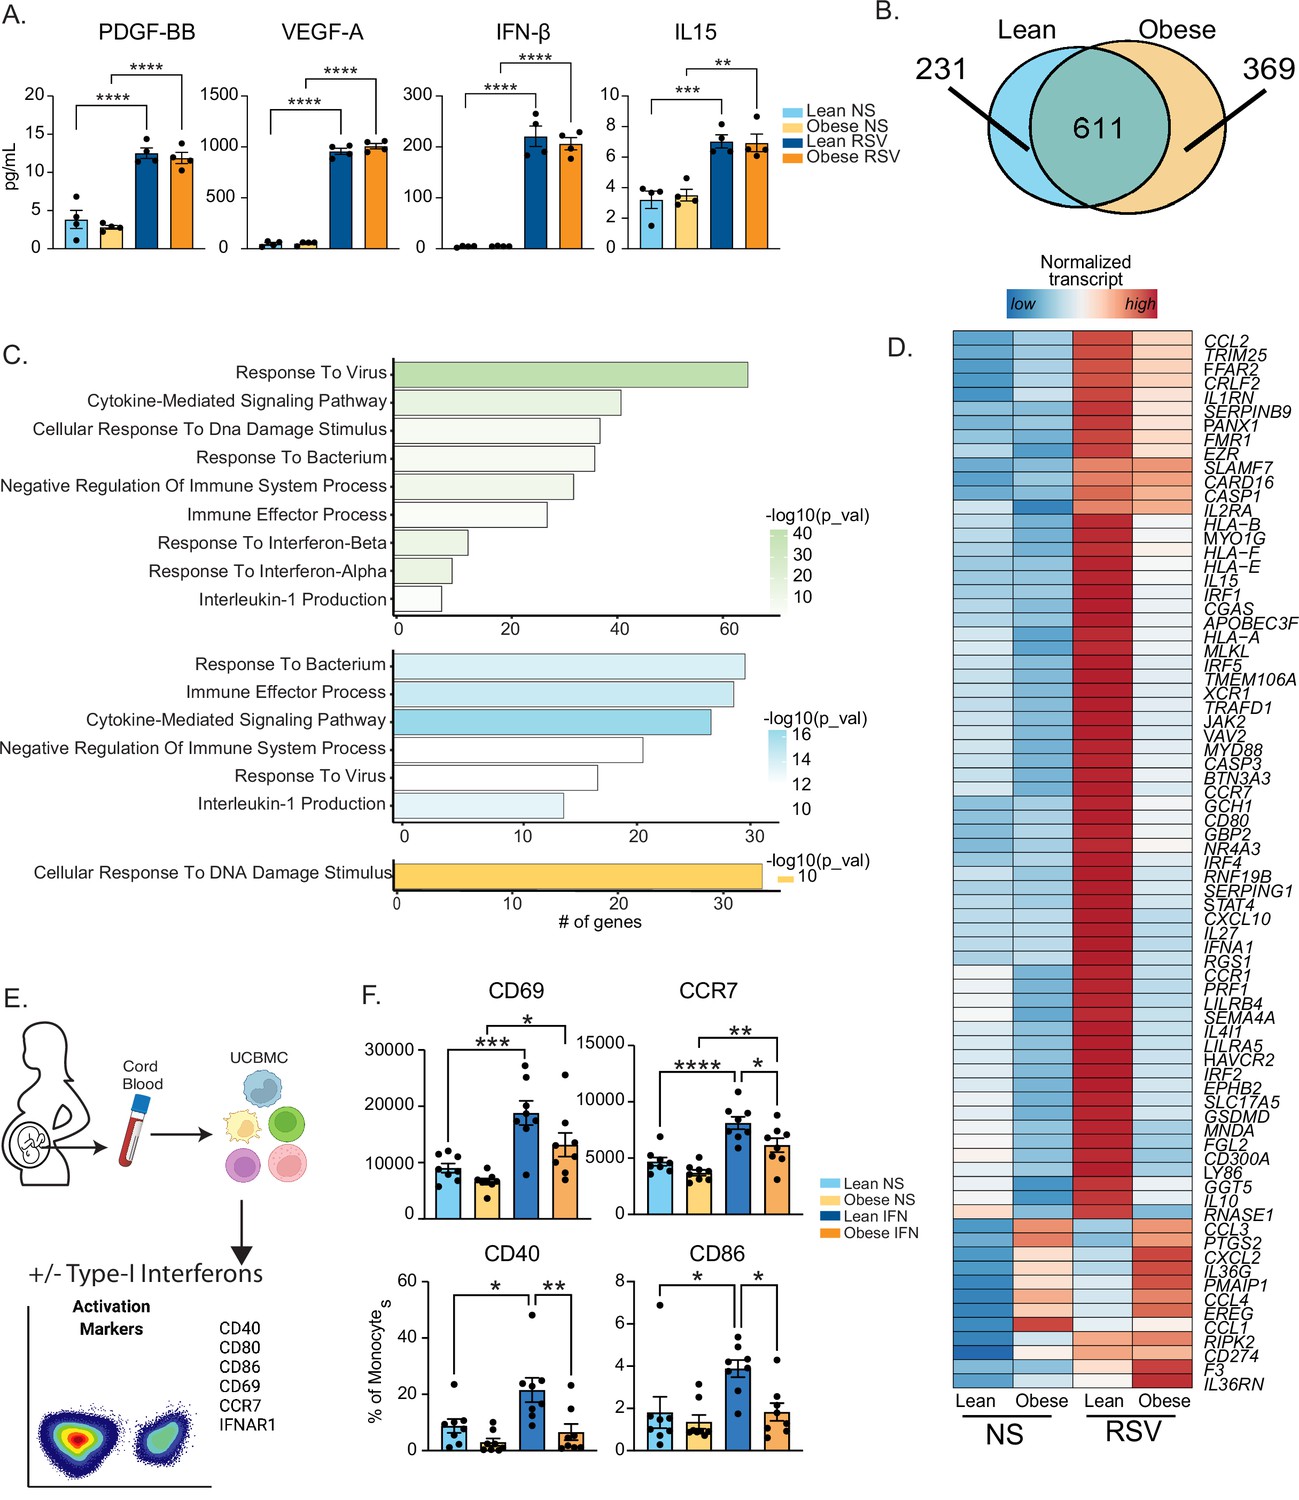
Maternal obesity does not alter acute anti-viral responses by cord blood monocytes but dampens responses to type-I interferon.
(A) Bar graphs comparing levels (mean and ± SEM) of key secreted factors by purified UCB monocytes in response to RSV infection measured using Luminex (n=4/group) compared to no stimulation (NS). (B) Venn diagram comparing DEG upregulated in response to RSV infection relative to no stim controls in lean and obese groups. (C) Functional enrichment of differentially expressed genes (DEG) detected in both groups (green, top), lean only (blue, middle), and obese group only (yellow, bottom) predicted using Metascape. (D) Heatmap comparing normalized transcript counts (blue – low to red – high) of genes exclusively upregulated in the lean group following RSV infection, mapping to GO terms ‘antigen processing and presentation’, ‘negative regulation of cell differentiation’, and ‘myeloid cell differentiation’. (E) Experimental design for testing monocyte responses to type-I IFN (n=8/group). UCBMC were stimulated with a mix of human IFNɑ and IFNβ for 16 hr and activation markers were measured using flow cytometry (n=7–8/group). (F) Bar graphs comparing activation markers on cord blood monocytes in response to type-I IFN. *- p<0.05, **- p<0.01, ***- p<0.001, ****-p<0.0001.
Figure 3—figure supplement 1
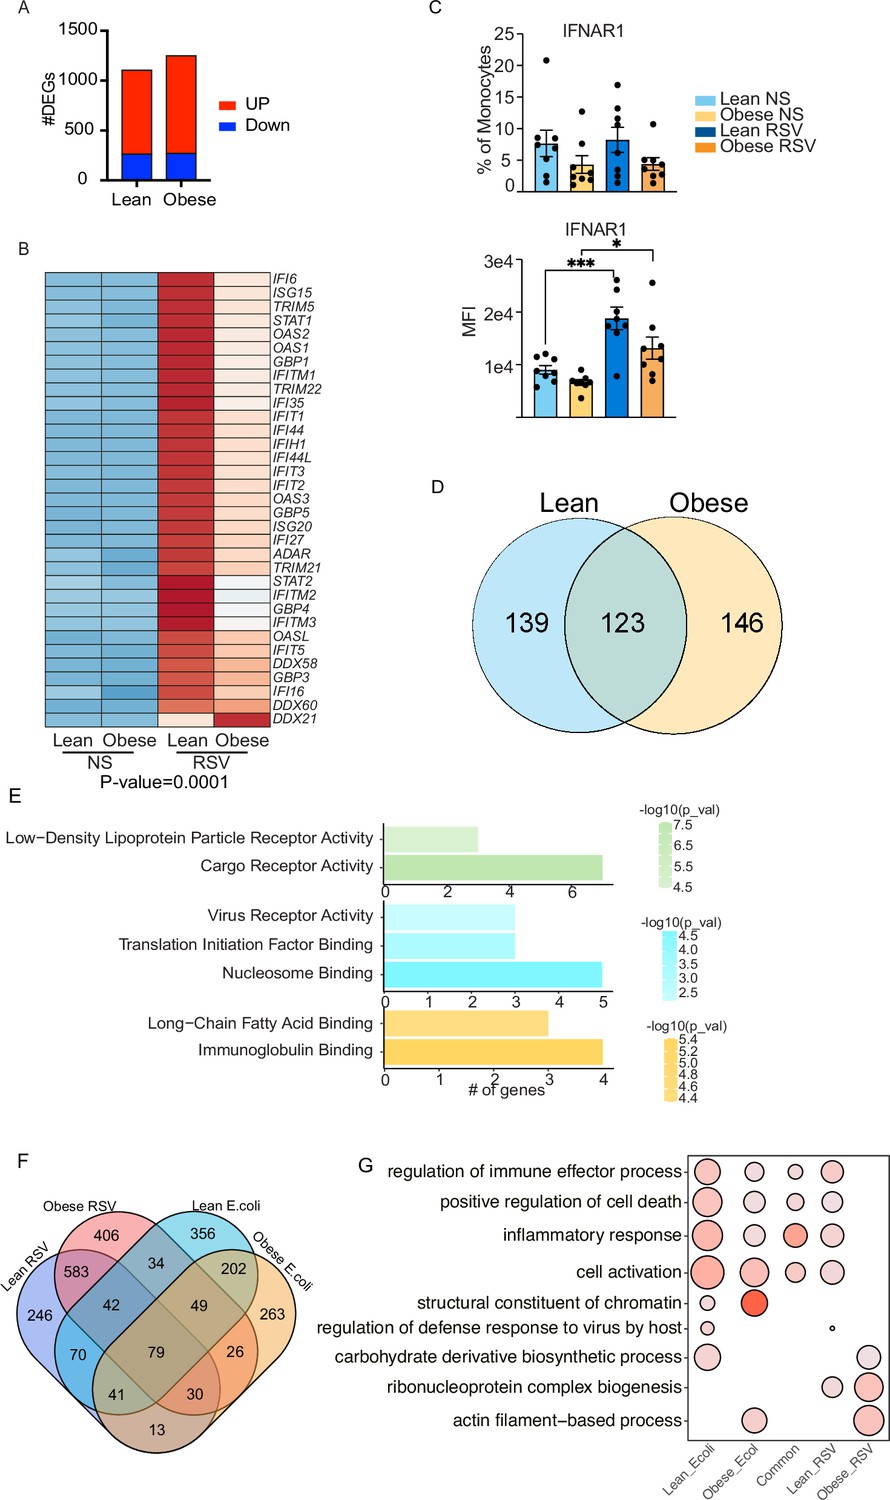
Cord blood monocyte responses to RSV.
(A) Bar graph representing the number of upregulated (red) or downregulated (blue) DEG in each group. (B) Heatmap of upregulated genes involved in interferon signaling pathway. (C) Surface protein levels of interferon receptor 1 (IFNAR1) represented as the fraction of positive cells (top) or median fluorescent intensity (bottom). *- p<0.05, ***- p<0.001. (D) Venn diagram representing the number of downregulated DEG following RSV stimulation. (E) Functional enrichment of downregulated DEG detected in both groups (top, green), or exclusively in the lean group (top, blue) and obese group (bottom, orange). (F) Four-way venn comparing overall gene expression (both up- and down-regulated genes) changes following E. coli and RSV infections. (G) Five way functional enrichment of unique DEG and the 79 DEG induced in all groups induced following in vitro infection with E. coli and RSV.
Figure 4

Epigenetic priming of cord blood monocytes with maternal obesity.
(A) Stacked bar graphs comparing genomic contexts of differentially accessible regions (DARs) open in one group relative to the other. (B) Functional enrichment of genes regulated by DARs overlapping promoters using Metascape. (C–D) Representative pileups of genes more accessible in (C) lean or (D) obese groups. (E) Venn diagrams comparing genes overlapping differentially accessible regions at baseline with gene expression changes following overnight LPS stimulation previously described in this cohort. (F–G) Bar graphs comparing key histone modifications in (F) Histone H3 lysine 4 residue and (G) Histone H3 lysine 9 residues from nuclear extracts of resting UCB monocytes (n=3–4/group). Y-axis represents the percentage signal relative to the total H3 signal detected. **- p<0.01.(H) Bar graph comparing the number of differential H3K9 trimethyl peaks between lean and obese groups at baseline. (I) Context specific annotation of differential H3K9me3 peaks in lean and obese group. (J) Functional enrichment of promoters associated H3K9me3 peaks enriched in obese group. Color of the bar is indicative of statistical significance of enrichment.
Figure 5 with 1 supplement

Epigenetic constraints to LPS stimulation in cord blood monocytes from babies born to mothers with obesity.
(A) Dot plots comparing median fluorescence intensity (MFI) ± SEM of phosphorylated signaling molecules downstream of TLR4 sensing (n=5/group). *- p<0.05, **- p<0.01. (B) Representative brightfield and fluorescent images of stimulated and unstimulated UCB monocytes profiled using imagine flow cytometry (n=3–4/group). NF-kB (p50–AF488) and nucleus (7-AAD) are shown in green and red respectively. Surface stains for CD14 and HLA-DR are shown in aqua and fuchsia respectively. Overlay of NF-kB and nuclei stain was used to determine translocation within CD14 + HLA-DR+monocytes. Bar graph comparing percentage translocated cells following LPS stimulation in lean and obese groups. (C) Bar graph comparing changes in trimethyl modification on H3K9 residues following LPS stimulation (relative to no stimulation controls) detected using flow cytometry. (D) Graph representing the kinetics of ECAR of stimulated monocytes following glucose injection and blockade of glycolysis. (E) Bar graph comparing DAR frequencies in each group following LPS stimulation. (F) Heatmap demonstrating overall accessibility differences following LPS stimulation around the promoter. (G) Over-represented transcription factors identified from motif analysis of DARs more open in lean compared to obese groups following LPS stimulation. X-axis represented percentage of peaks with motifs identified and color represents p-value on log10 scale (H) Pileups of key inflammatory loci post LPS stimulation (I) Four-way Venn of genes accessible (ATAC-Seq) exclusively in the lean group post LPS stimulation with genes exclusively upregulated (RNA-Seq) in the lean group following LPS, E. coli and RSV infection. Select overlapping genes are highlighted. (J) UMAP of single nuclei ATAC-Seq of LPS stimulated and sorted monocytes. (K) Feature plots demonstrating a cluster of activated monocytes (cluster 1). Color intensity represents fragments mapping to open chromatin regions. (L) Proportions of monocytes within each group mapping to activated monocyte cluster. (M) Pileups of inflammatory loci in activated monocytes with/without LPS stimulation. * - p<0.05; ** - p<0.01.
Figure 5—figure supplement 1
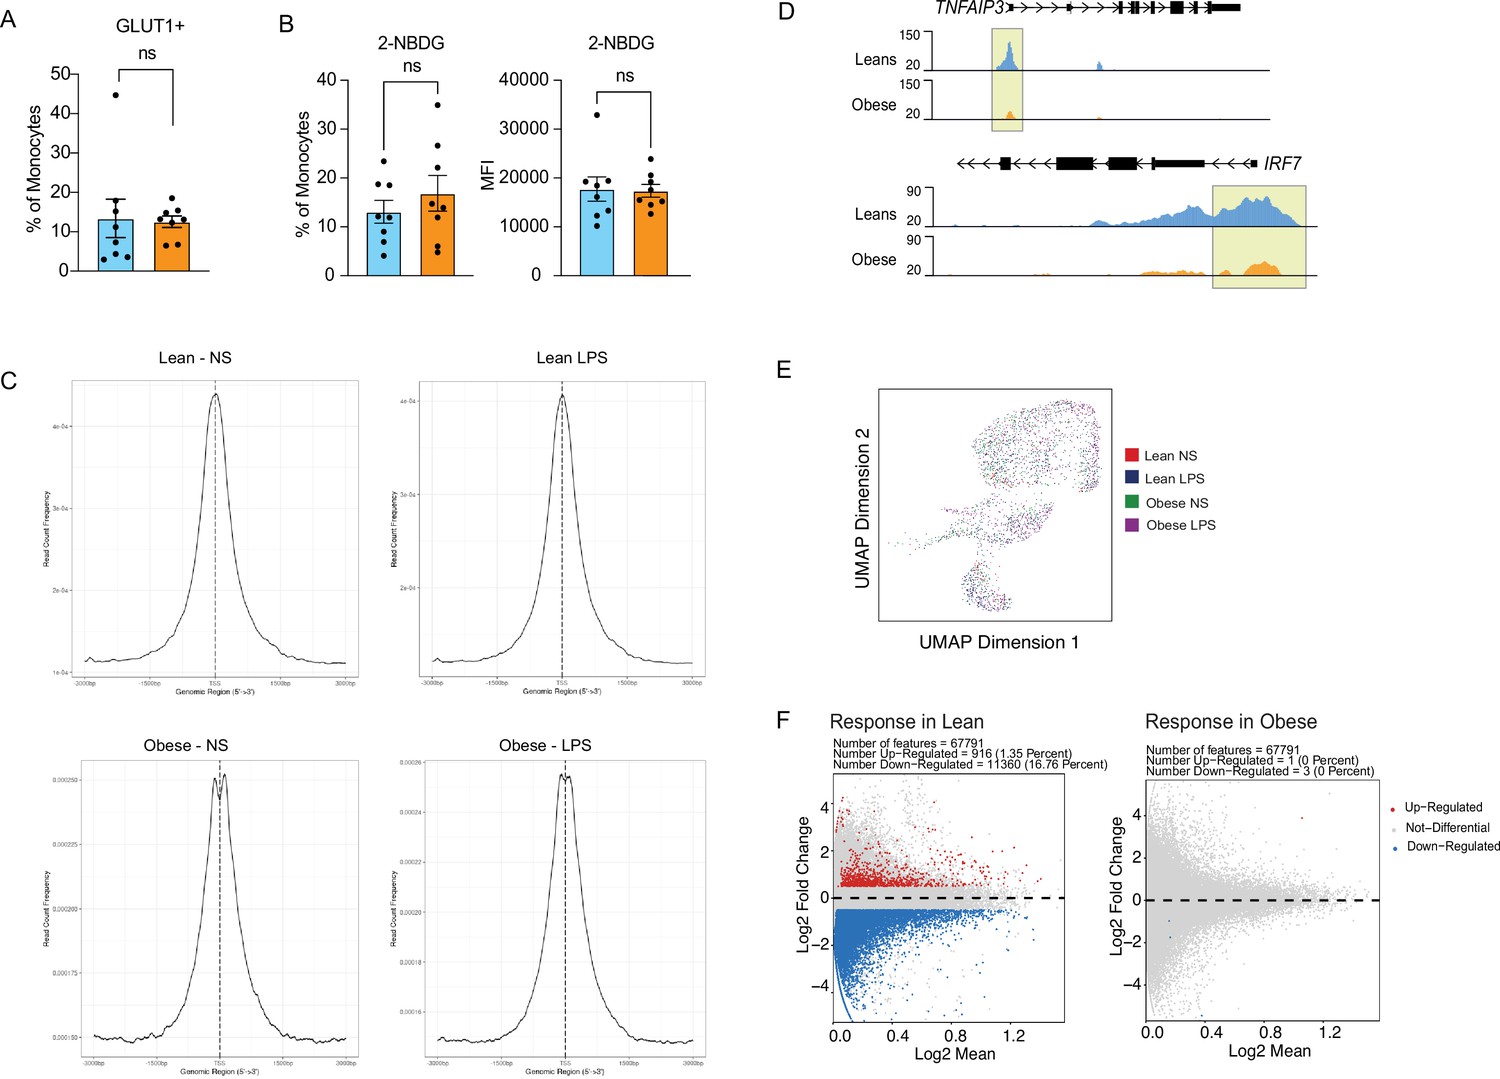
Epigenetic responses to LPS in cord blood monocytes.
(A) Comparison of surface glucose transporter GLUT1 and (B) glucose uptake using glucose analog 2-NBDG (n=7–8/group). Error bars represent medians with interquartile ranges. (C) Transcription Start Site (TSS) enrichment (3000 Kb around transcription start site) of ATAC-Seq peaks in LPS stimulated samples. (D) Pileups of key inflammatory loci post LPS stimulation. (E) UMAP of single-cell chromatin profiles of sorted cord blood monocyte nuclei. Clusters represent the pool of nuclei from lean and obese groups before and after stimulation. (F) MA plots comparing fold changes in chromatin accessibility changes following LPS stimulation in lean (left) and obese (right) groups with upregulated genes in red, downregulated genes in blue, and not differentiated genes in grey.
Figure 6
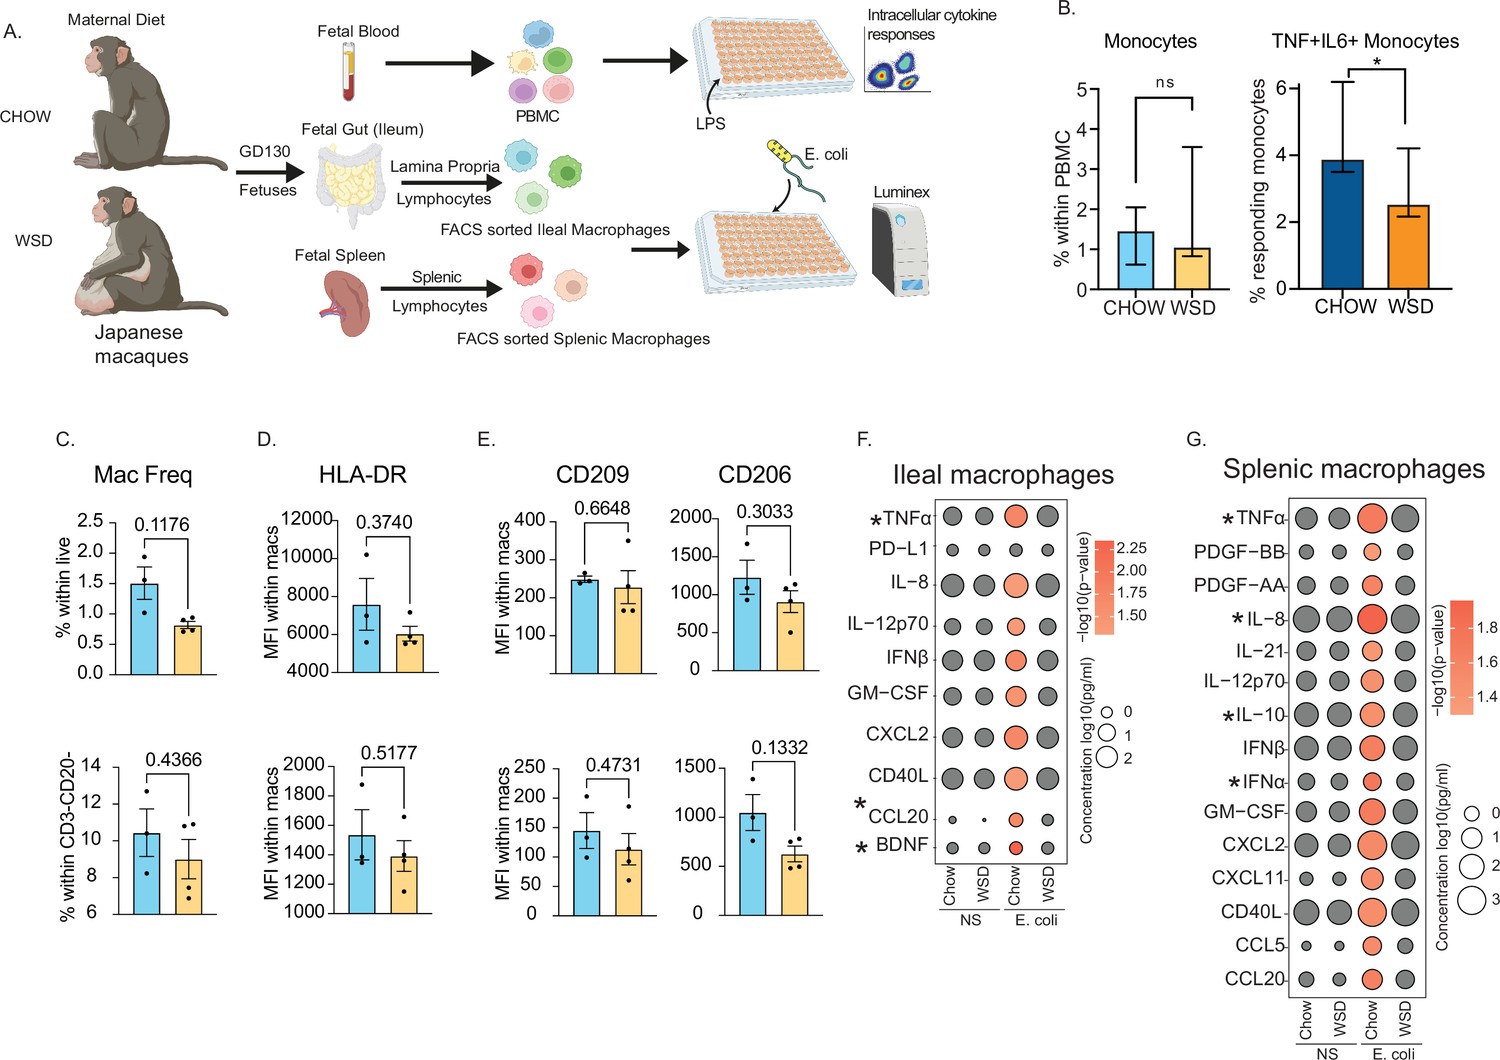
Maternal WSD attenuates fetal monocyte and macrophage cytokine responses to ex vivo stimulation.
(A) NHP model of maternal diet-induced obesity. Fetal (GD130) PBMC, ileal leukocytes, and spleenocytes were obtained from rhesus macaque born to dams on a control chow diet (n=3) and western-style diet (n=4). Fetal macrophages from ileal lamina propria lymphocytes and splenocytes were FACS-sorted and cultured overnight with E. coli. Supernatants were collected and cytokines/chemokines were measured using Luminex. (B) Bar graph representing the frequency (mean and ± SEM) of responding fetal monocytes to LPS in PBMC isolated from GD130 fetal circulation measured by intracellular cytokine staining. (C) Frequencies of CD14 + HLA-DR+macrophages within live total ileal leukocytes (top) or live CD3-CD20- leukocytes (bottom) (D–E) Median fluorescence intensity (MFI) of (D) M1-associated HLA-DR and (E) M2-associated CD209 and CD206 within live macrophage population in ileum (top) and spleen (bottom). (F–G) Bubble plots comparing significantly different cytokine/chemokine levels in response to E. coli stimulation in (F) gut (ileum) and (G) splenic macrophages. Statistical differences between chow and WSD groups are highlighted. *-p<0.05.
Tables
Table 1
Cohort characteristics.
| Lean | Obese | Stats | ||
|---|---|---|---|---|
| * Enrolled | 43 | 36 | ||
| Maternal age at delivery (years) | 33.1±4.4 | 30.7±4.9 | 0.058* | |
| Pre-pregnancy BMI (kg/m²) | 21.9±1.7 | 38.2±8.4 | <0.0001* | |
| Gestational age at delivery (weeks) | 39.6±1.4 | 39.3±1.4 | 0.374* | |
| Fetal sex (Female %) | 39.5 | 38.9 | 0.47† | |
| Mode of delivery (%) | Cesarean | 30.23 | 55.55 | 0.003† |
| Vaginal | 62.79 | 25.00 | ||
| Unknown | 6.97 | 19.44 | ||
| Ethnicity (%) | Asian | 2.32 | 0.00 | 0.094† |
| Hispanic | 6.97 | 25.00 | ||
| Caucasian (non-hispanic) | 88.37 | 66.66 | ||
| More than one race | 0.00 | 2.77 | ||
| Unknown/Declined to state | 2.32 | 5.55 | ||
-
*
Mann-Whitney T-test.
-
†
Chi-squared test.
Additional files
-
MDAR checklist
- https://cdn.elifesciences.org/articles/81320/elife-81320-mdarchecklist1-v2.docx
-
Supplementary file 1
Donor contributions to scRNAseq UMAP .
- https://cdn.elifesciences.org/articles/81320/elife-81320-supp1-v2.xlsx
Download links
A two-part list of links to download the article, or parts of the article, in various formats.
Downloads (link to download the article as PDF)
Open citations (links to open the citations from this article in various online reference manager services)
Cite this article (links to download the citations from this article in formats compatible with various reference manager tools)
Maternal obesity blunts antimicrobial responses in fetal monocytes
eLife 12:e81320.
https://doi.org/10.7554/eLife.81320


