Dissecting the phase separation and oligomerization activities of the carboxysome positioning protein McdB
- Department of Molecular, Cellular, and Developmental Biology, University of Michigan-Ann Arbor, United States
- Department of Biological Chemistry, University of Michigan-Ann Arbor, United States
Figures
Figure 1 with 2 supplements
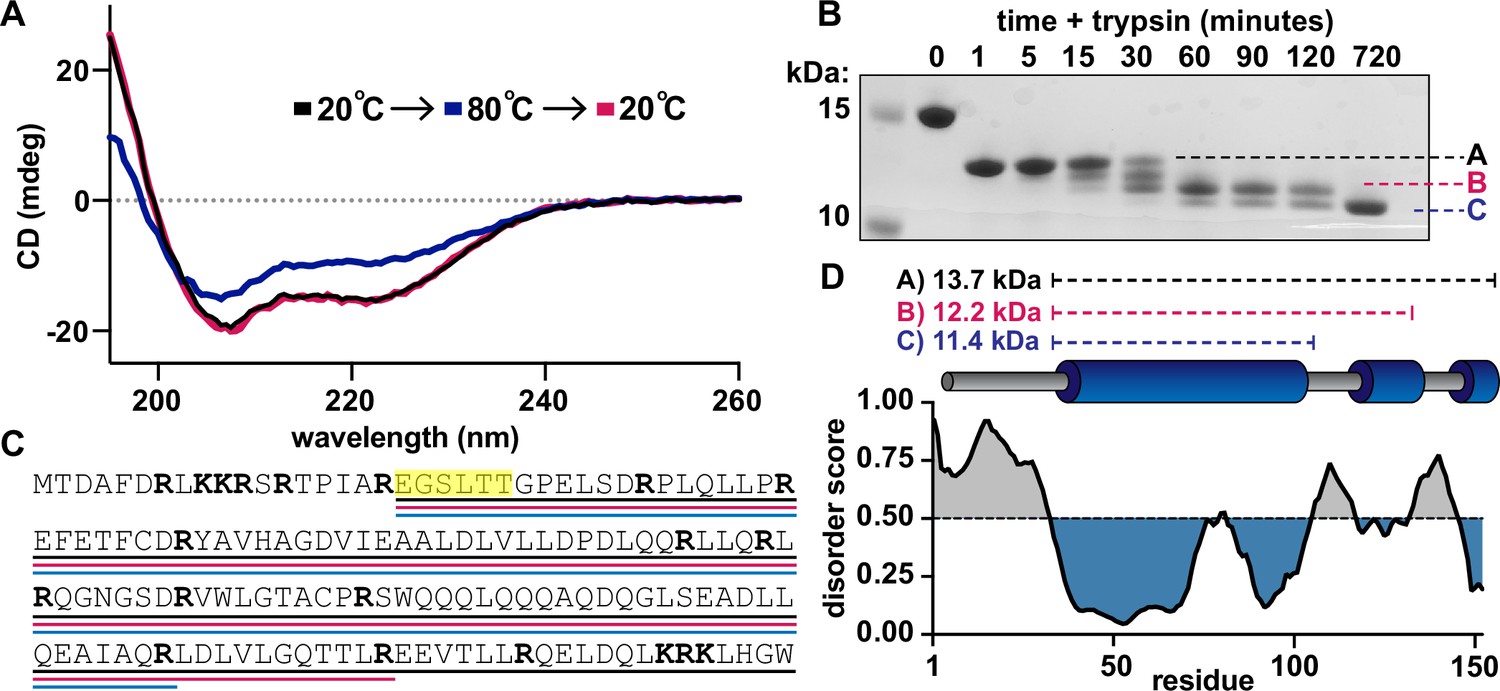
Defining a domain architecture of Se7942 McdB.
(A) Circular dichroism (CD) spectra of McdB at 20°C (black), 80°C (blue), and then returned to 20°C (magenta). Spectra show α-helical structure resilient to heat denaturation. (B) Sodium dodecyl sulfate–polyacrylamide gel electrophoresis (SDS–PAGE) analysis of trypsin-digested McdB sampled over digestion time. Bands labeled A, B, and C were isolated and N-terminally sequenced. (C) Amino acid sequence of McdB with basic residues (Lys-K and Arg-R) in bold. Regions corresponding to bands A, B, and C from panel B are underlined in black, magenta, and blue, respectively. Amino acids determined through N-terminal sequencing of bands A, B, and C are highlighted yellow. (D) Structural model of Se7942 McdB. Regions corresponding to bands A, B, and C are indicated with predicted molecular weights (MWs) (top). Predicted secondary structure of McdB (middle) aligned with a Predictor of Natural Disorder Regions (PONDR) plot using the VLXT algorithm (bottom) with disordered regions colored gray and predicted α-helical domains in blue.
-
Figure 1—source data 1
Sodium dodecyl sulfate–polyacrylamide gel electrophoresis (SDS–PAGE) gel corresponding to the trypsin digest gel in Figure 1B.
Bands A, B, and C as well as the full-length McdB are labeled.
- https://cdn.elifesciences.org/articles/81362/elife-81362-fig1-data1-v2.zip
-
Figure 1—source data 2
Spreadsheet containing the raw data for circular dichroism (CD) curves shown in Figure 1A.
- https://cdn.elifesciences.org/articles/81362/elife-81362-fig1-data2-v2.xlsx
Figure 1—figure supplement 1
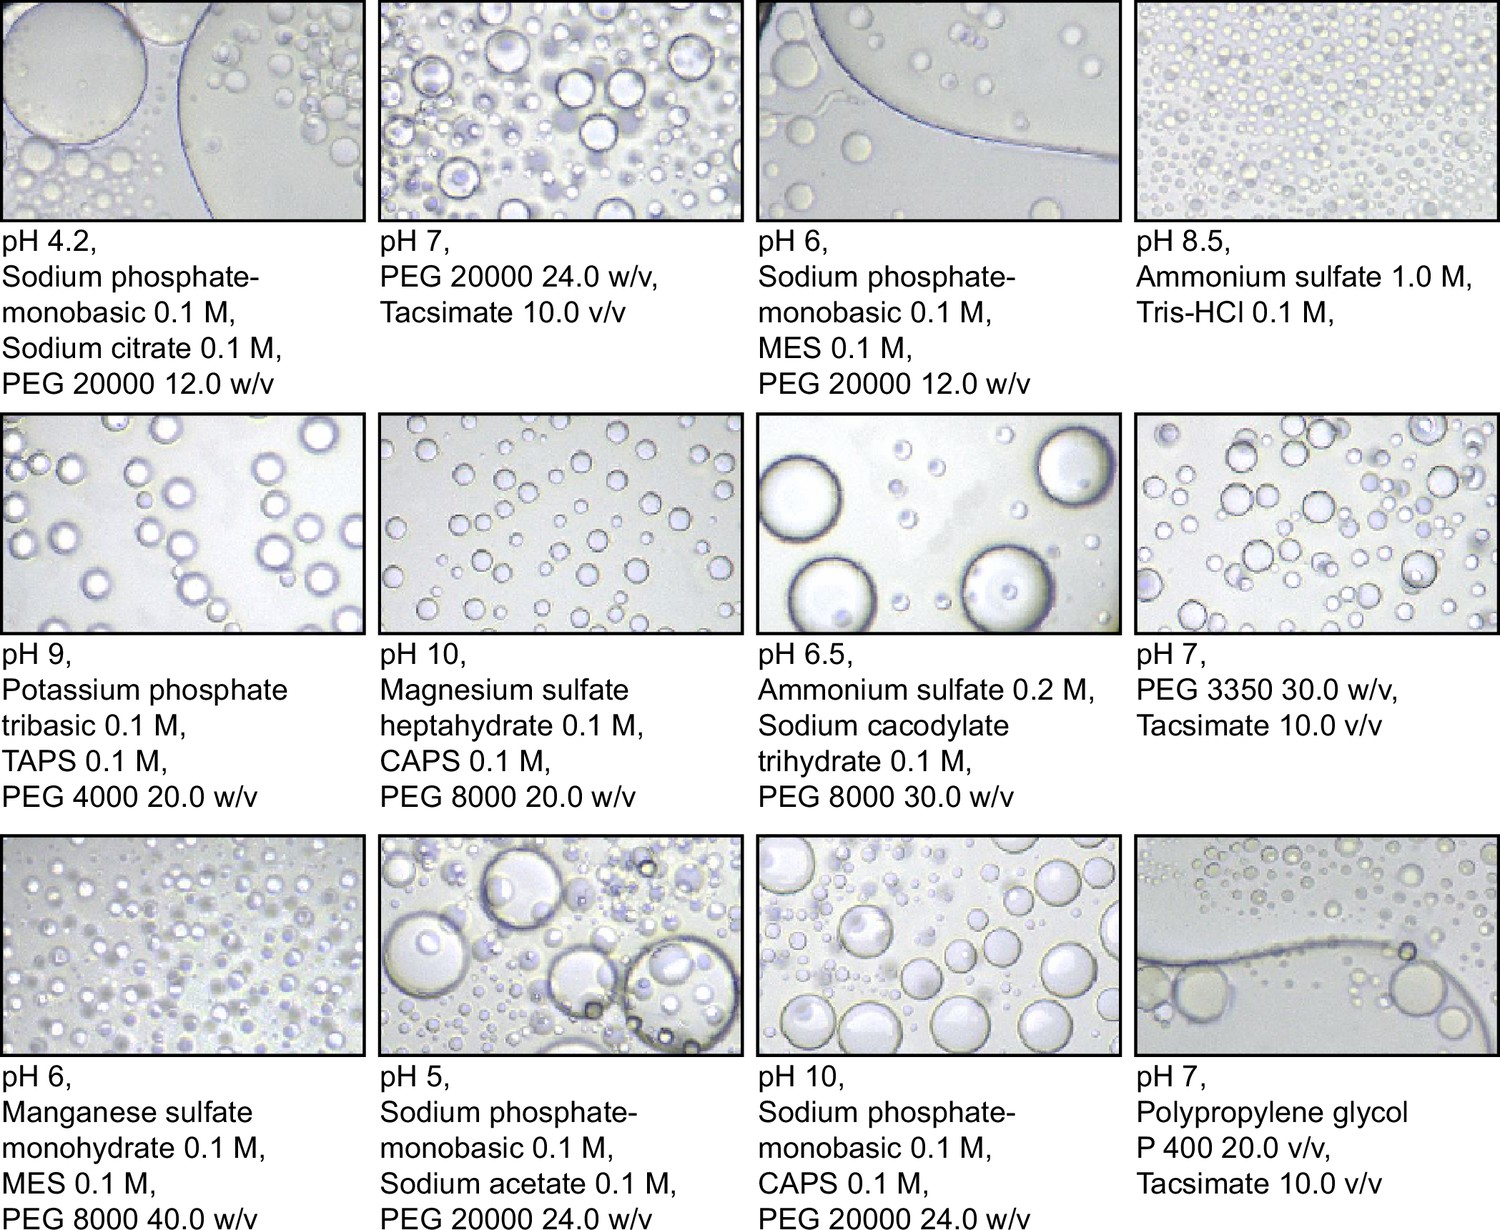
Phase separation of Se7942 McdB across a range of buffer conditions during crystal screens.
Images taken during buffer screens for crystallography. McdB at 10 mg/ml in (50 mM KCl; 10 mM N-cyclohexyl-3-aminopropanesulfonic acid (CAPS), pH 10.2) was diluted into the buffers indicated below each image. All images shown are at the same final concentration and magnification. Images were taken after 24–36 hr post dilution.
Figure 1—figure supplement 2
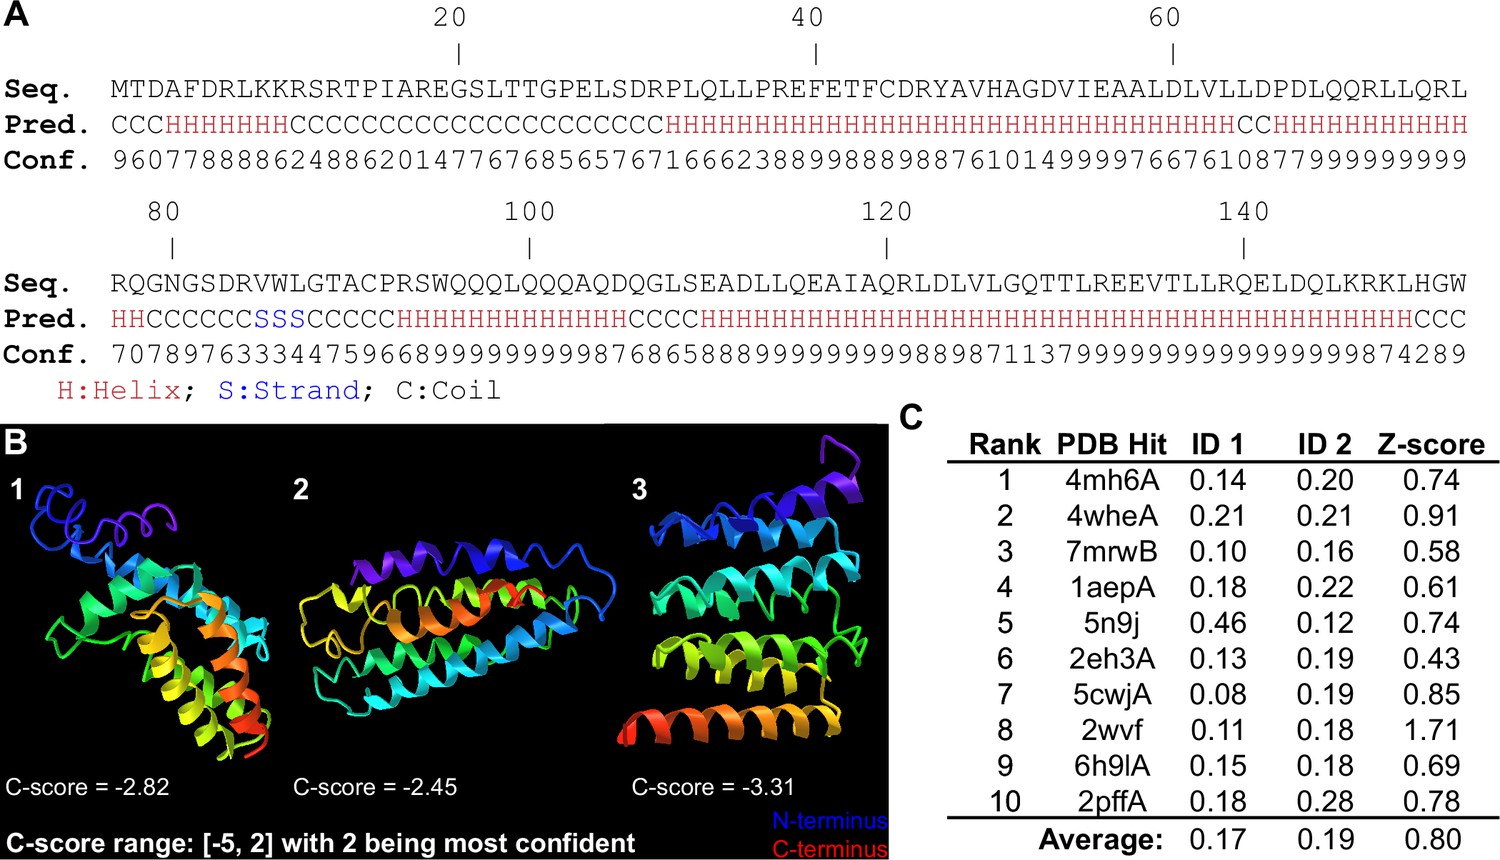
I-TASSER predictions for Se7942 McdB.
(A) McdB amino acid sequence and associated secondary structure predictions by I-TASSER. Each residue has a confidence score that ranges from 0 (least confident) to 9 (most confident). (B) Top 3 final models generated by I-TASSER. Each model is given a C-score that ranges from [−5, 2] with −5 being the least confident and 2 being the most. N-termini are colored blue and C-termini are colored red. (C) A table listing the top 10 PDB templates identified by I-TASSER, which were used for generating the models in panel B. ID1 is the percent sequence identity of the templates in the threading-aligned region with the query sequence. ID2 is the percent sequence identity of the whole template chains with the query sequence. Z-scores are a normalized score of the threading alignments. Alignments with a Z-score >1 equate to good alignment. Overall, I-TASSER was unsuccessful in predicting a structure for McdB.
-
Figure 1—figure supplement 2—source data 1
Spreadsheet with an editable version of the table in Figure 1—figure supplement 2C.
- https://cdn.elifesciences.org/articles/81362/elife-81362-fig1-figsupp2-data1-v2.zip
Figure 2 with 1 supplement
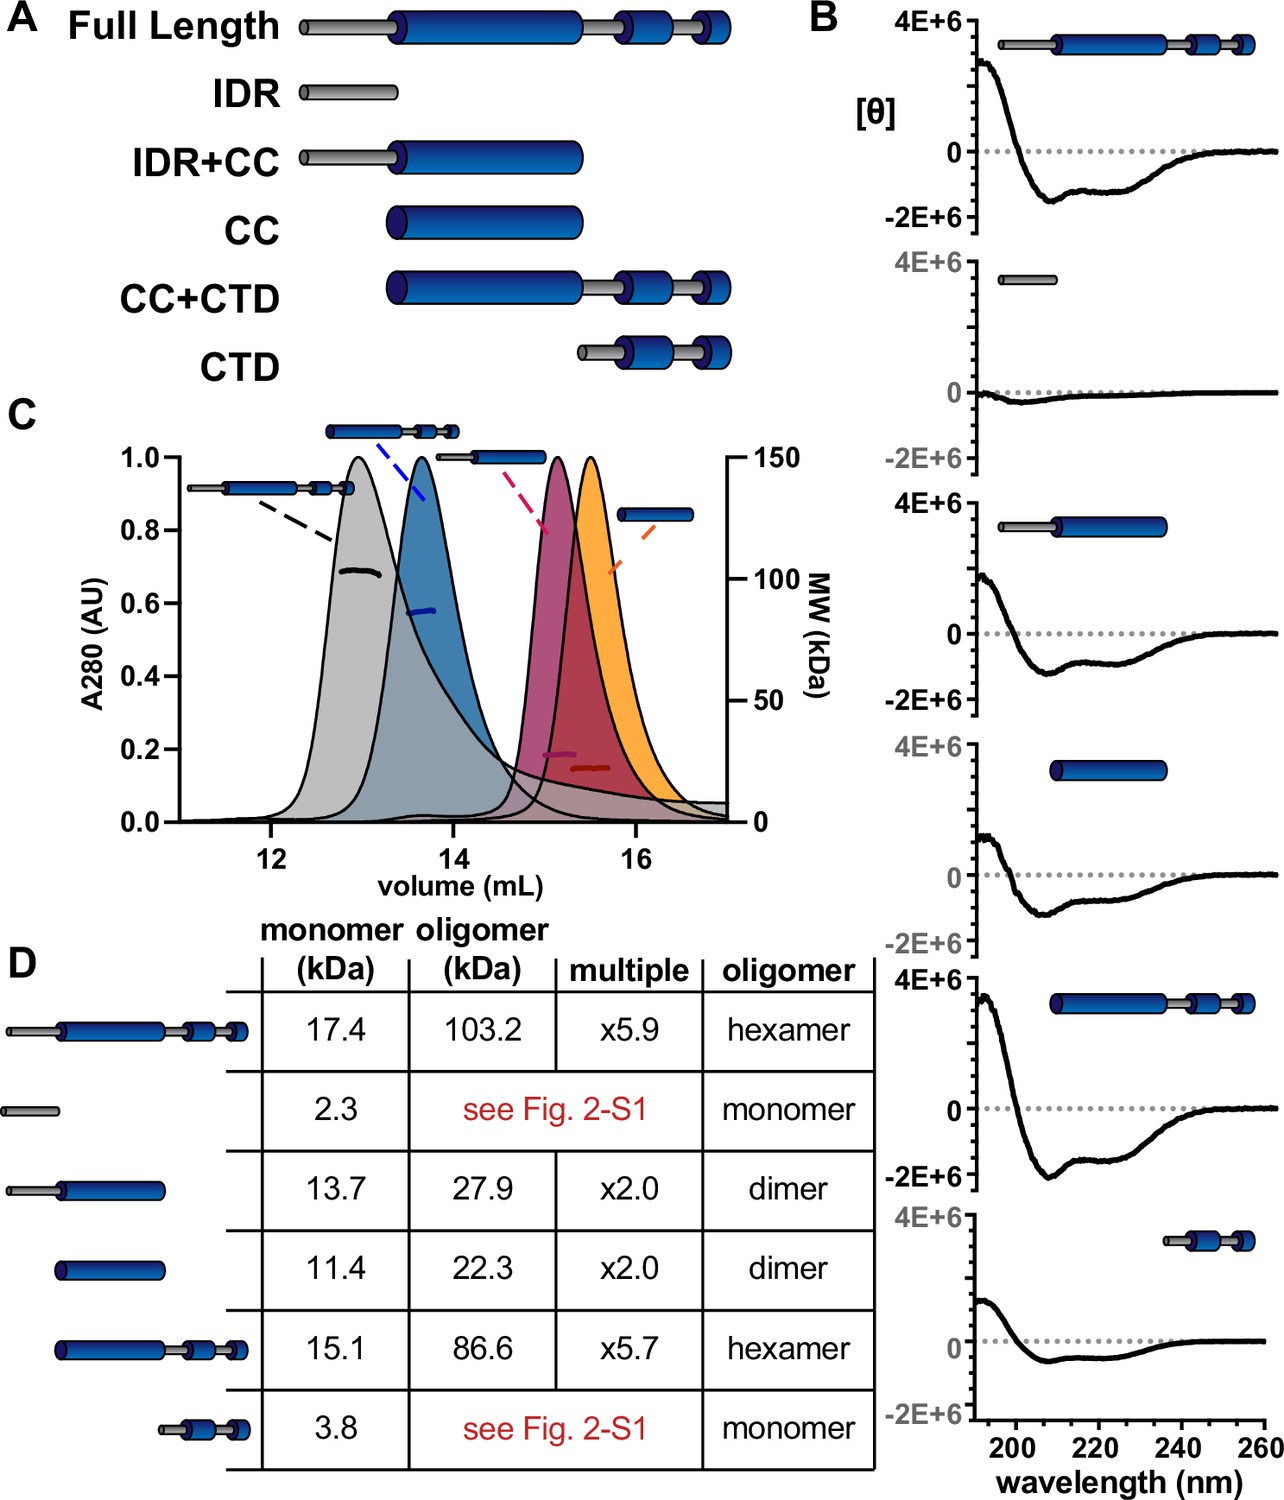
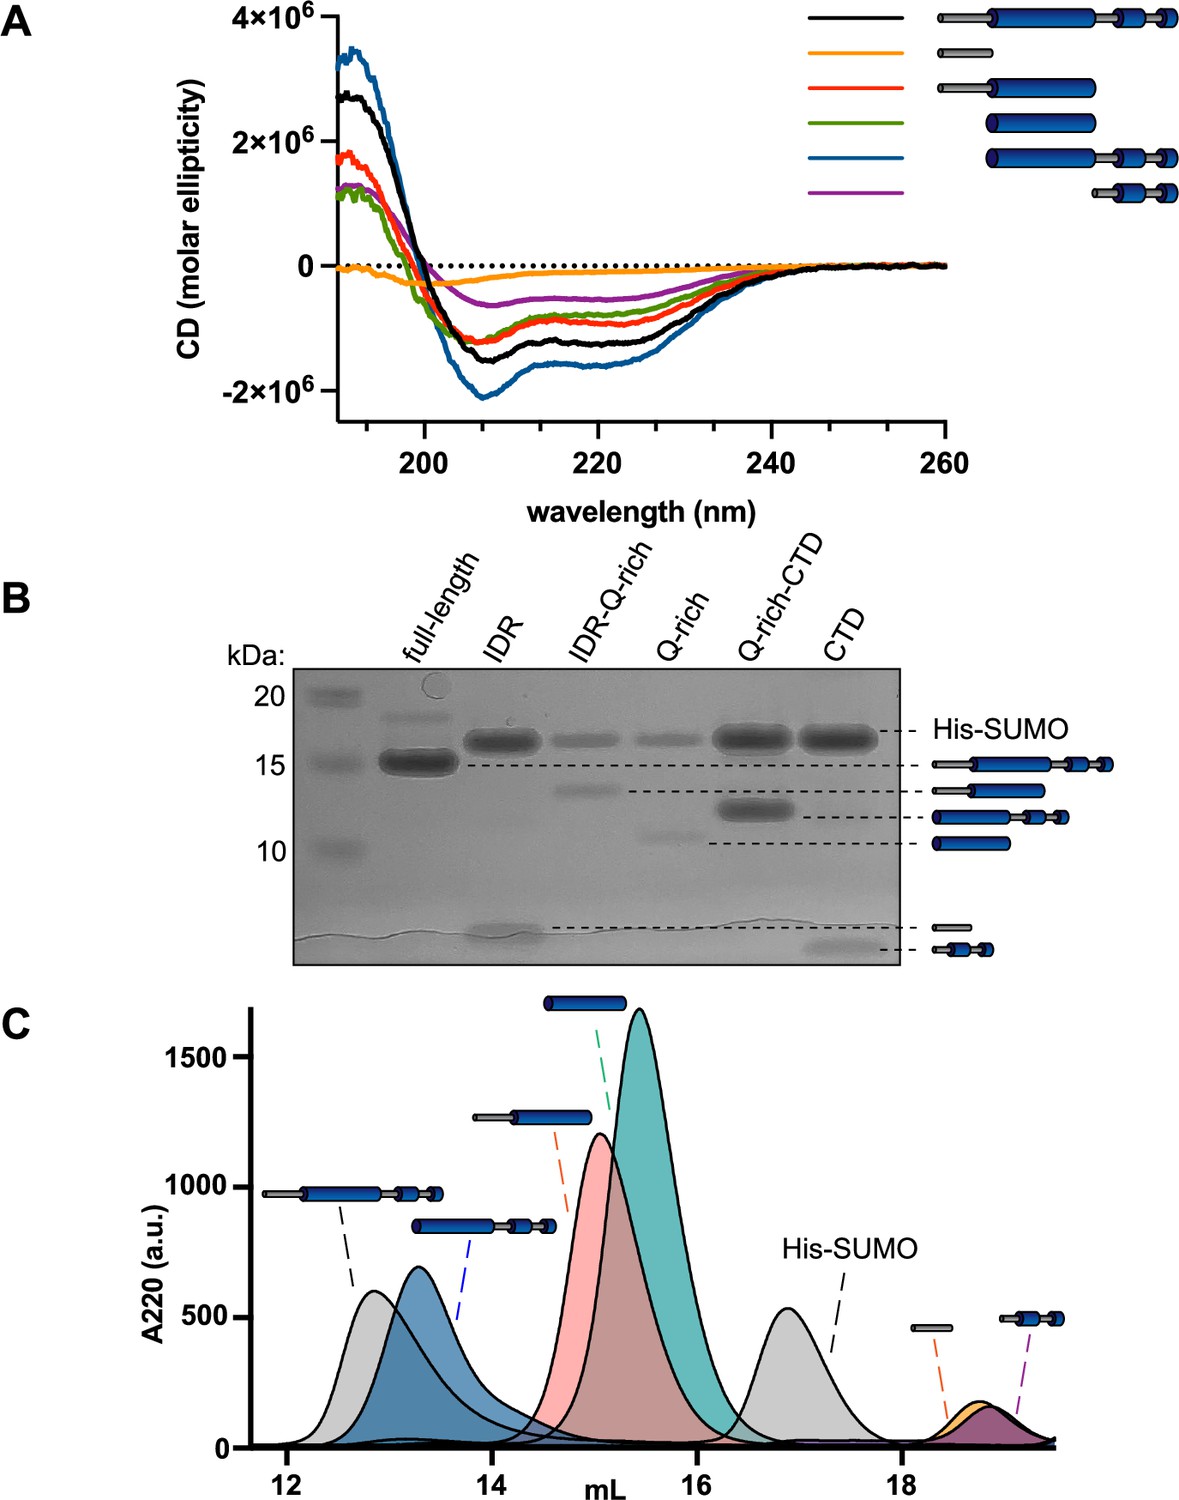
The α-helical domains of McdB form a trimer-of-dimers hexamer.
(A) Illustration of McdB truncations generated based on the predicted domain structure. (B) Circular dichroism (CD) spectra normalized by MW for the indicated McdB truncations. Spectra show α-helical content for all truncations, except for the disordered N-terminal fragment. (C) Size-exclusion chromatography coupled to multi-angle light scattering (SEC-MALS) for full-length McdB and truncation mutants that showed oligomerization activity (see Figure 2—figure supplement 1). (D) Summary of the SEC-MALS data from (C).
-
Figure 2—source data 1
Spreadsheet containing the raw data for circular dichroism (CD) curves shown in Figure 2B.
- https://cdn.elifesciences.org/articles/81362/elife-81362-fig2-data1-v2.xlsx
-
Figure 2—source data 2
Spreadsheet containing the raw data for size-exclusion chromatography coupled to multi-angle light scattering (SEC-MALS) curves shown in Figure 2C and an editable version of the table in Figure 2D.
- https://cdn.elifesciences.org/articles/81362/elife-81362-fig2-data2-v2.xlsx
Figure 2—figure supplement 1
McdB truncations have unique secondary structures and display different oligomeric states.
(A) Circular dichroism (CD) spectra of full-length McdB and truncations. Curves from Figure 2B are overlayed onto a single graph. (B) Sodium dodecyl sulfate–polyacrylamide gel electrophoresis (SDS–PAGE) analysis shows that full-length McdB and all truncation mutants run at a lower molecular weight compared to the His-SUMO solubility tag. (C) Size-exclusion chromatography (SEC) showed that full-length McdB and the coiled-coil (CC) + C-terminal domain (CTD) domain have similar elution profiles, suggesting similar oligomeric forms. The CC domain with and without intrinsically disordered region (IDR) also elute similarly but after full-length and before His-SUMO, suggesting an intermediate oligomer. The IDR and CTD mutants eluted after the His-SUMO tag, showing they remain monomeric.
-
Figure 2—figure supplement 1—source data 1
Sodium dodecyl sulfate–polyacrylamide gel electrophoresis (SDS–PAGE) gel corresponding to the McdB truncation mutants versus the His-SUMO tag as described in Figure 2—figure supplement 1B.
Full-length McdB, each truncation, and the His-SUMO tag are labeled.
- https://cdn.elifesciences.org/articles/81362/elife-81362-fig2-figsupp1-data1-v2.zip
-
Figure 2—figure supplement 1—source data 2
Spreadsheet containing the raw data for circular dichroism (CD) curves shown in Figure 2—figure supplement 1A.
- https://cdn.elifesciences.org/articles/81362/elife-81362-fig2-figsupp1-data2-v2.xlsx
-
Figure 2—figure supplement 1—source data 3
Spreadsheet containing the raw data for SEC curves shown in Figure 2—figure supplement 1C.
- https://cdn.elifesciences.org/articles/81362/elife-81362-fig2-figsupp1-data3-v2.xlsx
Figure 3
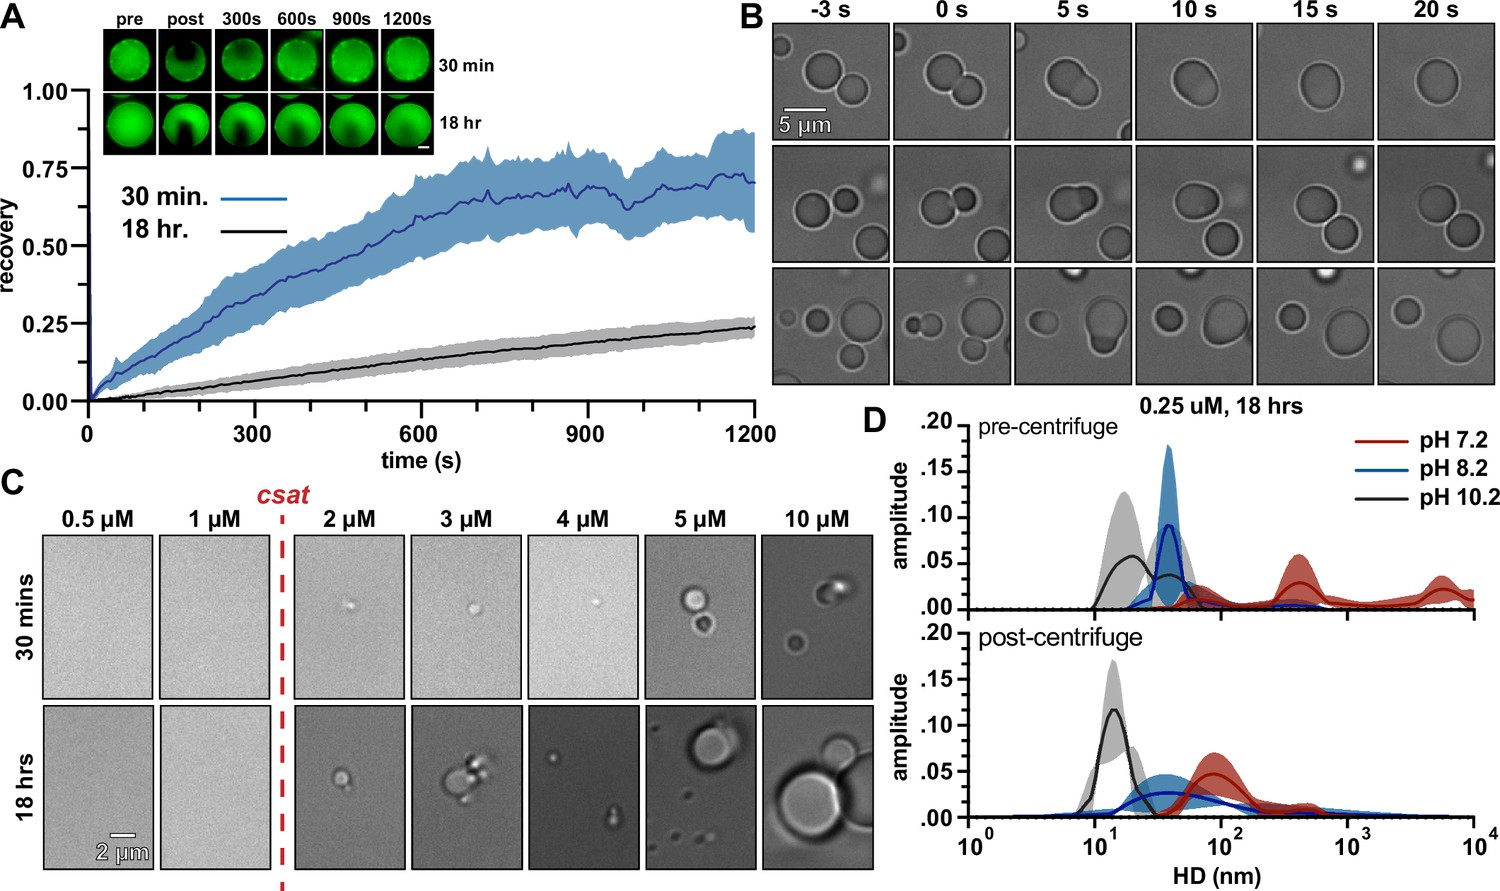
McdB from Se7942 forms liquid-like condensates via pH-dependent phase separation coupled to percolation (PSCP).
(A) Fluorescence recovery after photobleaching (FRAP) of McdB condensates at the indicated time points. Means and standard deviation (SD) from n = 8 condensates are shown. Representative fluorescence microscopy images for condensates incubated at 30 min or 18 hr are shown (inlet, scale bar = 2 µm). (B) Representative differential interference contrast (DIC) microscopy timeseries showing newly formed McdB condensates fusing and relaxing into spheres on the order of seconds. Scale bar applies to all images. (C) Representative DIC microscopy images at the indicated protein concentrations. McdB condensates were seen at and above concentrations of 2 µM, suggesting a saturation concentration (csat) between 1 and 2 µM. Scale bar applies to all images. (D) Dynamic light scattering (DLS) of McdB at a concentration ~1/10 the csat determined from (C) and at increasing pH values as indicated. Samples were analyzed both before (top) and after (below) a 5 min spin at 20,000 × g. Larger ‘networks’ are seen forming at lower pHs, even below the observed csat.
-
Figure 3—source data 1
Spreadsheet containing the raw data for fluorescence recovery after photobleaching (FRAP) curves shown in Figure 3A.
- https://cdn.elifesciences.org/articles/81362/elife-81362-fig3-data1-v2.xlsx
-
Figure 3—source data 2
Spreadsheet containing the raw data for dynamic light scattering (DLS) curves shown in Figure 3D.
- https://cdn.elifesciences.org/articles/81362/elife-81362-fig3-data2-v2.xlsx
Figure 4 with 1 supplement
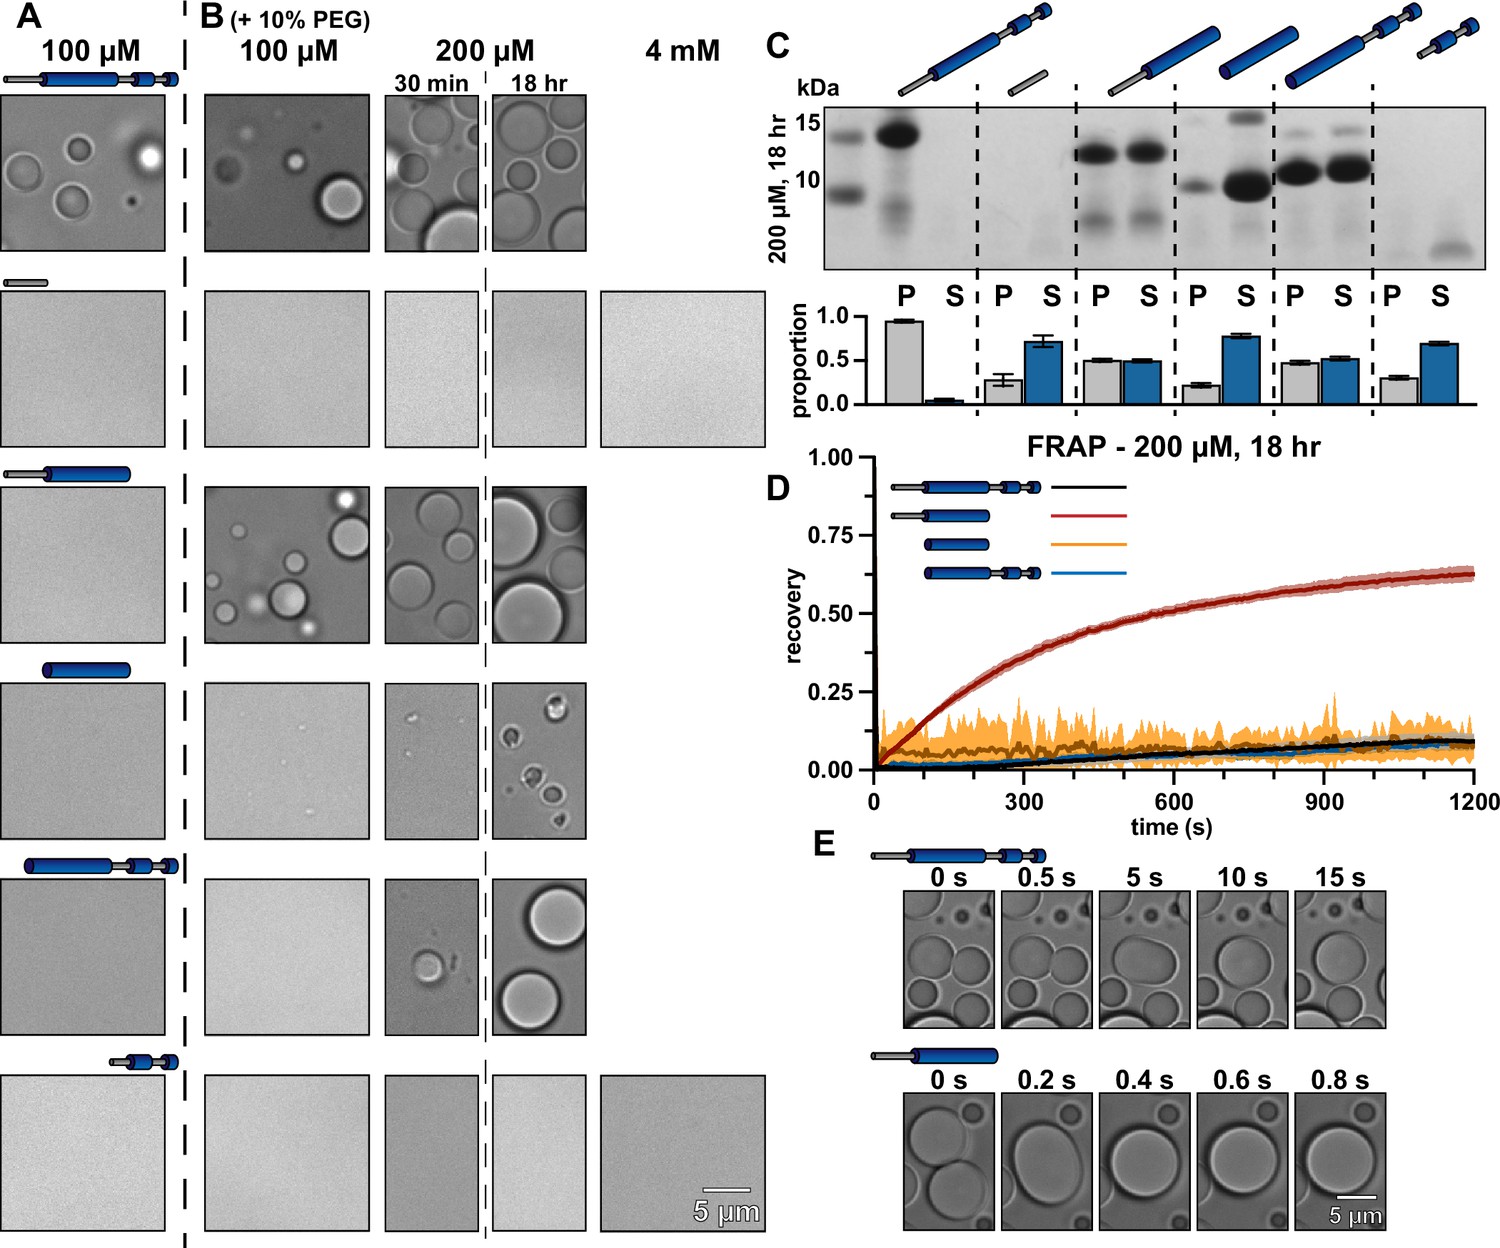
Truncations provide insight into the mechanisms of McdB condensate formation and stabilization.
(A) Representative DIC microscopy images of full-length and truncation mutants of McdB at 100 µM in 150 mM KCl and 20 mM HEPES, pH 7.2. (B) As in (A), but with increasing protein concentration as indicated and with the addition of 10% PEG-8000. Scale bar applies to all images. All domains are required for FL level condensate formation. (C) Condensates at 200 µM after 18 hr were pelleted (P) and run on a sodium dodecyl sulfate–polyacrylamide gel electrophoresis (SDS–PAGE) gel along with the associated supernatant (S) (top). P and S band intensities were then quantified (bottom). Mean and standard deviation (SD) from 3 replicates are shown. (D) Fluorescence recovery after photobleaching (FRAP) of condensates at the indicated condition reveal an increase in dynamics when the N-term intrinsically disordered region (IDR) is present without the C-terminal domain (CTD). Mean and SD from 7 replicates are shown (E) Condensates containing the N-term IDR fuse orders of magnitude more quickly in the absence of the CTD, suggesting a stabilizing interaction between the two termini.
-
Figure 4—source data 1
Sodium dodecyl sulfate–polyacrylamide gel electrophoresis (SDS–PAGE) gel corresponding to the pelleting assay described in Figure 4C.
Full-length McdB and each truncation are labeled. Bands for the pellet and supernatant fractions are labeled.
- https://cdn.elifesciences.org/articles/81362/elife-81362-fig4-data1-v2.zip
-
Figure 4—source data 2
Spreadsheet containing the raw data for gel quantification graphs shown in Figure 4C.
- https://cdn.elifesciences.org/articles/81362/elife-81362-fig4-data2-v2.xlsx
-
Figure 4—source data 3
Spreadsheet containing the raw data for fluorescence recovery after photobleaching (FRAP) curves shown in Figure 4D.
- https://cdn.elifesciences.org/articles/81362/elife-81362-fig4-data3-v2.xlsx
Figure 4—figure supplement 1

McdB forms liquid-like condensates in both Ficoll and polyethylene glycol.
(A) Representative DIC microscopy images for WT McdB at 100 µM in 100 mM KCl, 20 mM HEPES, pH 7.2, and the addition of the indicated crowding agent. (B) Time course of images from (A) shows that condensates fuse and relax into spheres on similar timescales, regardless of the crowding agent used.
Figure 5 with 3 supplements
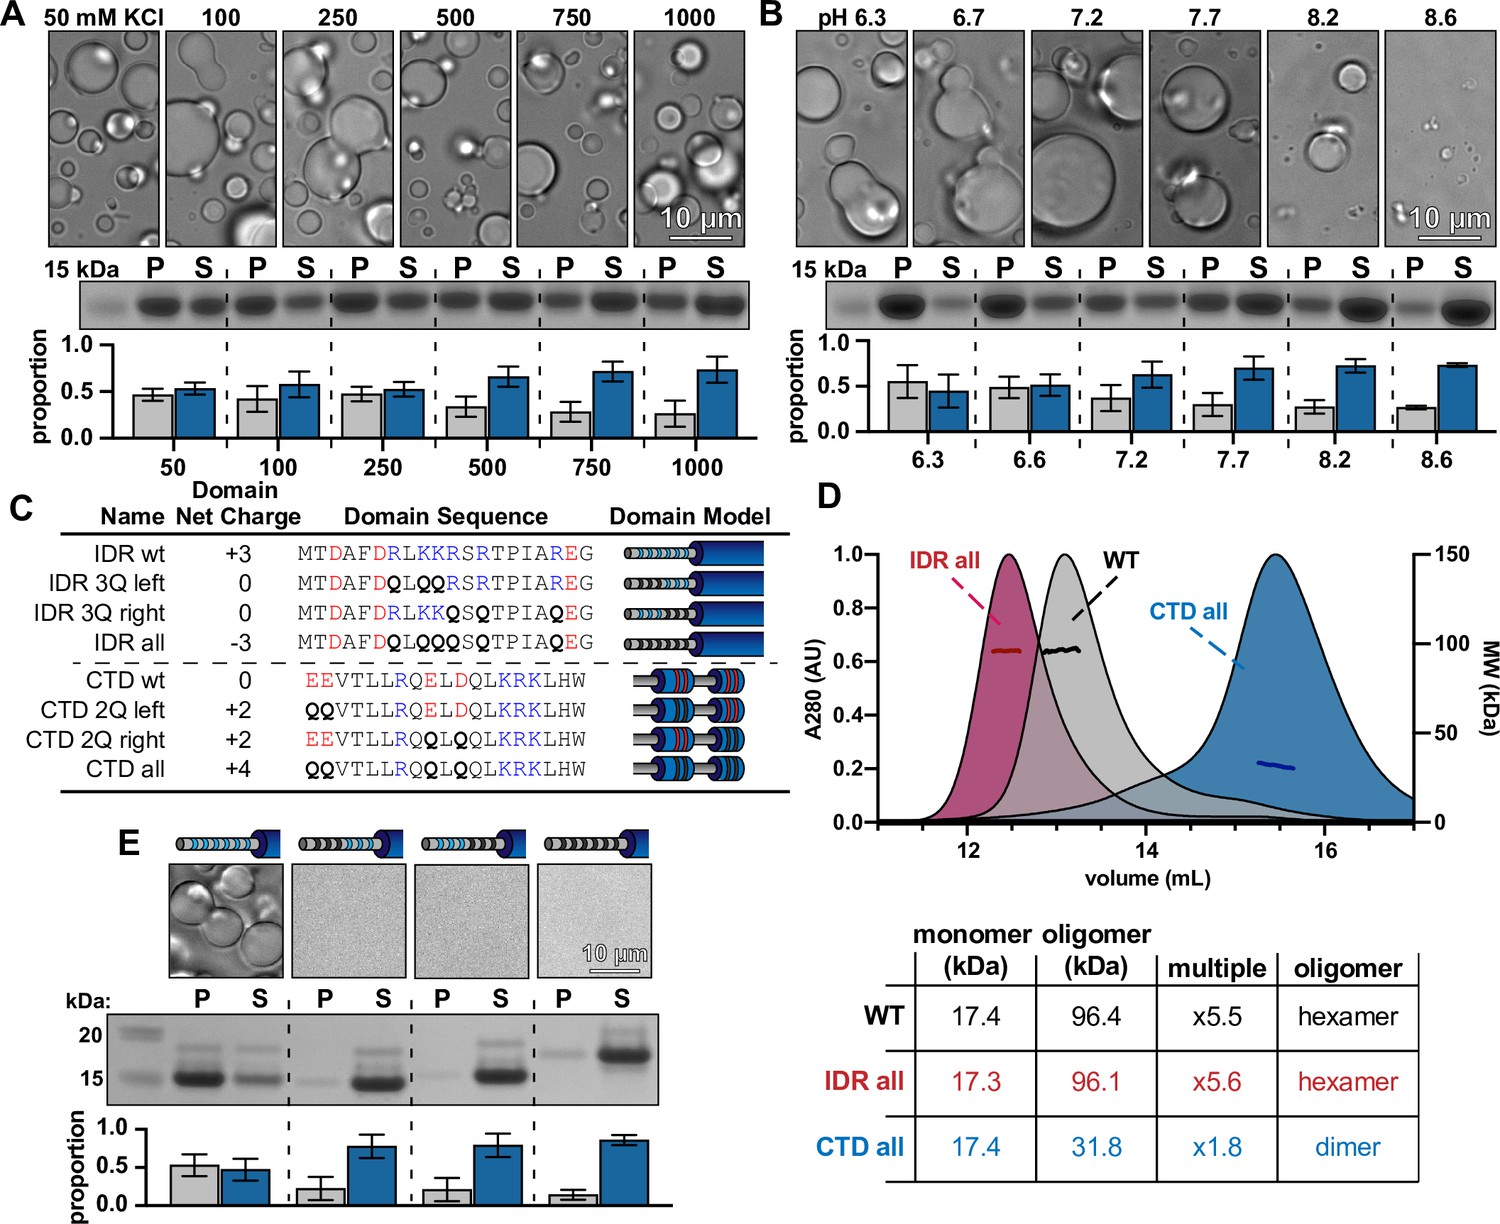
McdB condensates can be solubilized by mutating basic residues in the N-terminal intrinsically disordered region (IDR) without affecting McdB structure.
(A) Representative DIC microscopy images of 50 µM McdB in 20 mM HEPES, pH 7.2 and increasing KCl concentration (top). Scale bar applies to all images. McdB condensates were pelleted (P) and run on a sodium dodecyl sulfate–polyacrylamide gel electrophoresis (SDS–PAGE) gel along with the associated supernatant (S) (middle). P and S band intensities were then quantified (bottom). Mean and standard deviation (SD) from 3 replicates are shown. (B) As in (A), except salt was held constant at 100 mM KCl and the pH was increased as indicated. (A) and (B) implicate stabilizing basic residues (see Figure 5—figure supplement 2). (C) Table showing the net charge and amino acid sequence of wild-type McdB compared to the glutamine (Q)-substitution mutants in both the N-term IDR and C-terminal domain (CTD). Acidic and basic residues in the IDR are colored red and blue, respectively. Q-substitutions are bolded. Graphical models of the McdB variants are also provided. (D) Size-exclusion chromatography coupled to multi-angle light scattering (SEC-MALS) of WT McdB compared to the full Q-substitution mutants from both the N- and C-termini. (Below) Table summarizing the SEC-MALS data, showing that mutations to the IDR does not affect oligomerization, while mutations to the CTD destabilize the trimer-of-dimers hexamer (see Figure 5—figure supplement 3). (E) Representative DIC microscopy images for WT and IDR Q-substitution mutants of McdB at 100 µM in 150 mM KCl and 20 mM HEPES, pH 7.2 (top). Scale bar applies to all images. McdB condensates were pelleted (P) and run on a sodium dodecyl sulfate–polyacrylamide gel electrophoresis (SDS–PAGE) gel along with the associated supernatant (S) (middle). P and S band intensities were then quantified (bottom). Mean and standard deviation (SD) of 3 replicates are shown.
-
Figure 5—source data 1
Sodium dodecyl sulfate–polyacrylamide gel electrophoresis (SDS–PAGE) gel corresponding to the pelleting assay described in Figure 5A.
Full-length McdB is labeled. Bands for the pellet and supernatant fractions are labeled. The corresponding KCl concentration for each condition is labeled.
- https://cdn.elifesciences.org/articles/81362/elife-81362-fig5-data1-v2.zip
-
Figure 5—source data 2
Sodium dodecyl sulfate–polyacrylamide gel electrophoresis (SDS–PAGE) gel corresponding to the pelleting assay described in Figure 5B.
Full-length McdB is labeled. Bands for the pellet and supernatant fractions are labeled. The corresponding pH for each condition is labeled.
- https://cdn.elifesciences.org/articles/81362/elife-81362-fig5-data2-v2.zip
-
Figure 5—source data 3
Sodium dodecyl sulfate–polyacrylamide gel electrophoresis (SDS–PAGE) gel corresponding to the pelleting assay described in Figure 5E.
Full-length McdB and each glutamine-substitution mutant are labeled. Bands for the pellet and supernatant fractions are labeled.
- https://cdn.elifesciences.org/articles/81362/elife-81362-fig5-data3-v2.zip
-
Figure 5—source data 4
Spreadsheet containing the raw data for gel quantification graphs shown in Figure 5A, B.
- https://cdn.elifesciences.org/articles/81362/elife-81362-fig5-data4-v2.xlsx
-
Figure 5—source data 5
Spreadsheet containing the raw data for size-exclusion chromatography coupled to multi-angle light scattering (SEC-MALS) curves shown in Figure 5D and an editable version of the associated table.
- https://cdn.elifesciences.org/articles/81362/elife-81362-fig5-data5-v2.xlsx
-
Figure 5—source data 6
Spreadsheet containing the raw data for gel quantification graphs shown in Figure 5E.
- https://cdn.elifesciences.org/articles/81362/elife-81362-fig5-data6-v2.xlsx
Figure 5—figure supplement 1

Multidimensional phase diagrams for Se7942 McdB.
Turbidity-based phase diagrams for McdB across varying protein concentration, KCl concentration, and pH. Data points represent the mean and error bars represent standard deviation (SD) from at least 3 technical replicates. Turbidity monitored at A = 350 nm.
-
Figure 5—figure supplement 1—source data 1
Spreadsheet containing the raw data for turbidity assay graphs shown in Figure 5—figure supplement 1S.
- https://cdn.elifesciences.org/articles/81362/elife-81362-fig5-figsupp1-data1-v2.zip
Figure 5—figure supplement 2

Alanine scanning of basic residues in the N- and C-termini of McdB.
(A) Table showing the sequence of WT McdB compared to the terminal A-substitution mutants. Acidic and basic residues are colored red and blue, respectively. A-substitutions are bolded. (B) Representative DIC microscopy images of all constructs listed in (A). Scale bar applies to all images.
Figure 5—figure supplement 3

Mutations to the C-terminal domain (CTD) destabilize the trimer-of-dimers hexamer.
(A) Table showing the net charge and amino acid sequence of wild-type McdB compared to the Q-substitution mutants in the CTD. Acidic and basic residues are colored red and blue, respectively. Q-substitutions are bolded. Graphical models of the McdB variants are also provided. (B) Size-exclusion chromatography coupled to multi-angle light scattering (SEC-MALS) graphs of the indicated variants (top) with a table summarizing results (below). Note the CTD 2Q left MALS data spans the MW from hexamer range to dimer range. The CTD 2Q right variant formed insoluble aggregates and is not shown.
-
Figure 5—figure supplement 3—source data 1
Spreadsheet containing the raw data for size-exclusion chromatography coupled to multi-angle light scattering (SEC-MALS) curves shown in Figure 5—figure supplement 3S and an editable version of the associated table.
- https://cdn.elifesciences.org/articles/81362/elife-81362-fig5-figsupp3-data1-v2.zip
Figure 6 with 1 supplement
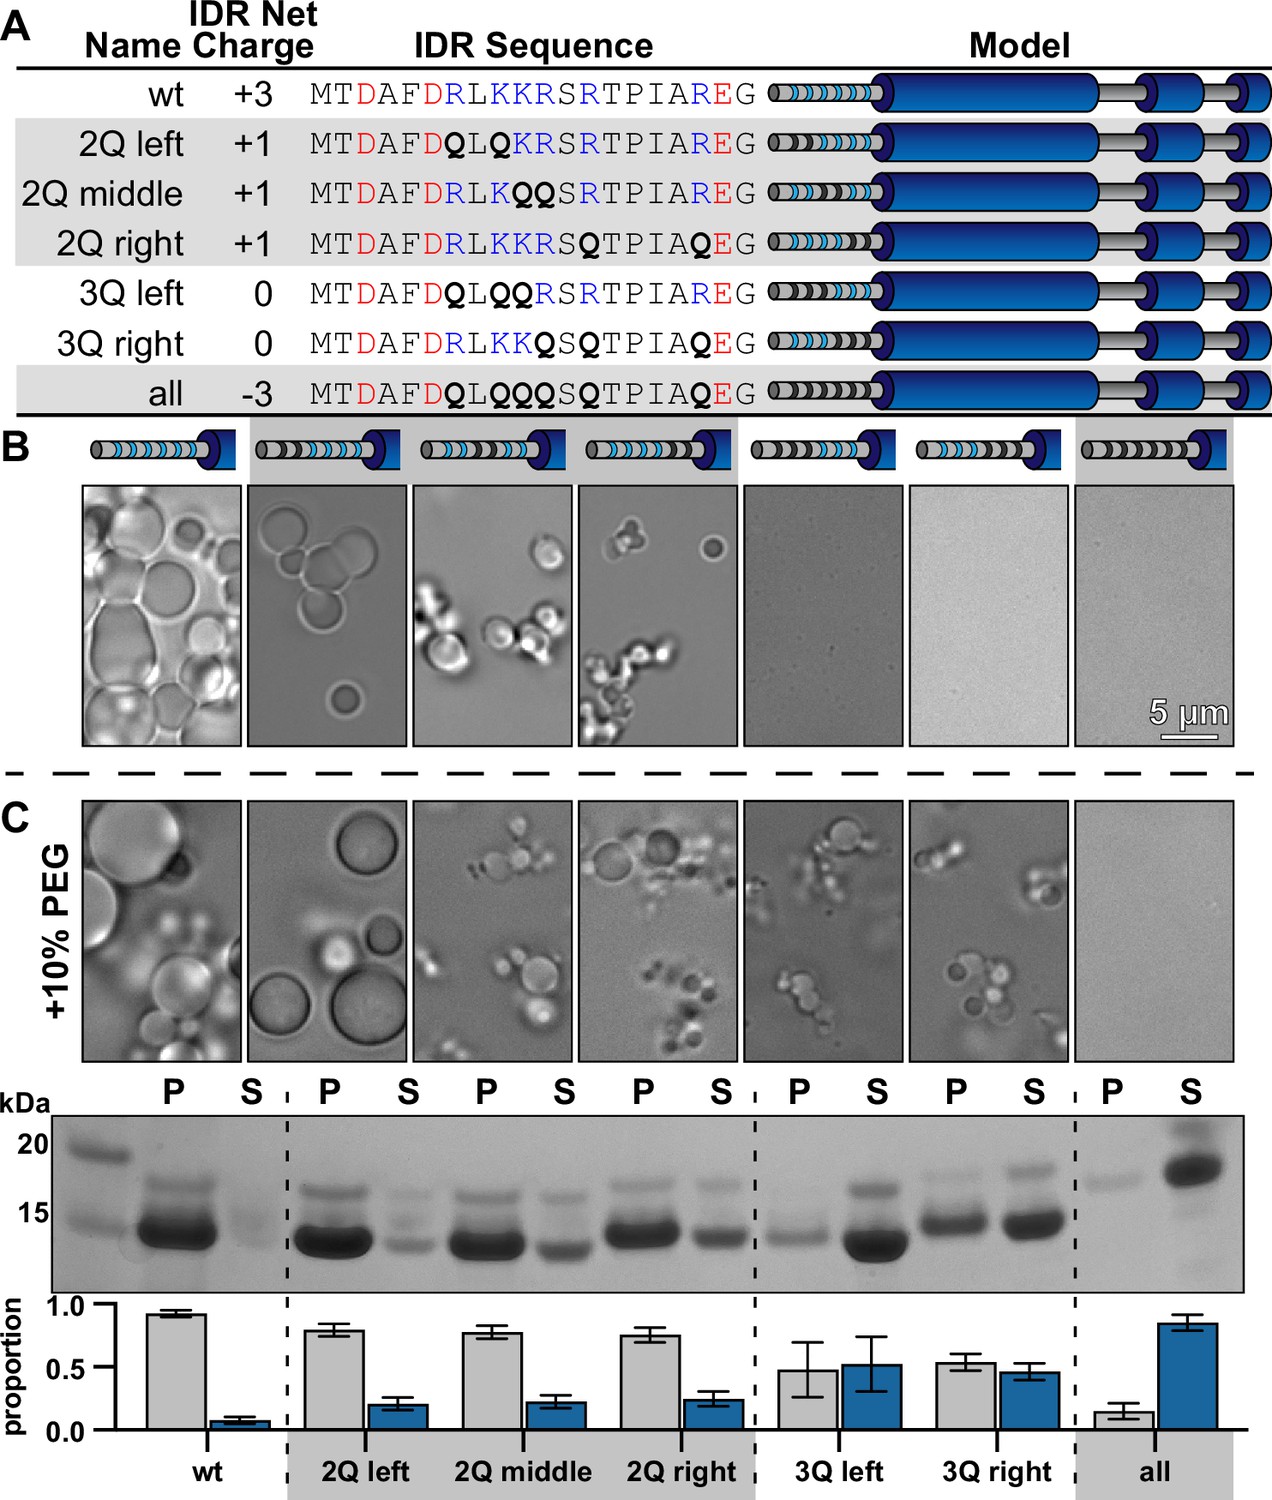
Net charge of the intrinsically disordered region (IDR) can be used to tune the solubility of McdB condensates.
(A) Table showing the net charge and N-terminal IDR sequence of wild-type McdB compared to the glutamine (Q)-substitution mutants. Acidic and basic residues in the IDR are colored red and blue, respectively. Q-substitutions are bolded. Graphical models of the McdB variants are also provided where blue stripes represent the six basic residues in the IDR. Black stripes represent the location of the Q-substitutions. (B) Representative DIC microscopy images for wild-type and the Q-substitution mutants of McdB at 100 µM in 150 mM KCl and 20 mM HEPES, pH 7.2. Scale bar applies to all images. (C) As in (B), but with the addition of 10% PEG-8000 (top). McdB condensates were pelleted (P) and run on a sodium dodecyl sulfate–polyacrylamide gel electrophoresis (SDS–PAGE) gel along with the associated supernatant (S) (middle). P and S band intensities were then quantified (bottom). Mean and standard deviation (SD) from 3 replicates are shown.
-
Figure 6—source data 1
Sodium dodecyl sulfate–polyacrylamide gel electrophoresis (SDS–PAGE) gel corresponding to the pelleting assay described in Figure 6C.
Full-length McdB and each glutamine-substitution mutant are labeled. Bands for the pellet and supernatant fractions are labeled.
- https://cdn.elifesciences.org/articles/81362/elife-81362-fig6-data1-v2.zip
-
Figure 6—source data 2
Spreadsheet containing the raw data for gel quantification graphs shown in Figure 6C.
- https://cdn.elifesciences.org/articles/81362/elife-81362-fig6-data2-v2.xlsx
Figure 6—figure supplement 1

Circular dichroism (CD) spectra of wild-type McdB and N-terminal glutamine-substitution mutants.
(A) Table showing the net charge and N-terminal intrinsically disordered region (IDR) sequence of wild-type McdB compared to the glutamine-substitution mutants. Acidic and basic residues in the IDR are colored red and blue, respectively. Glutamine substitutions are bolded. Graphical models of the McdB variants are also provided where blue stripes represent the six basic residues in the IDR. Black stripes represent the location of the glutamine substitutions. CD spectra of both (B) wild-type McdB and (C) mutants with the indicated glutamine substitutions in the N-terminal IDR of McdB.
-
Figure 6—figure supplement 1—source data 1
Spreadsheet containing the raw data for circular dichroism (CD) curves shown in Figure 6—figure supplement 1S.
- https://cdn.elifesciences.org/articles/81362/elife-81362-fig6-figsupp1-data1-v2.zip
Figure 7
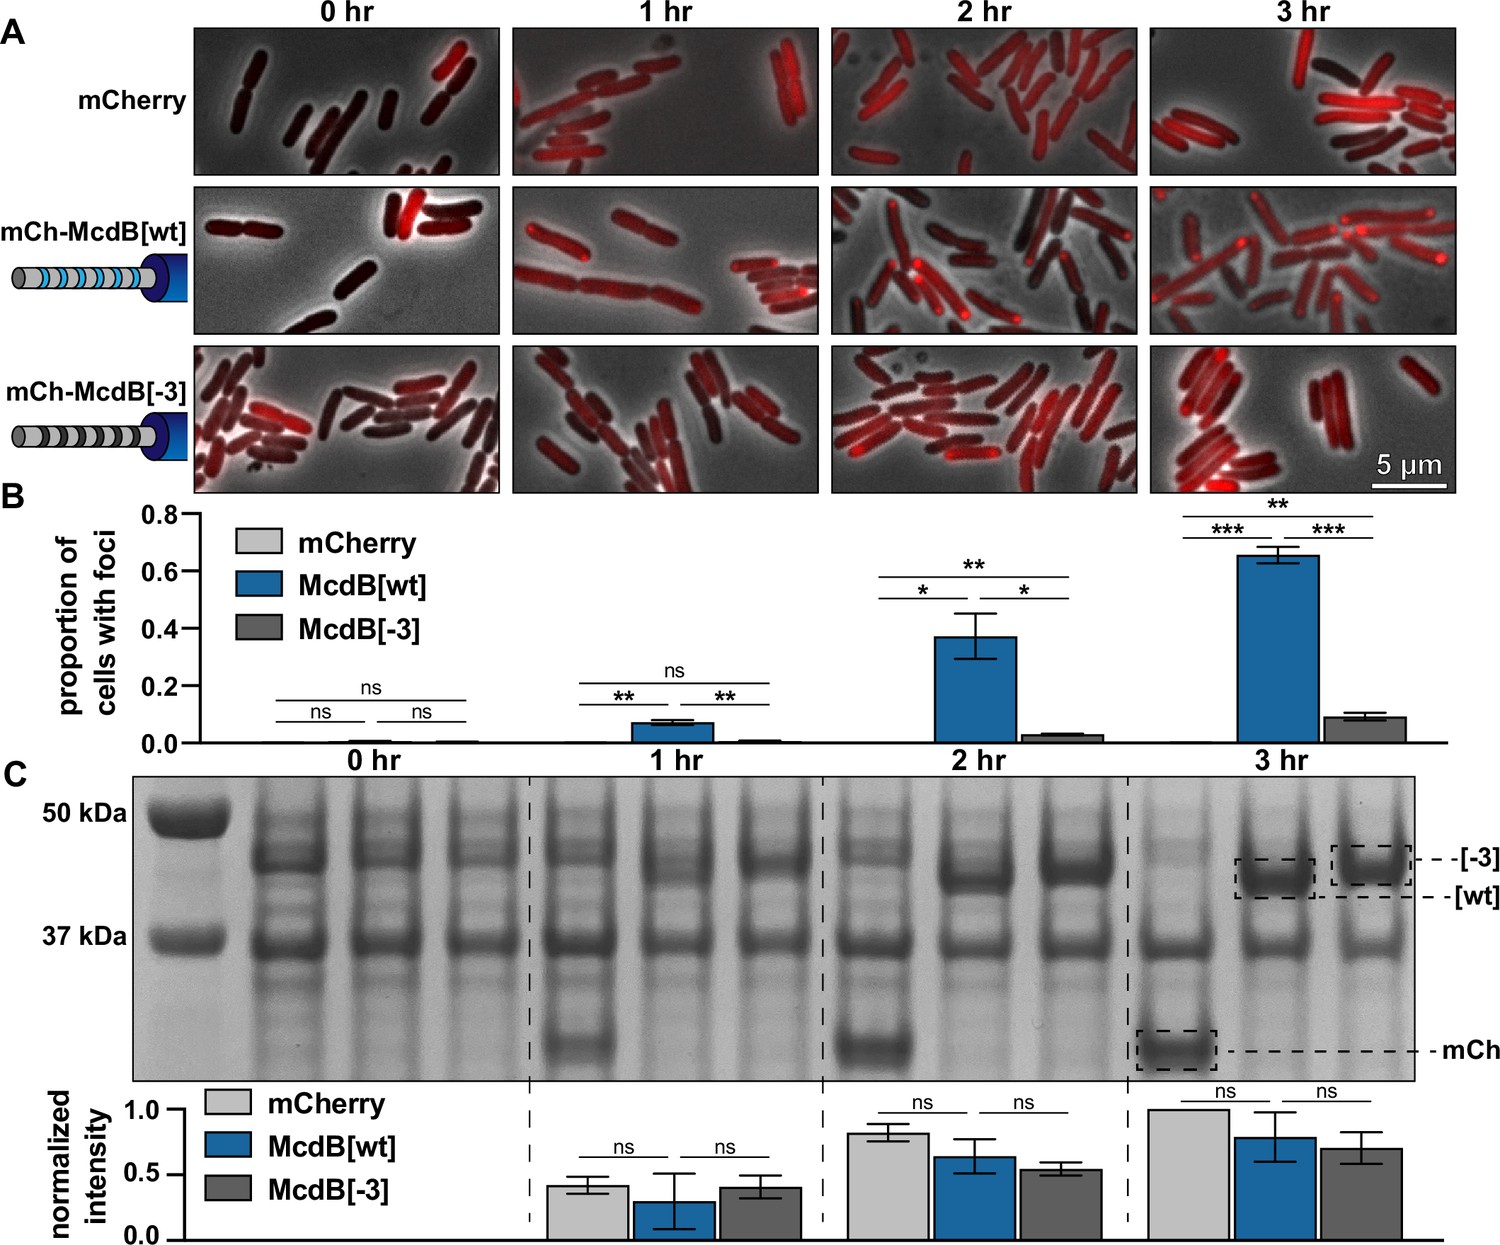
Net charge of the intrinsically disordered region (IDR) affects McdB solubility in E. coli.
(A) Representative fluorescence microscopy images monitoring the expression of the indicated constructs over time. Scale bar applies to all images. (B) Quantification of the proportion of cells containing foci from the images represented in (A). All quantifications were done on >300 cells and from n = 3 technical replicates. Reported values represent means with standard deviation (SD). *p < 0.05, **p < 0.01, ***p < 0.001 by Welch’s t test. (C) Sodium dodecyl sulfate–polyacrylamide gel electrophoresis (SDS–PAGE) of cell lysates from the time course represented in (A). All samples were standardized to the same OD600 prior to loading. The expected MWs of the three constructs indicated are: mCherry 26.8 kDa; mCh-McdB[wt] 44.6 kDa; mCh-McdB[−3] 44.5 kDa. Normalized intensities from the indicated bands were quantified from 3 biological replicates (below). Reported values represent means with SD. Data were analyzed via Welch’s t test.
-
Figure 7—source data 1
Sodium dodecyl sulfate–polyacrylamide gel electrophoresis (SDS–PAGE) gel corresponding to the protein expression levels described in Figure 7C.
Bands representing mCherry alone, mCh-McdB[wt], and mCh-McdB[−3] are boxed and labeled. The time after induction is indicated.
- https://cdn.elifesciences.org/articles/81362/elife-81362-fig7-data1-v2.zip
-
Figure 7—source data 2
Spreadsheet containing the raw data for foci count quantification graphs shown in Figure 7B.
- https://cdn.elifesciences.org/articles/81362/elife-81362-fig7-data2-v2.xlsx
-
Figure 7—source data 3
Spreadsheet containing the raw data for gel quantification graphs shown in Figure 7C.
- https://cdn.elifesciences.org/articles/81362/elife-81362-fig7-data3-v2.xlsx
Figure 8 with 1 supplement
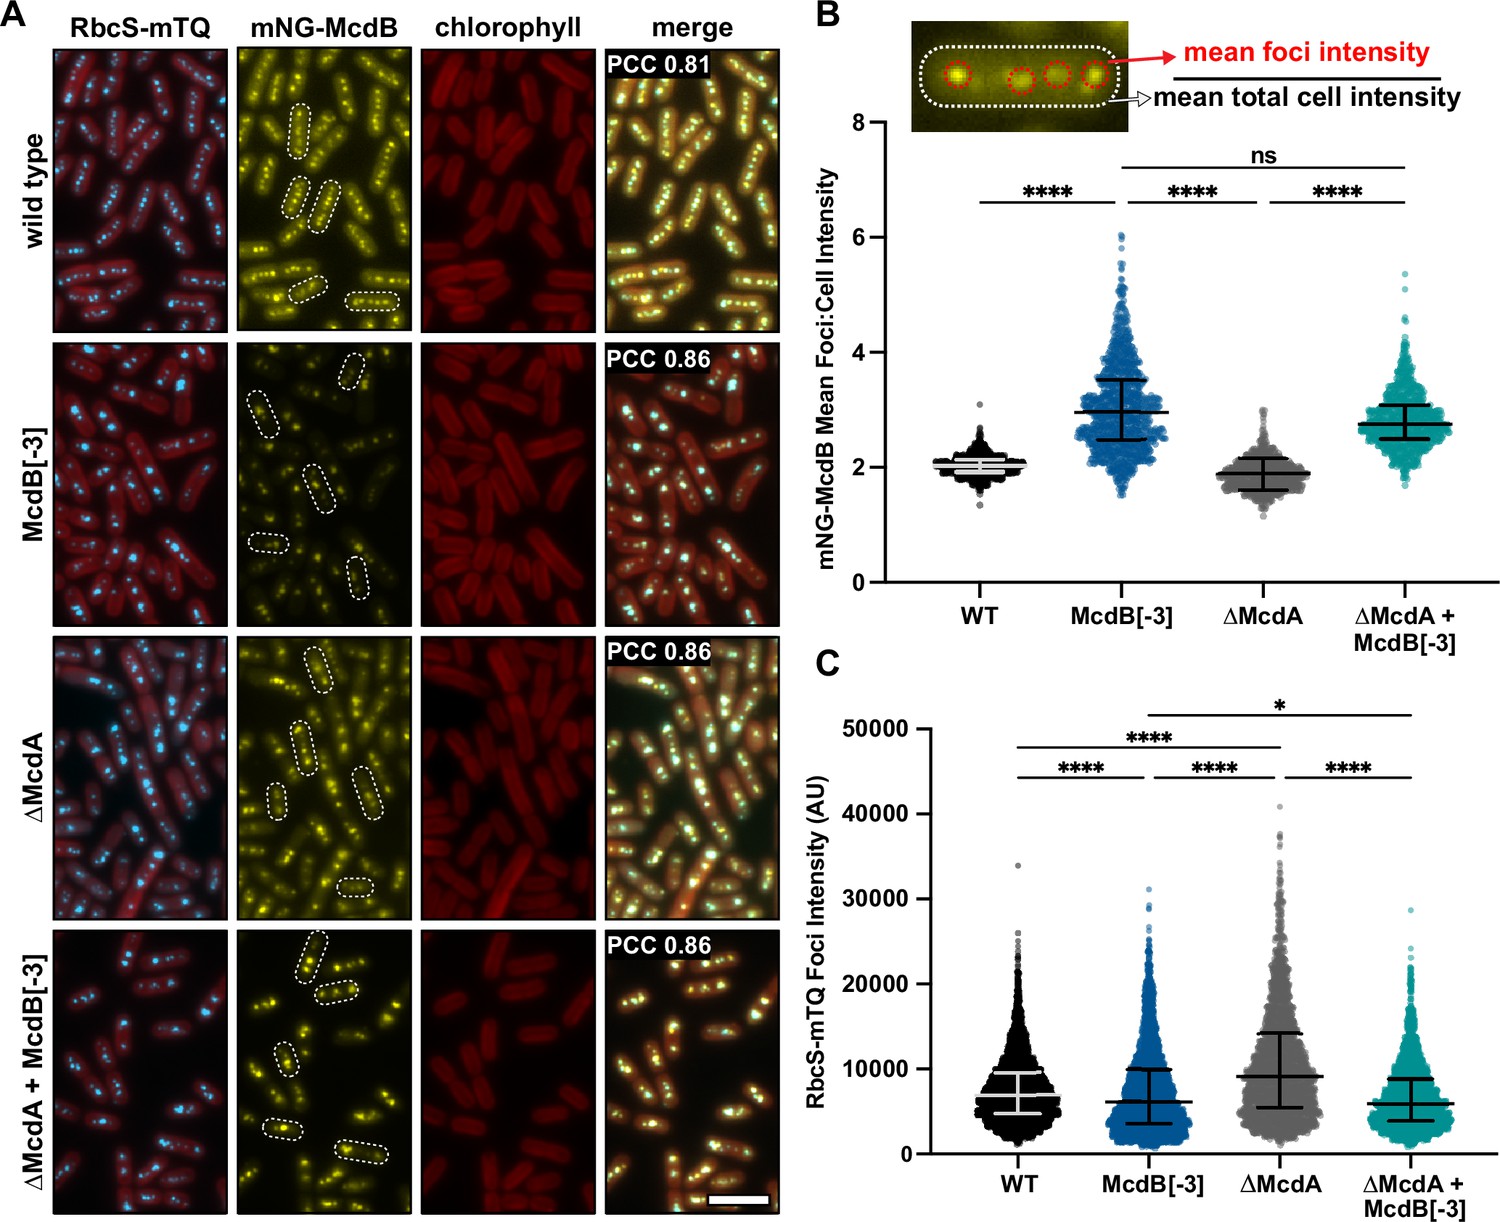
McdB[−3], which results in a high degree of condensate solubilization in vitro and in E. coli, alters the soluble fraction of McdB and carboxysome Rubisco levels in vivo.
(A) Representative fluorescence microscopy images of the indicated strains. Scale bar = 5 µm and applies to all images. Pearson’s correlation coefficients (PCCs) are shown for mNG-McdB and RbcS-mTQ for each strain. PCC values are means from >10,000 cells over 10 fields of view. (B) Quantification of (mean foci intensity/mean total cell intensities) for mNG-McdB of n > 500 cells. Medians and interquartile ranges are displayed. ****p < 0.001 based on Kruskal–Wallis analysis of variance (ANOVA). (C) Quantification of mean RbcS-mTQ foci intensity for n > 500 cells. Medians and interquartile ranges are displayed. *p < 0.05; ****p < 0.001 based on Kruskal–Wallis ANOVA.
-
Figure 8—source data 1
Spreadsheet containing the raw data for graphs shown in Figure 8B, C.
- https://cdn.elifesciences.org/articles/81362/elife-81362-fig8-data1-v2.zip
Figure 8—figure supplement 1
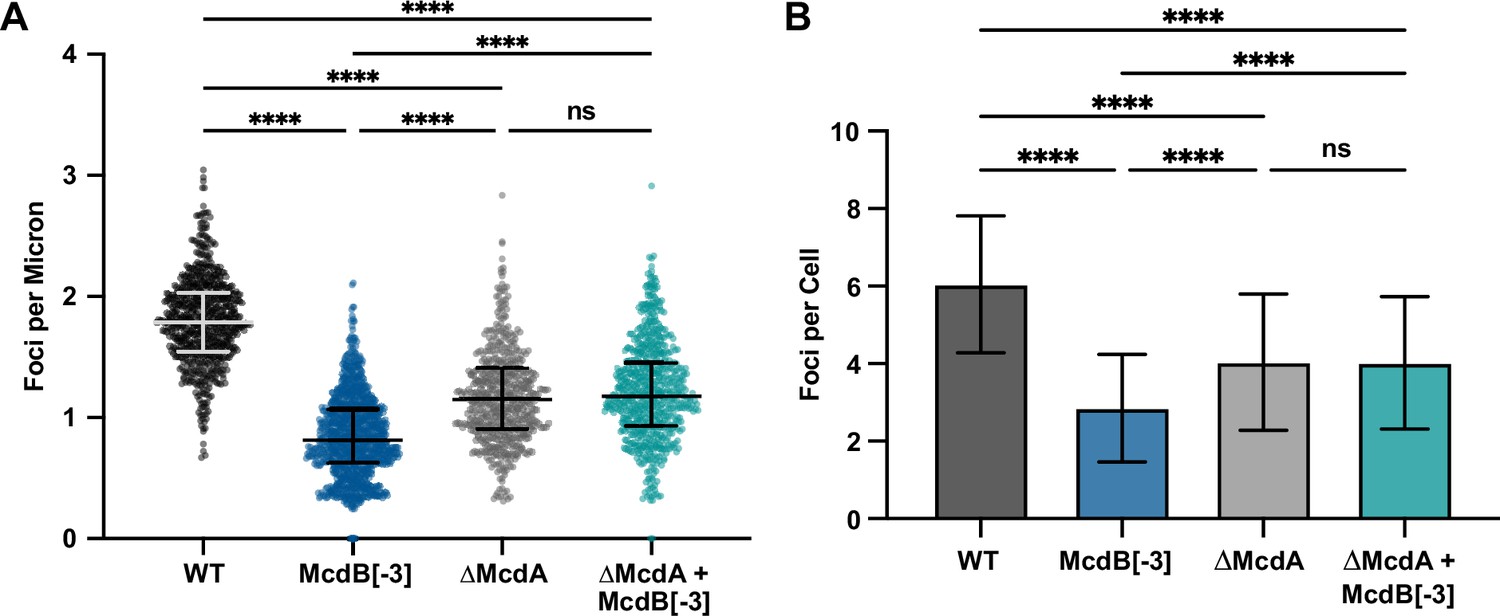
Deletion of McdA causes no additional loss of carboxysome positioning in McdB[−3] strain.
(A) Quantification of RbcS-mTQ foci per micron from n > 500 cells. Medians and interquartile ranges are displayed. ****p < 0.001 based on Kruskal–Wallis analysis of variance (ANOVA). (B) Quantification of RbcS-mTQ foci per cell for n > 500 cells. Medians and interquartile ranges are displayed. ****p < 0.001 based on Kruskal–Wallis ANOVA.
-
Figure 8—figure supplement 1—source data 1
Spreadsheet containing the raw data for graphs shown in Figure 8—figure supplement 1A, B.
- https://cdn.elifesciences.org/articles/81362/elife-81362-fig8-figsupp1-data1-v2.zip
Figure 9
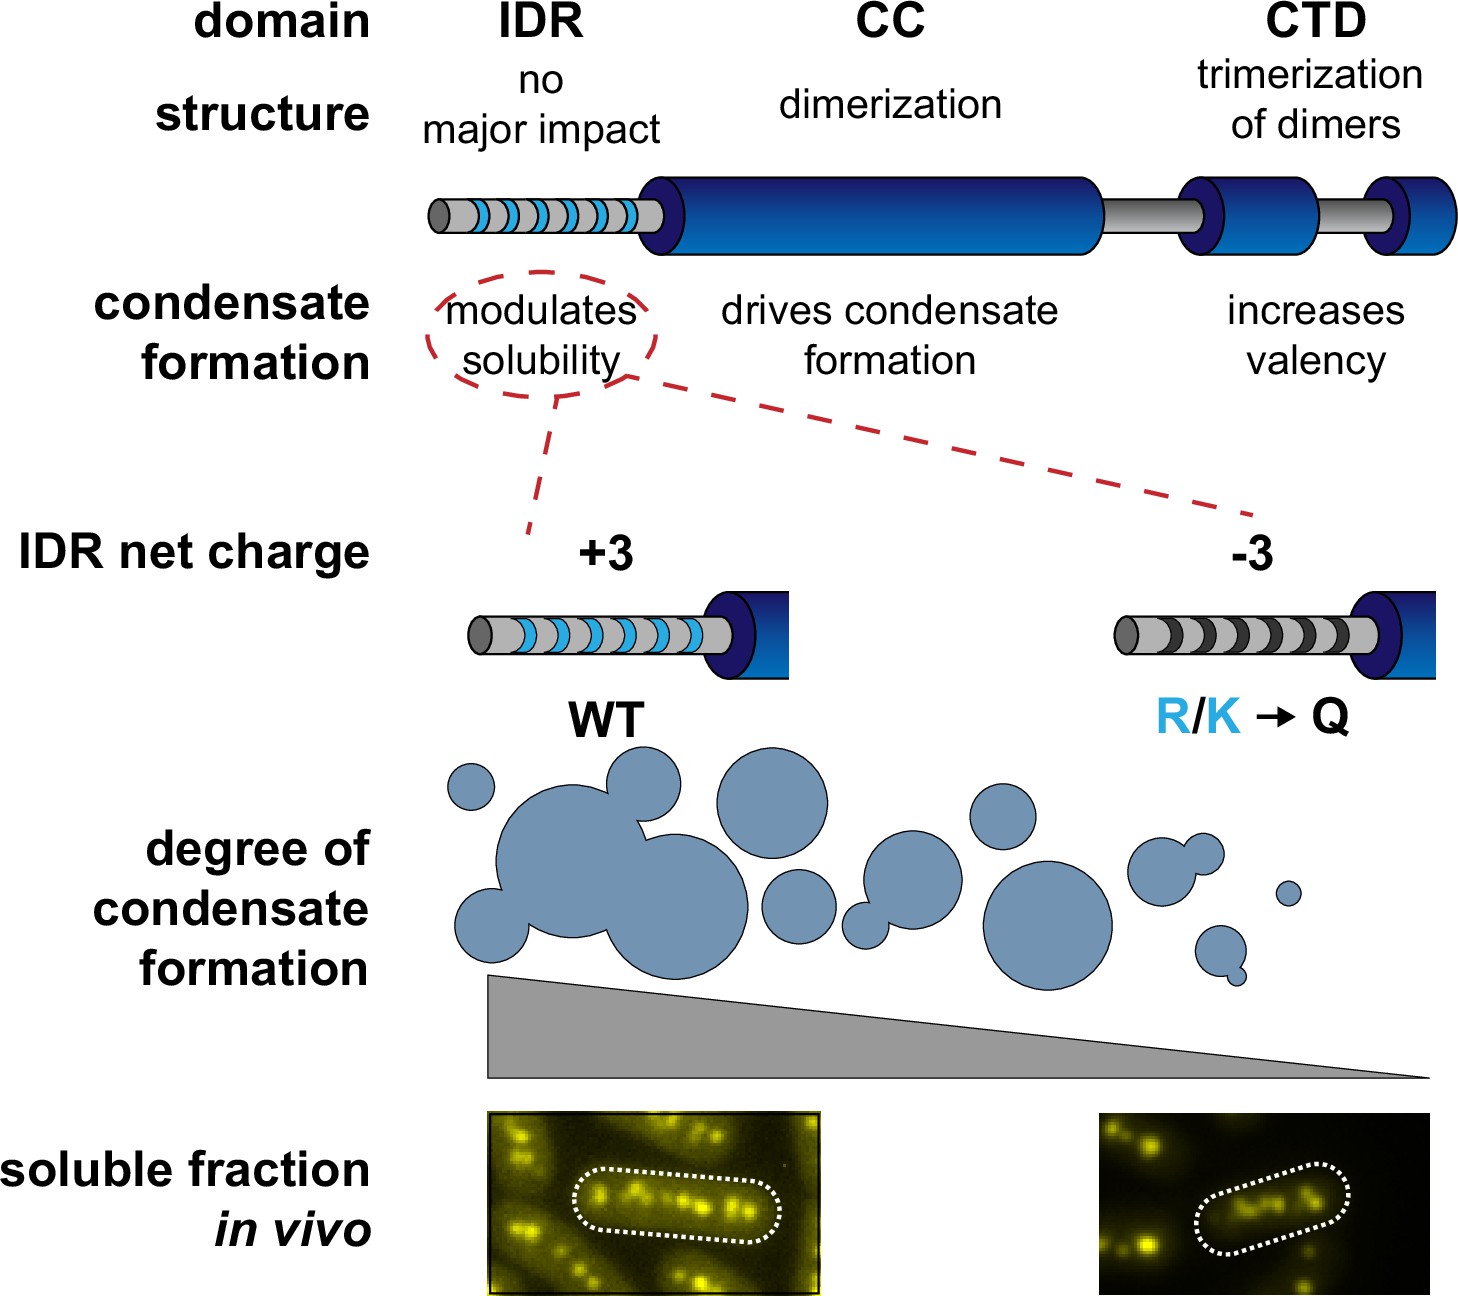
Proposed model of Se7942 McdB domain structure and self-association.
The central coiled-coil (CC) domain is necessary and sufficient for dimerization and driving condensate formation. The α-helical C-terminal domain (CTD) trimerize McdB dimers and increases the degree of condensate formation compared to the CC alone. The N-terminal intrinsically disordered region (IDR) does not affect oligomerization and increases the degree of condensate formation compared to the CC alone. Substituting basic residues (K/R) in the IDR to glutamines (Q) can tune condensate solubility in vitro without affecting McdB oligomerization. These mutations allowed us to identify in vivo phenotypes correlated specifically to McdB phase separation, including the relative amount of soluble McdB.
Additional files
Download links
A two-part list of links to download the article, or parts of the article, in various formats.
Downloads (link to download the article as PDF)
Open citations (links to open the citations from this article in various online reference manager services)
Cite this article (links to download the citations from this article in formats compatible with various reference manager tools)
Dissecting the phase separation and oligomerization activities of the carboxysome positioning protein McdB
eLife 12:e81362.
https://doi.org/10.7554/eLife.81362


