Identification of orphan ligand-receptor relationships using a cell-based CRISPRa enrichment screening platform
- Department of Molecular and Cellular Physiology, Stanford University, United States
- Stanford ChEM-H, Department of Genetics, Stanford University, United States
- Division of Biology and Biological Engineering, California Institute of Technology, United States
- Howard Hughes Medical Institute, Stanford University School of Medicine, United States
- Department of Structural Biology, Stanford University School of Medicine, United States
Figures
Figure 1 with 1 supplement
A CRISPR activating enrichment screening platform.
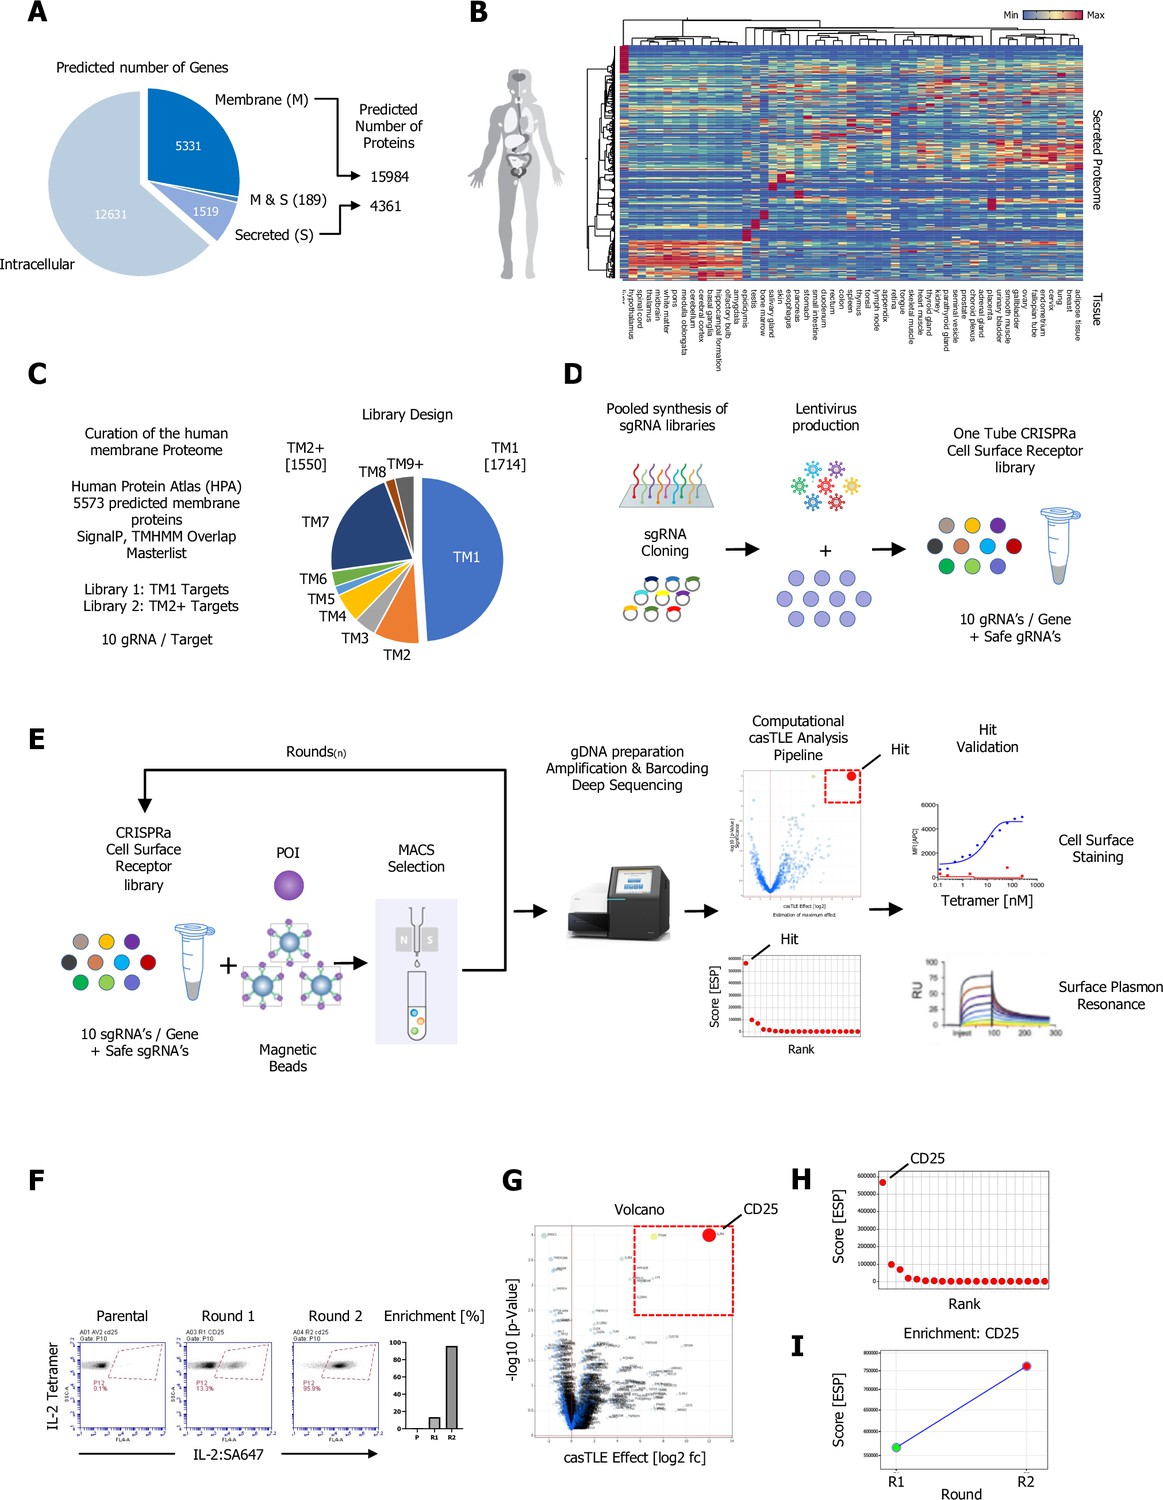
Curation of the human membrane proteome, cell surface library design, validation, and benchmark screen. (A) Human membrane and secreted proteome; left panel: predicted number of intracellular, membrane (M), and secreted (S) genes, with a total number of approximately 5520 human protein-coding genes predicted to encode ~15,984 membrane-spanning proteins including mapped, alternative splice variants and isoforms. (B) Secreted proteome visualized by two-way hierarchical clustering of normalized mRNA expression data from normal tissue. (C) Human membrane proteome curation and workflow of the cell surface library design. (D) Pooled, customized, and target-specific single-pass transmembrane (TM1) and multi-pass transmembrane (TM2+) sgRNA libraries (10 sgRNA/target) were designed, cloned, and lentivirally infected into K562-SunCas9 cells at low multiplicity of infection (MOI). (E) Schematic overview of the CRISPR activation (CRISPRa) enrichment screening platform. A protein of interest (POI) is complexed with magnetic beads and screened against customized CRISPRa cell surface receptor library, followed by consecutive rounds of magnetic-activated cell sorting (MACS) positive selection. In the final step, genomic DNA is extracted from the selected, target enriched library round(s), barcoded, subjected to deep sequencing and analyzed using the casTLE statistical framework to identify potential hits. CRISPRa hits are then subjected to various orthogonal validation methods. (F–I) Benchmark CRISPRa enrichment screen using human IL-2, performing two consecutive rounds of magnetic bead selection followed by gDNA extraction, barcoding, and deep sequencing. (F) Enrichment over two rounds of consecutive magnetic bead selection by tetramer staining with human IL-2 post selection (Parental, Round 1, and Round 2). (G) Visualization of the deep sequencing analysis. Results are visualized by x/y scatter plot: casTLE-Score (log2); pValue (−log10), size of the hit represents the casTLE-Effect + casTLE-Score. (H) Candidate hits of the final round of enrichment visualized by a x/y ranked plot using a combined ESP score. (I) Trajectories of highest-ranking candidates are plotted over the consecutive rounds of enrichment rounds; size of the bubble represents the pValue (−log10).
-
Figure 1—source data 1
Pooled CRISPR activation (CRISPRa) library source list.
Information for both customized cell surface libraries, library ID, target ID, and gRNA sequences for the single-pass transmembrane (TM1) and multi-pass transmembrane (TM2+) libraries.
- https://cdn.elifesciences.org/articles/81398/elife-81398-fig1-data1-v3.xlsx
Figure 1—figure supplement 1
Evaluation of sunCas9 CRISPR activation (CRISPRa)-mediated transcriptional activation, pooled CRISPRa library quality control, and IL-2 benchmark screens.
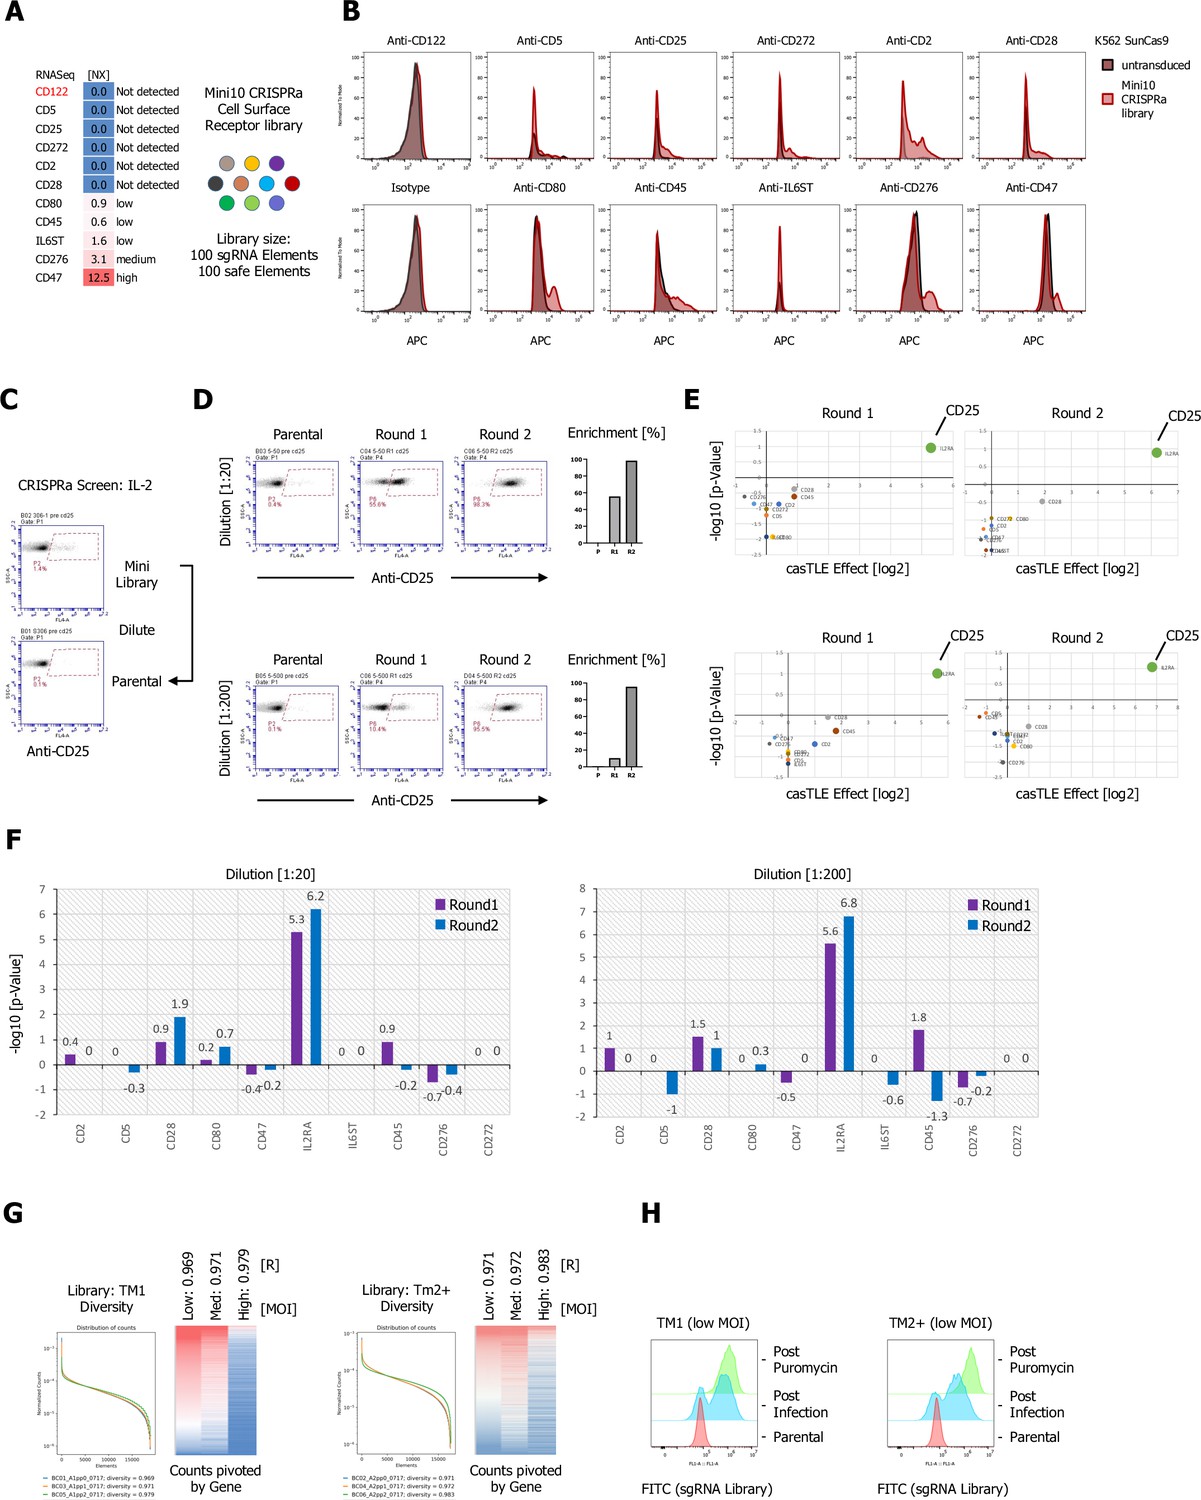
(A) Normalized mRNA expression data of target cell surface receptors selected for a CRISPRa mini-library of 10 genes in K562 cells. (B) Antibody staining of the K562 mini-library after lentiviral infection and puromycin selection in comparison to parental, untransduced K562 cells using allophycocyanin (APC)-labeled primary antibodies. (C–F) Proof of concept CRISPRa enrichment screen using human IL-2 as a secreted ligand. Simulation of a full library screen by diluting the mini-library by factors of 20 and 200 and preforming two consecutive rounds of magnetic bead selection followed by gDNA extraction, barcoding, and deep sequencing. (C) Cell surface staining of the parental and undiluted mini-library using an APC-labeled anti-CD25 antibody. (D) Enrichment over two rounds of consecutive magnetic bead selection was detected an APC-labeled anti-CD25 antibody (Parental, Round 1, and Round 2) for both simulated libraries post magnetic-activated cell sorting (MACS). (E) Visualization of the deep sequencing analysis. Results are visualized by x/y scatter plot: casTLE-Score (log2)/pValue (−log10), size of the hit represents the casTLE-Effect + casTLE-Score. (F) Candidate hits of both rounds of enrichment visualized by bar graphs: casTLE-Score (log2)/pValue (−log10) for each gene in the mini-library. (G) Customized cell surface library quality control. Pooled, customized, and target-specific single-pass transmembrane (TM1) (~1800) and multi-pass transmembrane (TM2+) (~1750) sgRNA libraries (10 sgRNA per gene together with a safe sgRNA reference pool) were designed, cloned, and lentivirally infected into K562-CRISPRa cells at low, medium, and high multiplicity of infection (MOI). (H) After puromycin selection, genomic DNA was extracted and subjected to deep sequencing for library validation by plotting the library diversity and counts for the three MOIs. Right panel: For the final libraries, low MOI libraries for TM1 and TM2+ were analyzed pre and post puromycin selection by FACS.
Figure 2 with 4 supplements
Selection and protein production of high-priority secreted ligands and overview of screening results.
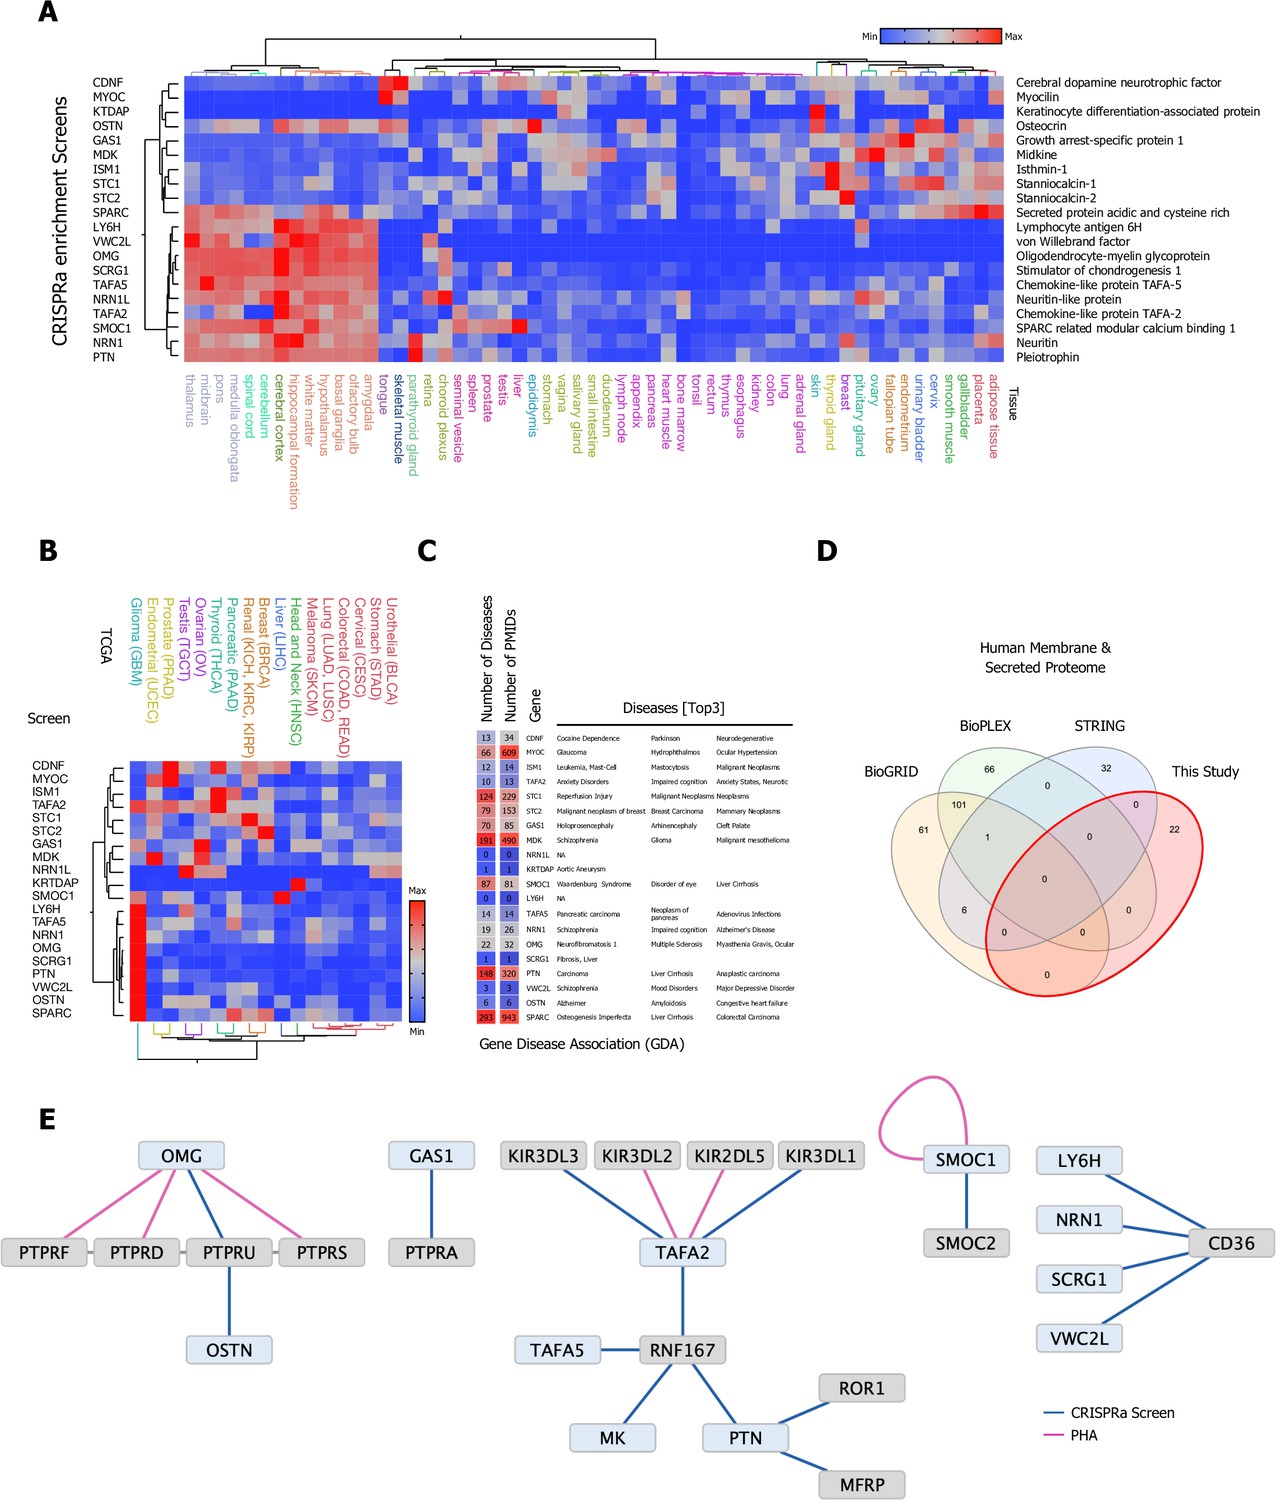
(A) Eighty high-value orphan secreted proteins were selected, synthesized, cloned, and expressed in Expi293F cells, 20 secreted ligands with a broad range of tissue expression passed our quality control and were used in our CRISPR activation (CRISPRa) enrichment workflow. (B) TCGA cancer tissue RNA-seq data was obtained for all 20 screened secreted ligands from 17 cancer types representing 21 cancer subtypes and were processed as median FPKM (number fragments per kilobase of exon per million reads) and visualized as a hierarchical clustering heatmap. (C) Gene disease association (GDA) data for all 20 high-priority candidates used in the CRISPRa enrichment screening workflow: Number of involved Diseases and Publications as well as top three ranking GDA are indicated. Data was obtained from the DisGenet database, full GDA analysis is visualized in Figure 2—figure supplement 4, and a fully annotated dataset can be found in Figure 2—source data 3. (D) Venn diagram visualizing the overlap between physical interactions between secreted and membrane proteins presented in this study and public interaction databases (BioGRID, BioPLEX, and STRING). (E) CRISPRa enrichment screening interactions represented as a protein interaction network, nodes represent CRISPRa query secreted ligands (blue) and candidate hits (gray). Edges represent the interactions between nodes. The visualized network shows 22 interactions between secreted and membrane proteins; 18 new interactions from eight screens in the single-pass transmembrane (TM1) and 4 interactions from four screens in the multi-pass transmembrane (TM2+) library between secreted and membrane proteins. Interactions (edges) resulting from CRISPRa enrichment screens are represented in dark blue, interactions resulting from phylogenetic homology analysis (PHA) are visualized in purple.
-
Figure 2—source code 1
Annotated Cytoscape node/edge Gene Disease Association (GDA) network.
- https://cdn.elifesciences.org/articles/81398/elife-81398-fig2-code1-v3.zip
-
Figure 2—source data 1
Plasmid sequences.
Complete DNA sequences for all 80 secreted bait proteins and full-length pD649 expression plasmid sequences.
- https://cdn.elifesciences.org/articles/81398/elife-81398-fig2-data1-v3.xlsx
-
Figure 2—source data 2
Secreted protein library.
Information for all 80 proteins including ID, UniProt, Entry name, expression yields, Protein Name, and full-length protein sequence.
- https://cdn.elifesciences.org/articles/81398/elife-81398-fig2-data2-v3.xlsx
-
Figure 2—source data 3
Gene disease association (GDA) data.
GDA data for all 20 high-priority candidates used in the CRISPR activation (CRISPRa) enrichment screening workflow. Data was obtained from the DisGenet database and visualized with Cytoscape (v3.9.1).
- https://cdn.elifesciences.org/articles/81398/elife-81398-fig2-data3-v3.xlsx
-
Figure 2—source data 4
CRISPR activation (CRISPRa) casTLE statistical analysis.
Analysis results for CRISRPa enrichment screens using the casTLE statistical framework with casTLE effect, casTLE score, pValue, combined ESP score, minimal and maximum estimated effect, number and ID of gRNAs detected for each screen in both libraries and round of selection.
- https://cdn.elifesciences.org/articles/81398/elife-81398-fig2-data4-v3.xlsx
-
Figure 2—source data 5
Surface plasmon resonance (SPR) conditions.
Table of SPR conditions for all ligand-analyte pairs tested including ligand RU, maximum analyte concentration, analyte RU at maximum concentration, injection time (s), injection rate (µl/min), dissociation time (s), regeneration conditions and fit data.
- https://cdn.elifesciences.org/articles/81398/elife-81398-fig2-data5-v3.xlsx
Figure 2—figure supplement 1
High-value secreted orphan ligands.
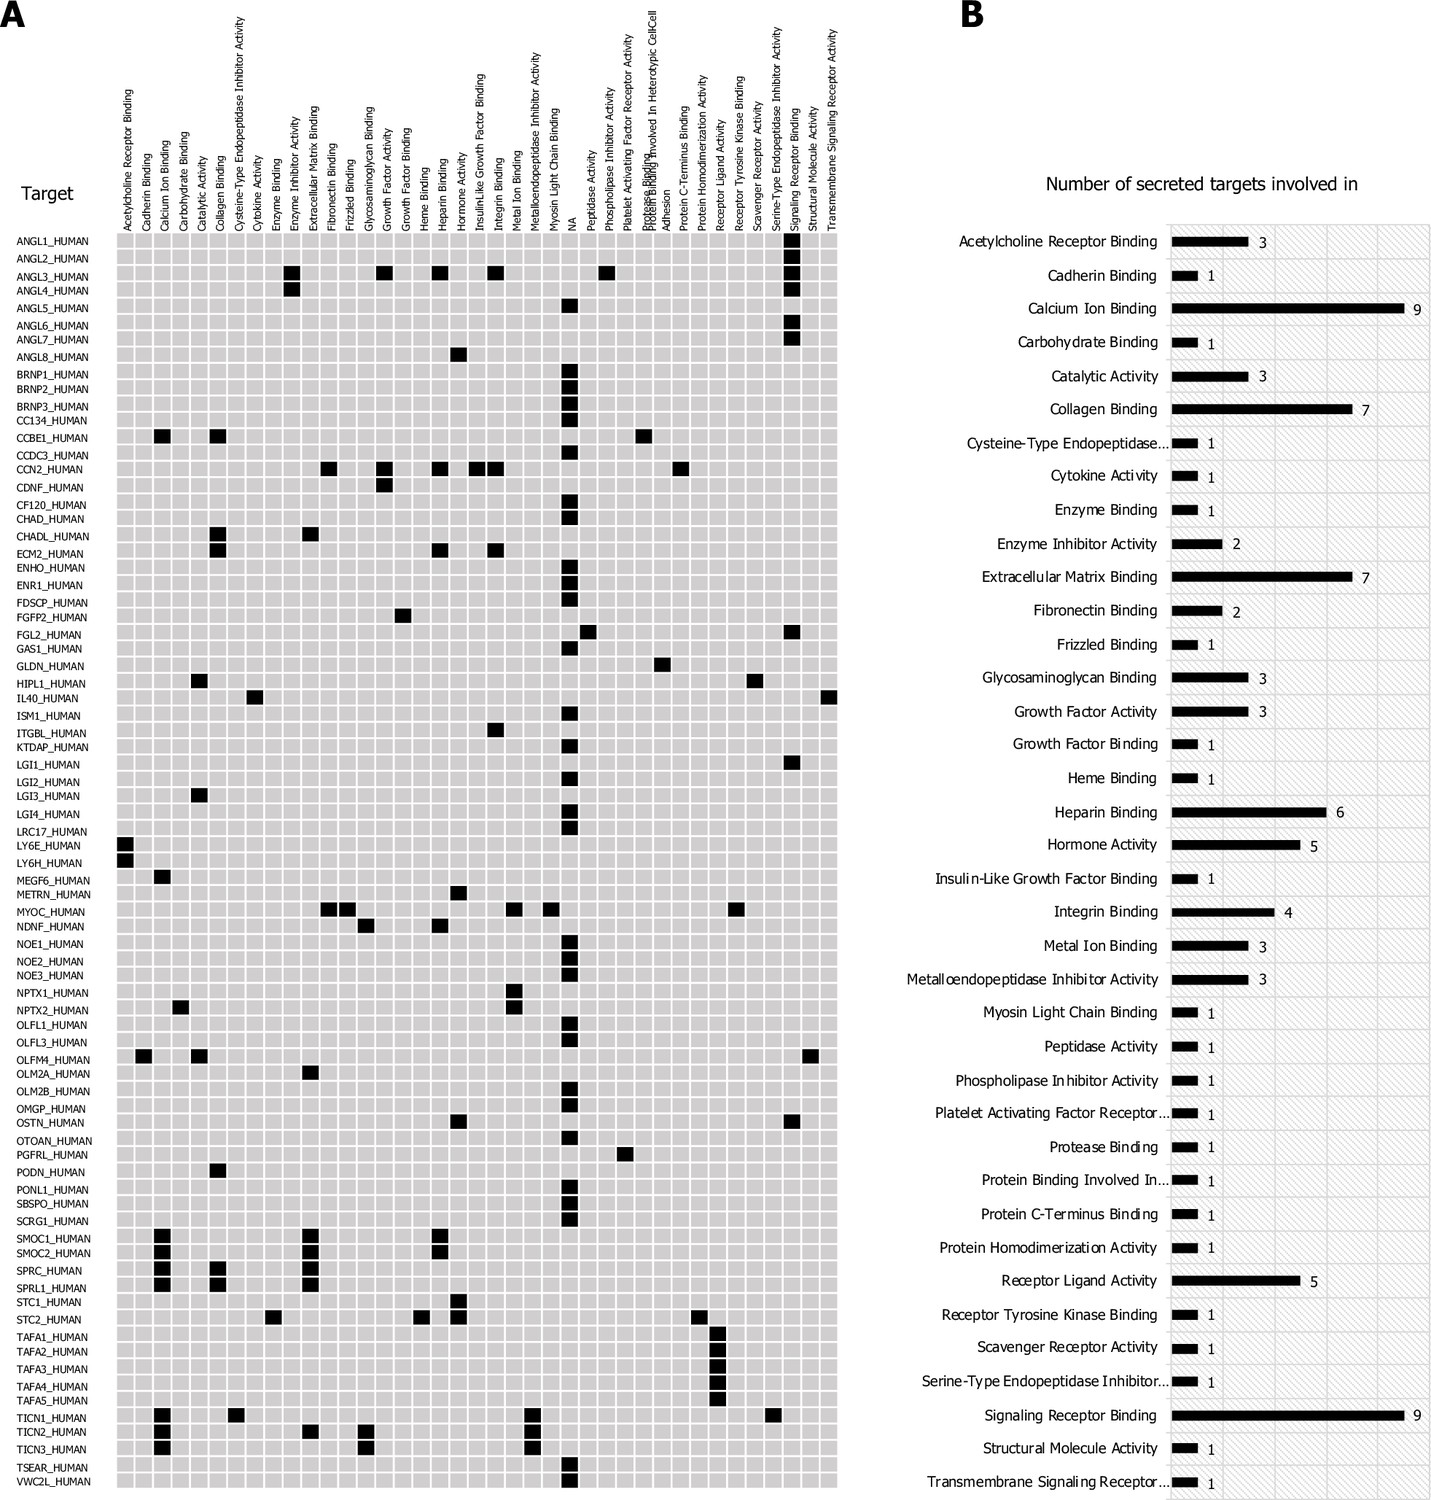
(A) High-value secreted orphans (80) classified by molecular function and their involvement in signaling (B) using GO-term annotations.
Figure 2—figure supplement 2
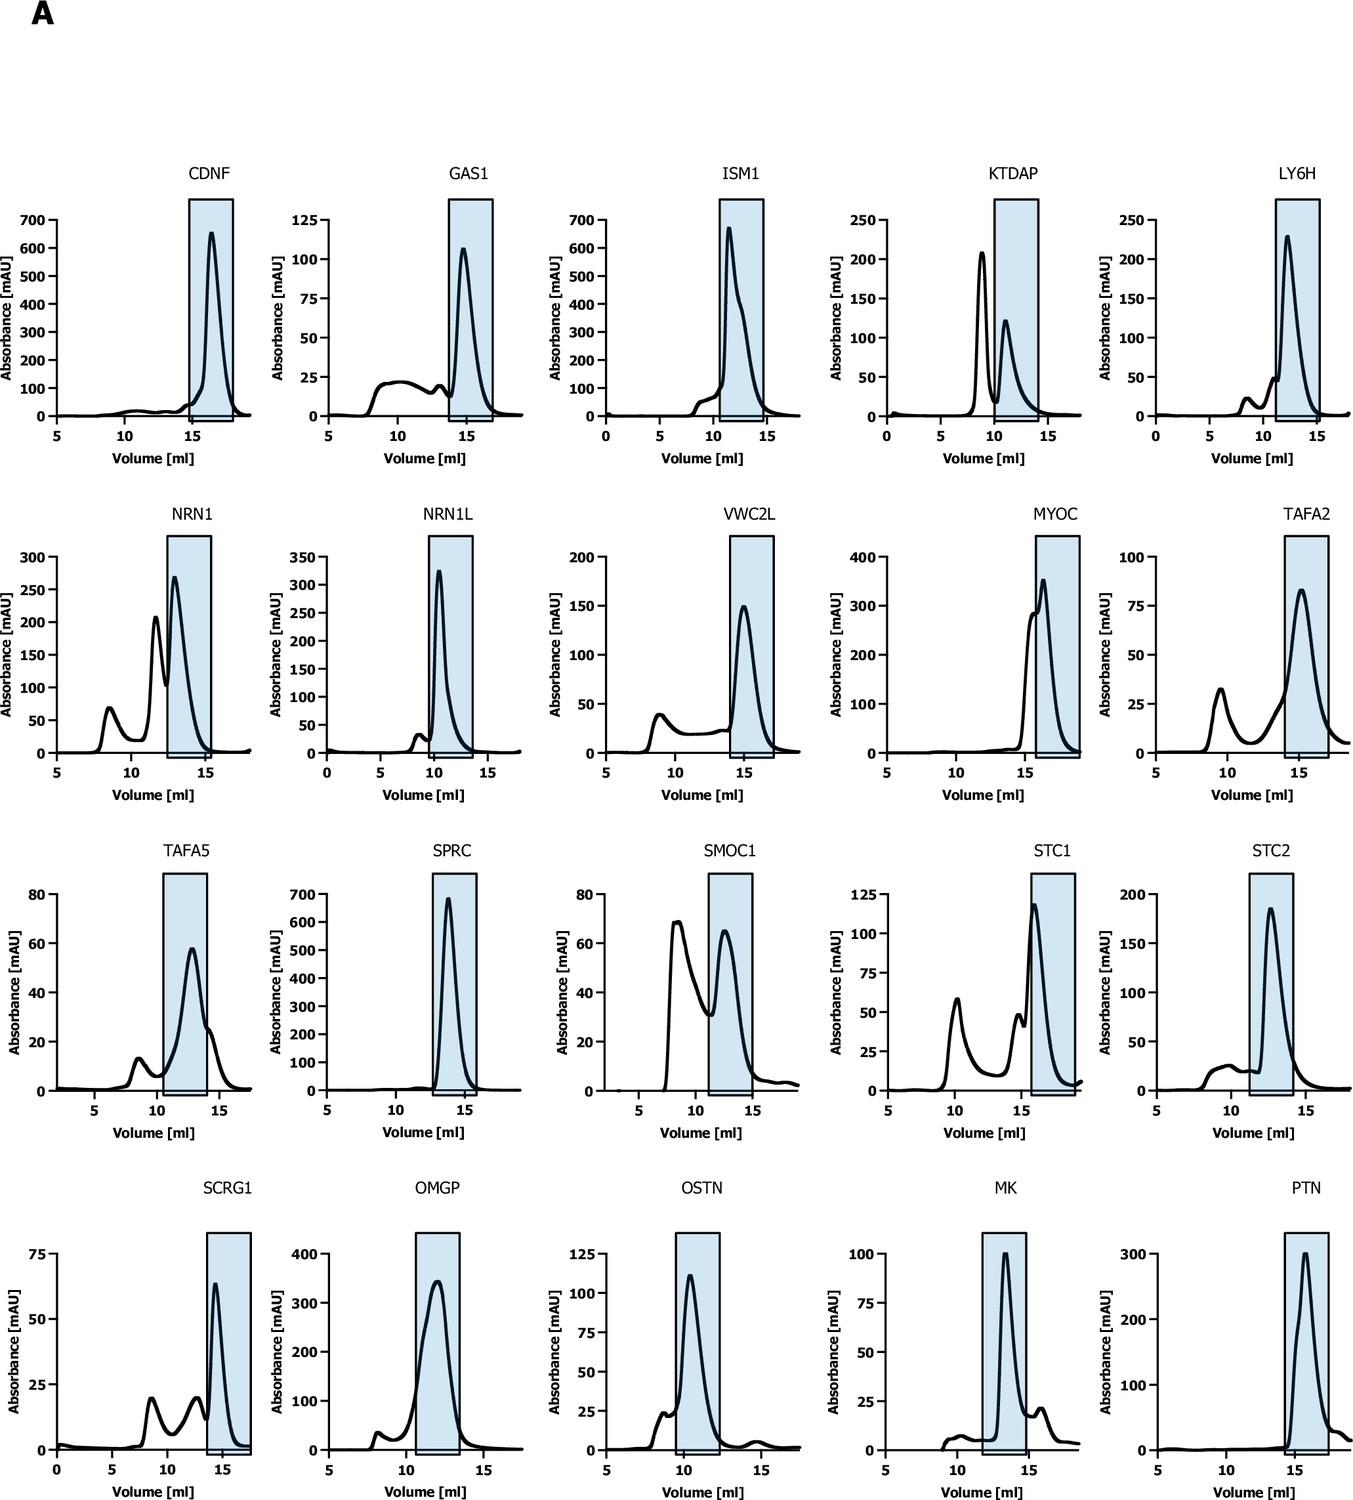
Size-exclusion chromatography.
(A) Size-exclusion chromatography traces of secreted ligand bait proteins used in the CRISPR activation (CRISPRa) enrichment workflow.
Figure 2—figure supplement 3
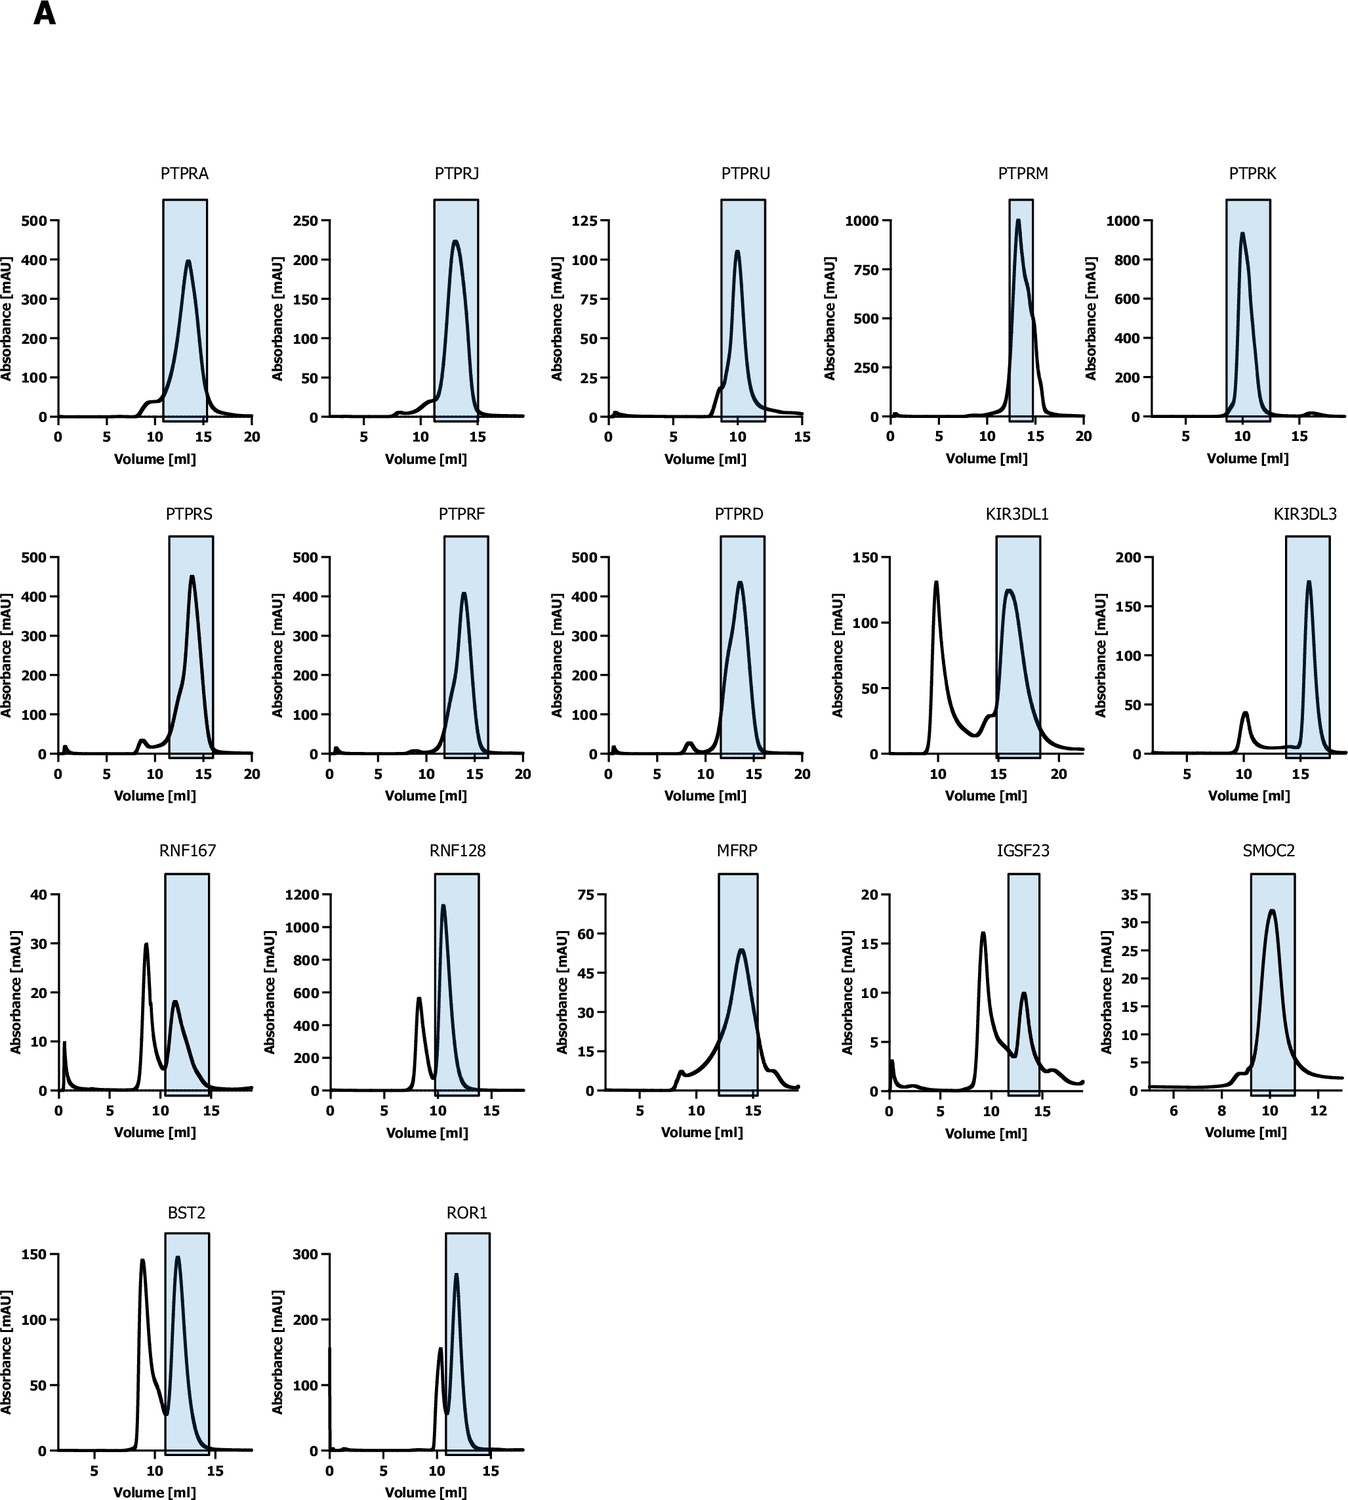
Size-exclusion chromatography.
(A) Size-exclusion chromatography traces of proteins used for surface plasmon resonance (SPR) validation.
Figure 2—figure supplement 4

Gene disease association (GDA) high-priority secreted ligands.
(A) GDA cytoscape network for the high-priority secreted ligands that were successfully expressed and used for screening. A full GDA analysis can be found in Figure 2—source data 3 and fully annotated cytoscape node/edge network view can be found in Figure 2—source data 3.cys.
Figure 3 with 1 supplement
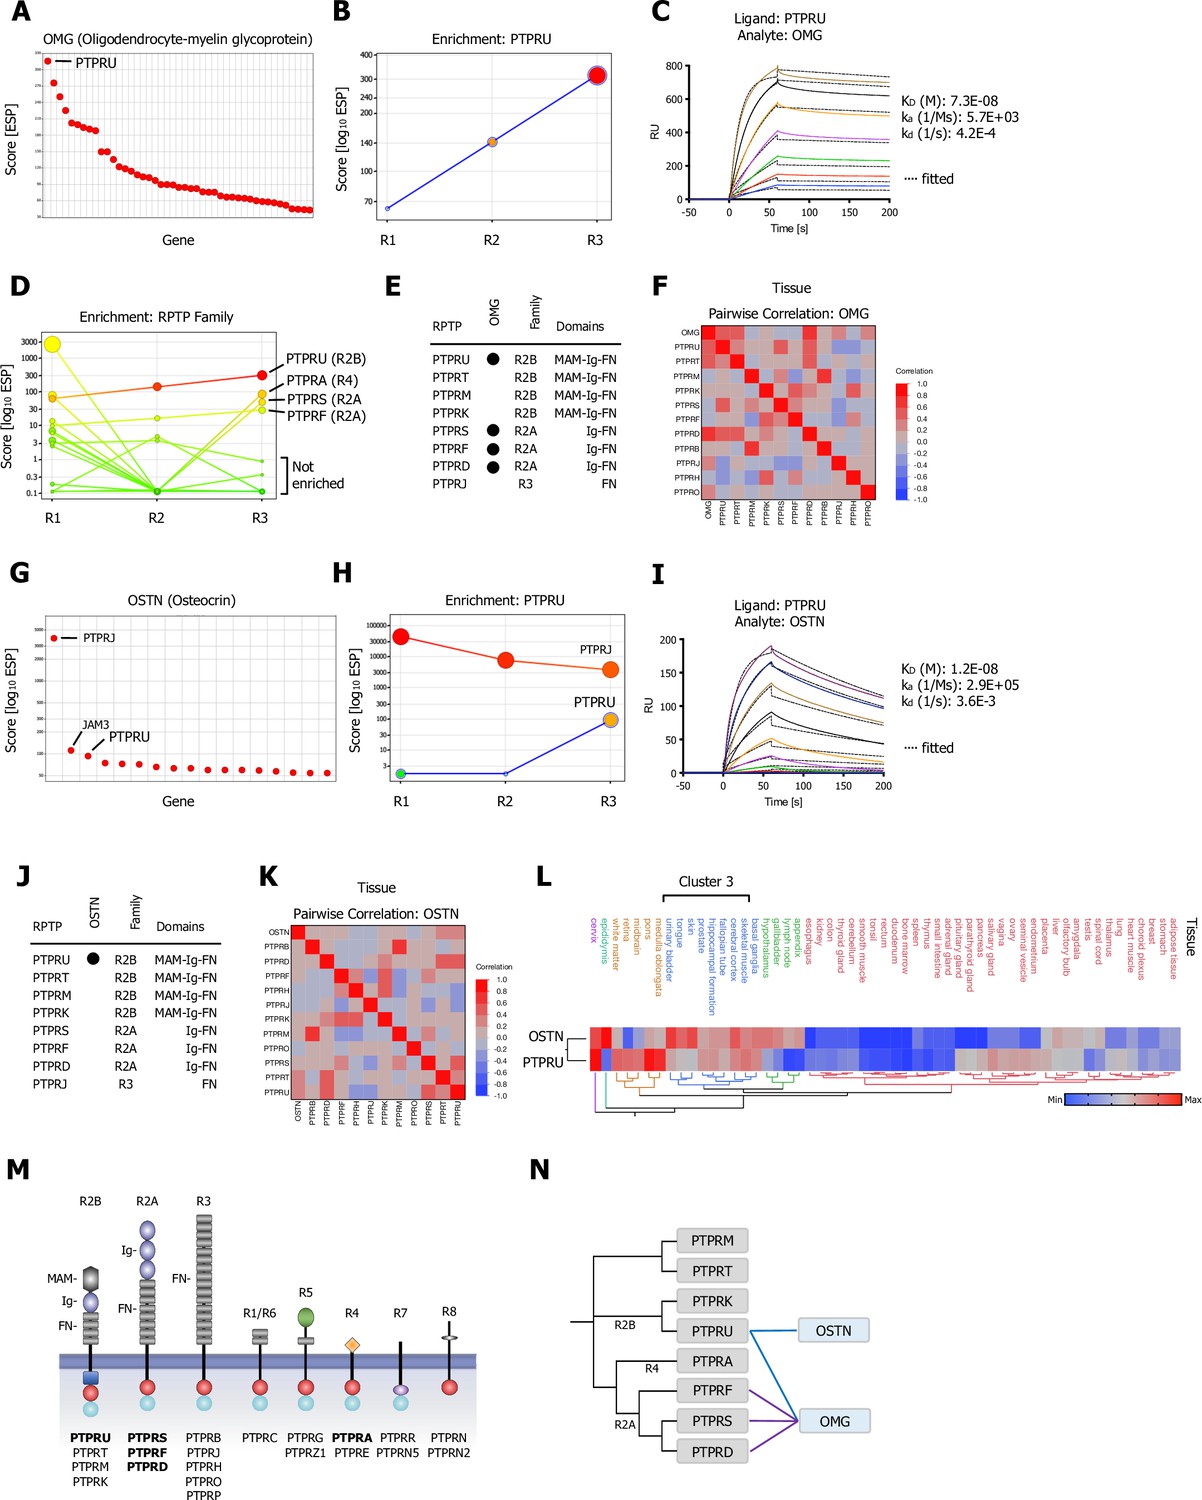
CRISPR activation (CRISPRa) screening results and surface plasmon resonance (SPR) validation of Type R2A and Type R2B PTPRs for OMG (Oligodendrocyte-myelin glycoprotein) and OSTN (Osteocrin).
(A) Ranked x/y scatter plot of Round 3 of the OMG screen. (B) Depicts the trajectory of the highest ranking candidate, PTPRU, plotting ESP scores for all three consecutive rounds of selections in a x/y enrichment plot. The size of the bubble represents the pValue (−log10). (C) SPR sensorgram and binding kinetics for human PTPRU-ECD (ligand) binding to human OMG (analyte), sensograms were fitted using a 1:1 binding model; raw data are shown in color, fitted data are shown as black dotted lines. (D) Shows enrichment scores for additional members of the receptor protein tyrosine phosphatase (RPTP) family members found in the OMG screen. (E) Summary of SPR results testing binding of R2A, R2B, and R3 RPTP subfamily members (Figure 3—figure supplement 1A). (F) Multivariate heatmaps for OMG calculated from normal tissue mRNA expression correlations. (G) OSTN screen ranked x/y scatter plot of Round 3 ESP scores; top three candidates as indicated. (H) Trajectory of high ranking candidates PTPRJ and PTPRU by plotting ESP scores for all three consecutive rounds of selections in an x/y enrichment plot; size of the bubble represents the pValue (−log10). (I) SPR sensorgram and binding kinetics for human PTPRU-ECD (ligand) binding to human OSTN (analyte), sensograms were fitted using a 1:1 binding model; raw data are shown in color, fitted data are shown as black dotted lines. (J) Summary of SPR results (Figure 3—figure supplement 1C) testing binding of OSTN (analyte) binding to R2A, R2B, and R3 RPTP subfamily members (ligands). (K) Multivariate heatmap for OSTN calculated from normal tissue mRNA expression correlations. (L) Hierarchical two-way clustering heatmap of normal tissue mRNA expression for OSTN and PTPRU. (M) Schematic representation of the domain architectures of RPTP subfamilies; PPIs as indicated. (N) Dendrogram of PTPR R2A, R2B, R4 subfamily members calculated from multiple sequence alignments (MSA) and visualization of the reported interactions in a node/edge network format, secreted ligands (blue) and cell surface receptor protein-protein interactions (PPIs) observed (gray). Interactions (edges) resulting from CRISPRa enrichment screens are represented in dark blue, interactions resulting from phylogenetic homology analysis (PHA) are visualized in purple.
Figure 3—figure supplement 1
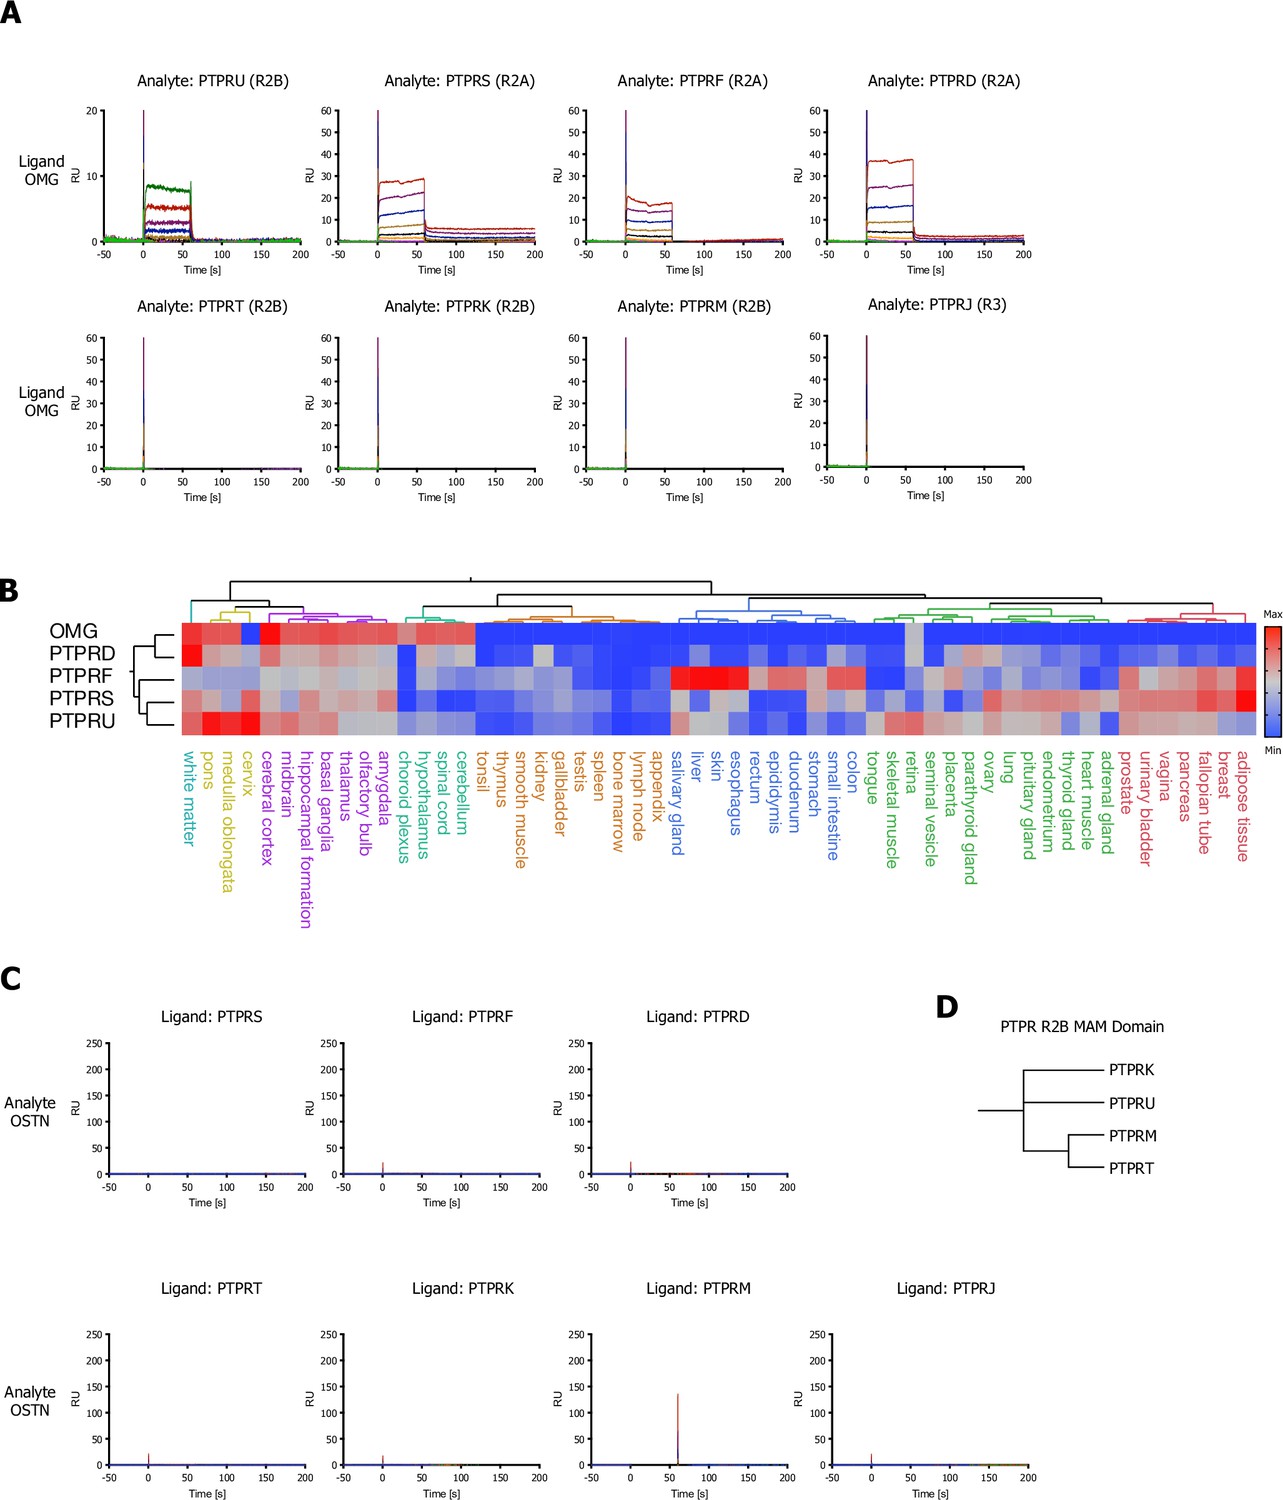
PTPR subfamily-related surface plasmon resonance (SPR) sensograms for oligodendrocyte-myelin glycoprotein (OMG) and OSTN and hierarchical clustering analysis of normal tissue for OMG.
(A) SPR sensorgrams for human OMG (ligand) and receptor protein tyrosine phosphatase (RPTP) subfamily members (analytes): PTPRU, PRPRF, PTPRS, PTPRD, PTPRJ, PTPRT, PTPRK, PTPRM (ECDs). (B) Hierarchical two-way clustering of mRNA expression data from normal tissue for OMG and RPTP subfamily members. (C) SPR sensorgram curves for human OSTN (analyte) and RPTP subfamily members (ligands): PRPRF, PTPRS, PTPRD, PTPRJ, PTPRT, PTPRK, PTPRM (ECDs). (D) Dendrogram of the PTPR R2B subfamily calculated from multiple sequence alignments (MSA) of the MAM domain.
Figure 4 with 1 supplement
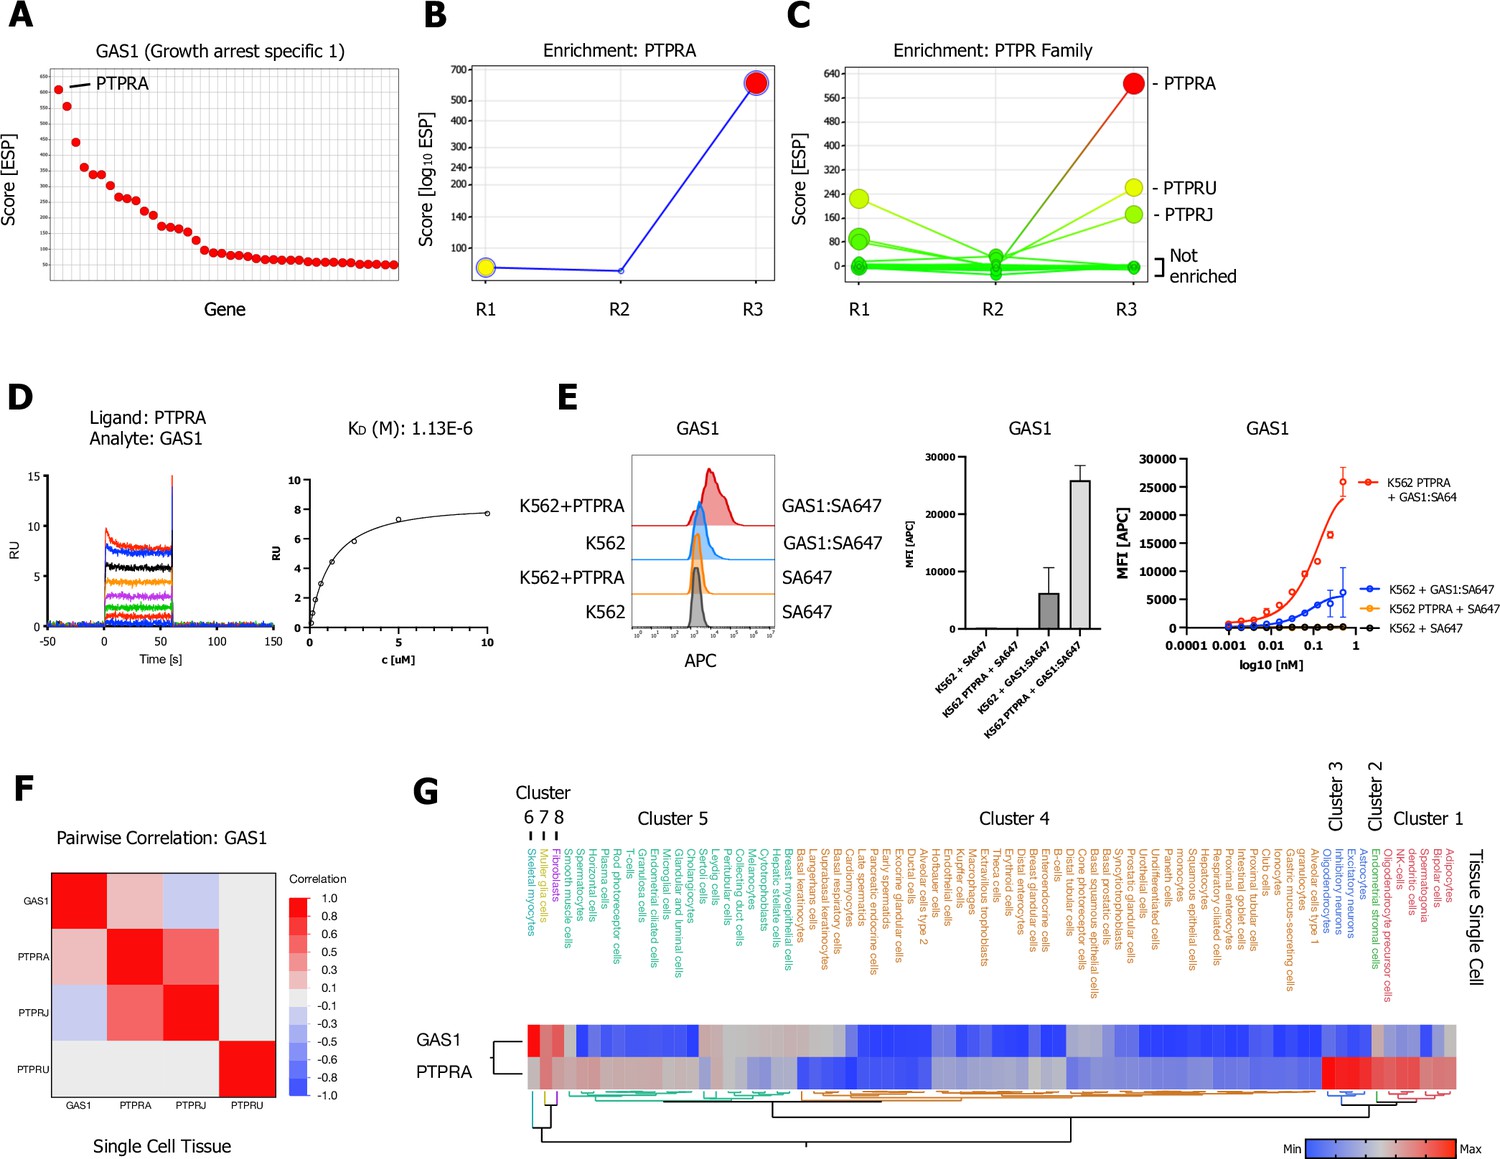
Growth arrest specific 1 (GAS1) CRISPR activation (CRISPRa) enrichment screen identifies receptor protein tyrosine phosphatase (RPTP) subfamily member PTPRA.
(A) Ranked x/y scatter plot for the GAS1 CRISPRa enrichment screen (ESP scores). (B) Trajectory plot of the highest ranking candidate PTPRA for all three consecutive rounds of selections in an x/y enrichment plot, size of the bubble represents the pValue (−log10). (C) Comparison of ESP trajectories for PTPRA and two lower scoring RPTP subfamily members (PTPRU, PTPRJ). (D) Surface plasmon resonance (SPR) sensorgram and steady-state curve for human GAS1 (analyte) binding to PTPRA-ECD (ligand) binding in comparison to PTPRU and PTPRJ (Figure 4—figure supplement 1A, B; no binding observed). (E, Figure 4—figure supplement 1C, B) Cell surface staining of K562 (untransduced) or K562 cells lentivirally transduced with FLAG-tagged full-length PTPRA with GAS1:SA-647 tetramers (400 nM) and analysis by flow cytometry, representative FACS histograms, quantification, and full titration (1:1 dilutions; 400 nM tetramer). Data are represented as mean ± SD (n=3). (F) Multivariate heatmaps for GAS1 and the PTPRA, PTPRU, and PTPRJ calculated from single-cell normal tissue mRNA expression correlations. (G) Hierarchical two-way clustering heatmap of single-cell normal tissue mRNA expression for GAS1 and PTPRA.
Figure 4—figure supplement 1
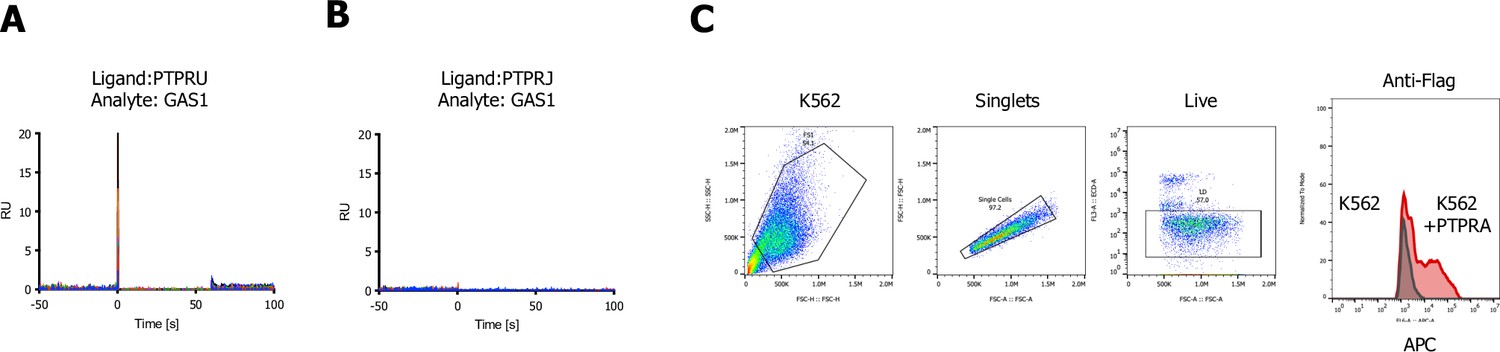
Growth arrest specific 1 (GAS1) screen-related surface plasmon resonance (SPR) sensograms.
(A, B) SPR sensorgrams for testing binding of GAS1 to PTPRU or PRPRJ (no binding observed). (C) Gating strategy and staining of K562 or K562 cells transduced with FLAG-tagged full-length PTPRA using an allophycocyanin (APC)-labeled FLAG-antibody.
Figure 5 with 1 supplement
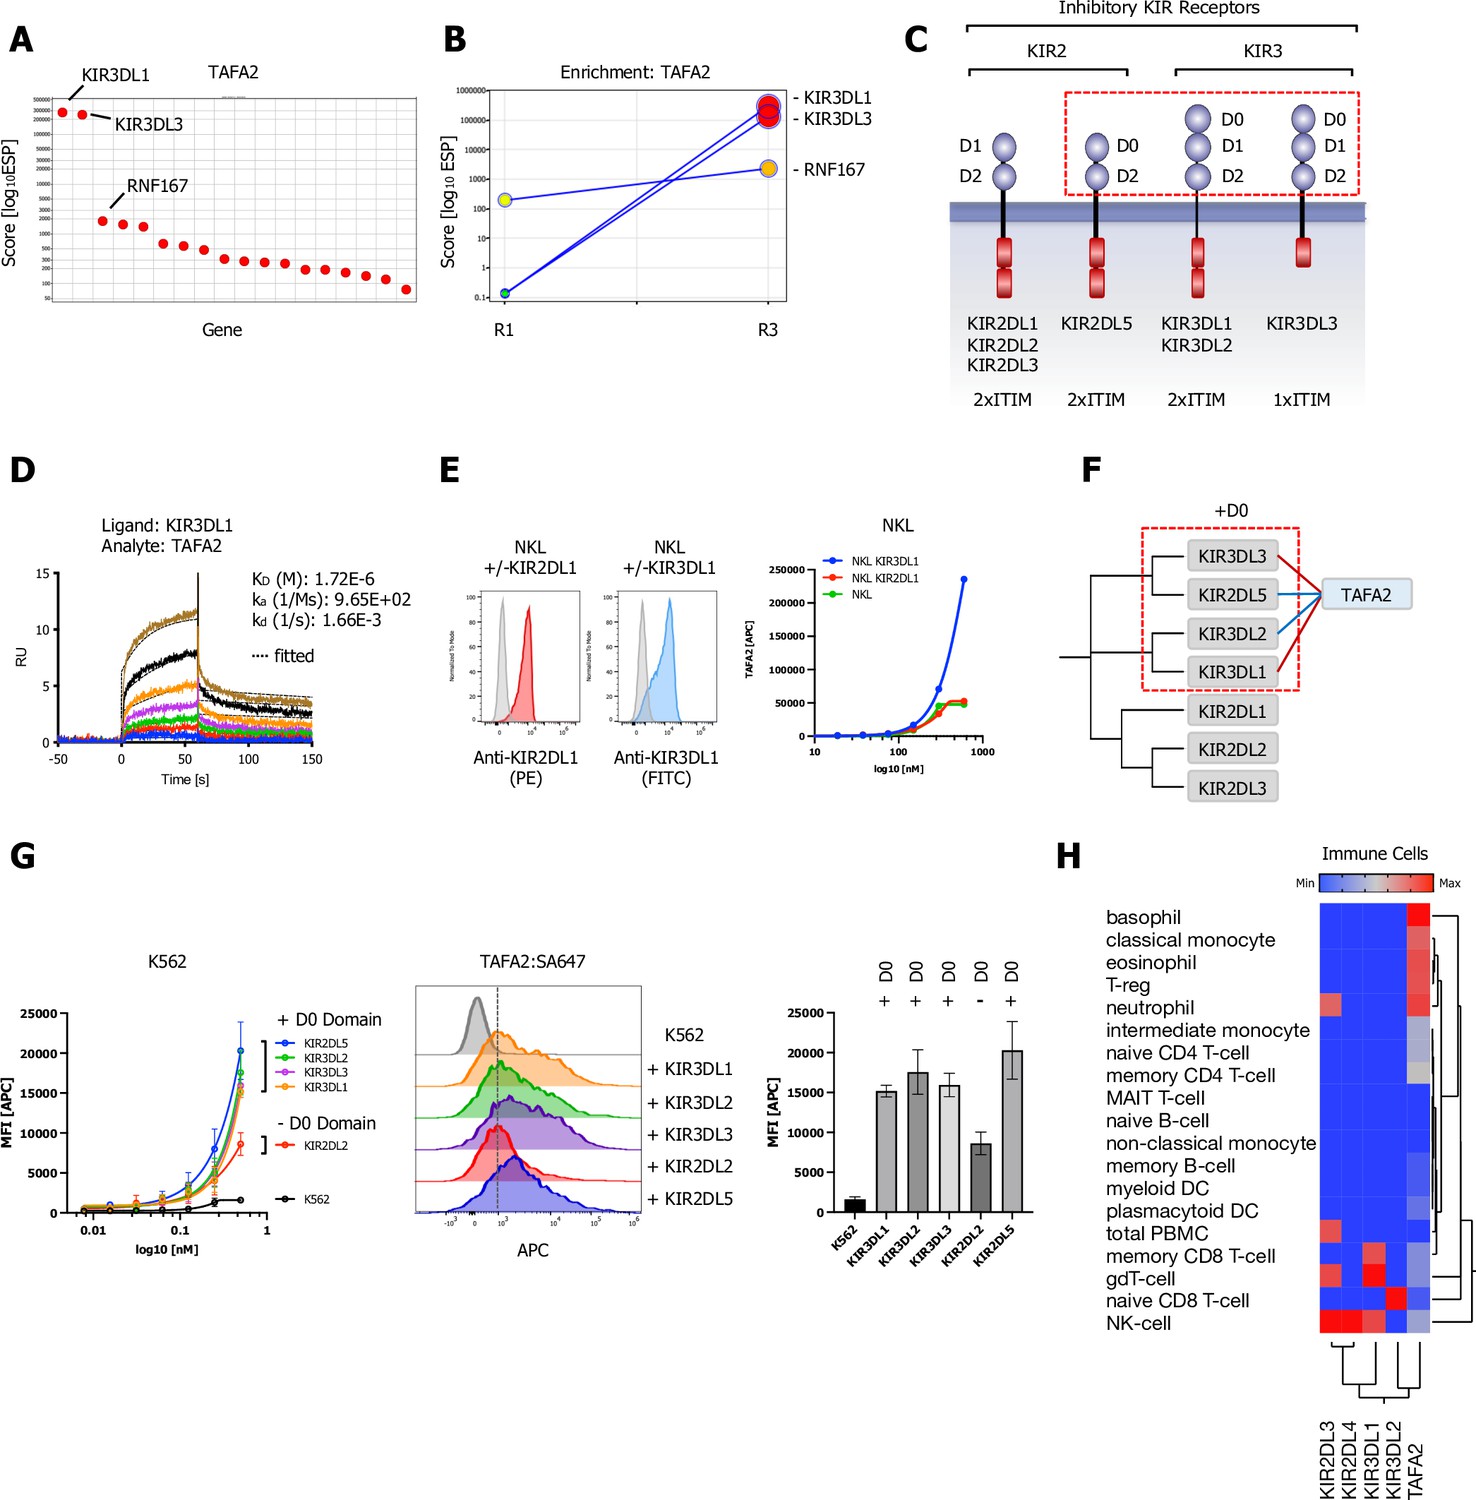
Killer immunoglobulin-like receptor (KIR) subfamily protein-protein interactions (PPIs) identified by CRISPR activation (CRISPRa) screening and phylogenetic homology analysis (PHA) approach for TAFA2.
(A) ESP rank plot of the TAFA2 CRISPRa enrichment screen. (B) Trajectory plot of the top three ranking candidates for all consecutive rounds of selections in a x/y enrichment plot, size of the bubble represents the pValue (−log10). (C) Schematic representation of the domain architecture of KIR2 and KIR3 subfamily members of inhibitory KIRs. (D) Surface plasmon resonance (SPR) sensorgrams and binding kinetics for human TAFA2 (analyte) binding to KIR3DL1-ECD (ligand), sensograms were fitted using a 1:1 binding model; raw data are shown in color, fitted data are shown as black dotted lines. (E) Cell surface staining of NKL or NKL cells expressing KIR3DL1, KIR2DL1 with TAFA2:SA-647 tetramers (200 nM) and analysis by flow cytometry. (F) Dendrogram of the KIR2 and KIR3 subfamily calculated from multiple sequence alignments of KIR ECDs (gray) and PPIs (TAFA2; blue) observed in the CRISPRa screen (red) and predicted by PHA (blue). (G) Cell surface staining of K562 control cells or K562 cells lentivirally transduced with full-length KIR3DL1, KIR3DL2, KIR3DL3, KIR2DL2, or KIR2DL5A (FLAG-tagged; Figure 5—figure supplement 1C) with TAFA2:SA-647 tetramers (200 nM) and analysis by flow cytometry: full titration (1:1 dilutions; 200 nM tetramer), representative FACS histograms and quantification (200 nM tetramer). Data are represented as mean ± SD (n=3). (H) Hierarchical two-way clustering heatmap of immune cell mRNA expression data for TAFA2, KIR2, and KIR3 subfamily members.
Figure 5—figure supplement 1
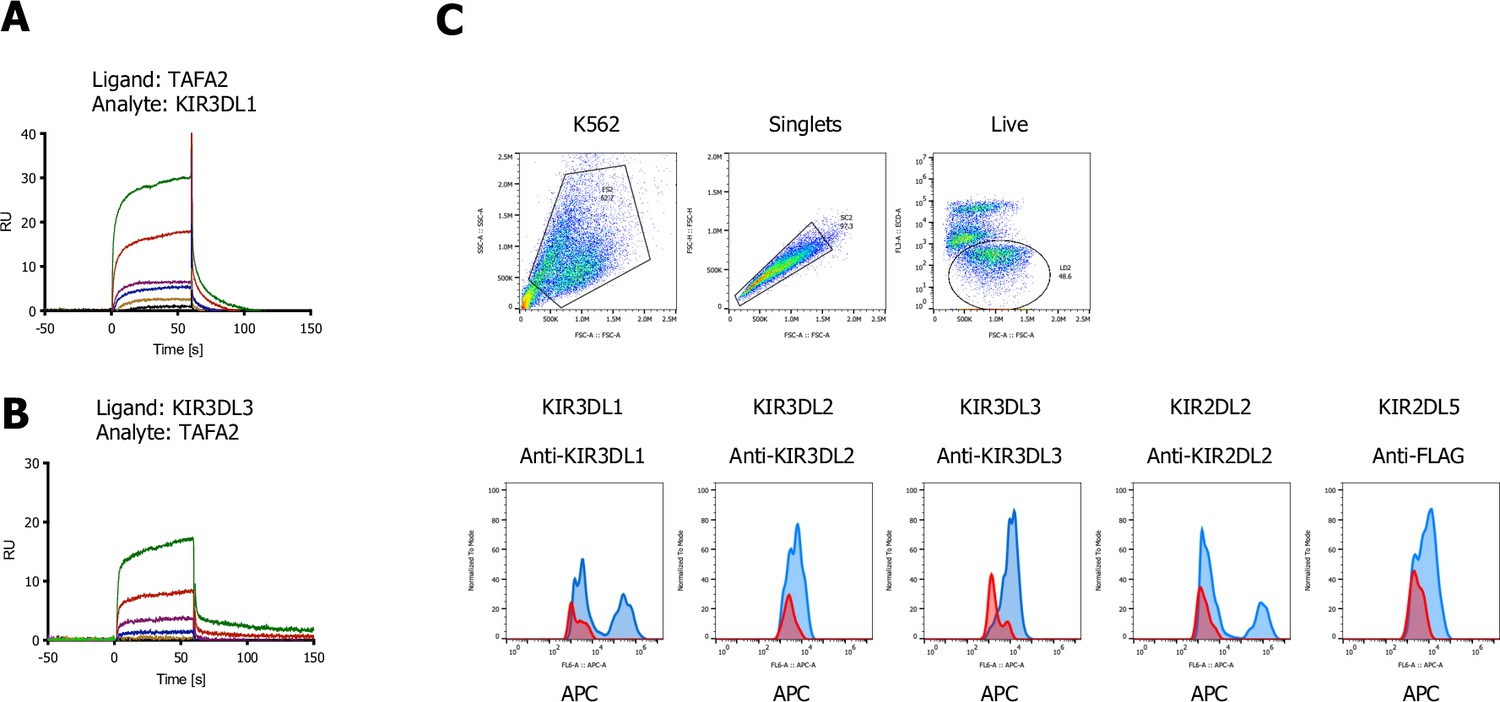
TAFA2 screen-related surface plasmon resonance (SPR) sensograms for KIR3 family members.
(A, B) SPR sensorgrams for binding of TAFA-2 to KIR3DL1 and KIR3DL3 ECDs, respectively. (C) Gating strategy of K562 cells lentivirally transduced with KIR3DL1, KIR3DL2, KIR3DL3, KIR2DL2, or KIR2DL5A (FLAG-tagged) stained with the indicated allophycocyanin (APC)-labeled antibodies (blue) compared to untransduced K562 parental cells (red).
Figure 6 with 1 supplement
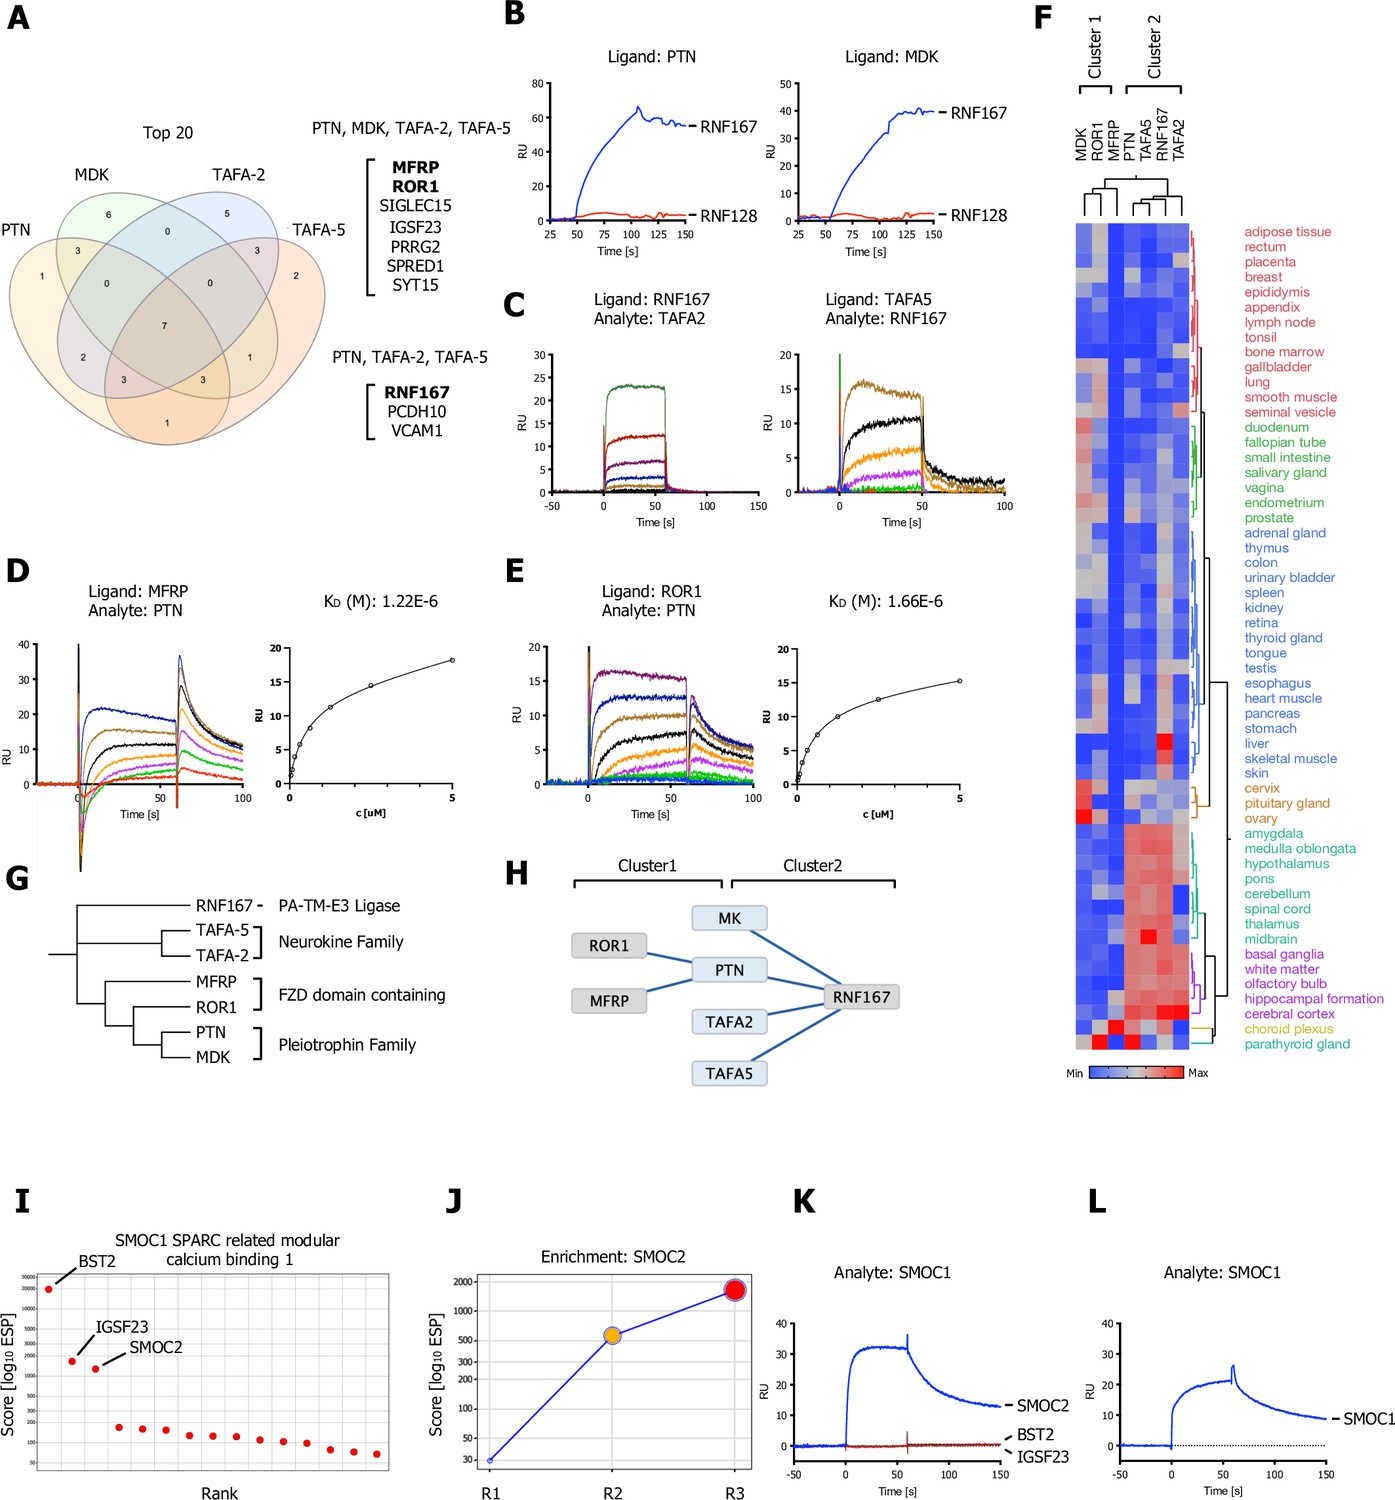
Shared hits for the pleiotrophin family (MDL, PTN), neurokine family members (TAFA-2 and TAFA-5), and a SPARC-related ligand (SMOC1).
(A) Venn diagram depicting overlap of the top 20 ranking candidates for PTN, MK (MDK), TAFA-2, and TAFA-5 screens. Shared hits for PTN, MK, TAFA-2, TAFA-5, and shared candidates for PTN, TAFA-2, and TAFA-5 screens are listed. (B) PTN or MDK ectodomains were captured on sensors (ligands) and analyzed for binding to RNF167 (RNF128 was used as a negative control and showed no binding). (C) Surface plasmon resonance (SPR) sensorgrams for human TAFA-2 and TAFA-5 binding to RNF167-ECD in comparison to MCAM (Figure 6—figure supplement 1A; no binding observed). (D, E) SPR sensorgrams and steady-state curves for human PTN (analyte) binding to MFRP-ECD and ROR1-ECD (ligand) in comparison to human MDK (Figure 6—figure supplement 1B, C; no binding observed). (F) Hierarchical two-way clustering of mRNA expression data from normal tissue for PTN, MDK, TAFA-2, TAFA-5, RNF167, MFRP, and ROR1. Cluster 1 (MDK, ROR1, MFRP) and Cluster 2 (PTN, TAFA2, TAFA5, RNF167) are indicated. (G) Dendrogram of PTN, MDK, TAFA-2, TAFA-5, RNF167, MFRP, and ROR1 calculated from multiple sequence alignments (MSA). (H) Visualization of the reported interactions in a node/edge network format with indicated clusters, of secreted ligands (blue) and cell surface receptor protein-protein interactions (PPIs) observed (gray). (I) SMOC1 screening results visualized in ranked x/y scatter plot (ESP scores). (J) Trajectory plot of SMOC2 for all three consecutive rounds of selections in a x/y enrichment plot, size of the bubble represents the pValue (−log10). (K, L) BST2, IGSF23, and SMOC2 ECDs were captured on sensors (ligands) and analyzed for binding to SMOC1 (analyte), SPR assay showing binding of SMOC1 (analyte) to SMOC2 or SMOC1, immobilized on a sensor chip (ligand).
Figure 6—figure supplement 1
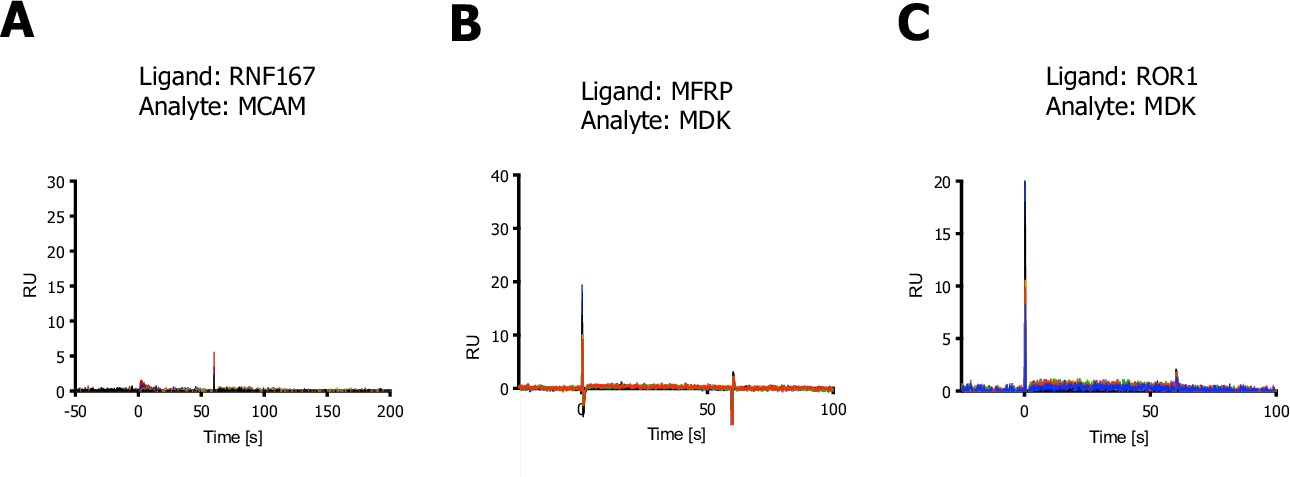
RNF167 and MDK-related surface plasmon resonance (SPR) sensograms.
(A) SPR sensogram, MCAM was used as a negative, unrelated binding control for RNF167 (no binding observed). (B–C) SPR sensorgrams for testing binding of MDK to MFRP or ROR1 (no binding observed).
Figure 7 with 1 supplement
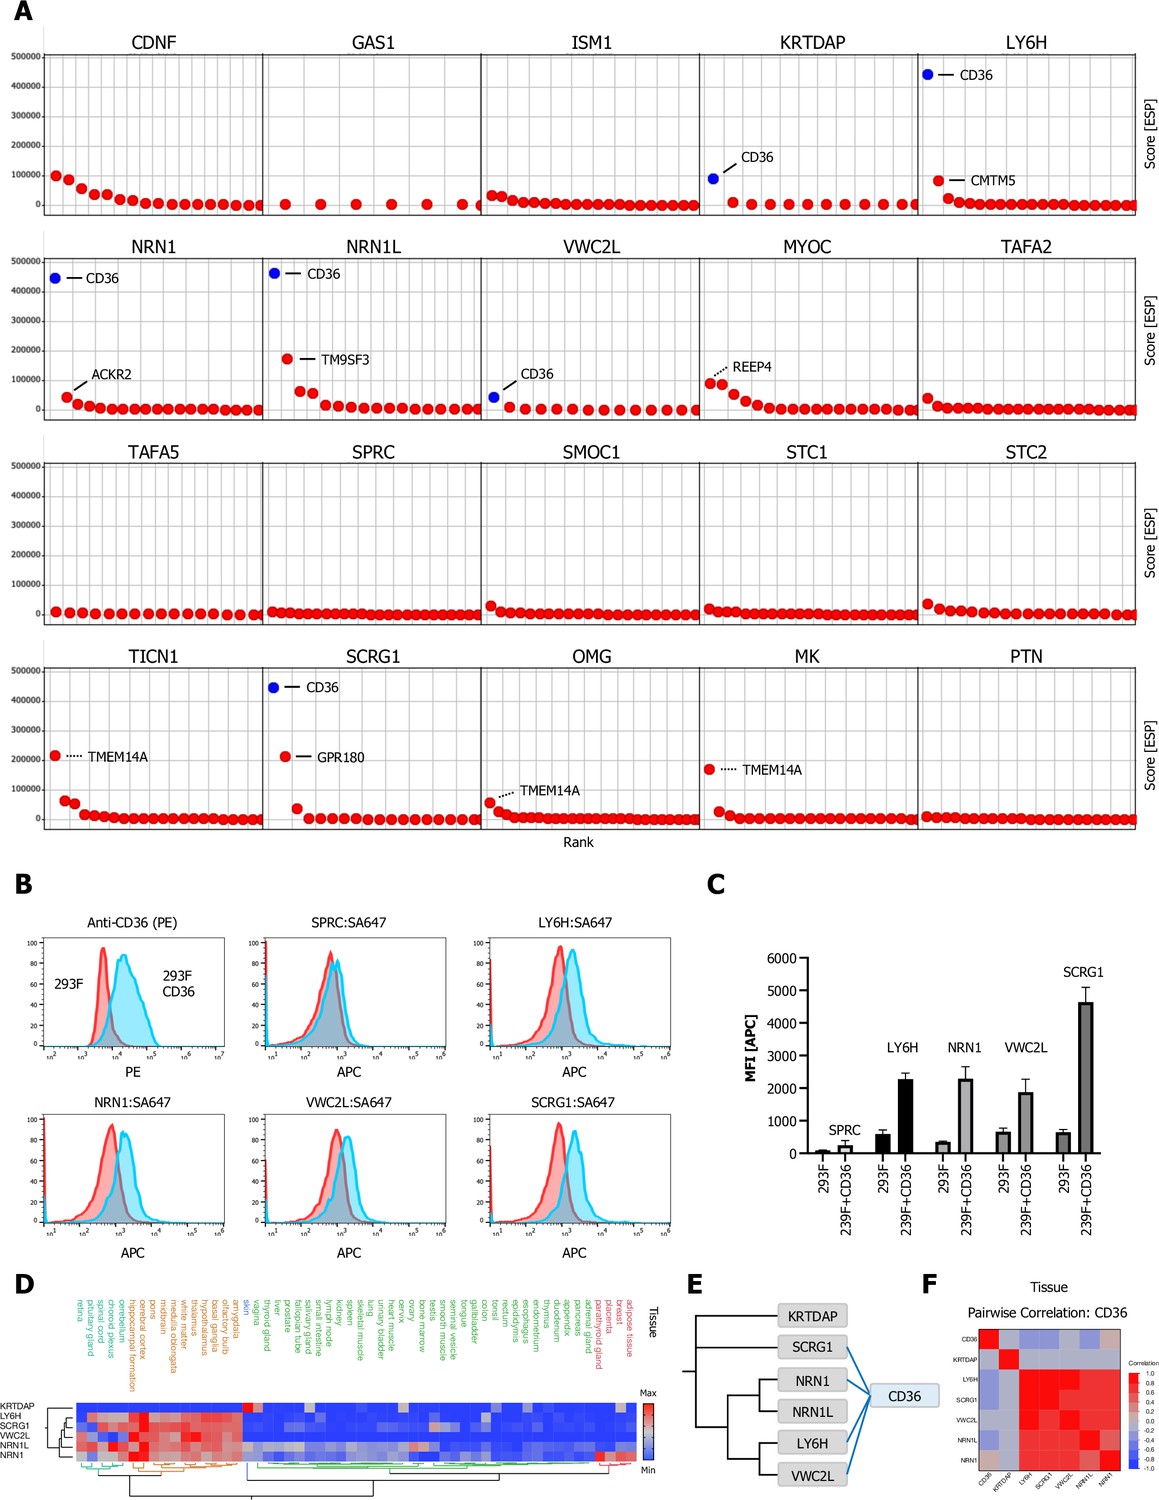
Multifunctional scavenger receptor CD36 binds multiple secreted ligands.
(A) Ranked ESP scatter trellis plots of all analyzed multi-pass transmembrane (TM2+) library screens shows CD36 as the highest ranking hit for multiple screens (CD36 indicated in blue), top two ranking hit candidates are labeled as indicated. False positive candidates are indicated by dotted lines (TMTM14A, REEP4). (B–C) Cell surface staining of full-length CD36-transfected and control cells with SA-647 tetramerized (400 nM) LY6H, NRN1, VWC2L, or SCRG1 and analysis by flow cytometry, SPRC tetramers (SPRC:SA647) served as a negative (non-CD36 enriched) control. (B) Representative histograms (red, control cells; blue, CD36 positive cells). (C) Quantification of flow data (Data are represented as mean ± SD ; n=3); data are represented as mean ± SD. (D) Hierarchical two-way clustering heatmap of normal tissue cell mRNA expression data for CD36 and the indicated CD36 enriched screens. (E) Dendrogram of observed CD36 (blue) protein-protein interactions (PPIs) in the indicated CRISPRa screens (gray) calculated from multiple sequence alignments of the indicated secreted ligands (gray). (F) Multivariate correlation analysis of normal tissue cell mRNA expression data for CD36 and the indicated CD36 enriched screens.
Figure 7—figure supplement 1
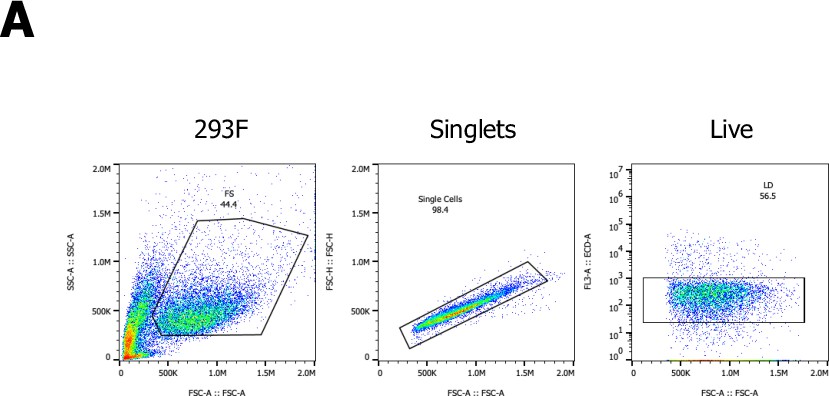
Gating strategy of 293F cells.
Tables
Table 1
Summary of the new protein-protein interactions (PPIs) tested in this study.
Source indicates whether the PPI was discovered in the indicated CRISPR activation (CRISPRa) enrichment screen (Screen) or by phylogenetic homology analysis (PHA). Assay indicates whether interaction was tested by SPR or CSS (SPR conditions are included in Figure 2—source data 5 ).
| Interaction | Screen | Hit | Library | Source | Assay |
|---|---|---|---|---|---|
| GAS1-PTPRA | GAS1 | PTPRA | TM1 | Screen | SPR, CSS |
| OMG-PTPRD | OMG | PTPRD | TM1 | PHA | SPR |
| OMG-PTPRF | OMG | PTPRF | TM1 | PHA | SPR |
| OMG-PTPRS | OMG | PTPRS | TM1 | PHA | SPR |
| OMG-PTPRU | OMG | PTPRU | TM1 | Screen | SPR |
| OSTN-PTPRU | OSTN | PTPRU | TM1 | Screen | SPR |
| MK-RNF167 | MK | RNF167 | TM1 | Screen | SPR |
| PTN-RNF167 | PTN | RNF167 | TM1 | Screen | SPR |
| PTN-ROR1 | PTN | ROR1 | TM1 | Screen | SPR |
| PTN-MFRP | PTN | MFRP | TM1 | Screen | SPR |
| SMOC1-SMOC1 | SMOC1 | SMOC1 | TM1 | PHA | SPR |
| SMOC1-SMOC2 | SMOC1 | SMOC2 | TM1 | Screen | SPR |
| TAFA2-KIR3DL1 | TAFA2 | KIR3DL1 | TM1 | Screen | SPR, CSS |
| TAFA2-KIR3DL2 | TAFA2 | KIR3DL2 | TM1 | PHA | SPR, CSS |
| TAFA2-KIR3DL3 | TAFA2 | KIR3DL3 | TM1 | Screen | CSS |
| TAFA2-KIR2DL5A | TAFA2 | KIR2DL5A | TM1 | PHA | CSS |
| TAFA2-RNF167 | TAFA2 | RNF167 | TM1 | Screen | SPR |
| TAFA5-RNF167 | TAFA5 | RNF167 | TM1 | Screen | SPR |
| LY6H-CD36 | LY6H | CD36 | TM2+ | Screen | CSS |
| NRN1-CD36 | NRN1 | CD36 | TM2+ | Screen | CSS |
| SCRG1-CD36 | SCRG1 | CD36 | TM2+ | Screen | CSS |
| VWC2L-CD36 | VWC2L | CD36 | TM2+ | Screen | CSS |
-
PHA, phylogenetic homology analysis; SPR, surface plasmon resonance; CSS, cell surface staining.
Additional files
Download links
A two-part list of links to download the article, or parts of the article, in various formats.
Downloads (link to download the article as PDF)
Open citations (links to open the citations from this article in various online reference manager services)
Cite this article (links to download the citations from this article in formats compatible with various reference manager tools)
Identification of orphan ligand-receptor relationships using a cell-based CRISPRa enrichment screening platform
eLife 11:e81398.
https://doi.org/10.7554/eLife.81398


