SUMOylation of NaV1.2 channels regulates the velocity of backpropagating action potentials in cortical pyramidal neurons
- Department of Physiology and Cell Biology, Faculty of Health Sciences, Ben-Gurion University of the Negev, Israel
- Departments of Pediatrics and Physiology and Biophysics, University of California, Irvine, United States
- Department of Pharmaceutical Sciences, Northeastern University, United States
Figures
Figure 1
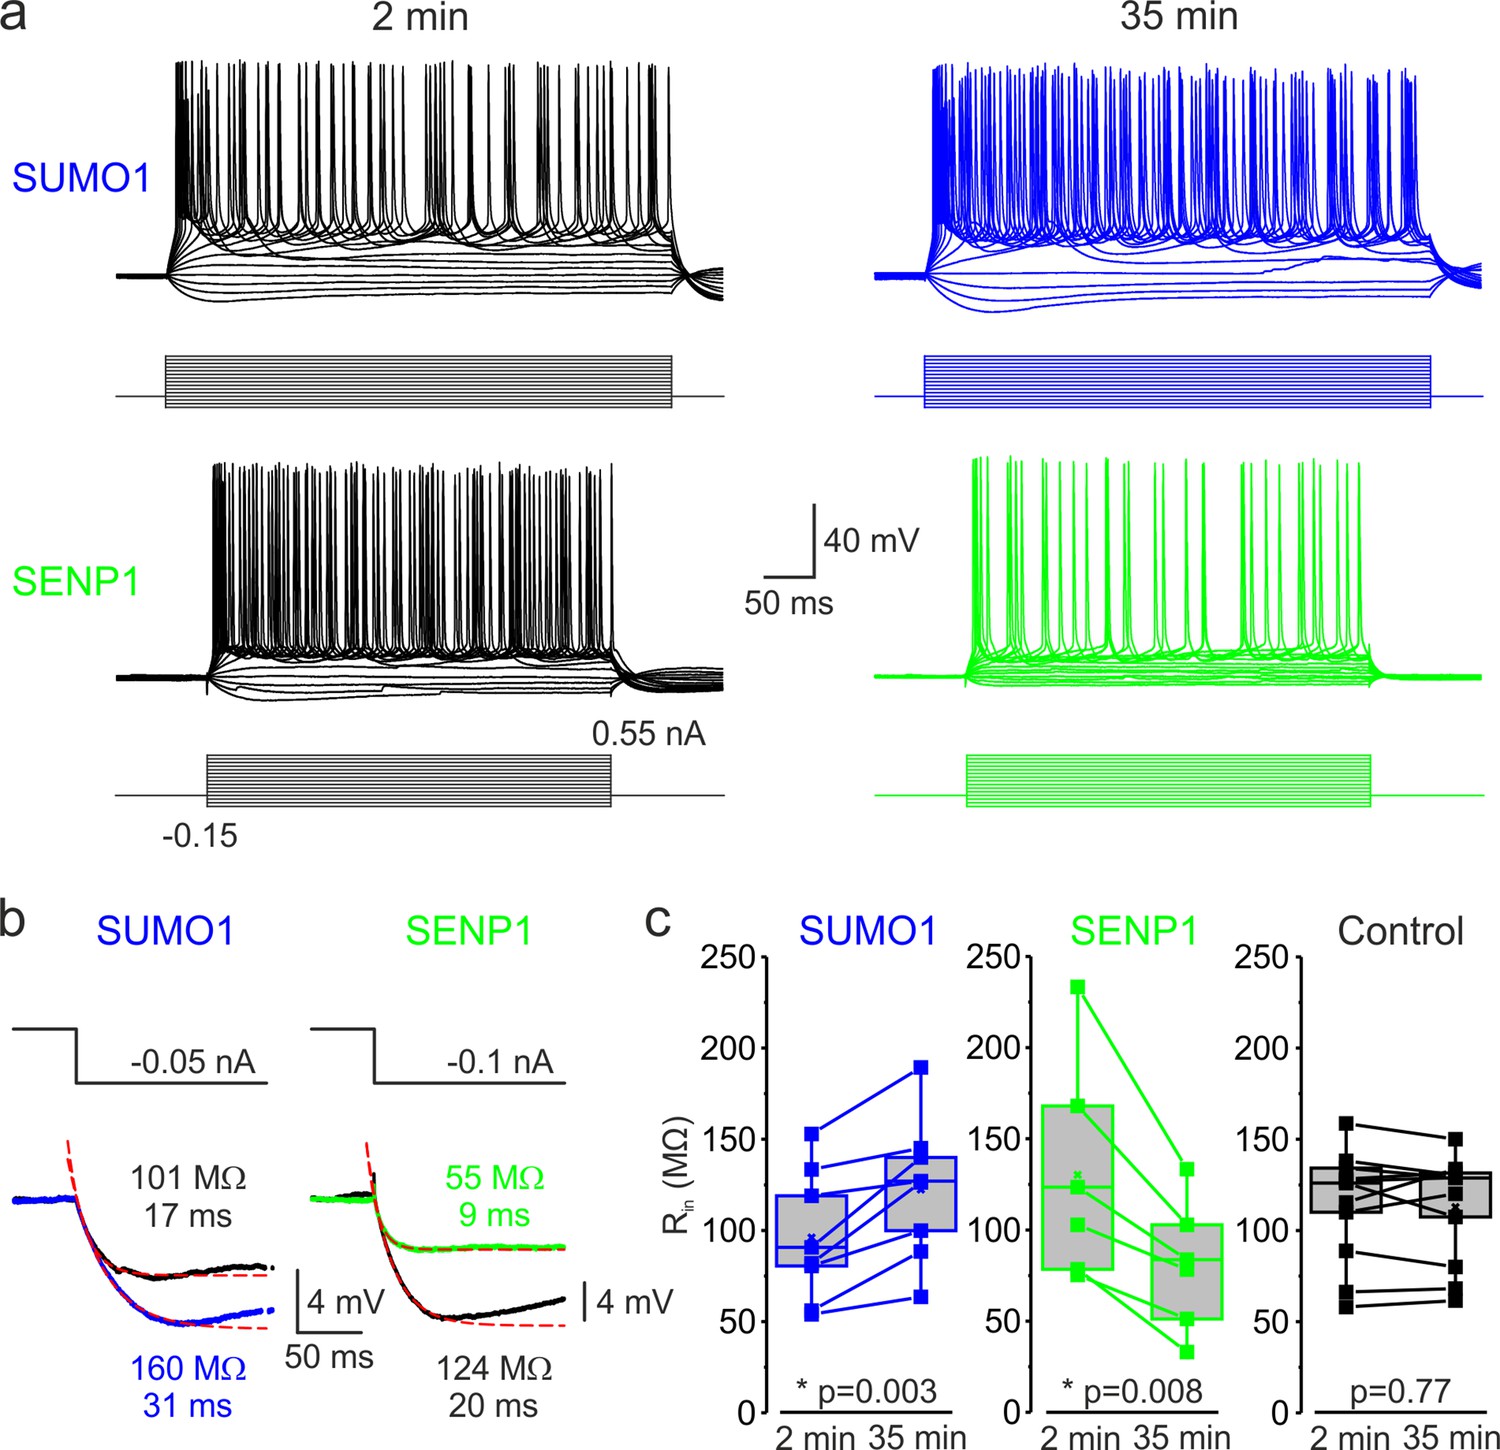
SUMOylation and deSUMOylation have opposing effects on the excitability of layer 5 pyramidal neurons.
(a) Current-clamp, whole-cell recordings from L5 neurons 2 min after the break-in to whole-cell mode (black) and 35 min later demonstrate time-dependent effects of SUMO1 (blue) or SENP1 (green) dialysis on firing frequency. Voltage responses were elicited by injecting 400-ms-long current pulses, which started at –0.15 nA and incremented by 50 pA. (b) SUMO1 and SENP1 have opposite effects on passive membrane properties. Voltage responses to a small hyperpolarizing current pulse injection immediately after the break-in (black) and following SUMO1 (blue) or SENP1 (green) dialysis via the whole-cell pipette. Red dashed lines are the best exponential fits of the voltage responses. Notice that the amplitude of voltage deflection and the membrane time constant were enhanced by SUMO1 and decreased by SENP1 dialysis. (c) Apparent input resistance (Rin) increases in SUMO1 dialyzed neurons, whereas it decreases in SENP1 dialyzed cells. The lines connect the paired Rin values obtained from the same individual neuron at 2 min and 35 min of recording with SUMO1 (blue), SENP1 (green), and control solution-filled pipette (black). Box plots represent the 25–75% interquartile range of values obtained from neurons dialyzed with SUMO1 (n = 8), SENP1 (n = 6), and control (n = 11) solution; the whiskers expand to the 5–95% range. A horizontal line inside the box represents the median of the distribution, and the mean is represented by a cross symbol (X). p-Values were calculated using Student’s t-test for paired data.
Figure 2
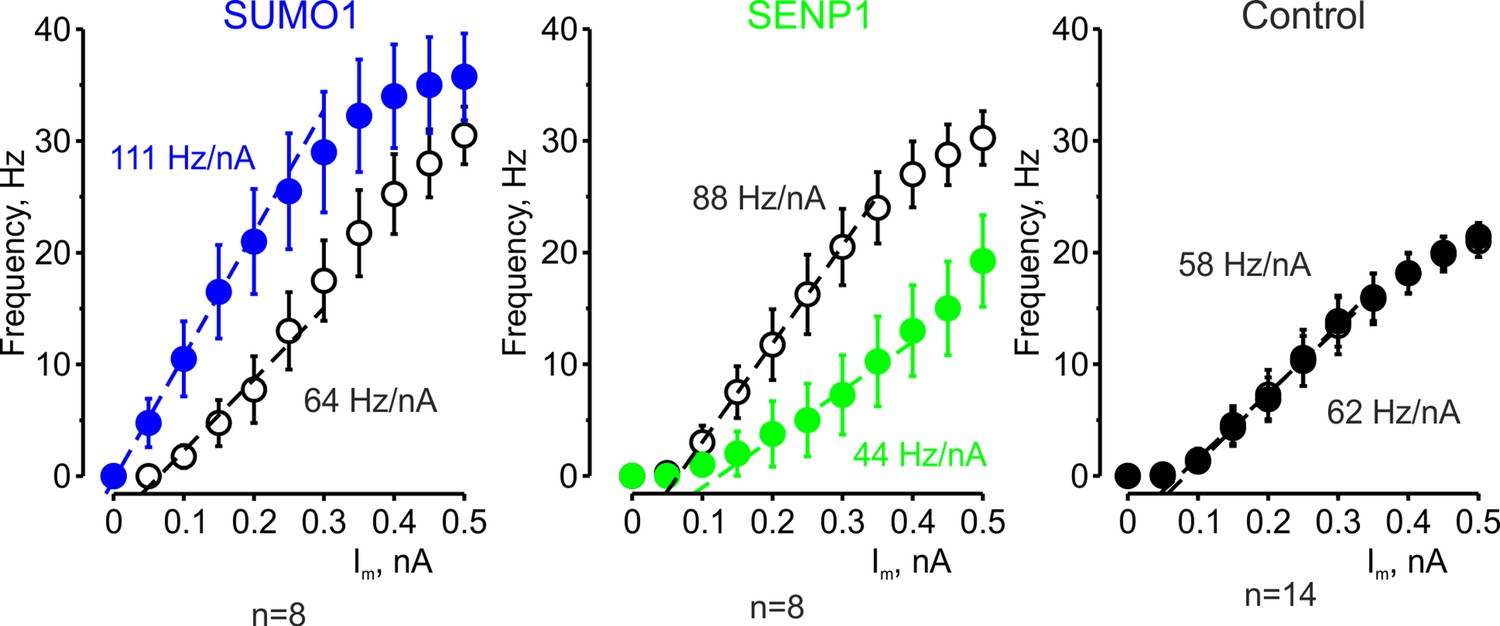
The effects of SUMO1 and SENP1 on input/output gain.
The frequency–current (F-I) characteristic of L5 pyramidal neurons, constructed by plotting the mean instantaneous spike frequency as a function of depolarizing current pulse amplitude, obtained immediately after the break-in (open black circles) and following 35 min of recording with SUMO1 (n = 8, blue), SENP1 (n = 8, green) and control solution (n = 14, closed black circles) containing pipette. Notice that the F-I curve was shifted to the left and became steeper in SUMO1 dialyzed neurons, whereas in SENP1 dialyzed cells the F-I characteristics were displaced to the right and its slope (dashed line) decreased. The F-I curve showed no significant change in control recordings.
Figure 3 with 1 supplement
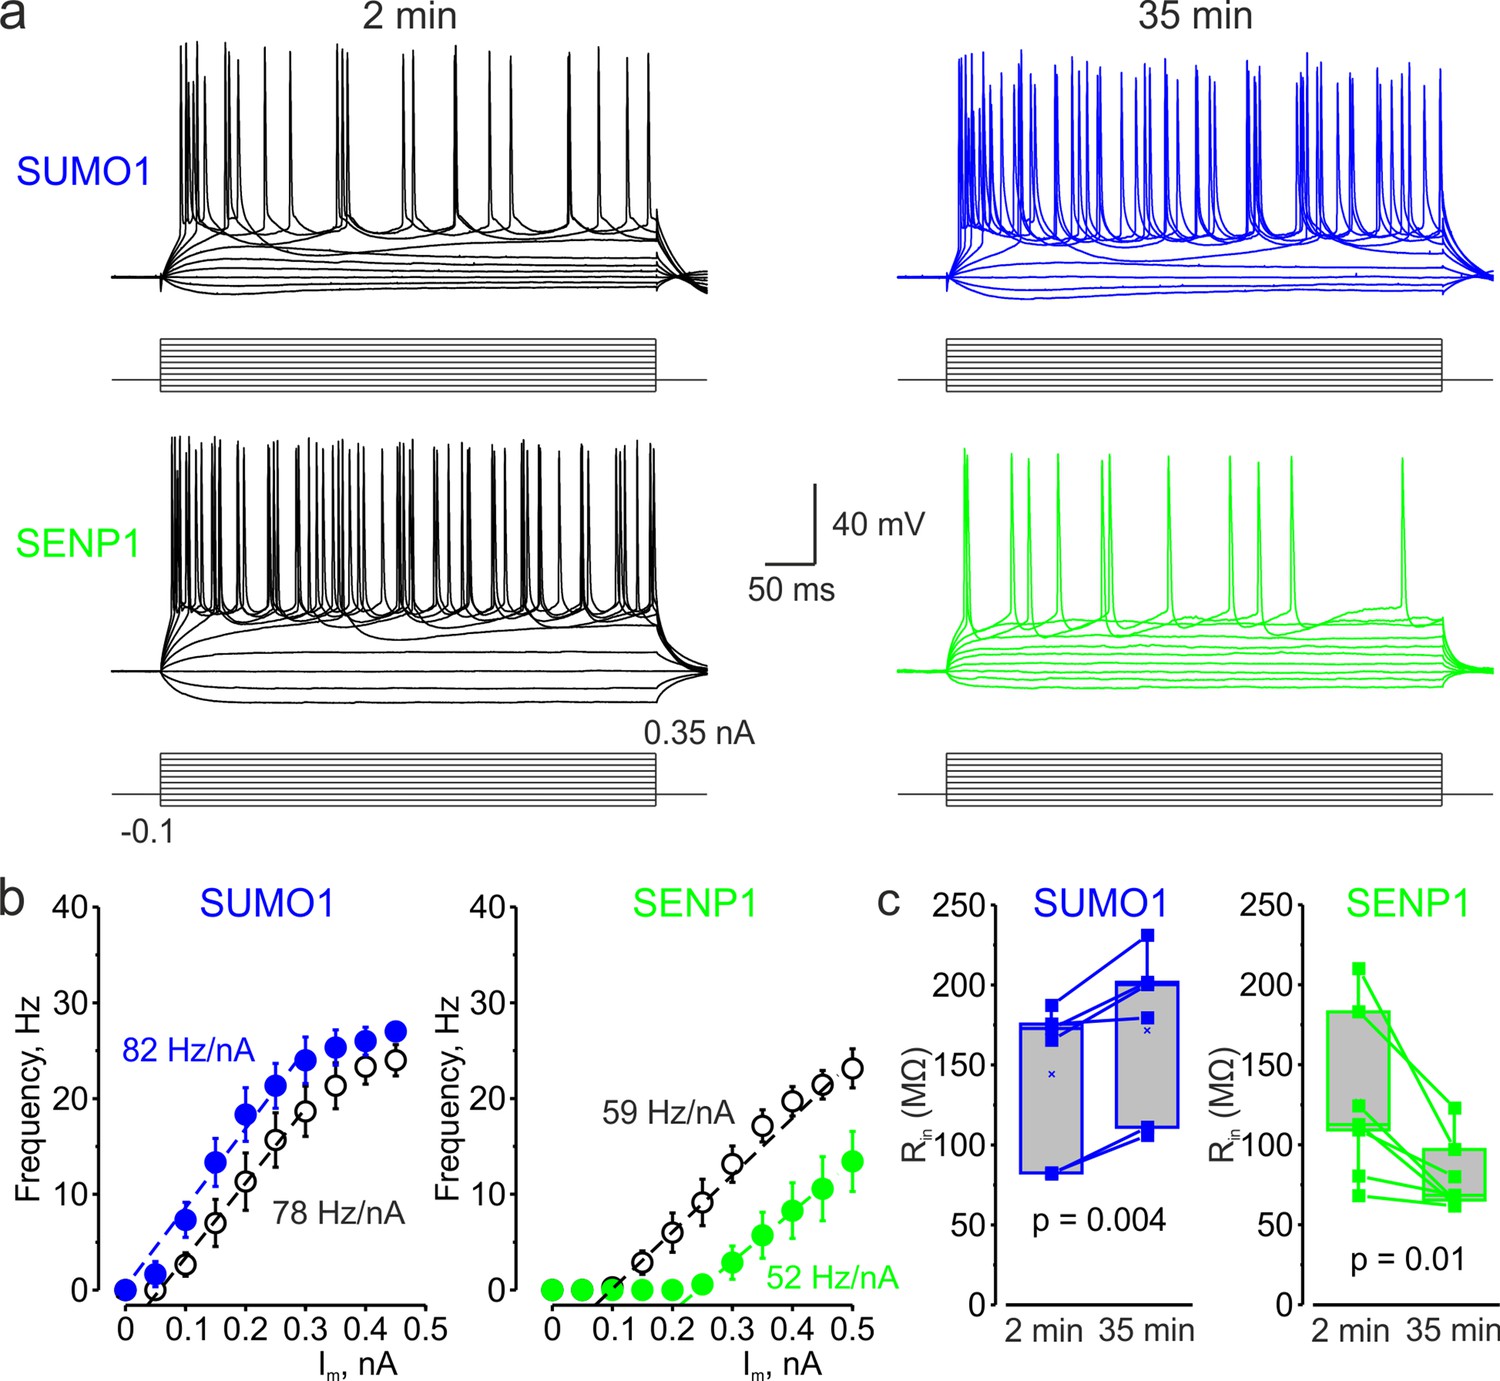
In L5 Nav1.2-Lys38Gln mutant neurons, SUMO1 and SENP1 do not affect the gain of the input–output curve.
(a) Current-clamp, whole-cell recordings from L5 Nav1.2-Lys38Gln mutant neurons immediately after the break-in (black) and following SUMO1 (blue) or SENP1 (green) dialysis. Voltage responses were elicited by injecting 400-ms-long current pulses, which started at –0.15 nA and incremented by 50 pA. (b) The F-I characteristic of Nav1.2-Lys38Gln mutant neurons obtained immediately after the break-in (black open circles) and following SUMO1 (n = 6, blue) or SENP1 (n = 7, green) dialysis via the whole-cell pipette. Notice the opposite effects of SUMO1 and SENP1 on the position of the F-I curve over the current axis. Both treatments had little to no effect on the slope of the F-I curve. (c) The Rin increased over time in SUMO1 dialyzed Nav1.2-Lys38Gln mutant neurons, whereas it decreased in SENP1 dialyzed cells. The lines connect the paired Rin values obtained from the same individual neuron at 2 min and 35 min of recording with SUMO1 (blue), SENP1 (green). (c) Apparent input resistance (Rin) increases in SUMO1 dialyzed neurons, whereas it decreases in SENP1 dialyzed cells. The lines connect the paired Rin values obtained from the same individual neuron at 2 min and 35 min of recording with SUMO1 (blue) and SENP1 (green) containing solution. Box plots represent the 25–75% interquartile range of values obtained from neurons dialyzed with SUMO1 (n = 6) and SENP1 (n = 7) solution; the whiskers expand to the 5–95% range. A horizontal line inside the box represents the median of the distribution, and the mean is represented by a cross symbol (X). p-Values were calculated using Student’s t-test for paired data.
Figure 3—figure supplement 1
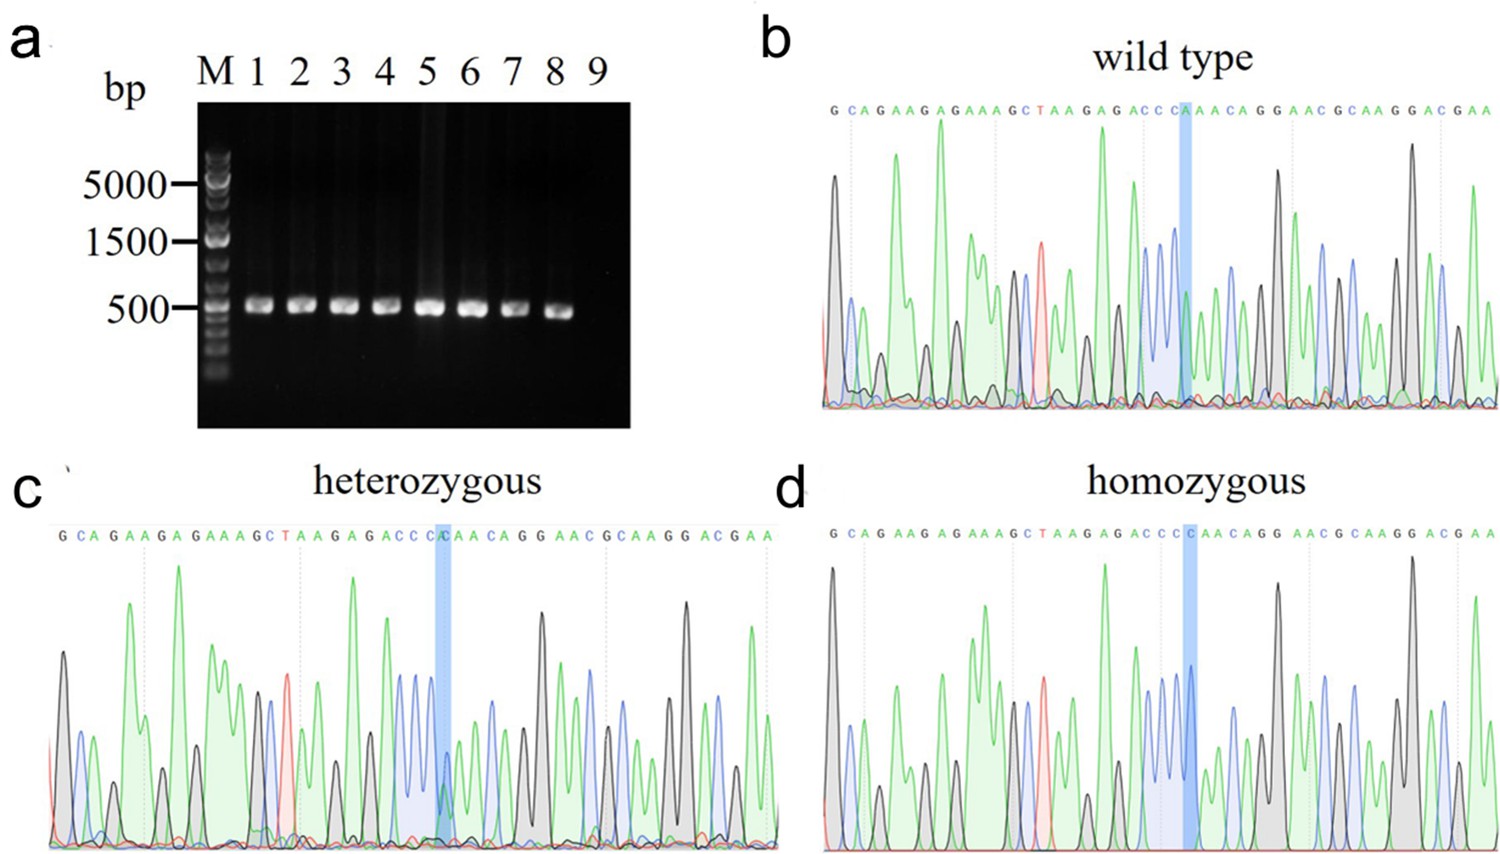
Genotyping of transgenic mice obtained through CRISPR-Cas9 targeting of the Scn2a gene.
(a) PCR screening. Results of eight pups are shown (lanes 1–8). The CRISP-targeted Scn2a locus was amplified from genomic DNA isolated from mouse tails using two gene-specific primers (Scn2a-F: 5’-CCGCCAGGACCTGACAGCTTC-3’;Scn2a-R: 5’-CATGCCCCCTTGCAGGATGCC-3’). The PCR products were separated by gel electrophoresis on a 2% agarose gel. The expected amplicon size is 457 bp for all wide type, heterozygous, and homozygous samples. No band was observed in the non-template control (lane 9). (b) Representative sequencing of PCR amplicon of the wide-type sample. Lys38, encoded by the AAA codon, was shown in the wild-type allele. (c) Representative sequencing of PCR amplicon of the heterozygous sample. Double peaks of A and C nucleotides evidenced the integration of the Lys38Gln mutation in the genome (codon AAA = lysine → CAA = glutamine). (d) Representative sequencing of PCR amplicon of the homozygous sample. Glutamine, encoded by the CAA codon, confirmed the replacement of Lys38 in the genome.
Figure 4 with 2 supplements
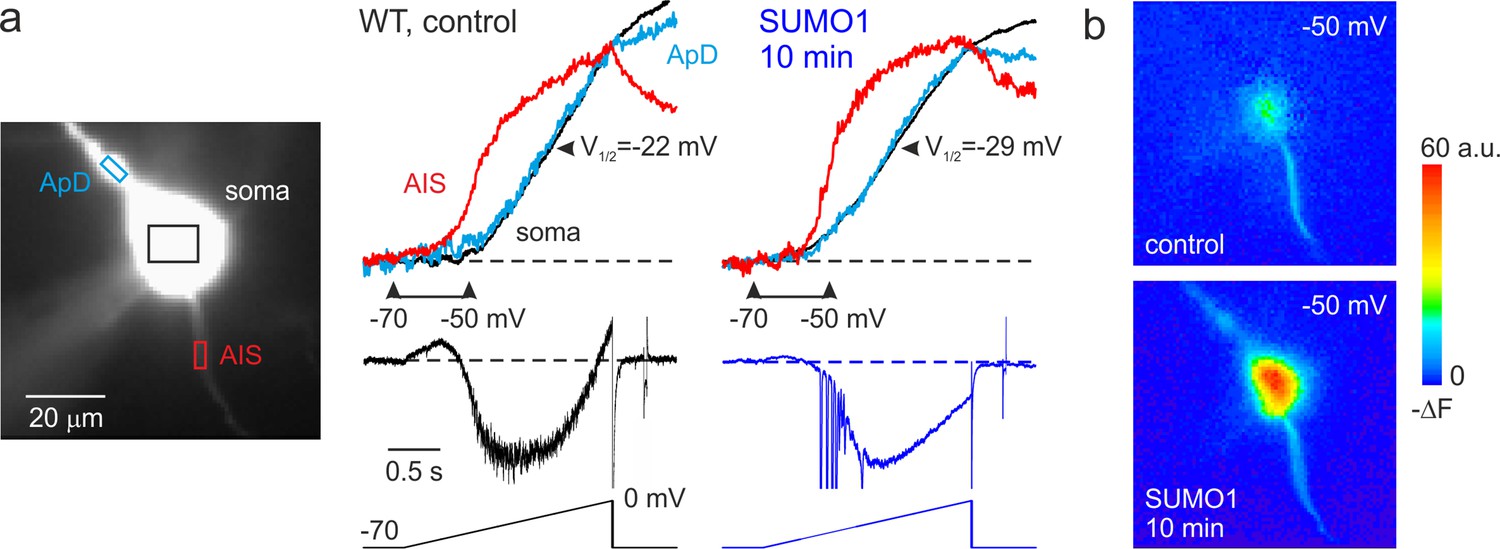
SUMO1 causes a leftward shift of INaP voltage dependence in pyramidal cells from wild-type but not from Nav1.2-Lys38Gln mutant mice.
(a) Left: WT L5 pyramidal neuron filled with SBFI-containing, Cs+-based solution via a somatic patch pipette, as seen during the fluorescence imaging experiment with a NeuroCCD-SMQ camera. Right: INaP and normalized somatic (black), axonal (red), and dendritic (cyan) ΔF transients elicited by 2-s-long voltage ramp from –70 mV to 0 mV immediately after the break-in and following 10 min of dialysis with SUMO1. Notice the leftward shift in voltage dependence of INaP activation in soma, dendrite, and to a lesser extent, in axon initial segments (AIS). Capacitive and leakage currents were not subtracted. (b) Pseudocolor maps of the ramp elicited ΔF changes between the times marked by the arrowheads in (a). Top: voltage ramp from −70 to −50 mV produced Na+ elevation mostly in the AIS. Bottom: following the SUMO1 dialysis, voltage ramp from −70 to –50 mV elicited large Na+ signals also in the soma and dendrites.
Figure 4—figure supplement 1
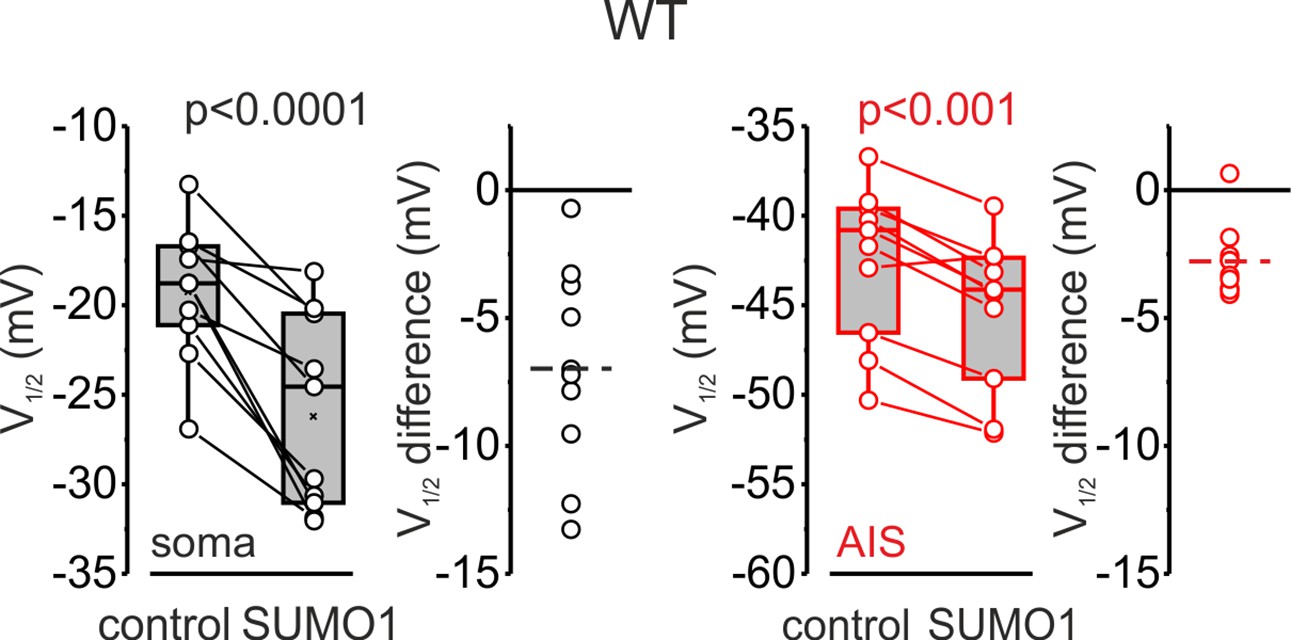
V1/2 of INaP activation in the soma (black) and axon initial segments (AIS) (red) of WT pyramidal neurons immediately after the break-in and following 10 min of dialysis with SUMO1.
Box plots represent the 25–75% interquartile range of INaP V1/2 activation values obtained in 10 cells; the whiskers expand to the 5–95% range. A horizontal line inside the box represents the median of the distribution, and the mean is represented by a cross symbol (X). p-Values were calculated using Student’s t-test for paired data. The lines connect the paired V1/2 values obtained from the same individual neuron after the break-in and following 10 min of dialysis with SUMO1. V1/2 difference plots show a change in INaP half-activation voltage elicited by SUMO1 in individual neurons (open circles); dashed lines show mean V1/2 values.
Figure 4—figure supplement 2
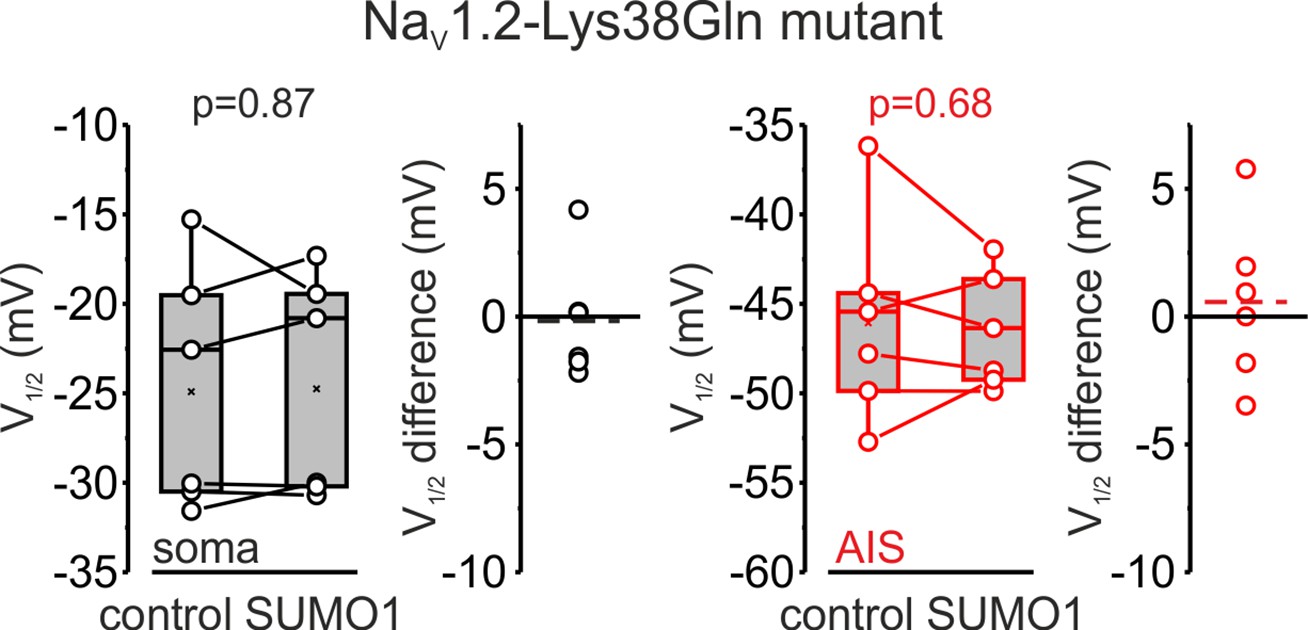
V1/2 of INaP activation in the soma (black) and axon initial segments (AIS) (red) of pyramidal neurons of animals carrying Nav1.2-Lys38Gln mutation, immediately after the break-in, and following 10 min of dialysis with SUMO1.
Box plots represent the 25–75% interquartile range of INaP V1/2 activation values obtained in six cells; the whiskers expand to the 5–95% range. A horizontal line inside the box represents the median of the distribution, and the mean is represented by a cross symbol (X). p-Values were calculated using Student’s t-test for paired data. The lines connect the paired V1/2 values obtained from the same individual neuron after the break-in and following 10 min of dialysis with SUMO1. V1/2 difference plots show a change in INaP half-activation voltage elicited by SUMO1 in individual neurons (open circles); dashed lines show mean V1/2 values.
Figure 5
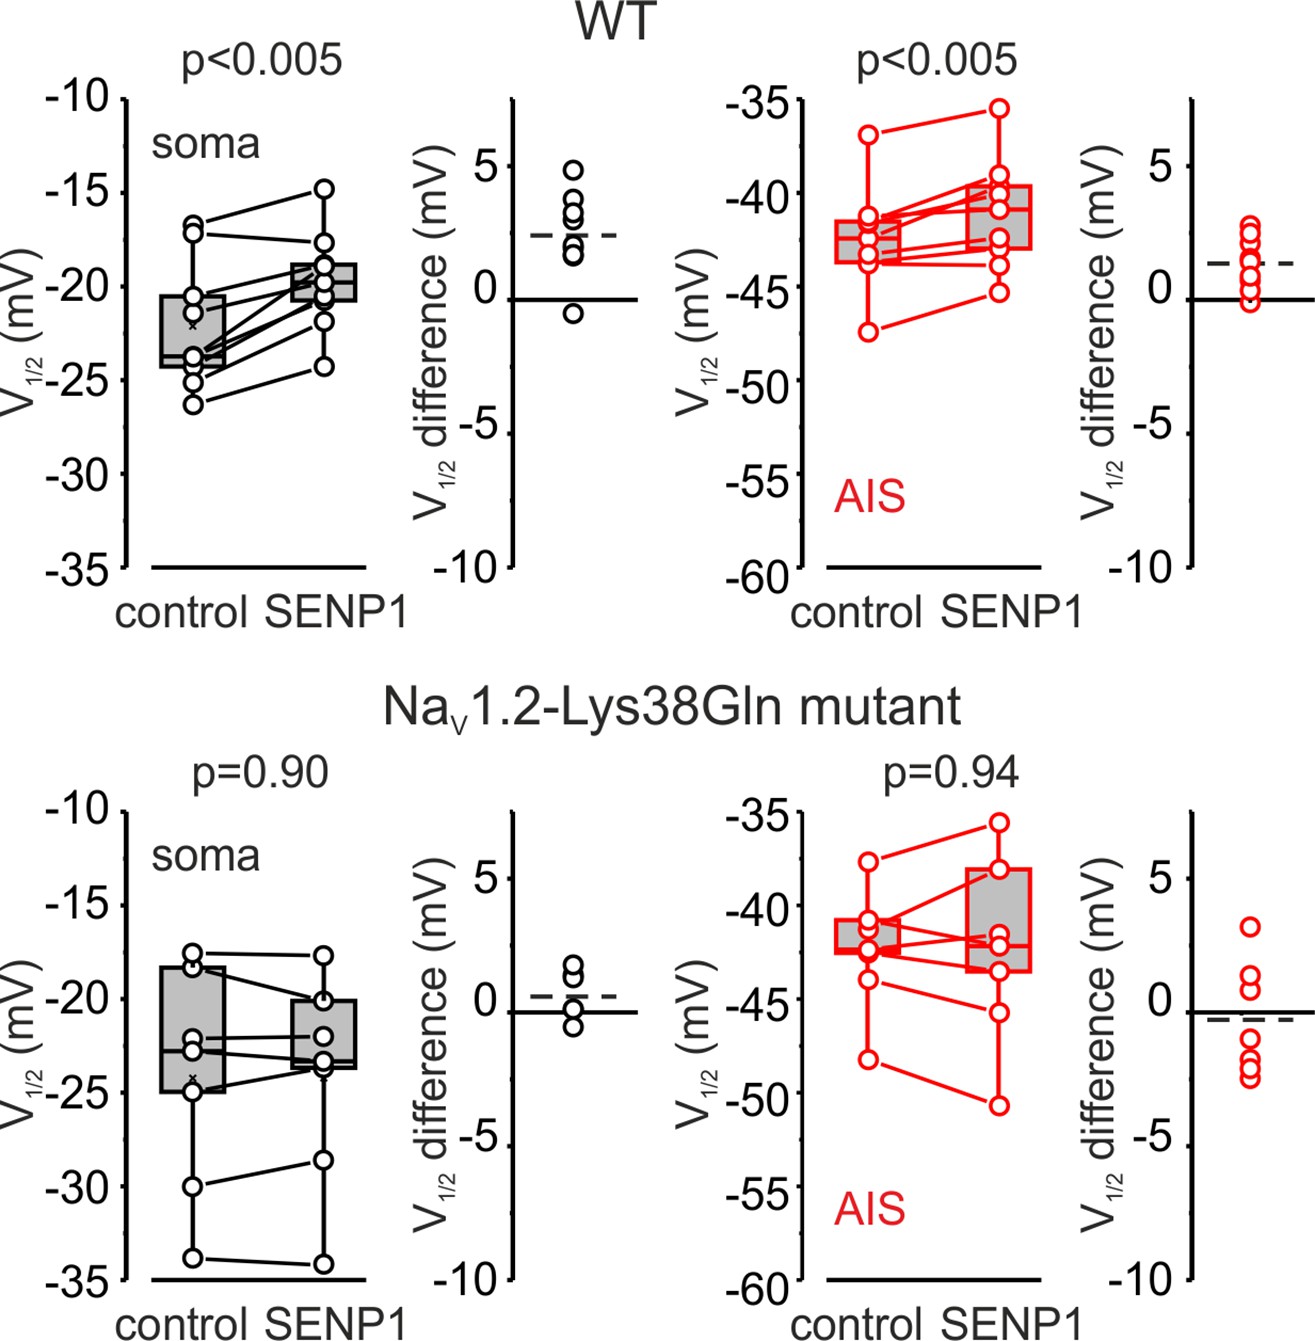
SENP1 causes a rightward shift of activation kinetics of INaP in pyramidal cells from wild-type but not from Nav1.2-Lys38Gln mutant mice.
Box plots represent the 25–75% interquartile range of INaP V1/2 activation values in the soma (black), and axon initial segments (AIS) (red) of WT (top, n = 9) and Nav1.2-Lys38Gln mutant (bottom, n = 7) pyramidal neurons immediately after the break-in and following 10 min of dialysis with SENP1; the whiskers expand to the 5–95% range. A horizontal line inside the box represents the median of the distribution, and the mean is represented by a cross symbol (X). p-Values were calculated using Student’s t-test for paired data. The lines connect the paired V1/2 values obtained from the same individual neuron after the break-in and following 10 min of dialysis with SENP1. V1/2 difference plots show a change in INaP half-activation voltage elicited by SENP1 in individual neurons (open circles); dashed lines show mean V1/2 values in WT (n = 9) and Nav1.2-Lys38Gln mutant (n = 7) cells.
Figure 6

Effect of SUMO1 on voltage-dependent amplification of EPSPs in pyramidal neurons from wild-type and Nav1.2-Lys38Gln mutant mice.
(a) Comparison of small and large EPSPs evoked in WT and Nav1.2-Lys38Gln mutant pyramidal neurons immediately after the break-in (black) and following the SUMO1 dialysis (blue). Notice the slower decay time constant of larger EPSP following SUMO1 dialysis in WT neuron. (b) The mean EPSP integral as a function of peak EPSP amplitude after the brake-in (black) and following the SUMO1 dialysis (blue) of the WT (n = 6) and Nav1.2-Lys38Gln mutant (n = 6) pyramidal neurons. Notice the amplification of larger EPSPs in SUMO1 dialyzed WT cells.
Figure 7 with 1 supplement
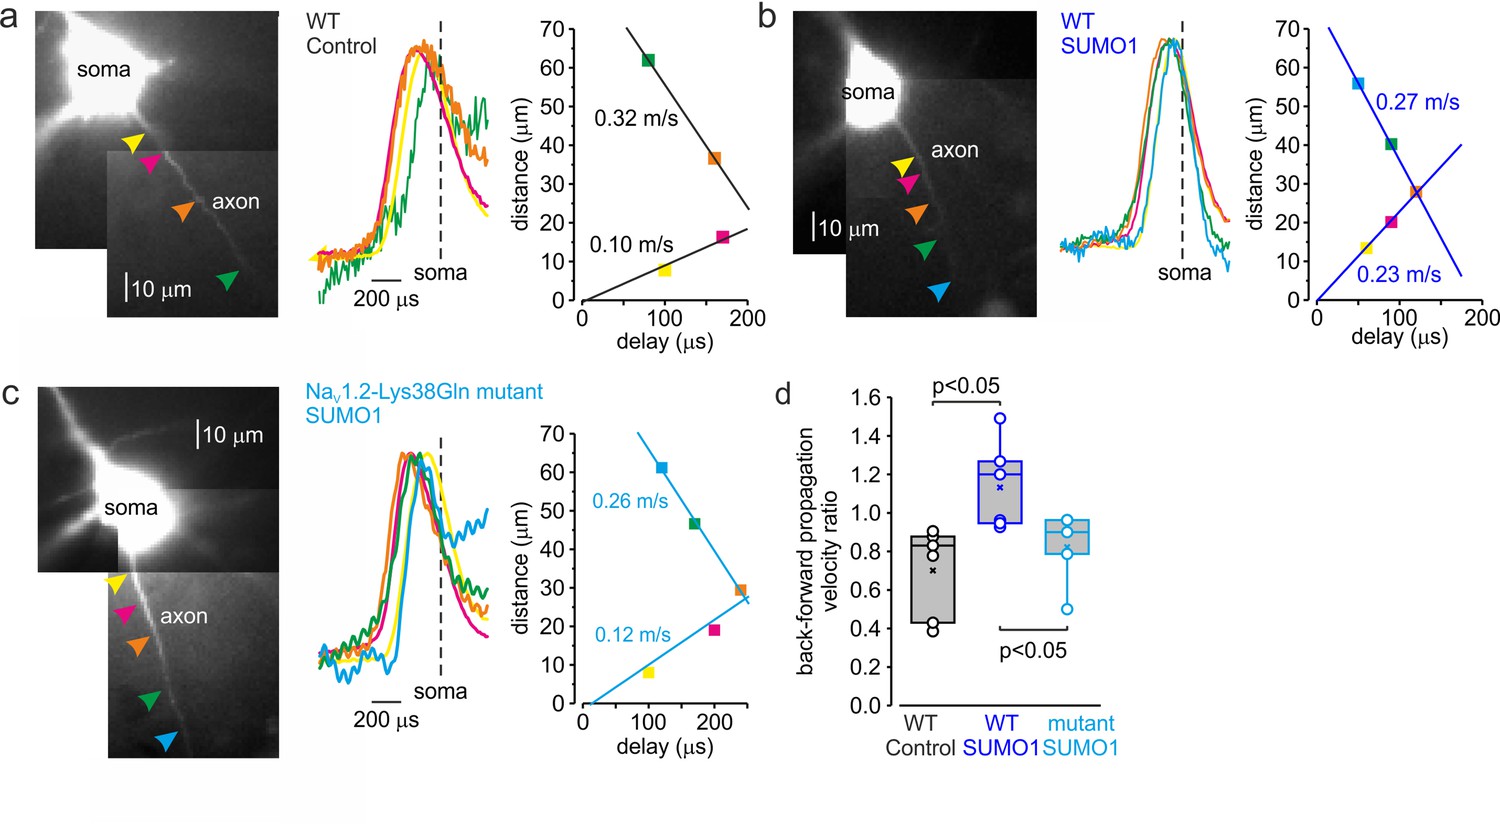
SUMOylation differentially affects the velocity of forward- and back-propagating action potentials (APs).
(a) Left: normalized averaged action currents (n = 500) elicited by a single AP at the axonal regions indicated by arrows to demonstrate the difference in the delay of their onset. The dashed vertical line corresponds to the time of dV/dtmax of the somatic action potential. Right: distance from the edge of the soma as a function of delay of spike initiation plotted. Note that AP initiates in a region between the pink and brown arrows and propagates with an apparent conduction velocity of ∼0.32 and ~0.10 m/s forward and backward, respectively. (b) In SUMO1 dialyzed neurons, there was little difference in apparent conduction velocity of forward- and back-propagating action potential (~0.27 vs. 0.23 m/s, respectively). (c) In a representative neuron from Nav1.2-Lys38Gln mutant animal, the velocity of backpropagation was not affected by SUMO1 dialysis (~0.26 vs. 0.12 m/s for forward and backpropagation, respectively). (d) SUMOylation causes a significant increase in the back/forward propagation velocity ratio. Each dot represents the velocity ratio obtained by measurements in individual control WT (n = 6, black), SUMO1 dialyzed WT (n = 6, blue), and SUMO1 dialyzed Nav1.2-Lys38Gln mutant (n = 5, blue) axon. Box plots represent the 25–75% interquartile range of velocity ratios, and the whiskers expand to the 5–95% range. A horizontal line inside the box represents the median of the distribution, and the mean is represented by a cross symbol (X). p-Values were calculated using Student’s t-test for unpaired data.
Figure 7—figure supplement 1
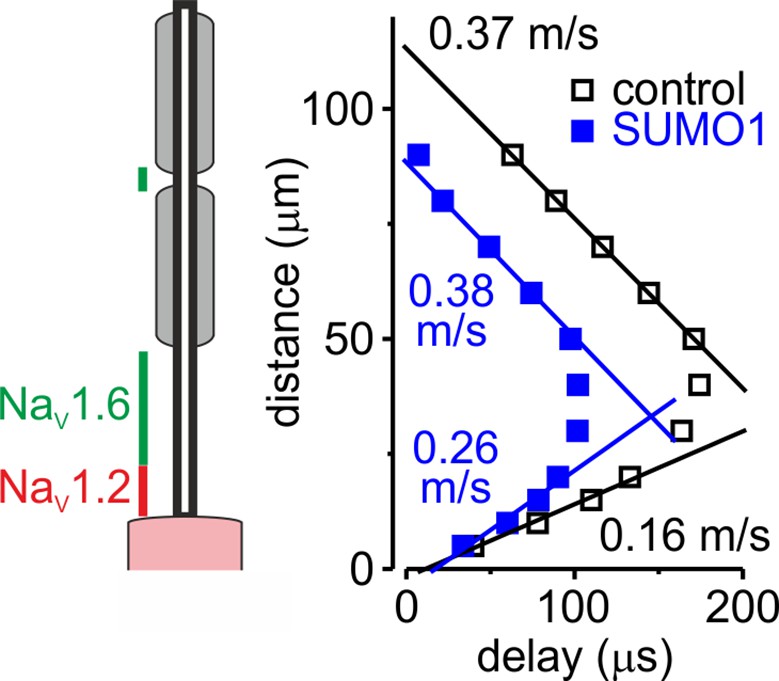
In computational models, SUMOylation of Nav1.2 channels selectively accelerates spike backpropagation.
Left: schematic drawing of L5 pyramidal neuron with Nav1.2 (red) present in the soma and proximal axon initial segments (AIS) and Nav1.6 (green) localized in the distal AIS and nodes of Ranvier. Right: the delays of action potential (AP) initiation plotted against distance from the edge of the soma in the model of a neuron under control conditions (black) and following the SUMO1 dialysis. Straight lines are linear fits of the linear portions of the delay–distance relationship with their slopes representing the velocities of back- and forward- propagation velocities. Note that SUMOylation of Nav1.2 channels selectively enhances the velocity of backpropagating AP.
Tables
Table 1
Comparison of electrophysiological characteristics of WT and NaV1.2-Lys38Gln mutant layer 5 pyramidal neurons.
| Parameter | Wild type | NaV1.2-Lys38Gln mutant | Difference |
|---|---|---|---|
| Input resistance (MΩ) | 127.4 ± 11.5 (n = 28) | 134.9 ± 13.6 (n = 13) | NS, p=0.701 |
| Membrane time constant, τm (ms) | 20.4 ± 1.3 (n = 30) | 24.0 ± 2.3 (n = 13) | NS, p=0.149 |
| Voltage threshold (mV)* | –57.4 ± 1.4 (n = 17) | –57.5 ± 0.6 (n = 13) | NS, p=0.956 |
| Current threshold (pA)† | 448 ± 30 (n = 18) | 514 ± 32 (n = 12) | NS, p=0.151 |
| AP peak (mV) | +36.5 ± 1.4 (n = 17) | +37.1 ± 1.3 (n = 13) | NS, p=0.729 |
| AP dV/dtmax (V/s) | 268 ± 25 (n = 17) | 271 ± 20 (n = 13) | NS, p=0.937 |
| AP half-width (ms) | 1.19 ± 0.13 (n = 17) | 1.06 ± 0.10 (n = 12) | NS, p=0.486 |
| F-I characteristics slope (Hz/nA) | 91.0 ± 4.0 (n = 30) | 94.5 ± 7.0 (n = 13) | NS, p=0.653 |
-
Data are presented as mean ± SE; WT and mutant neurons are compared using the Student’s t-test for unpaired data.
-
*
Voltages were corrected for liquid junction potential of –13 mV (recording temperature of 32°C). Data were collected within 2 min after breaking into the whole-cell configuration.
-
†
The current threshold was defined as the minimum amplitude of a 10-ms-long current step that elicited an AP.
Key resources table
| Reagent type (species) or resource | Designation | Source or reference | Identifiers | Additional information |
|---|---|---|---|---|
| Peptide, recombinant protein | Human SUMO1 | R&D Systems | UL-740 | |
| Peptide, recombinant protein | Human SENP1 | R&D Systems | E-700 | |
| Strain, strain background (Mus musculus) | Mouse: C57BL/6N-Scn2aK38QMut/+ | Biocytogen | EGE-ZY-016 | |
| Software, algorithm | NEURON 8.1 | Yale University | SCR_005393 |
Additional files
Download links
A two-part list of links to download the article, or parts of the article, in various formats.
Downloads (link to download the article as PDF)
Open citations (links to open the citations from this article in various online reference manager services)
Cite this article (links to download the citations from this article in formats compatible with various reference manager tools)
SUMOylation of NaV1.2 channels regulates the velocity of backpropagating action potentials in cortical pyramidal neurons
eLife 12:e81463.
https://doi.org/10.7554/eLife.81463


