Mammalian forelimb evolution is driven by uneven proximal-to-distal morphological diversity
- Département Adaptations du Vivant, Muséum National d'Histoire Naturelle, France
- Naturhistorisches Museum Bern, Switzerland
- Institute of Ecology and Evolution, University of Bern, Switzerland
- Life Sciences Department, Vertebrates Division, Natural History Museum, United Kingdom
- Université Claude Bernard Lyon 1, CNRS, ENTPE, UMR 5023, France
- Department of Earth Sciences, University of Oxford, United Kingdom
Figures
Figure 1

Forelimb diversity of mammals.
The topology includes all genera examined in this work, representing the exceptional forelimb morphological variation for some of the species analysed. The topology was estimated using maximum clade credibility from a posterior sample of 10,000 trees published by Upham et al., 2019.
Figure 2
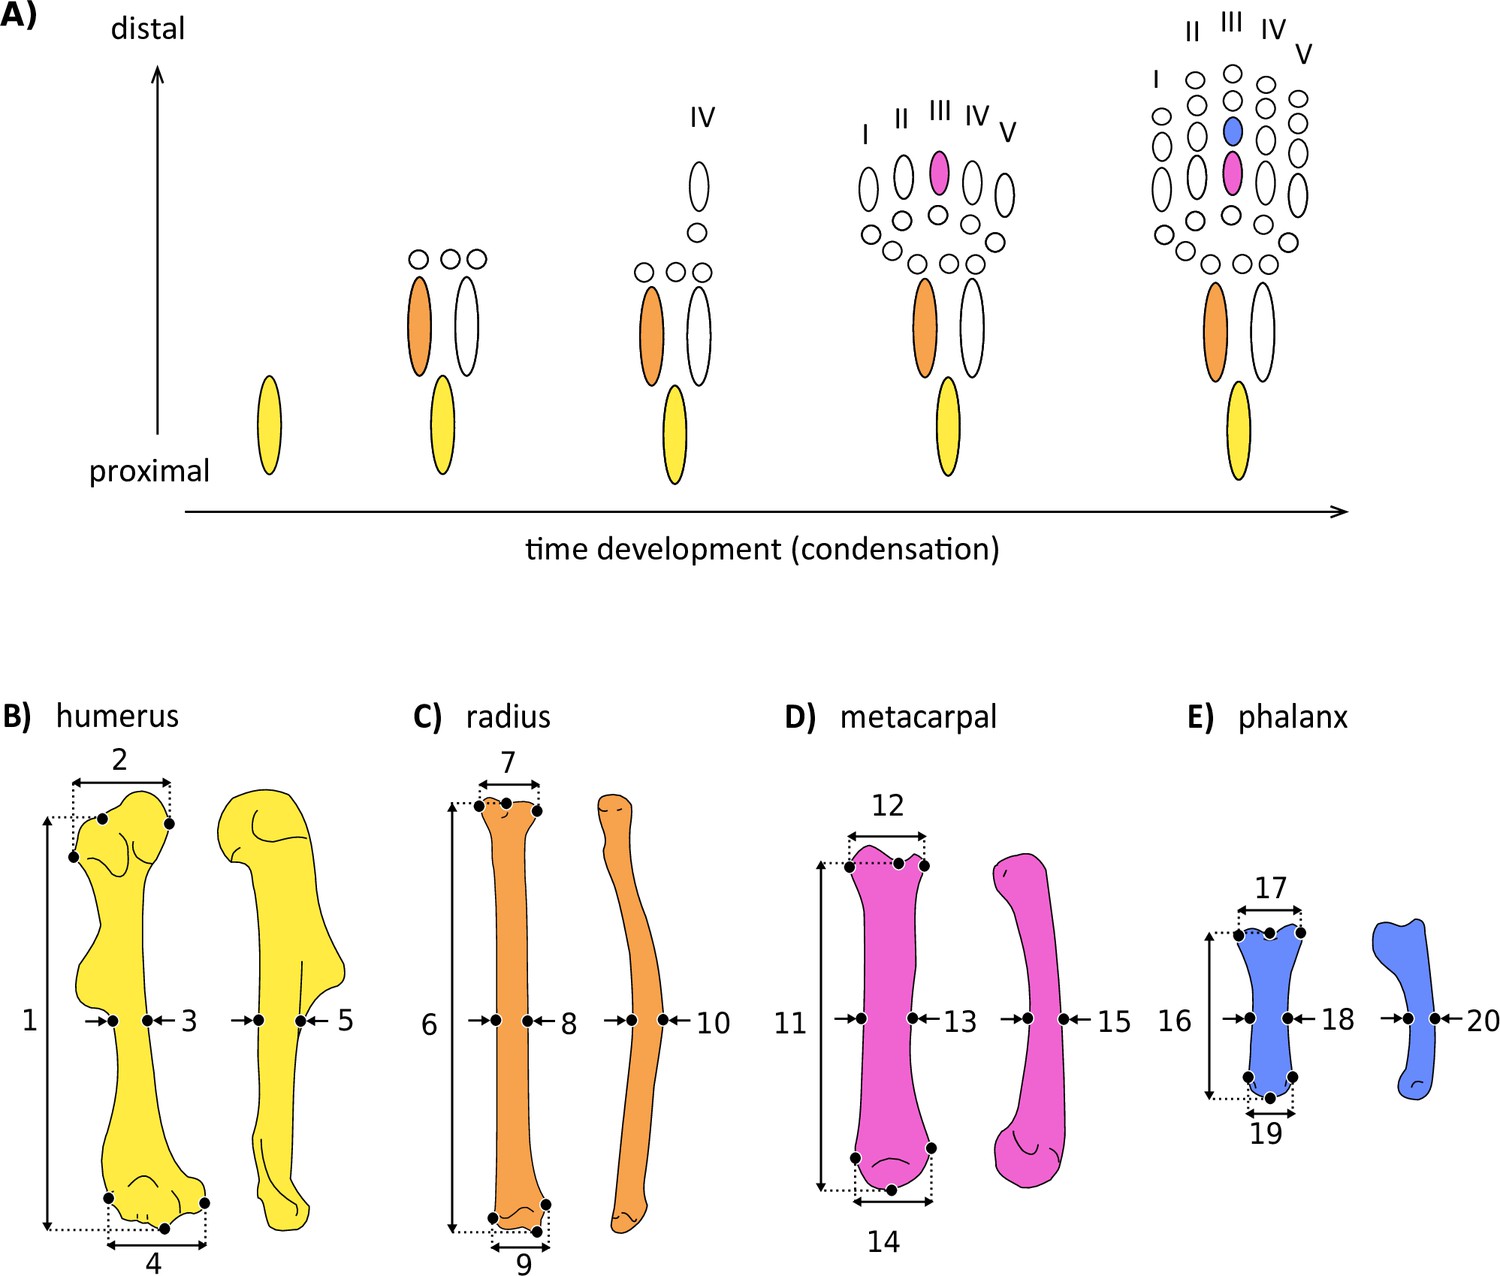
Simplified scheme of the developmental sequence of limb condensation (A), indicating the bones analysed and the linear measurements obtained.
(B) Humerus in anterior (right) and lateral (left) view: (1) length, (2) proximal width, (3) mid-shaft width, (4) distal width, and (5) height. (C) Radius in anterior (right) and lateral (left) view: (6) length, (7) proximal width, (8) mid-shaft width, (9) distal width, and (10) height. (D) Third metacarpal in dorsal (right) and lateral (left) view: (11) length, (12) proximal width, (13) mid-shaft width, (14) distal width, and (15) height. (E) First phalanx of the digit III in dorsal (right) and lateral (left) view: (16) length, (17) proximal width, (18) mid-shaft width, (19) distal width, and (20) height. Detailed description of each measurement can be found in Supplementary file 2a.
Figure 3
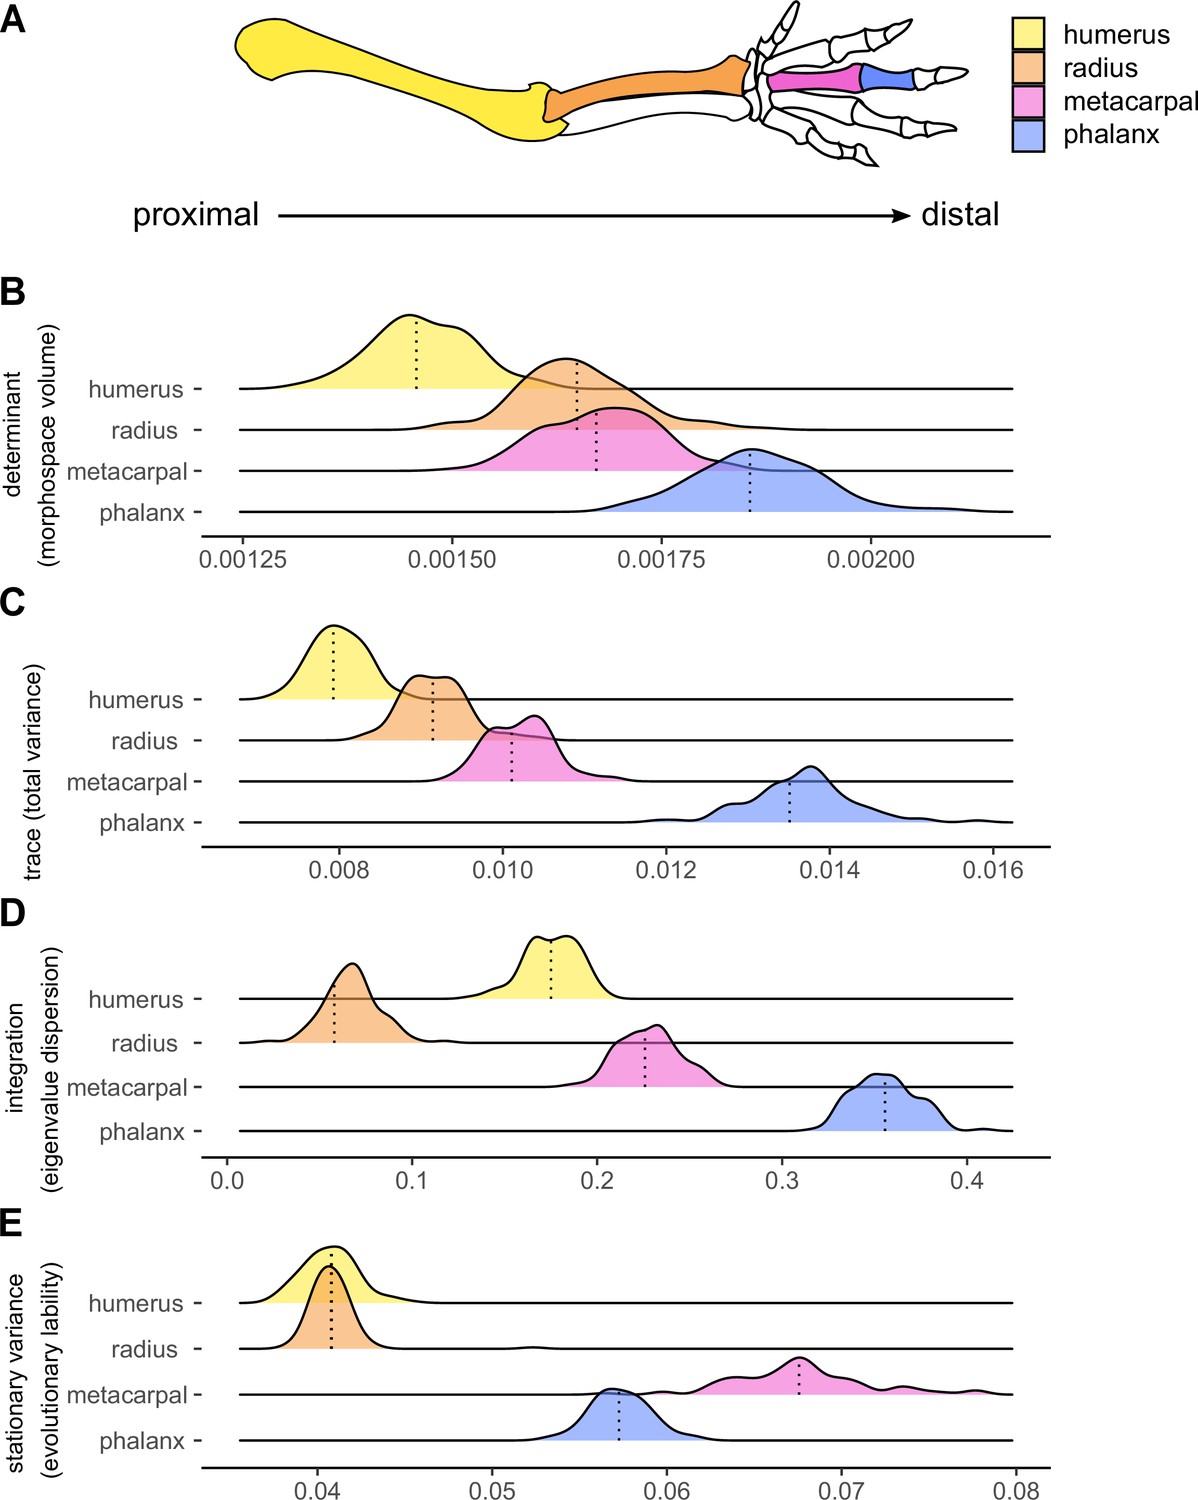
Components of the morphological evolution of forelimb skeletal elements.
(A) Forelimb schematic, with colours indicating bones along the proximo-distal axis: the humerus (yellow), radius (orange), third metacarpal (pink), and the first phalanx of digit III (blue). Reference lines indicate empirical values (B, C and D) or the median values (E) from 100 different topologies. replicated (B) Morphological diversity of limb bones inferred by matrix determinant. (C) Morphological diversity of limb bones, inferred by matrix trace. (D) Trait integration. (E) Stationary variance.
Author response image 1
Tables
Table 1
Limb bone pairwise comparison of integration, determinant, trace, and stationary variance computed by a Tukey Test following an ANOVA.
Pairwise differences (Diff) of each metric are indicated with the lower (Lwr) and upper (Upr) 95% CI, as well as the adjusted P-values. Hum = Humerus, Rad = Radius, Met = Metacarpus and Phal = Phalanx.
| Rad-Hum | Met-Hum | Phal-Hum | Met-Rad | Phal-Rad | Phal-Met | ||
|---|---|---|---|---|---|---|---|
| Determinant | Diff | 1.8E-04 | 2.1E-04 | 4.0E-04 | 2.9E-05 | 2.2E-04 | 1.9E-04 |
| Lwr | 1.6E-04 | 1.9E-04 | 3.8E-04 | 3.8E-06 | 1.9E-04 | 1.6E-04 | |
| Upr | 2.1E-04 | 2.4E-04 | 4.3E-04 | 5.3E-05 | 2.4E-04 | 2.1E-04 | |
| P-value | <0.001 | <0.001 | <0.001 | 0.017 | <0.001 | <0.001 | |
| Trace | Diff | 1.2E-03 | 2.2E-03 | 5.7E-03 | 1.0E-03 | 4.5E-03 | 3.4E-03 |
| Lwr | 1.0E-03 | 2.1E-03 | 5.5E-03 | 8.8E-04 | 4.3E-03 | 3.3E-03 | |
| Upr | 1.4E-03 | 2.4E-03 | 5.8E-03 | 1.2E-03 | 4.6E-03 | 3.6E-03 | |
| P-value | <0.001 | <0.001 | <0.001 | <0.001 | <0.001 | <0.001 | |
| Integration | Diff | –0.108 | 0.052 | 0.180 | 0.160 | 0.288 | 0.128 |
| Lwr | –0.114 | 0.047 | 0.175 | 0.155 | 0.283 | 0.122 | |
| Upr | –0.102 | 0.058 | 0.186 | 0.166 | 0.294 | 0.133 | |
| P-value | <0.001 | <0.001 | <0.001 | <0.001 | <0.001 | <0.001 | |
| Stationary variance | Diff | 0.000 | 0.027 | 0.017 | 0.027 | 0.017 | –0.010 |
| Lwr | –0.001 | 0.026 | 0.016 | 0.026 | 0.016 | –0.011 | |
| Upr | 0.001 | 0.028 | 0.017 | 0.028 | 0.017 | –0.009 | |
| P-value | 0.989 | <0.001 | <0.001 | <0.001 | <0.001 | <0.001 |
Additional files
-
Supplementary file 1
Analyzed specimens, indicating taxonomy, institutional identification, method of morphometric acquisition, MorphoSource ID and associated projects (when applicable) and body mass (grams, from PanTHERIA or indicated literature).
- https://cdn.elifesciences.org/articles/81492/elife-81492-supp1-v2.xlsx
-
Supplementary file 2
Trait description and model fit.
(a) Linear measurements obtained for each specimen extracted either by landmark positioning in 3D digital models or by direct caliper measurements (illustrated in Figure 2). (b) Fits of linear models of evolution for each bone, highlighting in bold the best model fitted according to generalized information criterion (GIC) and loglikelihood (logLik). σ²=mean evolutionary rate, α=attraction toward optimum, stat.var.=mean stationary variance. (c) Empirical values from PGLS regression computing for body mass in the geometric means. (d) Empirical values from PGLS regression without body mass in the geometric means.
- https://cdn.elifesciences.org/articles/81492/elife-81492-supp2-v2.docx
-
MDAR checklist
- https://cdn.elifesciences.org/articles/81492/elife-81492-mdarchecklist1-v2.pdf
Download links
A two-part list of links to download the article, or parts of the article, in various formats.
Downloads (link to download the article as PDF)
Open citations (links to open the citations from this article in various online reference manager services)
Cite this article (links to download the citations from this article in formats compatible with various reference manager tools)
Mammalian forelimb evolution is driven by uneven proximal-to-distal morphological diversity
eLife 12:e81492.
https://doi.org/10.7554/eLife.81492


