Spatially resolved transcriptomics reveals pro-inflammatory fibroblast involved in lymphocyte recruitment through CXCL8 and CXCL10
- Centre for Craniofacial and Regenerative Biology, Faculty of Dentistry, Oral & Craniofacial Sciences, King’s College London, United Kingdom
- Department of Endodontics, Faculty of Dentistry, Oral & Craniofacial Sciences, King’s College London, United Kingdom
- NIHR BRC Genomics Research Platform, Guy’s and St Thomas’ NHS Foundation Trust, King’s College London School of Medicine, Guy’s Hospital, United Kingdom
- Department of Periodontology, Faculty of Dentistry, Oral & Craniofacial Sciences, King’s College London, United Kingdom
- Unilever R&D, Colworth Science Park, United Kingdom
- Laboratory of Odontogenesis and Osteogenesis, Institute of Animal Physiology and Genetics, Czech Republic
Figures
Figure 1 with 2 supplements
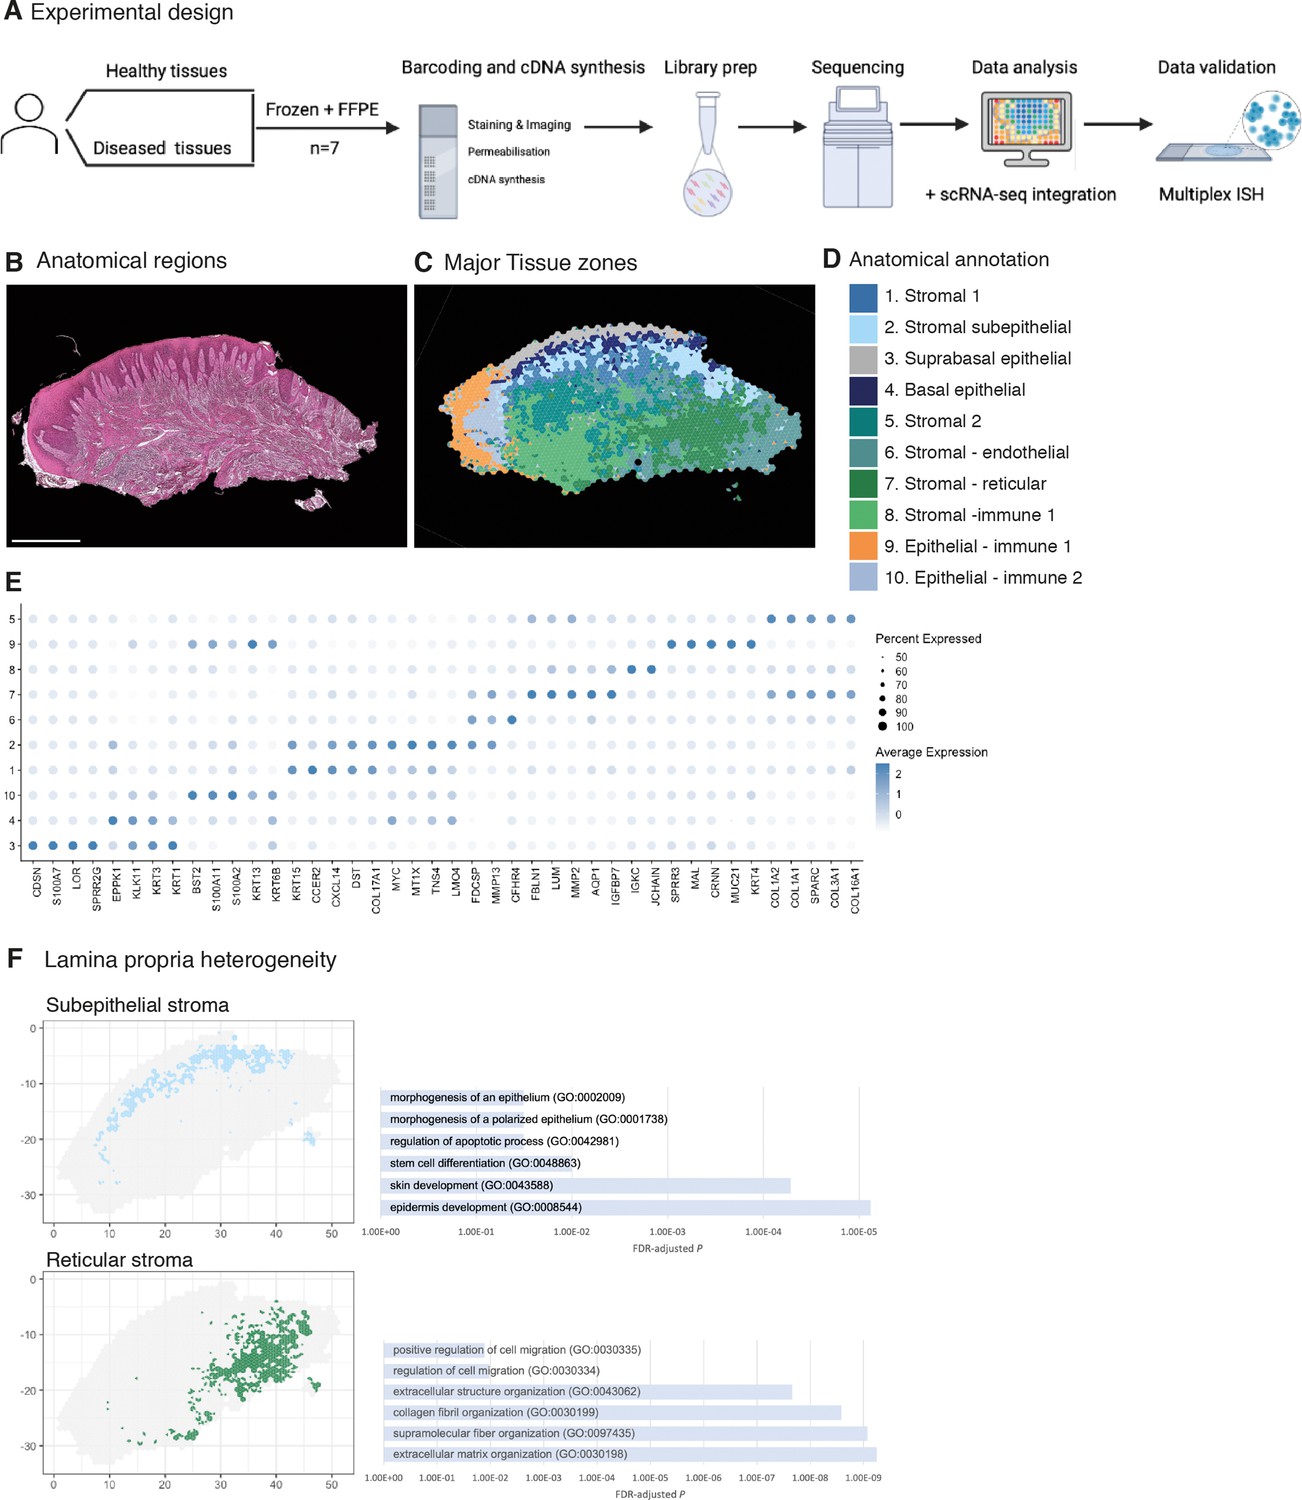
Spatial map of the human oral mucosa.
(A) Overview of study design for human oral mucosa. A total of nine tissue sections from seven distinct patients were sequenced and analysed. (B) Haematoxylin and eosin (H&E) image of a representative healthy oral mucosa section demonstrating general tissue morphology and demarcation between the two major tissue compartments, epithelium and connective tissue. Scale bar: 1 mm. (C) Human oral mucosa regions present in the assayed section. (D) Anatomical annotation of unbiased transcriptional tissue regions. (E) Markers of tissue compartment-specific genes used for tissue annotation showing percent of expressing cells (circle size) and average expression (colour) of gene markers (rows) across compartments (columns). (F) Connective tissue (lamina propria) heterogeneity Gene Ontology (GO) analyses showing subepithelial region enrichment for epithelium development and deep reticular region enriched for extracellular matrix (ECM) terms.
-
Figure 1—source data 1
Top spatially variable features in health (referent to Figure 1).
- https://cdn.elifesciences.org/articles/81525/elife-81525-fig1-data1-v2.xls
Figure 1—figure supplement 1
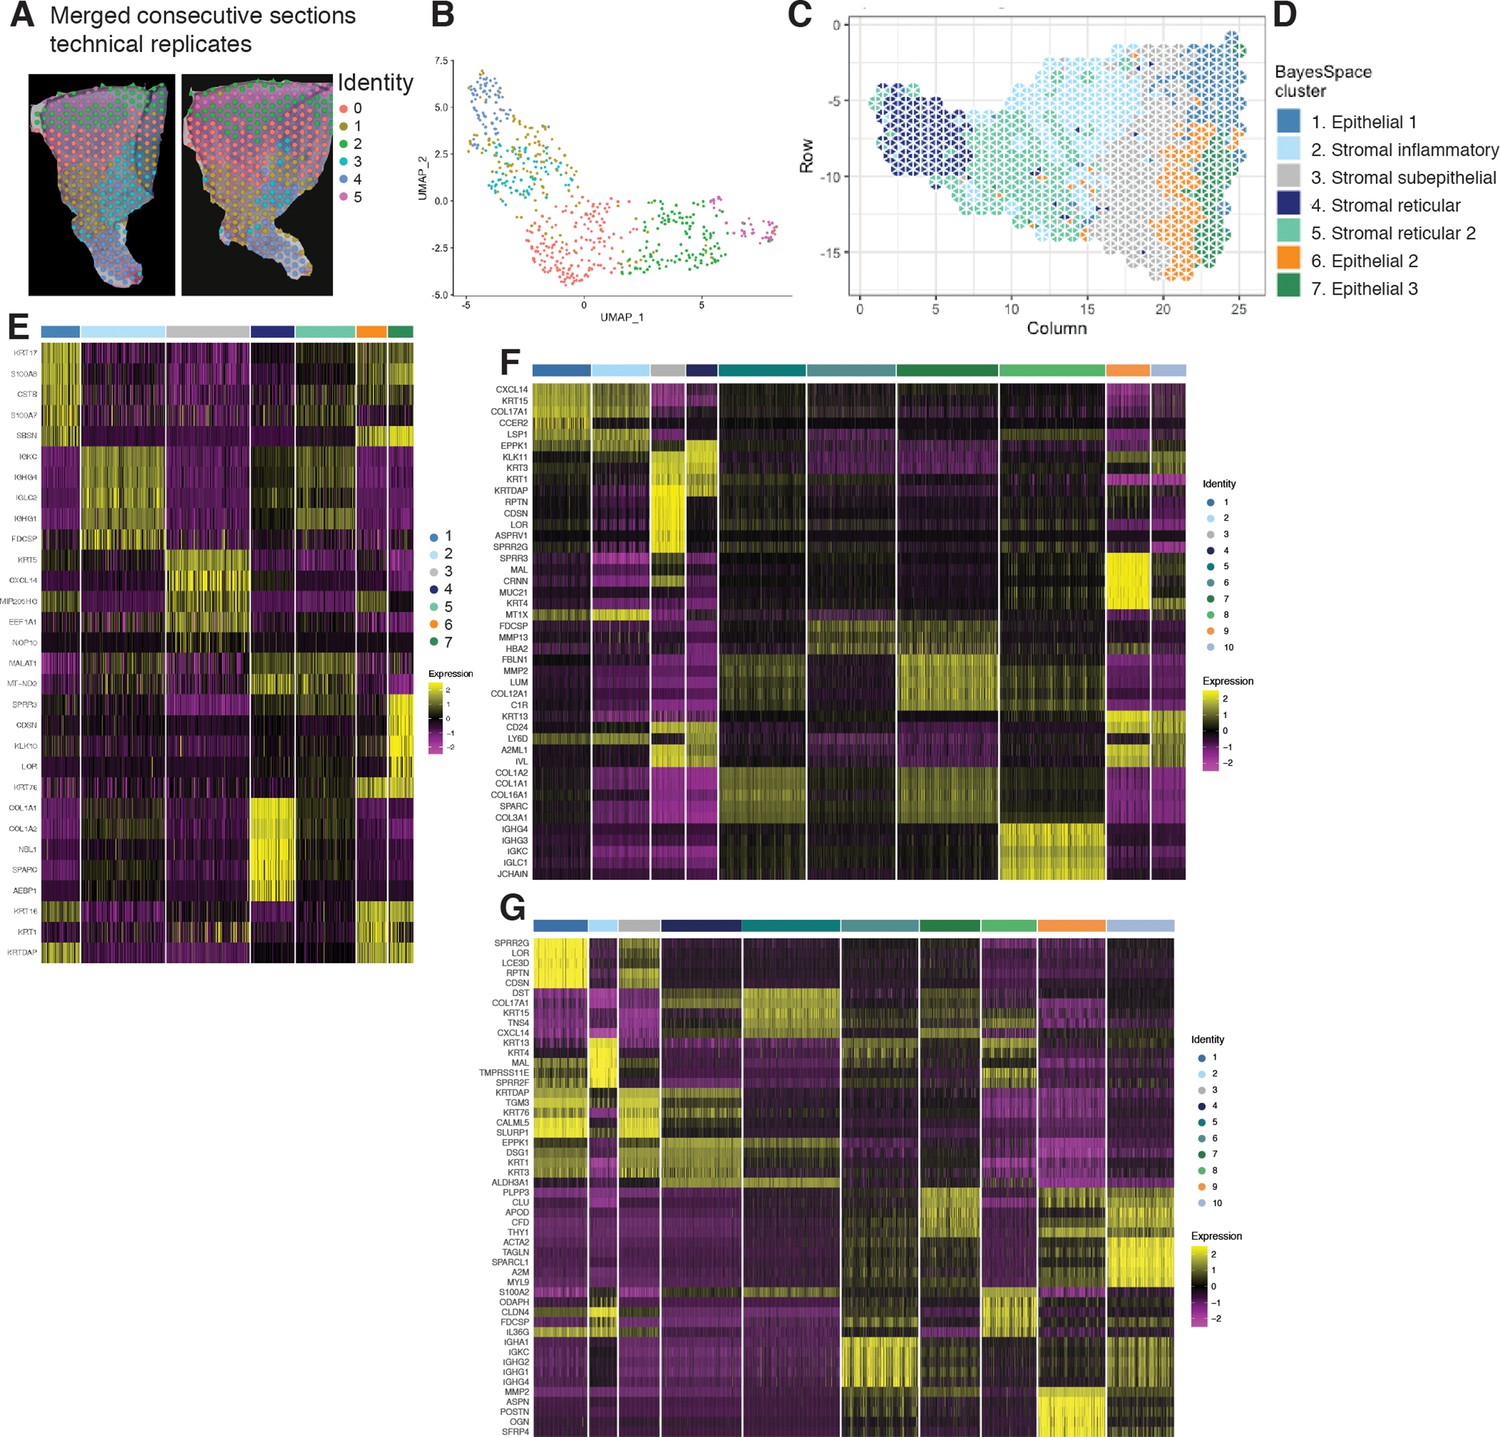
Mapping of palatal human oral mucosa and top differentially expressed genes.
(A) Consecutive sections used as technical replicates for ST analyses. (B) UMAP plot of spot transcriptome clusters from the two merged sections. (C) High-resolution clustering of the same assayed patient sample (palatal). (D) Anatomical annotation. (E) Heatmap of the mean expression of the most differentially expressed marker genes for each cluster identified in (A). (F) Heatmap of the mean expression of the most differentially expressed marker genes for each cluster identified related to Figure 1B–E. (G) Heatmap of the mean expression of the most differentially expressed marker genes for each cluster identified related to Figure 2B–E.
Figure 1—figure supplement 2
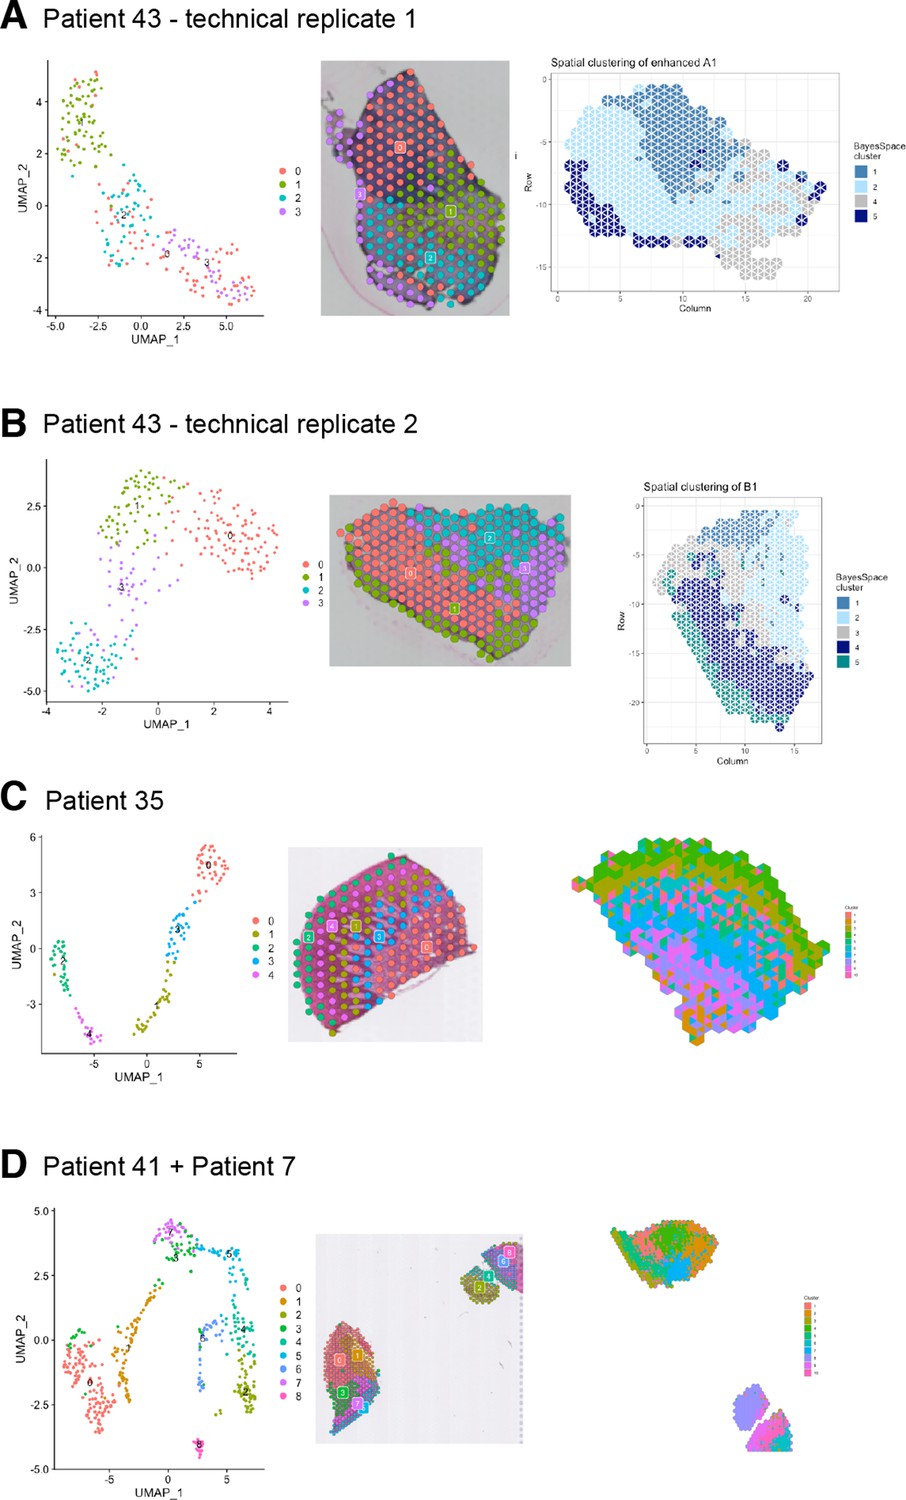
Biological and technical replicates used for ST analyses.
(A) UMAP plot of spot transcriptome clusters from patient 43 (health) on the left; clusters are visualised on tissue covered slide areas (centre). High-resolution clustering at subspot level on the right. (B) UMAP plot of spot transcriptome clusters from patient 43 technical replicate (health) on the left; clusters are visualised on tissue covered slide areas (centre). High-resolution clustering at subspot level on the right. (C) UMAP plot of spot transcriptome clusters from patient 35 (disease) on the left; clusters are visualised on tissue-covered slide areas (centre). High-resolution clustering at subspot level on the right. (D) UMAP plot of spot transcriptome clusters from patients 41 and 7 (disease) on the left; clusters are visualised on tissue-covered slide areas (centre). High-resolution clustering at subspot level on the right.
Figure 2
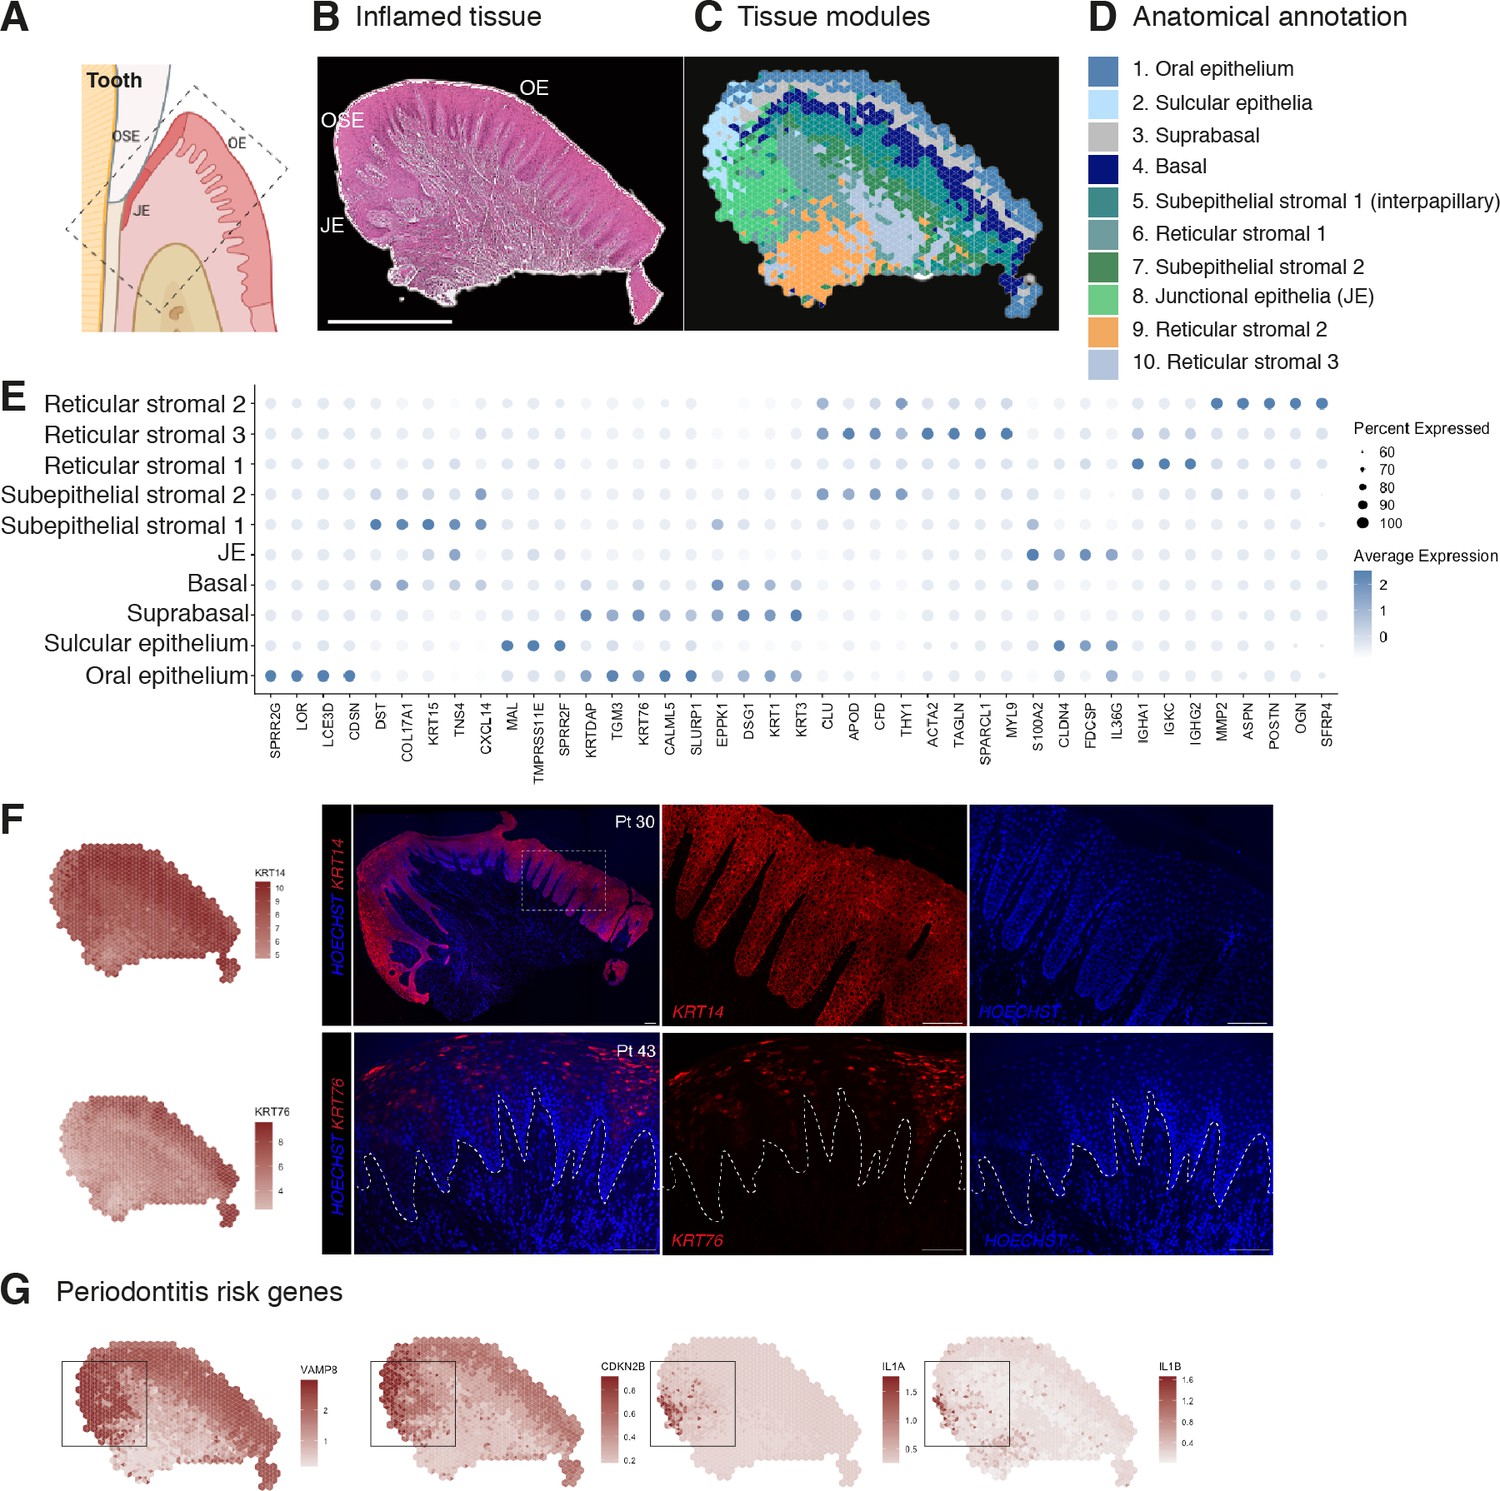
Human oral mucosa structure in oral chronic inflammatory disease.
(A) Schematic illustration of the human oral mucosa showing the different epithelial regions, oral epithelium (OE), oral sulcular epithelium (OSE), and junctional epithelium (JE). Created with Biorender. (B) H&E image of the representative inflamed oral mucosa section demonstrating demarcation between the distinct epithelia, and connective tissue region. (C) Human oral mucosa regions present in the assayed section using BayesSpace. (D) Anatomical annotation of unbiased transcriptional tissue regions. (E) Markers of tissue compartment differentially expressed genes used for tissue annotation showing percent of expressing cells (circle size) and average expression (colour) of gene markers (rows) across compartments (columns). (F) Immunofluorescence image validation stained for KRT14 and KRT76 (representative image, n = 3 samples). Scale bars: 100 µm. (G) Mapping of periodontitis risk genes showing VAMP8, CDKN2B, IL1A, and IL1B restricted expression in the junctional epithelium region.
-
Figure 2—source data 1
Top spatially variable features in disease (referent to Figure 2).
- https://cdn.elifesciences.org/articles/81525/elife-81525-fig2-data1-v2.xlsx
Figure 3
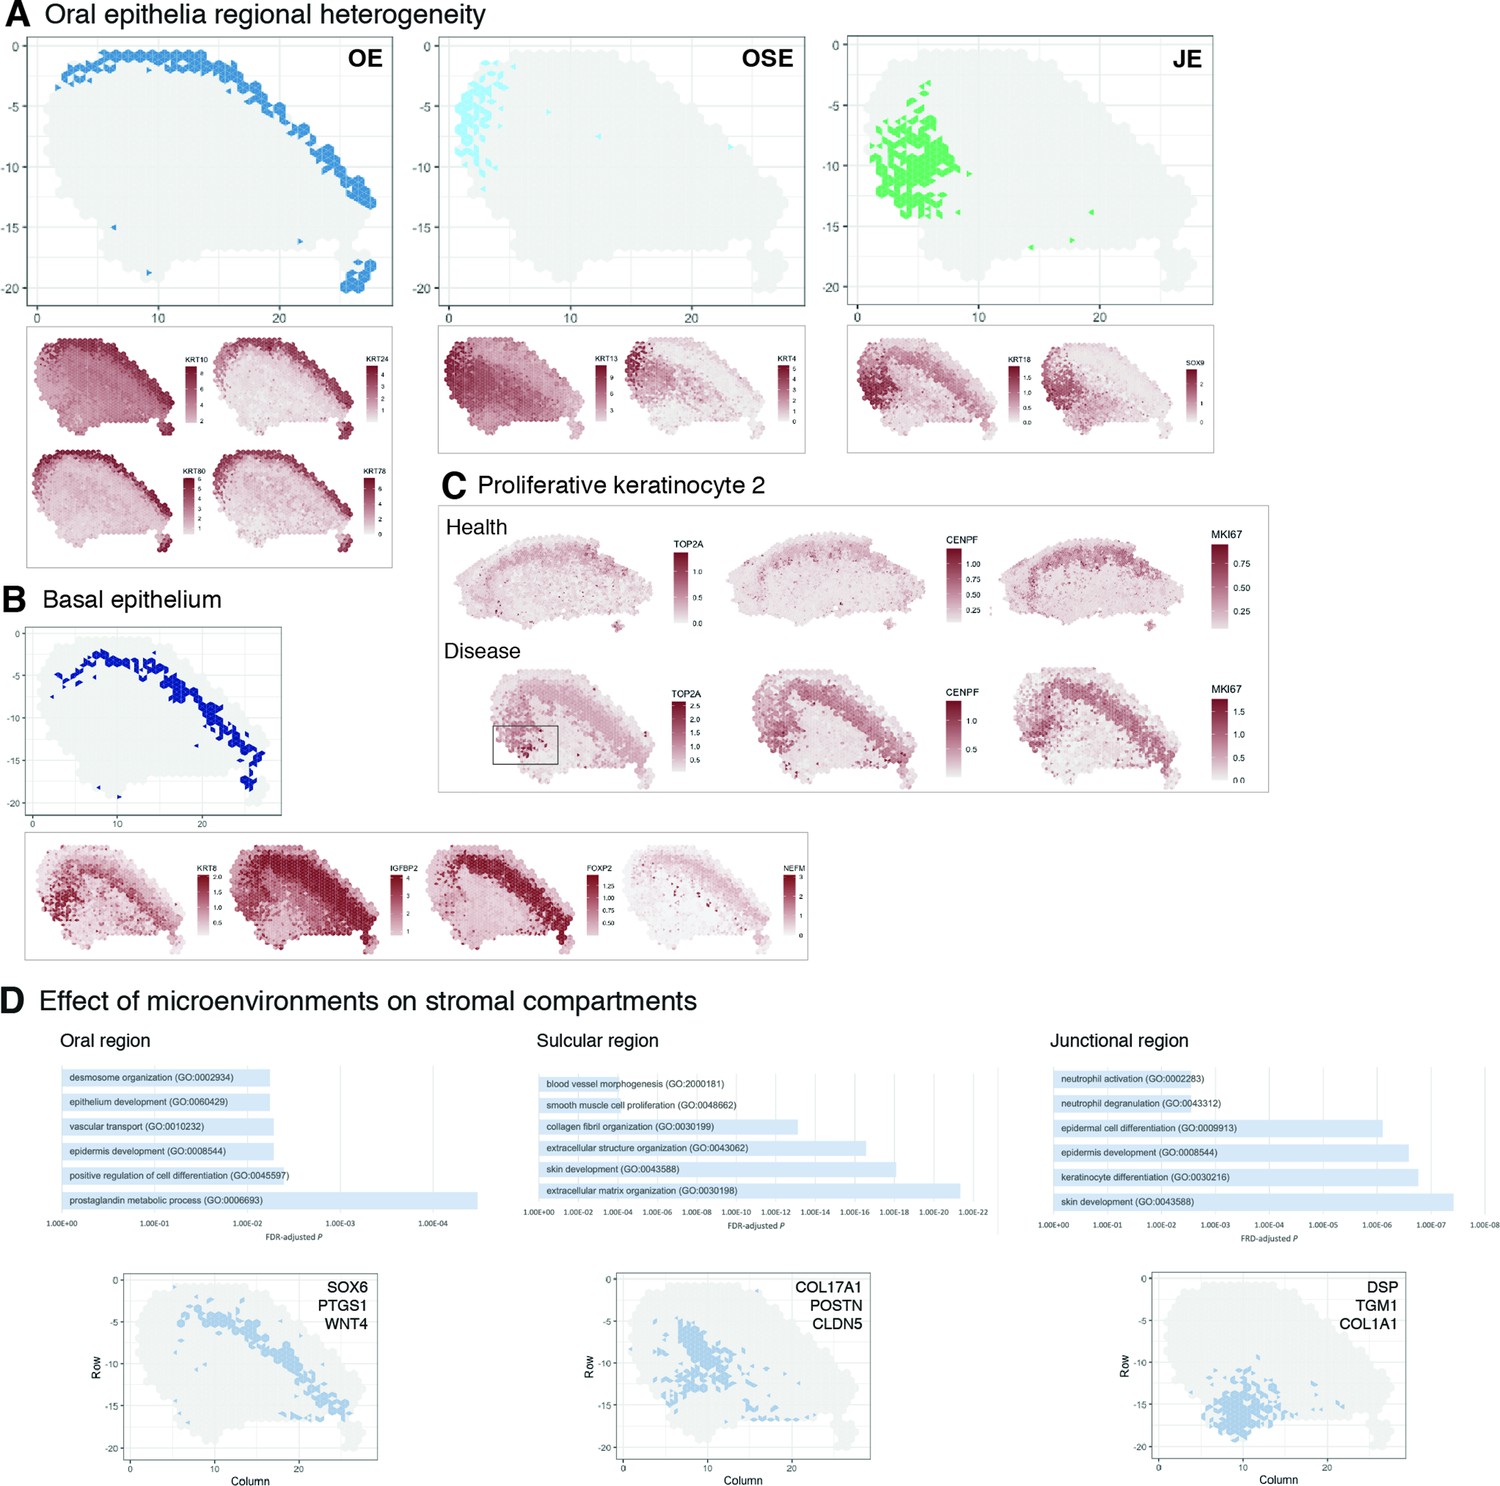
Characterisation of the human oral mucosa epithelium.
(A) Spatial feature plots showing expression of distinct keratins that define each oral epithelia region. (B) Characterisation of the proliferative basal epithelial layer showing top differentially expressed genes, KRT8, IGFBP2, FOXP2, NEFM. (C) Mapping of a rare proliferative epithelial population increased in oral chronic inflammatory disease defined by expression of TOP2A and CENPF. MIKI67 expression showing increased expression in disease (representative images, n = 7). (D) The top GO terms associated with the differentially expressed genes in three distinct stromal regions associated with the three distinct oral epithelia; FDR, false discovery rate.
Figure 4 with 1 supplement
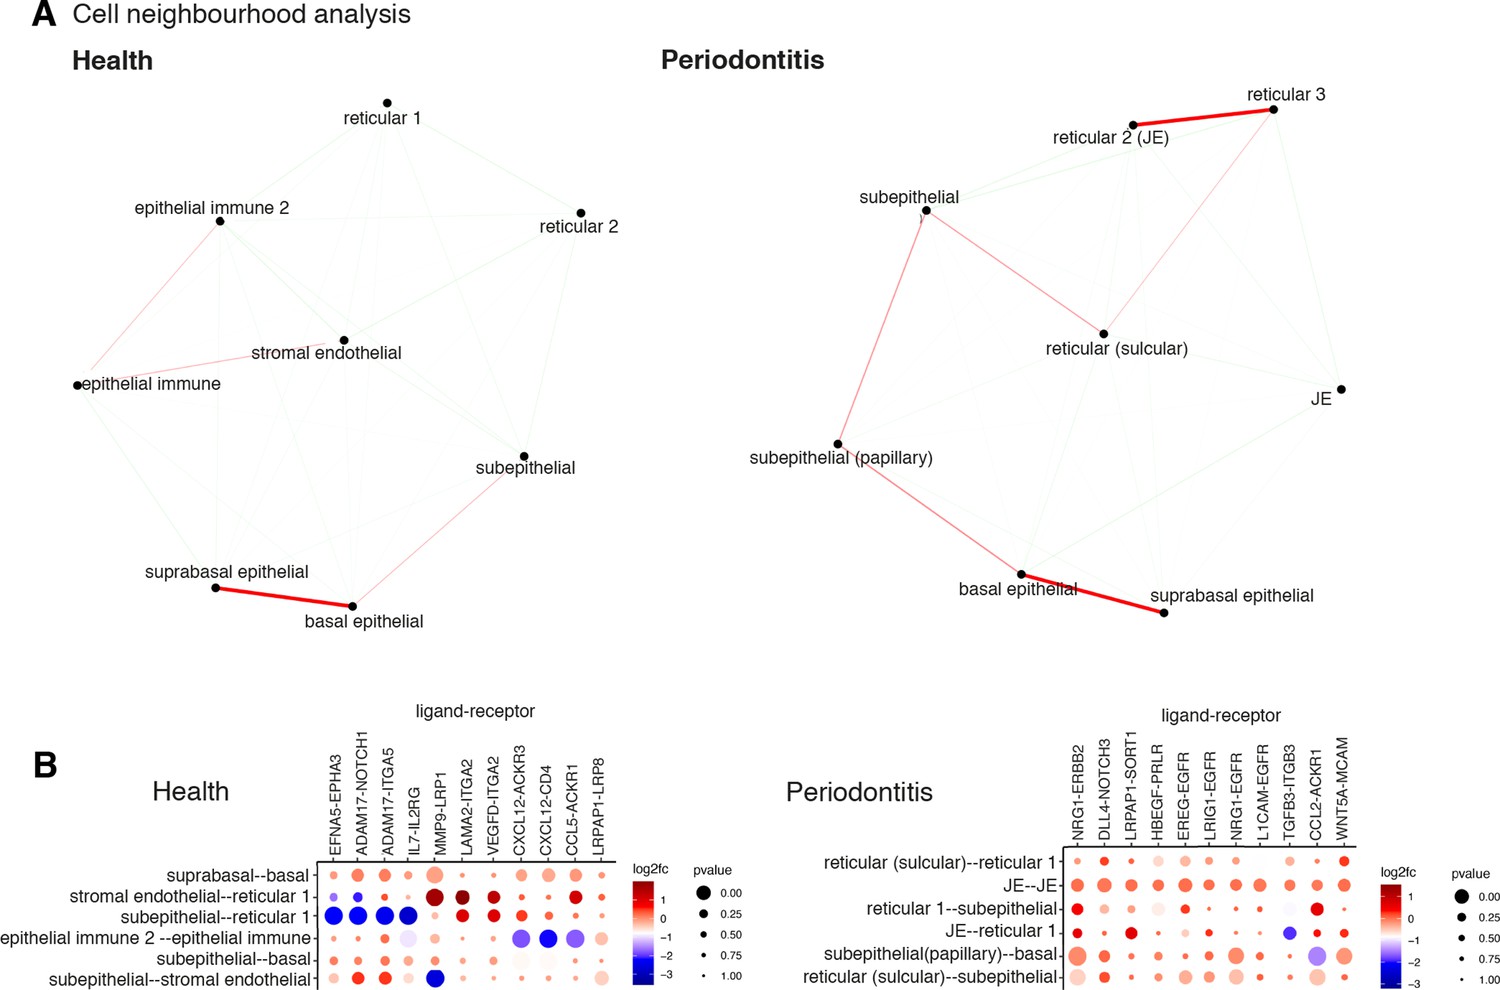
Cell neighbourhood analyses in health and disease.
(A) Network representation of the pairwise interacting regions identified by Giotto Analyzer (Dries et al., 2021), whereby it evaluates the enrichment of the frequency that each pair of regions is proximal to each other. Enriched interactions are depicted in red. We observed strongest interactions within epithelial layers in health, whereas in disease stromal regions interactions emerge. (B) Dotplot for ligand–receptor pairs that exhibit differential cell–cell communication scores due to spatial cell–cell interactions. The size of the dot is correlated with the adjusted p value, and the colour indicates increased (red) or decreased (blue) activity.
Figure 4—figure supplement 1
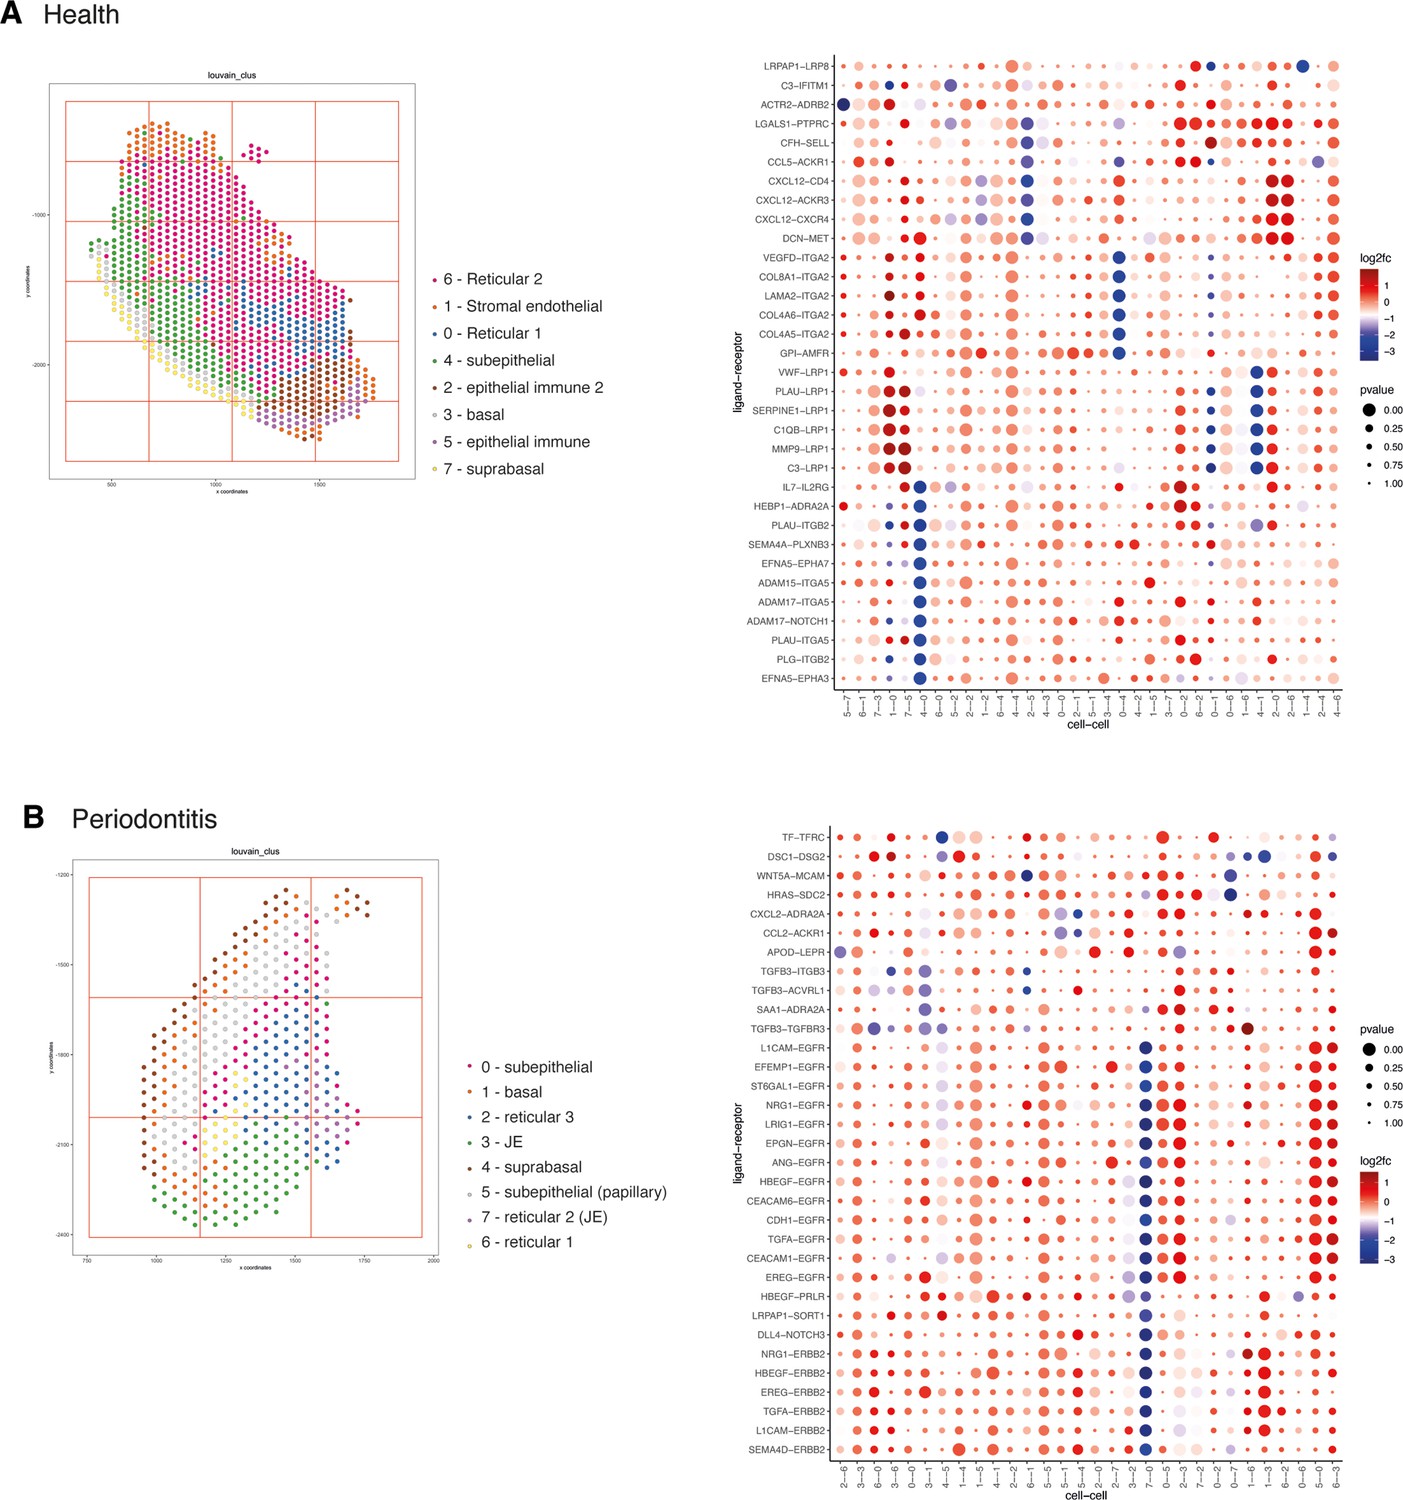
Cell neighbourhood communication analyses.
(A) Spatial plot with annotated tissue regions (left) and dotplot for ligand–receptor pairs that exhibit differential cell–cell communication scores due to spatial cell–cell interactions (left) for patient 36. (B) Spatial plot with annotated tissue regions (left) and dotplot for ligand–receptor pairs that exhibit differential cell–cell communication scores due to spatial cell–cell interactions (left) for patient 30.
Figure 5 with 2 supplements
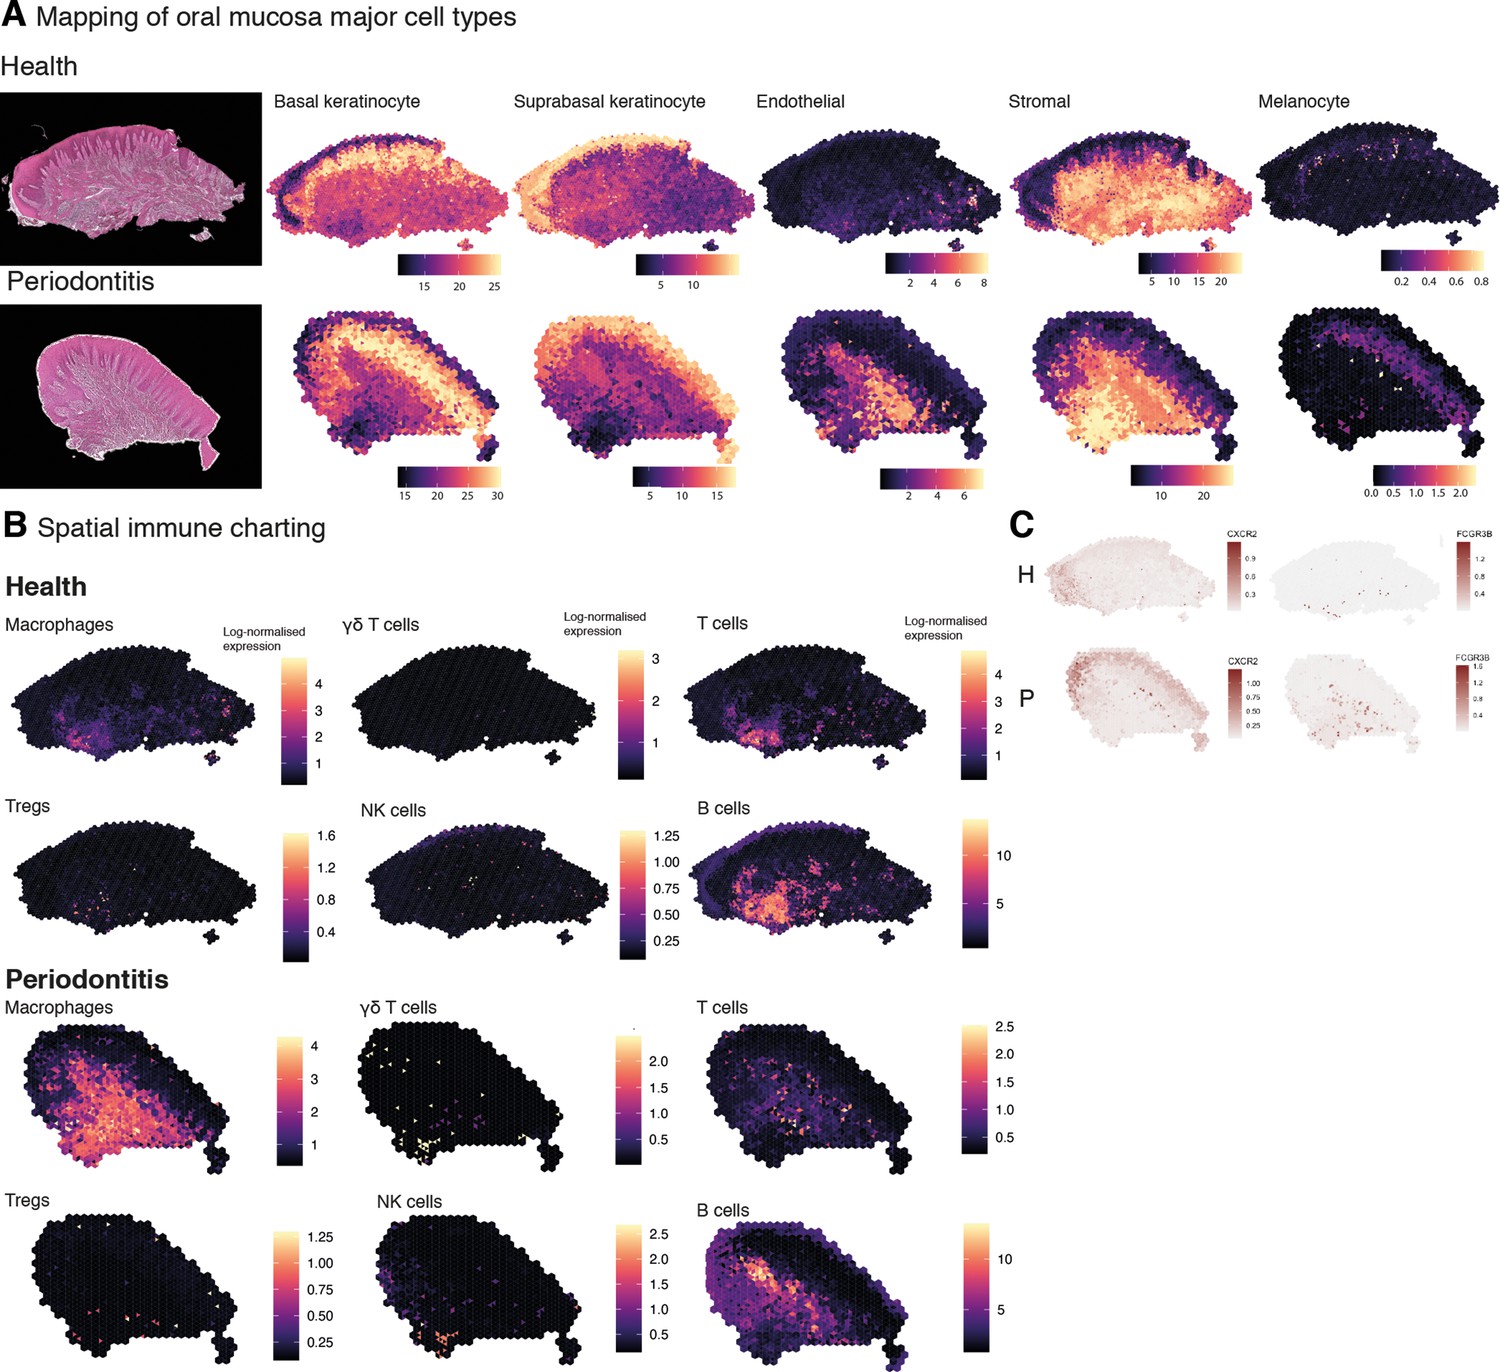
Mapping of oral mucosa major cell types across conditions.
(A) Spatial expression of genes encoding for main human oral mucosa cell types. We selected the top differentially expressed genes for each cell type and predicted their expression at subspot resolution xgboost in BayesSpace. H&E staining shown here for clarity. (B) Spatial mapping of immune cell types showing overall increase in disease. (C) Neutrophils mapping using expression of CXCR2 and FCGR3B.
Figure 5—figure supplement 1
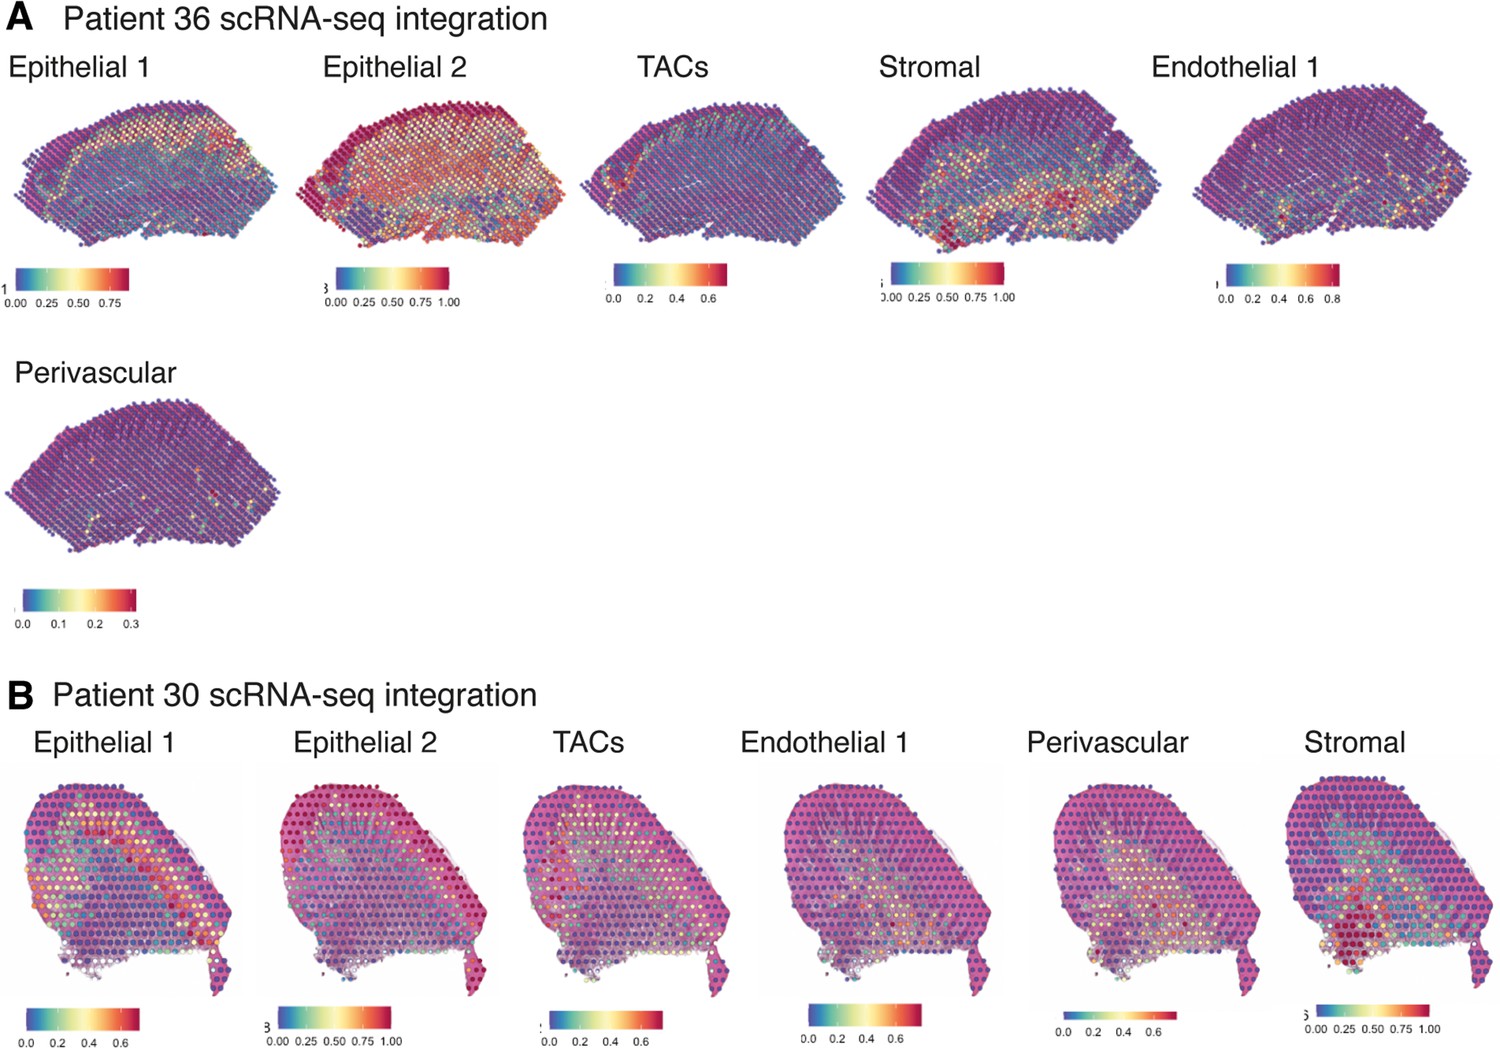
Validation of ST method by comparison of human oral mucosa tissue spots with histological landmarks and integration analyses with single-cell RNA sequencing cell type annotations.
(A) Probabilistic classification for epithelial, stromal, endothelial, and perivascular scRNA-sequencing derived classes for patient 36 (health). (B) Probabilistic classification for epithelial, stromal, endothelial, and perivascular scRNA-sequencing derived classes for patient 30 (disease).
Figure 5—figure supplement 2
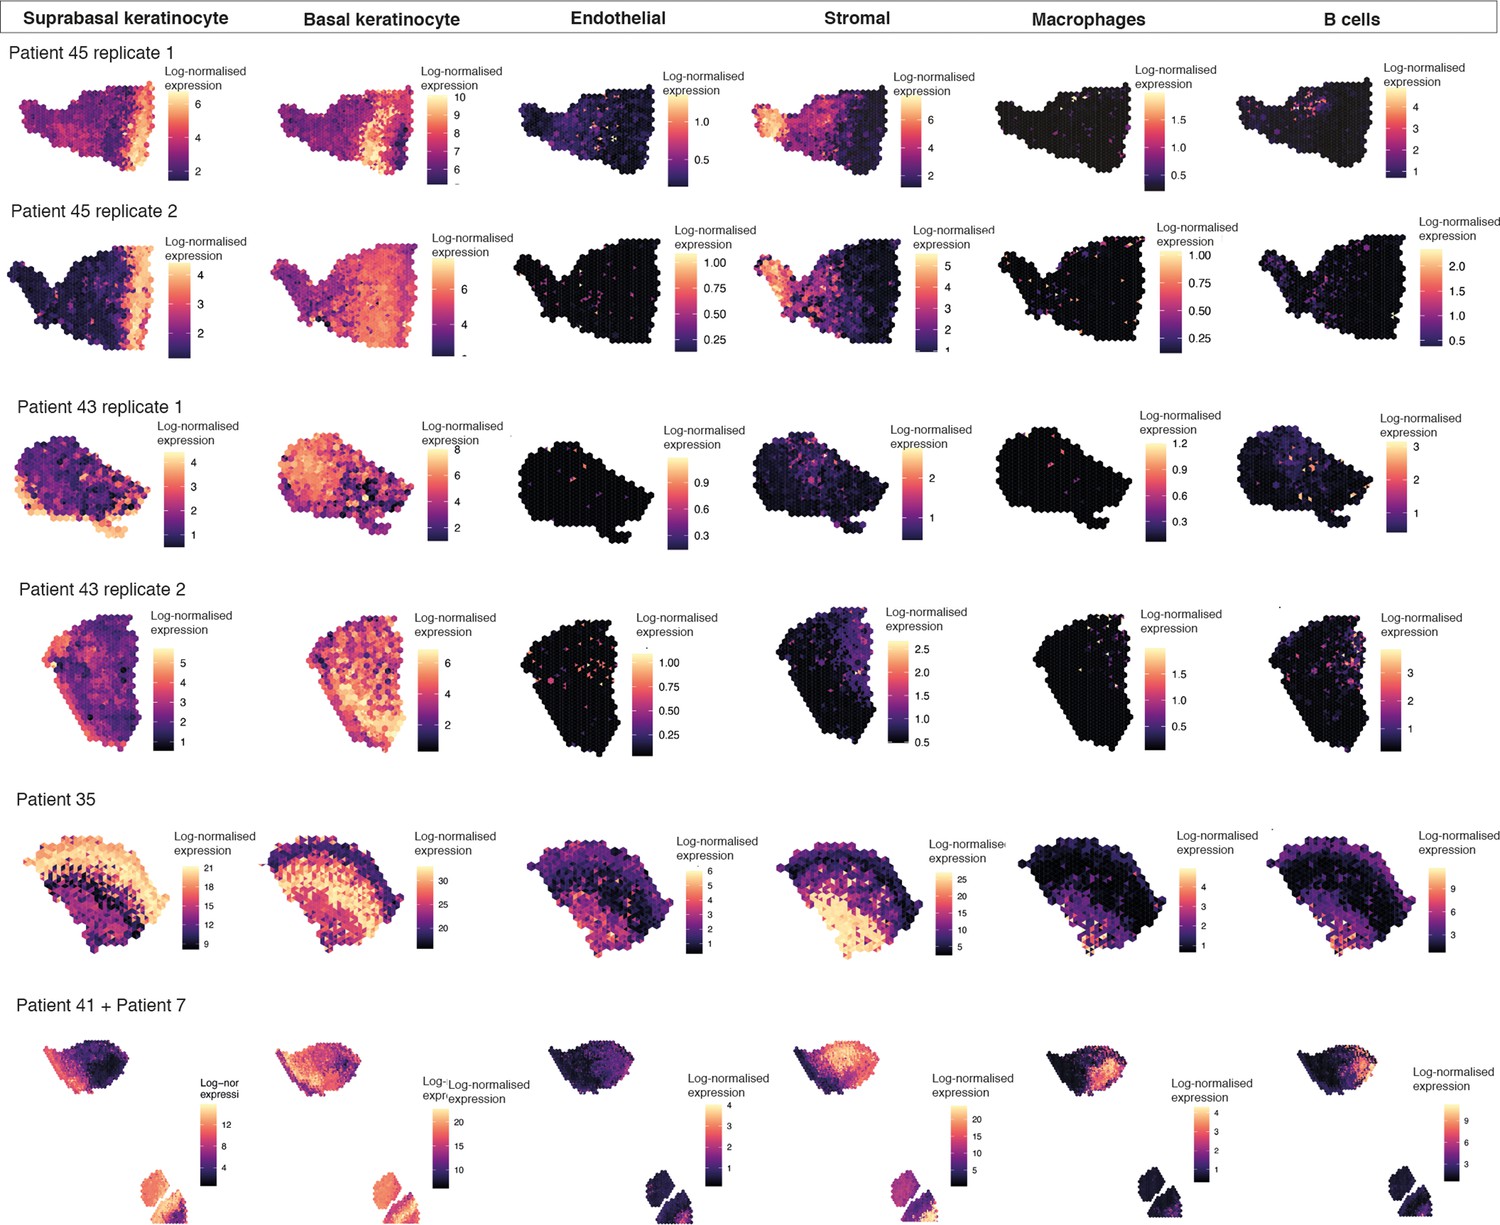
Cell type mapping for all biological/technical replicates used in ST analyses.
Spatial expression of genes encoding for main human oral mucosa cell types. We selected the top differentially expressed genes for each cell type and predicted their expression at subspot resolution xgboost in BayesSpace.
Figure 6 with 1 supplement
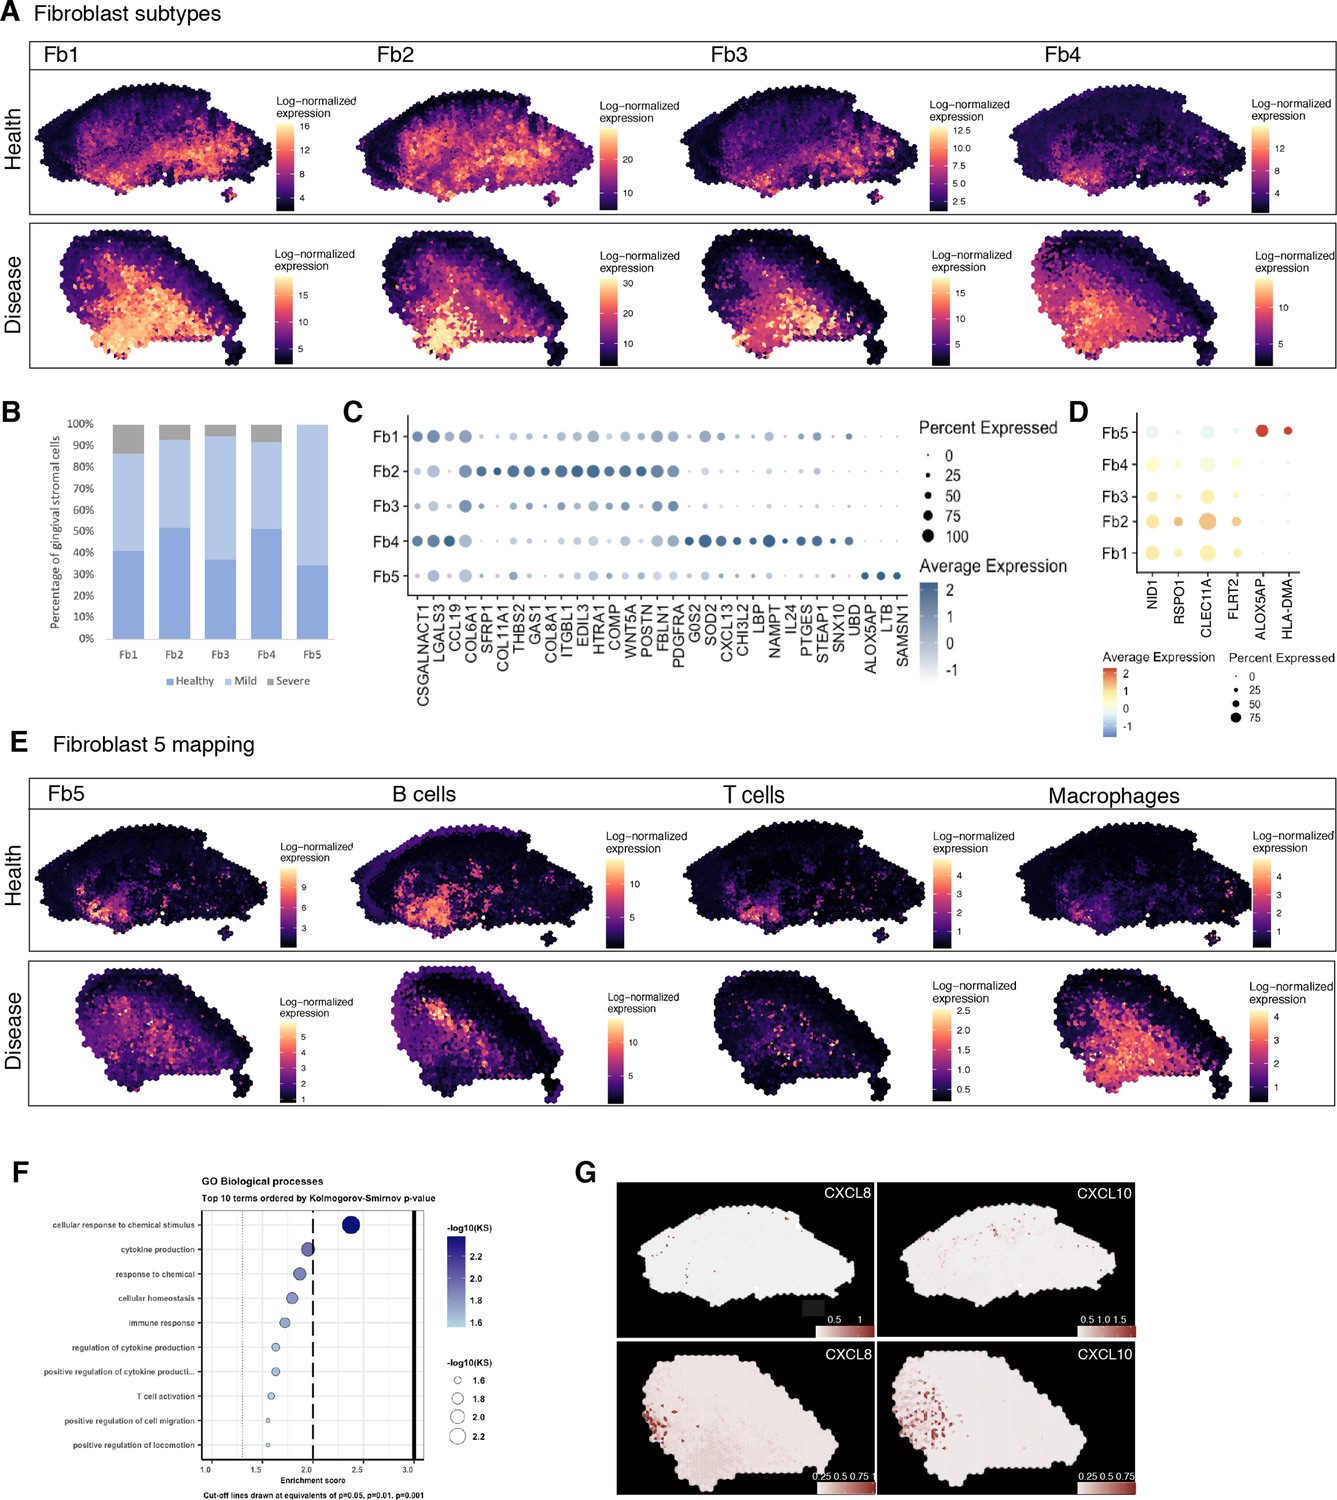
Spatial identification of regional fibroblast subtypes.
(A) Human oral mucosa fibroblast spatial mapping in health and disease. We used the top differentially expressed genes for each cell type and predicted their expression with BayesSpace. (B) Percentage of selected fibroblast abundance changes across conditions shown as a bar plot from single-cell RNA sequencing data. (C) Dotplot showing markers of fibroblast differentially expressed genes showing percent of expressing cells (circle size) and average expression (colour) of gene markers (rows) across cells (columns). (D) Dotplot showing top predicted ligands expressed by fibroblast types predicted to modulate the epithelial basal layer. (E) Fibroblast 5 spatial mapping and co-localisation with immune cell types, B cells, T cells, and macrophages. (F) Gene Ontology biological process term enrichment plot for fibroblast 5. Cluster markers were obtained using the non-parametric two-sided Wilcoxon rank-sum test in Seurat. Gene enrichment analysis was performed with the topGO package in R using the Kolmogorov–Smirnov statistical test. (G) Representative spatial mapping of CXCL8 and CXCL10 in health and disease showing co-localisation in fibroblast 5 region and increase in disease.
Figure 6—figure supplement 1
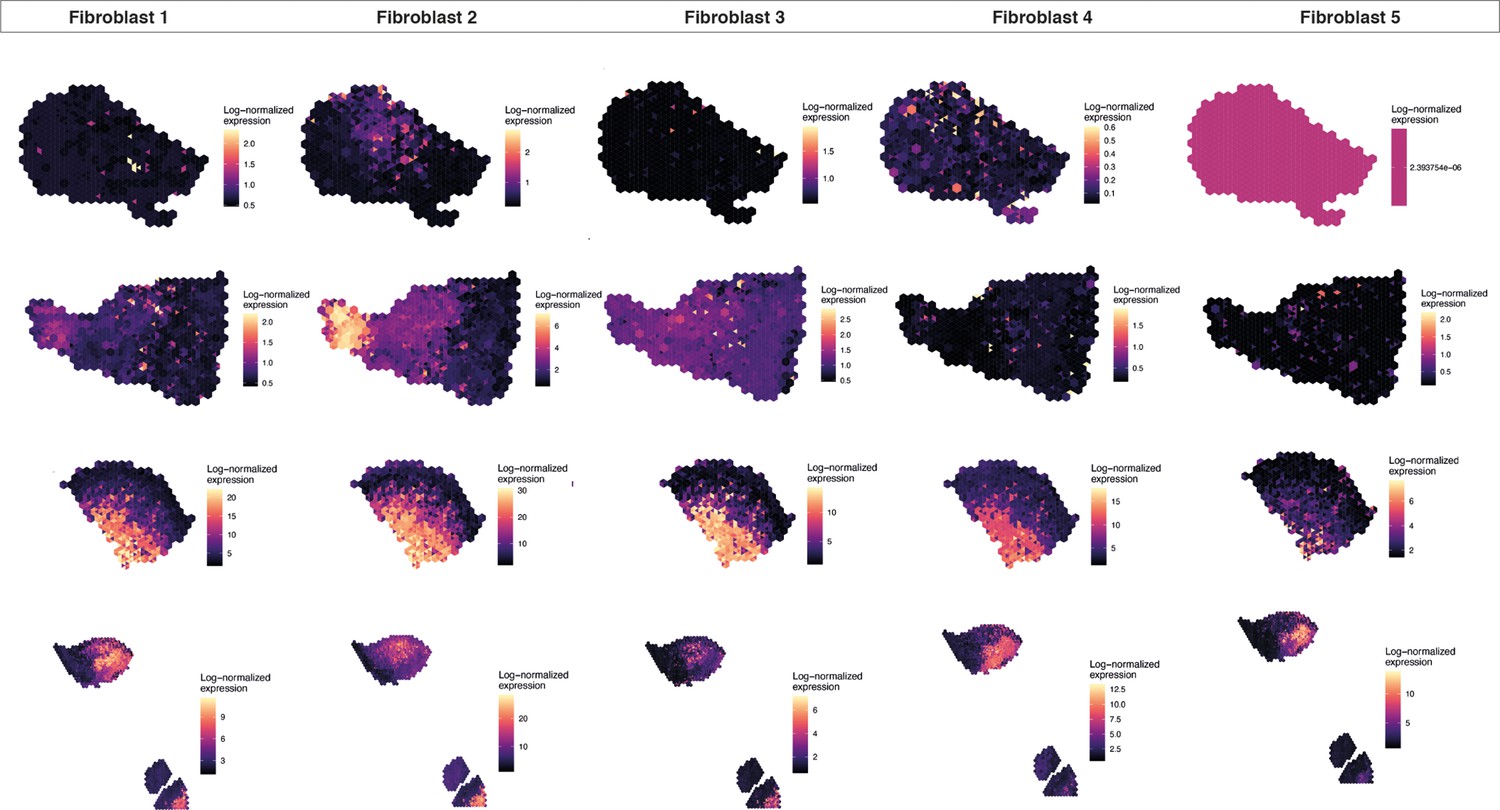
Fibroblast mapping for all biological/technical replicates used in ST analyses.
Human oral mucosa fibroblast spatial mapping. We used the top differentially expressed genes for each cell type and predicted their expression with BayesSpace.
Figure 7
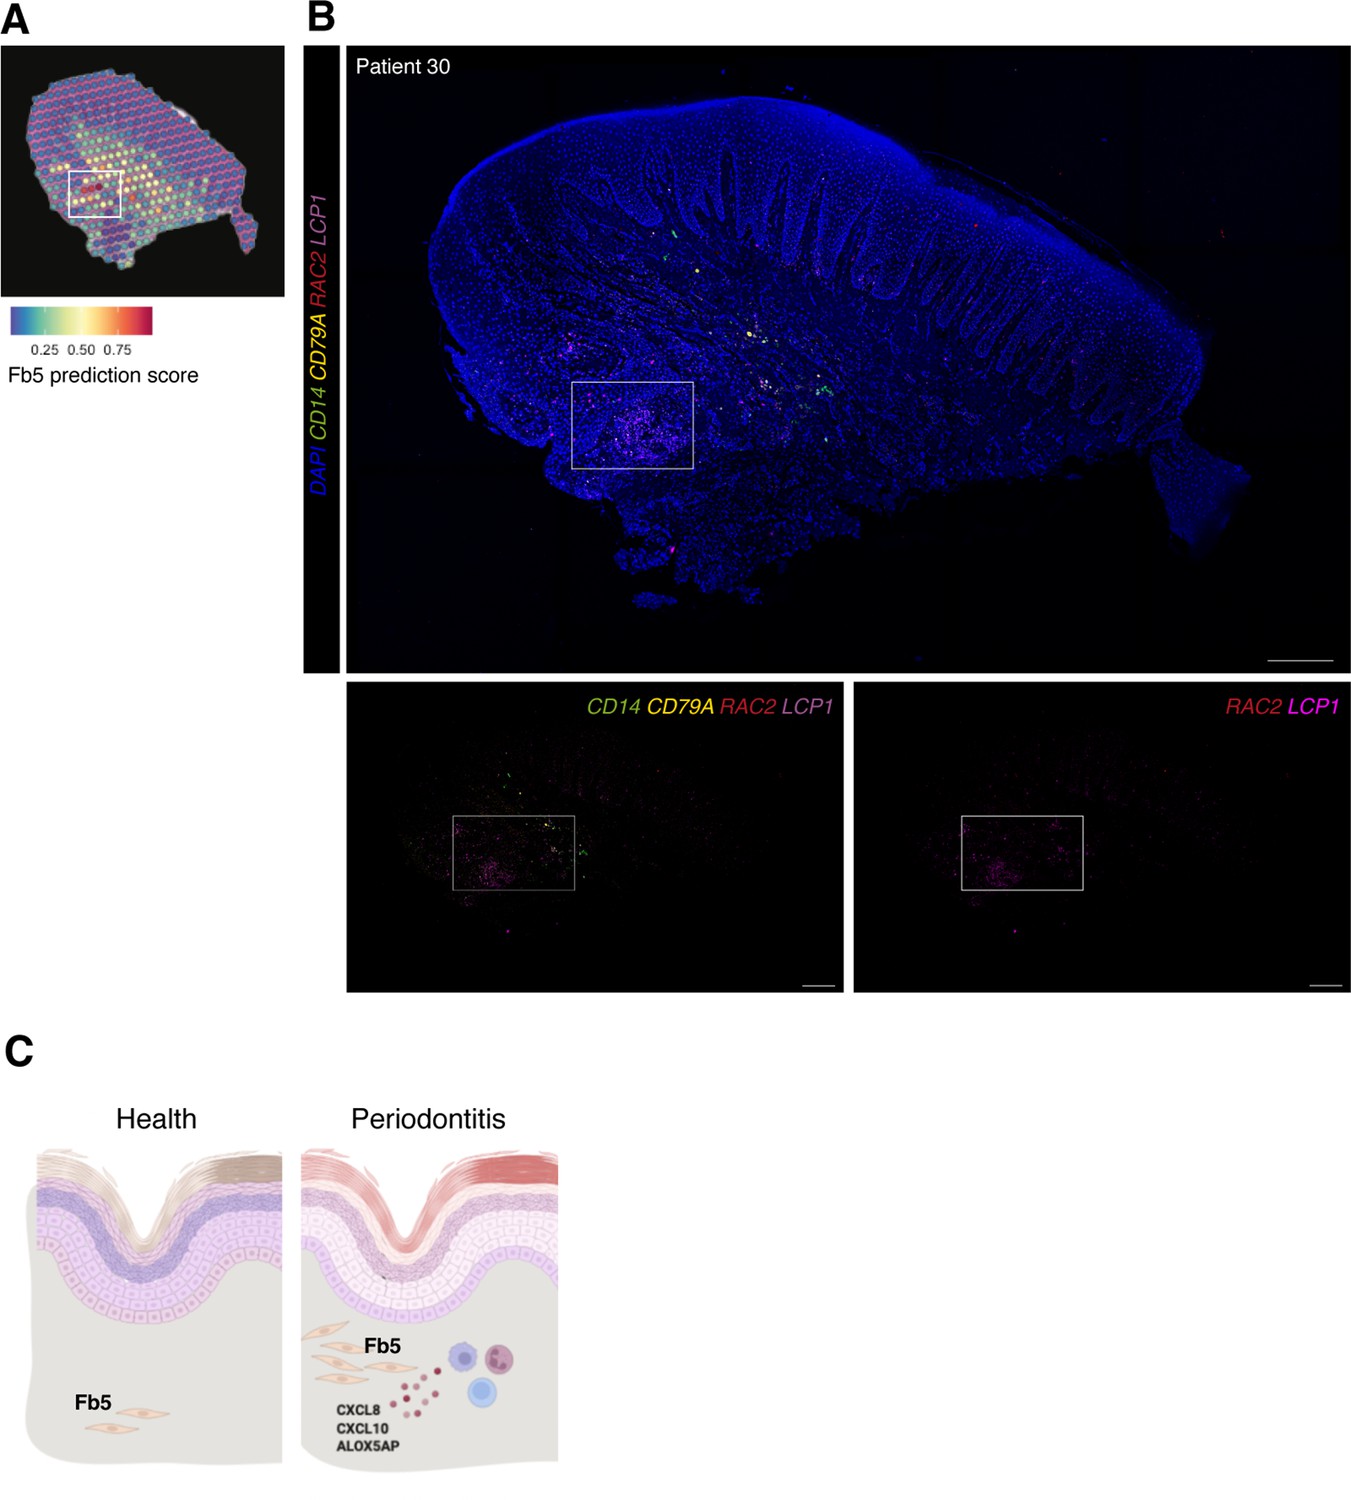
In vivo validation of fibroblast 5 co-localisation with immune cells.
(A) Single-cell RNA sequencing integration with spatial data using ‘anchor’-based integration workflow in Seurat to enable a prediction score for each spot for fibroblast 5. Based on this prediction score, fibroblast 5 is confirmed spatially restricted. (B) Multiplex mRNA in situ hybridisation of a representative section of human oral mucosa using specific probes against RAC2 and LCP1 (fibroblast 5 markers), CD14 (macrophages), and CD79A (B cells) to validate in vivo localisation of fibroblast 5 and immune cell populations. Scale bars: 250 µm. (C) Schematic illustration of our proposed model summarising pathogenic fibroblast population role in human oral chronic disease. Created with Biorender.
Tables
Key resources table
| Reagent type (species) or resource | Designation | Source or reference | Identifiers | Additional information |
|---|---|---|---|---|
| Biological sample (human) | Oral mucosa biopsies | Periodontology department, King’s College London | ||
| Antibody | Anti-KRT14 (mouse monoclonal) | Abcam | Cat# ab7800; RRID:AB_306091 | IHC (1:100) |
| Antibody | Anti-KRT76 (rabbit polyclonal) | Atlas Antibodies | Cat# HPA019656 | IHC (1:100) |
| Commercial assay or kit | Visium Gene Expression Slide Kit, 4 rxns | 10X Genomics | 10X-100187 | |
| Commercial assay or kit | Visium Gene Expression Slide Kit, 4 rxns | 10X Genomics | 10X-100338 | |
| Commercial assay or kit | RNAscope Multiplex Fluorescent V2 | ACD | Cat# 323100 | |
| Commercial assay or kit | RNAscope 4-Plex Ancillary Kit for Multiplex Fluorescent Kit V2 | ACD | Cat# 323120 | |
| Commercial assay or kit | RNAscope Target Probes (Made-to-Order C4 Probes). | ACD | ||
| Software, algorithm | Space Ranger (version 1.0.0) | 10X Genomics | https://support.10xgenomics.com/spatial-gene-expression/software/pipelines/latest/installation | |
| Software, algorithm | Seurat version 4.0 | R Bioconductor | RRID:SCR_007322; https://satijalab.org/seurat/ | |
| Software, algorithm | Enrichr | Chen et al., 2013 | RRID:SCR_001575 | |
| Software, algorithm | NicheNet | GitHub, Browaeys et al., 2020 | https://github.com/saeyslab/nichenetr | |
| Software, algorithm | BayesSpace | R Bioconductor | https://www.bioconductor.org/packages/release/bioc/html/BayesSpace.html | |
| Software, algorithm | Giotto | GitHub, Dries et al., 2021 | https://rubd.github.io/Giotto_site/ | |
| Software, algorithm | topGO | R Bioconductor | https://bioconductor.org/packages/release/bioc/html/topGO.html |
Additional files
Download links
A two-part list of links to download the article, or parts of the article, in various formats.
Downloads (link to download the article as PDF)
Open citations (links to open the citations from this article in various online reference manager services)
Cite this article (links to download the citations from this article in formats compatible with various reference manager tools)
Spatially resolved transcriptomics reveals pro-inflammatory fibroblast involved in lymphocyte recruitment through CXCL8 and CXCL10
eLife 12:e81525.
https://doi.org/10.7554/eLife.81525


